Connections and Con icts of Interest: Investment ... · icts of Interest: Investment Consultants’...
38
Connections and Conflicts of Interest: Investment Consultants’ Recommendations Shikha Jaiswal 1 Abstract Plan sponsors rely on investment consultants’ recommendations for hiring money man- agers to manage their plan funds. Often these investment consultants have their own investment management firms, or have business connections with investment managers, creating a conflict of interest. I find strong evidence that consultants bias hiring deci- sions towards their connected managers: a direct connection to a consultant increases a manager’s odds of being hired by 637%, while an indirect connection increases the odds by 301%. The hiring decisions are less sensitive to past performance and man- agement fee when connected managers are hired. I further find that, post hiring, the funds managed by the connected managers underperform significantly relative to the funds managed by the unconnected managers. JEL classification : G11, G23 Keywords : Investment managers; Plan sponsor; Investment consultant; Manager selection; Connections; Conflicts of interest 1 School of Banking & Finance, UNSW Business School, UNSW Sydney, Email: [email protected].
Transcript of Connections and Con icts of Interest: Investment ... · icts of Interest: Investment Consultants’...

Connections and Conflicts of Interest: Investment
Consultants’ Recommendations
Shikha Jaiswal1
Abstract
Plan sponsors rely on investment consultants’ recommendations for hiring money man-agers to manage their plan funds. Often these investment consultants have their owninvestment management firms, or have business connections with investment managers,creating a conflict of interest. I find strong evidence that consultants bias hiring deci-sions towards their connected managers: a direct connection to a consultant increasesa manager’s odds of being hired by 637%, while an indirect connection increases theodds by 301%. The hiring decisions are less sensitive to past performance and man-agement fee when connected managers are hired. I further find that, post hiring, thefunds managed by the connected managers underperform significantly relative to thefunds managed by the unconnected managers.
JEL classification: G11, G23
Keywords : Investment managers; Plan sponsor; Investment consultant; Manager selection;Connections; Conflicts of interest
1School of Banking & Finance, UNSW Business School, UNSW Sydney, Email:[email protected].

1. Introduction
In the recent past, there has been a significant increase in the number of plan sponsors and
total assets under these plans. These plans include pension plans, endowments, foundations,
etc. At the end of 2015, the assets held by US pension plans alone totaled $24 trillion.1 Past
studies have suggested that these plans perform poorly, and various reasons have been offered
to explain the underperformance of these funds (Lakonishok, Shleifer, Thaler, and Vishny
[1991], Lakonishok, Shleifer, Vishny, Hart, and Perry [1992], Stewart, Neumann, Knittel,
and Heisler [2009]). Lakonishok, Shleifer, Thaler, and Vishny [1991] find evidence of window
dressing by pension fund managers. Lakonishok, Shleifer, Vishny, Hart, and Perry [1992] find
underperformance of pension plans and attribute it to agency issues. Stewart, Neumann,
Knittel, and Heisler [2009] find underperformance in the products to which sponsors allocate
money. Prior researchers have focused on manager skill and agency issues to explain plan
underperformance. To the best of my knowledge, prior researchers have not studied agency
issues in manager selection which might affect plan performance. In this paper, I study
whether investment consultants, hired by plan sponsors for impartial advice on selection
of managers for these plans, bias hiring decisions to favor their connected managers and
whether this leads to underperformance in these plans.2
There has been limited research on the manager selection process. Parwada and Faff
[2005] find that managers are selected from the top-quartile 5-year performance group and
that the fees charged by managers negatively affect hiring probability. Consistent with these
results, Goyal and Wahal [2008] also find that plan sponsors chase returns. Managers are
hired after good performance, but they do not perform well post hiring. The authors also
study termination decisions and do not find significant difference in returns for the new
1Investment Company Institute 2016 factbook2I use the term ”manager” to denote investment management firm in this paper.
1

manager compared to the fired manager, had the plans stayed with the fired manager. My
paper adds a new dimension to this area of research: bias in the selection process of managers
due to connections.
The process of investment begins with the formation of an investment committee that
has the responsibility to invest the plan money efficiently and profitably. The committee
decides on the objectives of the plan and the investment strategy to be followed and hires
investment managers to manage the fund in accordance with the objectives of the plan. Most
committees rely on the expertise of investment consultants not only in forming the objectives
and investment strategies of the plan, but also in hiring investment managers to pursue
those strategies. Around 83% of public plans and 66% of corporate plans rely on consultants
when hiring plan managers.3 Plan sponsors employ consultants for their expertise in the
investment industry as well as to avoid being blamed in case the plan underperforms in the
future. Goyal and Wahal [2008] find that headline risk sensitive sponsors are more likely to
use consultants.
These investment consultants may be standalone consultants or may have other lines of
business such as money management, brokerage and so on. According to the SEC [2005]
report, many consultants serve on both sides of the business. For example, an investment
consultant who serves a plan sponsor may also have a brokerage business which deals with
money managers. Many investment consultants have affiliated broker dealers and hence earn
brokerage commissions from money managers. These affiliations and business connections
with money managers create a conflict of interest for consultants. Further, the SEC found
that consultants rarely disclose their affiliations to their client plan sponsors. Although
consultants have a fiduciary responsibility towards their clients and are supposed to work
in their clients’ best interests, their business connections and affiliations may bias their
recommendations to the clients. Instead of recommending the best manager, the consultant
3Based on iiSearches data for period 1995-2014.
2

may have a strong incentive to recommend managers with whom they have a strong business
connection.
This paper focuses on consultant recommendations if the consultants themselves or their
parent companies have other lines of business that can create a potential conflict of interest. I
study manager hiring decisions to investigate whether these decisions were biased in favor of
managers who had business connections with the focal consultant. I also study the impact
of hiring connected managers on fund performance and disentangle two potential reasons
why consultants may bias hiring decisions: (a) having better information about connected
managers or (b) favoring connected managers to keep their ongoing business relationships.
With the multitude of services provided by consultant companies to managers, there
could be many sources of business ties between a consultant and a manger. I test my hy-
pothesis with two broad connection types: direct connection and indirect connection.4 I
consider a consultant and a manager to be directly connected if they have the same parent
company. I consider two types of indirect connections: sub-advisor connection and broker
connection.5 If a consultant has an affiliated manager who is hired by an outside manager as
a sub-advisor, then the consultant and the outside manager have a sub-advisor connection.
If a consultant has an affiliated brokerage firm that receives brokerage commissions from
an outside manager, then the consultant and the outside manager have broker connection.
We do not observe the actual recommendations by the consultants to their client plan spon-
sors, but we do observe the final hiring decisions. Assuming that the hiring decisions are
strongly influenced by consultant recommendations, I use hiring decisions as a proxy for con-
sultant recommendations to study whether connections between consultants and managers
bias consultant recommendations.
I use the random utility model (by McFadden [1974]) to estimate the influence of business
4Detailed explanation of these connection measures is provided in the next section under Business Con-nection Measures heading.
5Figure 1 explains the three connection measures graphically.
3

connections on hiring decisions when a plan sponsor chooses one manager from multiple can-
didate choices. I find that business connections strongly positively influence hiring decisions.
Further, the probability of being hired is either insensitive or less sensitive to the managers’
past performance and to the fee charged by these managers when the managers connected
to consultants are hired, relative to the probability of being hired when the unconnected
managers are hired. To mitigate the agency issues, the SEC implemented Chief Compliance
Officer rule in Oct. 2004 that requires advisors to designate a Chief Compliance Officer and
to adopt and maintain policies and procedures that assure compliance to Advisers Act.6
The Advisers Act requires advisors to disclose all material facts to their clients and provide
disinterested advice. Hence, I check whether the SECs Chief Compliance Officer rule was
able to deter the consultants from favoring their connected managers. I find that business
connections have a strong influence on hiring decisions even during the period 2005-2014.
Consultants continue to favor connected managers despite SEC’s efforts.
After establishing the influence of connections on hiring decisions, I test the performance
of these connected hires relative to the unconnected hires. Connected hires may be beneficial
to the plan if the hiring was based on private information about managers’ skills, while they
are detrimental to the plan if the hiring was based on reciprocity. If the consultants bias
hiring decisions to favor their connected managers because they have private information
about managers’ skills, then the connected hires should outperform the unconnected hires.
However, if the influence of connections on hiring decisions is based on reciprocity, then
the connected hires should underperform relative to the unconnected hires. I find signifi-
cant underperformance of connected hirings relative to unconnected hirings, suggesting that
consultants compromise on plan performance to favor their connected managers.
Jenkinson, Jones, and Martinez [2015] show that consultant recommendations are mostly
6Rule 206(4)-7 under the Advisers Act: ”Investment adviser means any person who, for compensation,engages in the business of advising others, either directly or through publications or writings, as to the valueof securities or as to the advisability of investing in, purchasing, or selling securities, or who, for compensationand as part of a regular business, issues or promulgates analyses or reports concerning securities.”
4

driven by soft factors and do attract flows for managers, but they fail to find outperformance
of the recommended managers compared to the others. My paper provides an explanation as
to why the consultant-recommended managers may not outperform the non-recommended
managers. I provide evidence that consultant recommendations are biased towards favoring
their connected managers. I show that relying solely on investment consultants may not be
beneficial since the investment consultants may not have the best interest of investors in
mind while making their recommendations for managers.
Since most of the plan sponsors rely on investment consultants, my paper also provides
a possible alternative explanation for the poor performance of plans documented by prior
studies such as Lakonishok, Shleifer, Vishny, Hart, and Perry [1992] and Stewart, Neumann,
Knittel, and Heisler [2009].
My paper also adds to the literature on connections. Prior researchers studying connec-
tions find different results for the influence of connections on decisions in different contexts.
Many studies find that connections affect decisions. Reuter [2006] studies underwriter-fund
ties and finds evidence of preferential IPO allocations. Cohen and Schmidt [2009] find ev-
idence of overweighting 401(k) client firms stocks. Kuhnen [2009] studies sub-advisor and
director appointments and finds evidence of preferential hiring based on the intensity of past
interactions. Cohen, Frazzini, and Malloy [2008] study social connections and find evidence
of information transfer. I show that connections strongly positively influence hiring deci-
sions and also reduce the sensitivity of hiring probability to important attributes like past
performance and fee.
The remainder of this paper is organized as follows: Section 2 explains the connection
measures and methodology used to test the bias in hiring decisions. Section 3 details the
data sources used and the sample construction. Section 4 discusses the results for bias in
hiring decisions and the impact of connected hiring on post hiring plan performance. Section
5 provides robustness tests and section 6 concludes the paper.
5

2. Connection Measures and Methodology
2.1. Business Connection Measures
Consultants may be connected to investment managers either directly as affiliates or
indirectly through their other lines of business, such as brokerage. Although there could
be many sources of business ties between a consultant and a manager, I use three types of
connections to test my hypotheses: direct connection, sub-advisor connection and broker
connection.7 Sub-advisor and broker connections, are indirect connections.
An investment consultant may also have a money management firm as its subsidiary or
it may be a part of a bigger organization that also has a money management business. For
example, Graystone Consulting is a part of Morgan Stanley. Thus, Graystone Consulting
and Morgan Stanley Investment Management are connected. I call this type of connection
when the consultant and manager belong to the same organization a direct connection. I
hypothesize that an investment consultant would recommend a directly connected manager
more favorably than other managers, and hence the directly connected manager would have
a higher chance of being hired. For example, when Graystone Consulting was working as a
consultant to the Boyce Thompson Institute for their plant research plan, it hired Morgan
Stanley Investment Management for their Private Equity mandate.
Sub-advisory contracts are profitable for investment managers as they increase the man-
agers’ total asset under management and the fee earned, and hence investment managers
compete for sub-advisory contracts. An investment manager who receives a sub-advisory
contract from another manager might want to return the favor to keep the ongoing relation-
ship. Similar to the direct connection, the second type of connection between a consultant
and a manager comes into effect when the consultant or its parent company also have a
money management firm. I call this money management firm the consultant’s affiliate man-
7Figure 1 explains the three measures graphically.
6

ager. When an investment consultant IC ’s affiliated money management firm AM is a
sub-advisor to funds managed by an outside money management firm OM, I call the con-
sultant IC and outside manager OM to be indirectly sub-advisor connected. A consultant
connected to an investment manager through a sub-advisory contract may try to return
the favor to the manager by helping the manager get hired for a mandate. Consultant IC
is sub-advisor connected to a manager OM if IC ’s affiliate manager AM is sub-advisor to
OM ’s mutual funds within six months of the mandate search date.
When the consultant or its parent company has a brokerage firm and that brokerage firm
earns a commission from an investment manager, the consultant has an incentive to help
the manager win a mandate to keep the brokerage relationship ongoing. I recognize this
as a second type of indirect connection between the consultant and the manager and name
this connection as broker connected. Consultant IC is broker connected to a manager OM
if IC ’s affiliated broker firm AB is one of the highest paid brokers for OM ’s mutual funds
within a six month period of the mandate search date.
2.2. Manager Hiring Decisions
Plan sponsors have investment committees chaired by a Chief Investment Officer who is
responsible for investing the plan funds. The investment committee drafts an investment
policy for the plan that describes the objectives of the plan sponsor, the asset classes in
which it plans to invest and the amount of money to be invested in each asset category.
Once the plan policy is created, the plan sponsor places a request for proposals (RFPs) for
hiring investment managers. These events of hiring investment managers are usually called
searches. The investment committee shortlists the managers based on their past performance
and other attributes. They interview the shortlisted managers and make the final decision
on the manger to be hired for the plan. Most of the plan sponsors follow the advice of
investment consultants not only in drafting the investment policy but also in the manager
7

hiring process.
Manager hiring decisions involve choosing a manger from a pool of candidate managers
based on their performance and other attributes. Hence, I use the random utility model in
McFadden [1974] to model the hiring decisions. Specifically, if the plan sponsor i has Mi
managers to choose from, the utility that the plan sponsor obtains from choosing manager
j is given by
y∗ij = α + x′
ijβ + εij (1)
where xij are the attributes that affect sponsors’ utility. yi is the manager choice that
maximizes the sponsors’ utility. The probability of choosing manager j is given by
P (yi = j | x) = pij =exp(x
′ijβ)
M∑q=0
exp(x′ijβ)
(2)
To estimate the choice model, I match each hiring decision with all the managers the plan
sponsor could have hired. For each hiring decision, the list of potential choices includes all
the managers that offer a product in the same asset style as the mandate and have at least
15 months of returns during the previous 3 years.8 Independent variables include manager
related variables and consultant manager connection variables.
3. Data
For testing my hypotheses, I require information on (a) mandates, (b) the consultant
involved in the hiring process, (c) the set of potential candidate managers and their per-
8I require at least 15 non-missing monthly returns for pre-hiring 3-year alpha estimation.
8

formance and other attributes, (d) measures of connection between consultant involved and
candidate managers, and (e) the manager hired for the mandate and their post hiring per-
formance. Since there is no single database that tracks all this information, I use data from
multiple sources. Some of these sources are standard while some require manual data col-
lection. I describe these different data sources, collection process, and sample construction
below. In this paper I focus on the US active equity mandates.
3.1. Manager Hiring and Consultant data
I obtain mandate and hiring information from iiSearches database for mandates between
1995 to 2014. iiSearches tracks the RFPs for mandates and maintains a database that
contains most of the mandates since 1995 by different types of plan sponsors such as pension
plans, endowments etc. This database contains information about the plan sponsor, fund
size, asset category for the mandate, size of the mandate, consultant used in the hiring
process, and the manager hired. It contains the name, address, phone number, and website
for both the consultants involved as well as the managers hired. I use this information to
match across different data sources. This database has 28,166 completed hiring decisions
between 1995 to 2014, out of which 24,641 hiring decisions involved consultants. Of these,
5,808 are for actively managed US equity mandates that involved an investment consultant
in the manager search process.
3.2. Connections data
Identifying connections between consultants and managers requires information on the
organizational structures of their firms. Data on organization structure comes from multiple
sources. For each consultant and manager in the iiSearches database, I hand collected
organization structures from Factset and augmented it with other sources: Form ADV from
9

the SEC and broker reports from the Financial Industry Regulatory Authority(FINRA).
Investment consultants and managers are required to file form ADV with the SEC. This
form contains information on the firm’s direct and indirect owners as well as the filer’s SEC
number, address, phone number, and website. The latest form ADVs filed by consultants and
managers are available on the SEC’s Investment Adviser Public Disclosure (IAPD) website.
I downloaded these form ADVs for all the consultants and managers from the IAPD and
parsed them to collect their ownership information and also their address, phone number,
and website. FINRA provides broker reports that also contain the direct and indirect owners
of the broker and also the broker’s address, phone number, and website. The information in
these reports comes from the filings by brokers and their registration process with FINRA.
I downloaded these broker reports from FINRA’s BrokerCheck website and parsed them to
collect brokers’ ownership information along with their address, phone number, and website.
I combine the ownership and identifying information (name, address, phone number, and
website) from the three sources to create final organizational structure data. I use this
organizational structure data to identify directly connected consultant manager pairs. A
consultant is directly connected to a manager if both belong to the same organization. I
combine the organizational structure data with sub-advisory and brokerage data, described
below, to identify sub-advisor and broker connections between consultants and managers. I
use name, address, phone number, and website to match this ownership data with the data
from other sources.
Mutual funds are required to file form NSAR with the SEC on semi-annual basis. These
form NSARs, along with other fund related information, also contain information on sub-
advisors for the fund and list the ten brokers who received the highest brokerage commissions
from the fund during the filing period. The SEC’s electronic disclosure system, EDGAR,
provides access to electronic filings by firms and funds. I downloaded form NSARs for all of
the funds from EDGAR and parsed them to collect sub-advisor and brokerage data. These
10

forms contain fund advisor information, the sub-advisor’s name and SEC number, names and
IRS numbers for the ten highest paid brokers for the fund, and the brokerage commission
paid to each. I combine this data with the organization structure data created above to
identify sub-advisor and broker connections.
All the ownership data sources that I used - Factset, Form ADV, and FINRA’s broker
reports - provide only the latest ownership information. Hence, my organizational structure
data does not account for mergers and acquisitions. Using the latest organizational structure
may lead to misclassification of connections in cases where a consultant and a manager may
appear to be connected now but were probably not connected at the time of hiring or vice
versa. Such mis-classifications of connection may only lead to weaker effects of connection
in the data. Hence, the actual impact of connections on the hiring decisions may be higher
than my data indicates.
3.3. Manager data
I obtain manager related information from eVestment. The eVestment database provides
firm and product level information for investment managers and is widely used by investment
consultants and plan sponsors for screening managers. For each product offered by a man-
ager, the eVestment database provides firm and product inception date, monthly composite
returns, monthly asset under management, etc. It contains data on 23,405 products offered
by 2,958 investment management firms. This database does not provide information on the
historical fee for the products, but it does provide the latest pro forma fee for each product
for different levels of investment. Jenkinson, Jones, and Martinez [2015] and Busse, Goyal,
and Wahal [2010] find very little time series variation in fee using the Informa Investment
Solutions database, which provides historical fee. This suggests that the latest product fee
can be used as a proxy for the historical fee. These data are self-reported by managers.
The database also contains manager address, phone number, and website. I use manager
11

name, address, phone number, and website to match across different data sources. Actual
returns earned by plans are not available, as they are proprietary. Hence, as a proxy for the
post hiring returns earned by the managers for the mandate they were hired to manage, I
use managers’ composite returns for the product in the same asset class, size capitalization,
and style as the mandate. These composite returns should be very close to the actual plan
returns earned by the manager for the mandate and would differ only when the managers
were restricted to invest in certain stocks by mandates.
3.4. Sample Construction
For each mandate, we only observe the final hiring decision, and not the plan sponsors’
consideration set. To the best of my knowledge, there is no database that tracks the manager
hiring process and captures the list of considered or recommended managers. Hence, to model
the hiring decision, I assume that all the managers that have a product in the same asset style
as the mandate during the hiring period are in the consideration set for the plan sponsor.9
Hence, in the final data for estimating choice model for hiring decisions, each hiring decision
is matched to a list of potential choices, that includes all the managers who offer a product
in the same asset style as the mandate and have at least 15 months of returns during the
previous 3 years. The hired dummy is the dependent variable for the hiring decision model.
It is set to 1 for the manager that was hired and 0 for all the other potential choices.
Some mandates state a very broad asset category, such as US equity, while some are more
specific, such as US small cap equity. When the asset class is broader than the manager
product classes, I use the sum of assets under management and equal weighted average
of returns and fee.10 For example, if the mandate is US equity and manager returns are
available for US equity small cap, US equity mid cap, and US equity large cap products, I
9By same asset style, I mean same asset class, capitalization, and style.10I obtain similar results if I use value weighting instead of equal weighting.
12

use the sum of assets under management and equal weighted average of returns and fees.
Organizational structure data constructed from Factset, form ADV, and FINRA’s bro-
ker reports helps identify direct connections. I combine the organizational structure data
with sub-advisory and brokerage data to identify sub-advisor and broker connections. A
consultant manager pair is directly connected if they belong to the same organization. The
direct connection dummy is set to 1 for the managers directly connected to the consultant
involved in the hiring process and 0 for others. The sub-advisor connection dummy is set
to 1 if a consultant’s affiliate manager served as a sub-advisor to the candidate manager’s
funds within six months before or after the mandate date, or else it is set to 0. The bro-
ker connection dummy is set to 1 if the consultant’s affiliate brokerage firm was one of the
highest paid brokers for the candidate manager’s funds within six months before or after the
mandate date, or else it is set to 0. For the main tests, I use two connection dummies: direct
connection and indirect connection. Indirect connection combines sub-advisor connection
and broker connection. It equals 1 when either the sub-advisor connection or the broker
connection is 1, or else it equals 0. Table 1 provides a description of all the variables used.
3.5. Descriptive Statistics
Table 2 provides summary statistics for the data used. Panel A provides the summary
of completed hiring decisions present in the iiSearches database. It contains 28,166 hiring
decisions completed between 1995 to 2014. 87% of these hirings involved consultants. 7,684
hiring decisions are for US equity mandates. Panel B provides the summary statistics for plan
sponsors. Overall, 68% of the plan sponsors took advice from investment consultants when
selecting the investment management firm for their mandates. 83% public plans while 66%
corporate plans involved investment consultants. Panel C provides the summary statistics for
US equity active management mandates that involved investment consultants in the manager
selection process. 5,808 mandates are for domestic equity active management. The average
13

fund size for decisions involving consultants is $3.17 billion while the median size is $297
million. Panel D provides summary statistics for the main data used for most of the tests.
This is the final data obtained after combining mandates data with manager and connections
data. Out of 5,808 US equity mandates that involved consultants, I was able to find the hired
manager in the eVestment database for 4,103 mandates. These 4,103 mandates account for
79% of the total mandate asset in the sample and hence they should be representative of the
population. Hired managers tend to have more assets under management and have higher
pre-hiring alpha compared to the ones not hired. On average, each hiring decision has 201
managers to choose from. For 15.5% of the mandates, a manager connected to the consultant
was hired, with 3% being directly connected and 12% being indirectly connected. In 4% of
the decisions, a sub-advisor connected manger was hired, while in 8% of the decisions the
manager had broker connection with the consultant. Before SEC’s Chief Compliance Officer
rule (i.e., in the period 1995 to 2004), 18% of the hired managers were connected to the
consultant. After the Chief Compliance Officer rule, the connected hiring rate did reduce to
13.4%.
4. Results
4.1. Manager Hiring Decision
I model the hiring decision by estimating a conditional logit model with a hired dummy as
the dependent variable and manager attributes and consultant-manager connection measures
as independent variables. I test five different model specifications.11 Refer to Table 3 for the
results.
Model 1 is the base model for estimating the probability of a manager being hired.
11In all the specifications, standard errors are corrected for clustering by plan sponsor
14

Independent variables include manager attributes: last three year four-factor alpha, fee, one
year return standard deviation, log of firm asset under management (AUM), percentage of
AUM in the mandate asset category, and firm age.12 In the later specifications, I add my
variables of interest (connection variables). As we would expect, the probability of being
hired is positively related to past performance and negatively related to manager fee. High
volatility of past returns also reduces the probability of being hired. Larger firms have a
higher chance of winning the mandate, and having a greater fraction of the AUM in the
mandate asset category also increases the probability of being hired. Also, younger firms
have higher chance of being hired.
In model 2, I add a connection dummy which equals 1 if the consultant and candidate
manager are connected either directly or indirectly, or else it is 0. This connection dummy is
strongly positively related to the probability of being hired, suggesting that being connected
to the consultant significantly increases the chances of being hired. Having a connection to
the consultant increases a managers’ odds of being hired by 375%.
In model 3, I test if the sensitivity of hiring decision to past performance and fee differs for
the mandates where a connected manager is hired. I add interactions between the connection
dummy and alpha, and between connection dummy and fee. The interaction term between
the connection dummy and alpha is negative and significant, suggesting that the hiring
decisions are less sensitive to managers’ past performance when a manager is connected to
the consultant.
In model 4, I split the connection dummy into two dummies, a direct connection dummy
and an indirect connection dummy, to separately identify the effects of direct and indirect
consultant-manager connections on hiring decisions. As we observe, both the connection
dummies are positive and significant. A direct (indirect) connection to the consultant in-
12I thank Ken French for providing the factors on his website. Similar results using Fama French 3 factorrisk adjustment.
15

creases a manager’s odds of being hired by 637% (301%).
In model 5, I add interaction terms between connection dummies (both direct and in-
direct) and alpha and fee. Results suggest that the hiring decision is less sensitive to past
performance when a manager is either directly or indirectly connected to the consultant.
We further observe that the sensitivity is lower for direct connections compared to indirect
connections.
To investigate the differences in the sensitivity of hiring decisions to past performance
and fee when a connected manager was hired compared to when an unconnected manager
was hired, I test the base model 1 separately on the decisions when connected managers were
hired. The results are provided in Table 4. The first column provides the sensitivities for
decisions when unconnected managers were hired. As we observed earlier, the probability of
being hired is strongly positively related to alpha and negatively related to fee. The second
column provides results for decisions when directly connected managers were hired. Here,
we observe that both alpha and fee do not have any significant impact on the probability
of being hired, suggesting that consultants do not consider past performance and fee when
recommending sponsors to hire directly connected managers. The third column provides
the sensitivities for decisions where indirectly connected managers were hired. The hiring
probability is less sensitive to alpha and fee compared to the unconnected hiring decisions.
Hence, when indirectly connected managers are hired, fee and past performance are not
given as much importance as they are when hiring unconnected managers.
Hence, we observe that connections strongly positively influence hiring decisions and that
when connected managers are hired, hiring decisions are either insensitive or less sensitive
to past performance and fee.
16

4.2. Post Hiring Performance
After establishing the bias in hiring decisions by consultants to favor connected managers,
I test for the performance of these connected managers post-hiring. Connected hires may be
beneficial for the plan if they are information driven. If the consultants bias hiring decisions
in favor of their connected managers because they have private information about their skills,
the connected hires should outperform the unconnected hires. However, if the influence of
connections on hiring decisions is due to reciprocity, hiring connected managers may be
detrimental to the plan because connected hires may underperform relative to unconnected
hires.
To compare the performance of connected hires to unconnected hires, I regress post hir-
ing four-factor alpha on connection dummies and other independent variables.13 The results
are provided in Table 5.14 Model 1 is the base model. Post-hiring performance is positively
related to managers’ AUM, suggesting economies of scale. It is also positively related to
manager expertise in the mandate asset class, measured by the percentage of manager AUM
in the mandate asset class. In Model 2, I add the connection dummy (which includes both
direct and indirect connections) to test the impact of connection on post hiring performance.
The connection dummy is significantly negatively related to performance, suggesting con-
nected hires underperform relative to unconnected hires. In Model 3, I split the connection
dummy into two separate dummies for direct and indirect connections. We observe that
post-hiring, indirectly connected managers underperform relative to unconnected managers.
Indirectly connected hires earn 0.57% lower alpha compared to unconnected hires. However,
hiring directly connected managers does not lead to underperformance, possibly because the
consultants hired their direct connections only when they were at least as good as the uncon-
13Post-hiring alpha is estimated using monthly returns over three years period after hiring.14All the model specifications control for year fixed effects and standard errors are corrected for clustering
in observations when a manager is hired for a madate in the same asset class. I get the same results whenstandard errors are corrected for clustering in observations for the same manager.
17

nected options. They may do so to avoid raising questions of favoring their own managers
in case of future underperformance by the connected hires and thus risking their credibility.
Consultants’ direct connections can be easily traced and there is also a good chance that the
sponsor might be aware of these connections. The underperformance of indirectly connected
hires suggest that consultants bias their decisions to favor connected managers to the keep
business relationships ongoing.
4.3. The Effect of Chief Compliance Rule
The SEC implemented Chief Compliance Officer rule in Oct 2004 that requires advisors
to designate a Chief Compliance Officer and to adopt and maintain policies and procedures
that assure compliance to the Advisers Act. The Advisers Act requires advisors to disclose
all material facts to their clients and provide disinterested advice. I verify if biases in hiring
decisions still exist after 2004. I redo the tests in Tables 3, 4, and 5 for the sample period
2005 to 2014. The results are provided in Tables 6, 7, and 8. The results are similar to what I
obtained for the full sample in Tables 3, 4, and 5. Again, the results suggest that connections
strongly positively influence hiring decisions and that when a connected manager is hired,
the hiring decision is either insensitive or less sensitive to past performance and fee. Also,
indirectly connected hires significantly underperform relative to unconnected hires, with the
four-factor alpha being lower by 0.83%. Hence, the manager hiring decisions are still biased
and detrimental for plans even after the Chief Compliance Officer rule.
4.4. Hiring Decision and Post Hiring Performance: By Indirect Connection
Types
A direct connection between a consultant and a manager is easier to identify compared
to an indirect connection, and hence it likely deters consultants from recommending directly
18

connected managers whom they do not expect to perform well in the future. In this sub-
section, I separate the indirect connections into sub-advisor and broker connections to see
how these different types of connections impact hiring decisions. The results are presented
in Table 9. In Model 2, all three connection dummies are positive and strongly significant.
While a direct or sub-advisor connection to the consultant increases a manager’s odds of be-
ing hired by 629%, having a broker connection to the consultant increases the odds by 182%.
Direct and sub-advisor connections have a much stronger effect than broker connections.
In model 3, I add the interaction terms between connection dummies (direct, sub-advisor
and broker) and alpha and fee. Results suggest that for all the three connection types the
hiring decision is less sensitive to past performance when a manager has business connections
with the consultant involved, the sensitivity being lowest for direct connections. Also, for
broker connected managers, the hiring decision is insensitive to the fee.
Table 10 provides the results for post-hiring performance. I regress post hiring four-factor
alpha on connection dummies and other independent variables. Connected hires underper-
form significantly and most of this underperformance comes from the sub-advisor connected
hires. Broker connected hires also underperform, but the performance difference relative
to unconnected hires is insignificant. Sub-advisor connected hires earn 0.84% lower alpha
compared to the unconnected hires.
5. Robustness Test
For my main test, to estimate the bias in hiring decisions caused by consultant-manager
connections, I allow plan sponsors to choose from all the managers that have a product in
the mandate asset category and have at least 15 months of non-missing returns during the
3 year period prior to the hire. This results in a large number of potential choices for the
sponsor, sometimes as many as 2000 managers. This likely includes some managers who
19

were not considered for the position, thereby increasing the total number of observations
and reducing standard errors. As a robustness test, I restrict the number of managers that
the plan sponsor chooses from, to 30. I create propensity scores for all the managers in the
original dataset based on the base model 1 in table 3. For each hiring decision, I pick up
to 30 managers with a propensity score closest to the hired manager. With this new data,
I redo the tests in Tables 3 and 4. The results are provided in Tables 11 and 12. As we
can see, these results are very similar to Tables 3 and 4. A connection to the consultant
considerably increases a manager’s probability of being hired. Connections also reduce the
sensitivity of hiring decision to past performance and fee.
6. Conclusion
Plan sponsors have the responsibility to invest plan funds efficiently. They draft fund
objectives and investment strategy and hire investment managers to manage these funds.
Most of the plans rely on investment consultants’ expertise while selecting the manager to
manage plan funds. Although these investment consultants are expected to work in the best
interest of the plan, helping to devise an efficient investment strategy, and recommending
the best manager to execute that strategy, the consultants may have other hidden interests.
Often, investment consultants have their own investment management firms, or have business
connections with other investment managers, creating a conflict of interest. Such consultants
who are connected to managers have a strong incentive to bias the hiring decision to favor
their related manager. I study the hiring decisions from 1995-2014 and find strong positive
influence of connections on hiring decisions. A direct connection to the consultant increases
the odds of a manager being hired by more than 600%. Also, when connected managers
are hired, the hiring decisions are either insensitive or less sensitive to past performance
and fee. Post-hiring, I also find that indirectly connected hires underperform compared
20

to unconnected hires, with a 0.83% lower four-factor alpha annually, suggesting that these
biases in hiring decisions are reciprocity driven and detrimental to the plan. Even after SEC’s
Chief Compliance Officer ruling in 2004, although the percentage of connected hires reduced
from 18% to 13%, I still find strong results that consultants favor connected managers,
compromising fund performance and suggesting potential conflicts of interest for consultants.
21

References
J. A. Busse, A. Goyal, and S. Wahal. Performance and persistence in institutional investment
management. The Journal of Finance, 65(2):765–790, 2010.
L. Cohen and B. Schmidt. Attracting flows by attracting big clients. The Journal of Finance,
64(5):2125–2151, 2009. ISSN 0022-1082.
L. Cohen, A. Frazzini, and C. Malloy. The small world of investing: Board connections and
mutual fund returns. Journal of Political Economy, 116(5):951–979, 2008. ISSN 0022-3808.
G. F. Davis and E. H. Kim. Business ties and proxy voting by mutual funds. Journal of
Financial Economics, 85(2):552–570, 2007. ISSN 0304-405X.
A. Goyal and S. Wahal. The selection and termination of investment management firms by
plan sponsors. The Journal of Finance, 63(4):1805–1847, 2008.
T. Jenkinson, H. Jones, and J. V. Martinez. Picking winners? investment consultants’
recommendations of fund managers. The Journal of Finance, 2015.
C. M. Kuhnen. Business networks, corporate governance, and contracting in the mutual
fund industry. The Journal of Finance, 64(5):2185–2220, 2009.
J. Lakonishok, A. Shleifer, R. Thaler, and R. Vishny. Window dressing by pension fund
managers. American Economic Review, 81:227–231, 1991.
J. Lakonishok, A. Shleifer, R. W. Vishny, O. Hart, and G. L. Perry. The structure and
performance of the money management industry. Brookings Papers on Economic Activity.
Microeconomics, 1992:339–391, 1992. ISSN 1057-8641.
D. McFadden. Conditional logit analysis of qualitative choice behavior. Frontiers in Econo-
metrics, pages 105–142, 1974.
22

J. T. Parwada and R. W. Faff. Pension plan investment management mandates: An empirical
analysis of manager selection. Journal of Financial Services Research, 27(1):77–98, 2005.
ISSN 0920-8550, 1573-0735.
J. Reuter. Are ipo allocations for sale? evidence from mutual funds. The Journal of Finance,
61(5):2289–2324, 2006. ISSN 1540-6261.
U. S. SEC. Staff report concerning examinations of select pension consultants. 2005.
S. D. Stewart, J. J. Neumann, C. R. Knittel, and J. Heisler. Absence of value: An analysis of
investment allocation decisions by institutional plan sponsors. Financial Analysts Journal,
65(6):34–51, 2009. ISSN 0015-198X.
23

Figure 1: Connection MeasuresThis figure explains the three measures of Connection used: Direct Connection, Sub-advisor Connection
and Broker Connection. Investment consultant IC is Directly Connected to it’s affiliated money managementfirm AM. Investment consultant IC is Sub-advisor Connected to an outside money management firm OM ifIC ’s affiliated money management firm AM is a sub-advisor to funds managed OM. Investment consultantIC is Broker Connected to an outside money management firm OM if IC ’s affiliated brokerage firm ABearns brokerage commission from the funds managed OM.
24
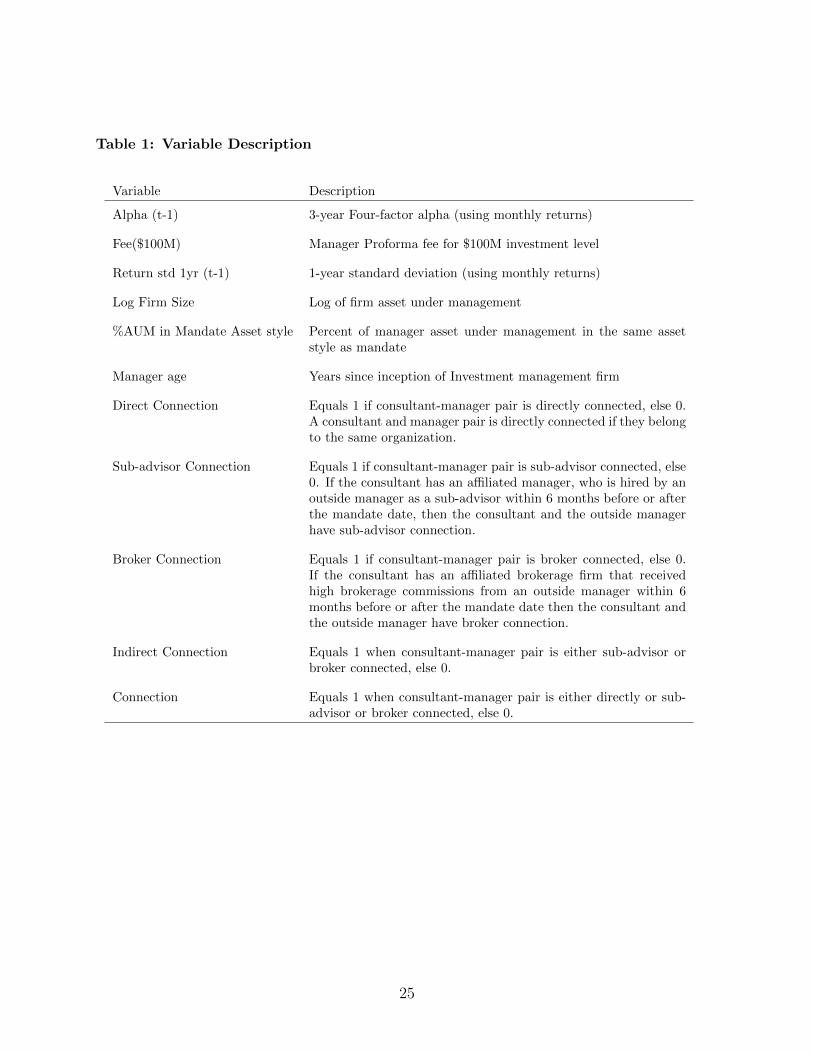
Table 1: Variable Description
Variable Description
Alpha (t-1) 3-year Four-factor alpha (using monthly returns)
Fee($100M) Manager Proforma fee for $100M investment level
Return std 1yr (t-1) 1-year standard deviation (using monthly returns)
Log Firm Size Log of firm asset under management
%AUM in Mandate Asset style Percent of manager asset under management in the same assetstyle as mandate
Manager age Years since inception of Investment management firm
Direct Connection Equals 1 if consultant-manager pair is directly connected, else 0.A consultant and manager pair is directly connected if they belongto the same organization.
Sub-advisor Connection Equals 1 if consultant-manager pair is sub-advisor connected, else0. If the consultant has an affiliated manager, who is hired by anoutside manager as a sub-advisor within 6 months before or afterthe mandate date, then the consultant and the outside managerhave sub-advisor connection.
Broker Connection Equals 1 if consultant-manager pair is broker connected, else 0.If the consultant has an affiliated brokerage firm that receivedhigh brokerage commissions from an outside manager within 6months before or after the mandate date then the consultant andthe outside manager have broker connection.
Indirect Connection Equals 1 when consultant-manager pair is either sub-advisor orbroker connected, else 0.
Connection Equals 1 when consultant-manager pair is either directly or sub-advisor or broker connected, else 0.
25

Table 2: Descriptive StatisticsPanel A and B: Based on iiSearches database 1995-2014. Total number of hiring decisions, hiring
decisions that used consultant, average mandate size and average fund size. Panel C: Each active US equitymandate hiring decision from iiSearches matched to all managers with a product in the mandate asset styleavailable in eVestment.
Panel A: All Mandates
Mandate Region Asset Class Hiring Used Mean MedianDecision Consultant Mandate size($M) Mandate size($M)
US Alternatives 4,186 3,954 139 50US Balanced/Multi-Asset 1,797 1,329 185 40US Equity 7,684 6,509 114 29US Fixed Income 3,407 2,798 229 50US Hedge Funds 1,419 1,325 137 50US Real Estate 2,564 2,450 107 45International Alternatives 1,503 1,379 137 60International Balanced/Multi-Asset 504 396 409 73International Equity 3,629 3,145 208 60International Fixed Income 634 567 245 75International Hedge Funds 439 406 154 75International Real Estate 400 383 114 60
Panel B: Plan Sponsors
Plan Type # Plan Used Hiring Mean MedianSponsor Consultant Decisions Fund size($M) Fund size($M)
Corporate Plans 1,080 712 2,525 2,127 297Endowments and Foundations 915 702 3,366 701 169Public Plans 865 720 18,796 5,540 233Unions 536 423 1,176 851 196Others 721 246 2,303 11,424 415
Panel C: US Equity Active Mandates that Involved Consultants
Hiring Mean Median Mean MedianDecisions Mandate size($M) Mandate size($M) Fund size($M) Fund size($M)
5,808 98 27 3,170 297
26

Panel D: Mandate-Manager Matched data
Hired Not Hired
Vari-able
Mean Std dev Mean Std dev
Consultant - Manager connection 0.154 0.361 0.051 0.220Direct Connection 0.034 0.177 0.004 0.065Indirect Connection 0.122 0.327 0.047 0.211
Sub-advisor Connection 0.042 0.202 0.008 0.089Broker Connection 0.079 0.270 0.039 0.193
Manager AUM ($M) 73,584 154,003 48,900 131,571% AUM in mandate asset class 36% 33% 38% 37%Alpha - 3 year pre hiring 0.27% 0.44% 0.13% 0.42%Standard deviation of returns 0.05 0.02 0.05 0.02Manager age - years since inception 28.79 22.50 23.32 21.49Manager Fee - $100M (BP) 66.45 18.76 67.71 20.19Candidates for hiring 201
27

Table 3: Manager Hiring DecisionConditional logit model to estimate the effect of connections on hiring decisions. Each active US equity
mandate hiring decision from iiSearches matched to all managers with a product in the mandate asset styleavailable in eVestment. Time period: 1995-2014. Standard errors are corrected for clustering in observationsfor the same fund. t-statistics in parentheses. *** indicates significance at 1% level, ** indicates significanceat 5% level, * indicates significance at 10% level.
Model 1 Model 2 Model 3 Model 4 Model 5
Alpha(t-1) 0.8913∗∗∗ 0.8966∗∗∗ 0.9853∗∗∗ 0.8979∗∗∗ 0.9856∗∗∗
(15.36) (15.36) (18.58) (15.42) (18.64)Fee($100M) -0.0098∗∗∗ -0.0104∗∗∗ -0.0106∗∗∗ -0.0103∗∗∗ -0.0107∗∗∗
(-6.34) (-6.63) (-6.54) (-6.59) (-6.58)Return std 1yr(t-1) -8.6641∗∗∗ -8.5861∗∗∗ -8.7402∗∗∗ -8.7262∗∗∗ -8.8387∗∗∗
(-4.71) (-4.55) (-4.78) (-4.62) (-4.83)Log Firm Size 0.2941∗∗∗ 0.2739∗∗∗ 0.2749∗∗∗ 0.2735∗∗∗ 0.2748∗∗∗
(25.78) (24.05) (24.17) (23.97) (24.07)%AUM in Mandate Asset Class 1.7266∗∗∗ 1.7285∗∗∗ 1.7280∗∗∗ 1.7325∗∗∗ 1.7323∗∗∗
(26.42) (26.21) (26.16) (26.21) (26.16)Manager Firm Age -0.0037∗∗∗ -0.0040∗∗∗ -0.0040∗∗∗ -0.0039∗∗∗ -0.0039∗∗∗
(-3.68) (-3.85) (-3.87) (-3.81) (-3.84)Connection 1.5584∗∗∗ 1.6208∗∗∗
(13.30) (6.02)Connection*Alpha(t-1) -0.5293∗∗∗
(-3.56)Connection*Fee($100M) 0.0010
(0.29)Direct Connection 1.9976∗∗∗ 2.2706∗∗∗
(13.80) (4.46)Indirect Connection 1.3879∗∗∗ 1.3565∗∗∗
(10.36) (4.38)Direct Connection*Alpha(t-1) -0.5950∗∗∗
(-3.03)Indirect Connection*Alpha(t-1) -0.5040∗∗∗
(-3.01)Direct Connection*Fee($100M) -0.0022
(-0.27)Indirect Connection*Fee($100M) 0.0024
(0.60)
Observations 615,255 615,255 615,255 615,255 615,255Pseudo R2 0.049 0.059 0.060 0.060 0.060
28

Table 4: Drivers of Hiring Decision when Connected Managers are HiredConditional logit model to estimate the drivers of hiring decisions. Each active US equity mandate
hiring decision from iiSearches matched to all managers with a product in the mandate asset style availablein eVestment. First column presents the results for mandates where unconnected manager was hired. Secondcolumn presents results for mandates where directly connected manager was hired. Third column presentsresults for mandates where indirectly connected manager was hired. Time period: 1995-2014. Standarderrors are corrected for clustering in observations for the same fund. t-statistics in parentheses. *** indicatessignificance at 1% level, ** indicates significance at 5% level, * indicates significance at 10% level.
Hired Hired Direct Hired IndirectUnconnected Connection Connection
Alpha(t-1) 1.0001∗∗∗ 0.1553 0.4215∗∗
(18.23) (0.61) (2.52)
Fee($100M) -0.0105∗∗∗ -0.0011 -0.0080∗
(-6.37) (-0.17) (-1.94)
Return Std 1yr(t-1) -9.4503∗∗∗ -1.8044 -4.9524
(-4.79) (-0.19)(-0.93)
Log Firm Size 0.2887∗∗∗ 0.3866∗∗∗ 0.3286∗∗∗
(23.94) (6.76) (10.32)
%AUM in Mandate Asset Class 1.7368∗∗∗ 0.8519∗∗ 1.8901∗∗∗
(24.98) (2.40) (10.23)
Manager Firm Age -0.0049∗∗∗ -0.0095∗∗ 0.0046∗
(-4.25) (-2.17) (1.91)
Observations 534,136 16,201 64,918Pseudo R2 0.050 0.056 0.058
29

Table 5: Post Hiring PerformanceOLS regression of 3 year post hiring alpha on connection dummies and other controls to test the
difference in performance of connected hirings compared to unconnected. Time period: 1995-2011. Standarderrors are corrected for clustering in observations when a manager is hired for same asset style mandate.t-statistics in parentheses. *** indicates significance at 1% level, ** indicates significance at 5% level, *indicates significance at 10% level.
Model 1 Model 2 Model 3
Log Firm AUM 0.0223∗∗∗ 0.0227∗∗∗ 0.0224∗∗∗
(3.78) (3.83) (3.79)
%AUM in Mandate Asset Class 0.1378∗∗∗ 0.1366∗∗∗ 0.1378∗∗∗
(3.99) (3.94)(3.99)
Fee($100M) 0.0008 0.0008 0.0008
(1.10) (1.20) (1.19)
Manager Firm Age 0.0002 0.0002 0.0003
(0.41) (0.64)(0.66)
Log Fund Size -0.0015 -0.0017 -0.0018
(-0.36) (-0.43) (-0.45)
Log Mandate amount -0.0015 -0.0021 -0.0019
(-0.24) (-0.34) (-0.31)
Connection -0.0494∗∗∗
(-3.10)
Direct Connection 0.0036(0.11)
Indirect Connection -0.0479∗∗∗
(-2.76)
Corporate Plan Indicator -0.0218 -0.0220 -0.0221
(-1.13) (-1.14)(-1.15)
Public Plan Indicator -0.0153 -0.0149 -0.0148
(-0.99) (-0.96) (-0.96)
Constant -0.3371∗∗∗ -0.3391∗∗∗ -0.3375∗∗∗
(-3.19) (-3.21) (-3.20)
Observations 3,154 3,154 3,154R2 0.116 0.119 0.119
30

Table 6: Manager Hiring Decision - After Chief Compliance Officer ruleConditional logit model to estimate the effect of connections on hiring decisions. Each active US equity
mandate hiring decision from iiSearches matched to all managers with a product in the mandate asset styleavailable in eVestment. Time period: 2005-2014. Standard errors are corrected for clustering in observationsfor the same fund. t-statistics in parentheses. *** indicates significance at 1% level, ** indicates significanceat 5% level, * indicates significance at 10% level.
Model 1 Model 2 Model 3 Model 4 Model 5
Alpha(t-1) 1.5189∗∗∗ 1.5097∗∗∗ 1.5860∗∗∗ 1.5158∗∗∗ 1.5870∗∗∗
(15.49) (15.41) (16.15) (15.41) (16.15)Fee($100M) -0.0111∗∗∗ -0.0117∗∗∗ -0.0122∗∗∗ -0.0116∗∗∗ -0.0121∗∗∗
(-5.40) (-5.63) (-5.69) (-5.58) (-5.64)Return std 1yr(t-1) -6.6592∗∗ -6.8824∗∗ -6.9899∗∗ -6.9190∗∗ -7.0311∗∗
(-2.02) (-2.07) (-2.10) (-2.08) (-2.12)Log Firm Size 0.3193∗∗∗ 0.3026∗∗∗ 0.3032∗∗∗ 0.3022∗∗∗ 0.3028∗∗∗
(20.12) (19.28) (19.36) (19.23) (19.33)%AUM in Mandate Asset Class 1.8254∗∗∗ 1.8194∗∗∗ 1.8224∗∗∗ 1.8200∗∗∗ 1.8224∗∗∗
(19.28) (19.22) (19.24) (19.17) (19.21)Manager Firm Age -0.0053∗∗∗ -0.0055∗∗∗ -0.0056∗∗∗ -0.0055∗∗∗ -0.0055∗∗∗
(-3.53) (-3.70) (-3.72) (-3.66) (-3.64)Connection 1.6348∗∗∗ 1.3812∗∗∗
(7.83) (3.08)Connection*Alpha(t-1) -0.8544∗∗
(-2.45)Connection*Fee($100M) 0.0054
(0.89)Direct Connection 2.2216∗∗∗ 1.3972∗
(10.39) (1.72)Indirect Connection 1.4051∗∗∗ 1.2663∗∗∗
(6.00) (2.59)Direct Connection*Alpha(t-1) -1.2136
(-1.56)Indirect Connection*Alpha(t-1) -0.7276∗
(-1.85)Direct Connection*Fee($100M) 0.0144
(1.17)Indirect Connection*Fee($100M) 0.0033
(0.49)
Observations 452,811 452,811 452,811 452,811 452,811Pseudo R2 0.056 0.064 0.064 0.065 0.065
31

Table 7: Drivers of Hiring Decision when Connected Managers are Hired - After ChiefCompliance Officer rule
Conditional logit model to estimate the drivers of hiring decisions. Each active US equity mandatehiring decision from iiSearches matched to all managers with a product in the mandate asset style availablein eVestment. First column presents the results for mandates where unconnected manager was hired. Secondcolumn presents results for mandates where directly connected manager was hired. Third column presentsresults for mandates where indirectly connected manager was hired. Time period: 2005-2014. Standarderrors are corrected for clustering in observations for the same fund. t-statistics in parentheses. *** indicatessignificance at 1% level, ** indicates significance at 5% level, * indicates significance at 10% level.
Hired Hired Direct Hired IndirectUnconnected Connection Connection
Alpha(t-1) 1.6114∗∗∗ 0.0081 0.8982∗∗
(16.38) (0.01)(2.31)
Fee($100M) -0.0118∗∗∗ 0.0010 -0.0076
(-5.49) (0.09) (-1.14)
Return Std 1yr(t-1) -7.7385∗∗ -1.0044 -0.8409
(-2.18) (-0.04)(-0.08)
Log Firm Size 0.3119∗∗∗ 0.4057∗∗∗ 0.3850∗∗∗
(18.77) (5.57) (7.55)
%AUM in Mandate Asset Class 1.8333∗∗∗ 1.5389∗∗∗ 1.8891∗∗∗
(17.97) (2.89) (6.40)
Manager Firm Age -0.0057∗∗∗ -0.0247∗∗∗ 0.0017(-3.50) (-2.91) (0.50)
Observations 398,100 11,537 43,174Pseudo R2 0.057 0.055 0.064
32

Table 8: Post Hiring Performance - After Chief Compliance Officer ruleOLS regression of 3 year post hiring alpha on connection dummies and other controls to test the
difference in performance of connected hirings compared to unconnected. Time period: 2005-2011. Standarderrors are corrected for clustering in observations when a manager is hired for same asset style mandate.t-statistics in parentheses. *** indicates significance at 1% level, ** indicates significance at 5% level, *indicates significance at 10% level.
Model 1 Model 2 Model 3
Log Firm AUM 0.0146∗∗∗ 0.0149∗∗∗ 0.0152∗∗∗
(2.66) (2.72) (2.83)
%AUM in Mandate Asset Class 0.0893∗∗ 0.0875∗∗ 0.0902∗∗
(2.49) (2.44)(2.54)
Fee($100M) 0.0016∗∗ 0.0018∗∗ 0.0018∗∗
(1.97) (2.09) (2.12)
Manager Firm age -0.0002 -0.0001 -0.0000
(-0.41) (-0.23)(-0.11)
Log Fund Size 0.0058 0.0055 0.0052
(1.06) (1.01) (0.94)
Log Mandate amount -0.0139∗ -0.0150∗ -0.0146∗
(-1.68) (-1.77) (-1.75)
Connection -0.0531∗
(-1.77)
Direct Connection 0.0262(0.58)
Indirect Connection -0.0690∗∗
(-2.03)
Corporate Plan Indicator -0.0173 -0.0223 -0.0228
(-0.62) (-0.80)(-0.83)
Public Plan Indicator -0.0185 -0.0206 -0.0198
(-0.91) (-1.01) (-1.01)
Constant -0.3614∗∗∗ -0.3601∗∗∗ -0.3644∗∗∗
(-3.93) (-3.94) (-4.06)
Observations 1,154 1,154 1,154R2 0.092 0.097 0.099
33

Table 9: Manager Hiring Decision - By Indirect Connection typesConditional logit model to estimate the effect of connections on hiring decisions. Each active US equity
mandate hiring decision from iiSearches matched to all managers with a product in the mandate asset styleavailable in eVestment. Time period: 1995-2014. Standard errors are corrected for clustering in observationsfor the same fund. t-statistics in parentheses. *** indicates significance at 1% level, ** indicates significanceat 5% level, * indicates significance at 10% level.
Model 1 Model 2 Model 3
Alpha(t-1) 0.8913∗∗∗ 0.8969∗∗∗ 0.9783∗∗∗
(15.36) (15.47) (18.60)Fee($100M) -0.0098∗∗∗ -0.0102∗∗∗ -0.0107∗∗∗
(-6.34) (-6.52) (-6.61)Return std 1yr(t-1) -8.6641∗∗∗ -8.6127∗∗∗ -8.7753∗∗∗
(-4.71) (-4.57) (-4.81)Log Firm Size 0.2941∗∗∗ 0.2709∗∗∗ 0.2722∗∗∗
(25.78) (23.68) (23.81)%AUM in Mandate Asset Class 1.7266∗∗∗ 1.7347∗∗∗ 1.7340∗∗∗
(26.42) (26.19) (26.11)Manager Firm Age -0.0037∗∗∗ -0.0040∗∗∗ -0.0040∗∗∗
(-3.68) (-3.91) (-3.92)Direct Connection 1.9784∗∗∗ 2.1833∗∗∗
(13.78) (4.36)Subadvisor Connection 1.9863∗∗∗ 2.4045∗∗∗
(11.78) (6.28)Broker Connection 1.0374∗∗∗ 0.6031∗
(8.06) (1.67)Direct Connection*Alpha(t-1) -0.5777∗∗∗
(-2.97)Subadvisor Connection*Alpha(t-1) -0.6122∗
(-1.72)Broker Connection*Alpha(t-1) -0.4324∗∗
(-2.29)Direct Connection*Fee($100M) -0.0012
(-0.15)Subadvisor Connection*Fee($100M) -0.0048
(-0.79)Broker Connection*Fee($100M) 0.0084∗
(1.74)
Observations 615,255 615,255 615,255Pseudo R2 0.049 0.061 0.062
34

Table 10: Post Hiring Performance - By Indirect Connection typesOLS regression of 3 year post hiring alpha on connection dummies and other controls to test the
difference in performance of connected hirings compared to unconnected. Time period: 1995-2011. Standarderrors are corrected for clustering in observations when a manager is hired for same asset style mandate.t-statistics in parentheses. *** indicates significance at 1% level, ** indicates significance at 5% level, *indicates significance at 10% level.
Model 1 Model 2
Log Firm AUM 0.0227∗∗∗ 0.0228∗∗∗
(3.83) (3.85)
%AUM in Mandate Asset Class 0.1366∗∗∗ 0.1385∗∗∗
(3.94) (4.01)
Fee($100M) 0.0008 0.0008
(1.20)(1.19)
Manager Firm Age 0.0002 0.0002
(0.64) (0.63)
Log Fund Size -0.0017 -0.0017
(-0.43)(-0.42)
Log Mandate amount -0.0021 -0.0019
(-0.34) (-0.30)
Connection -0.0494∗∗∗
(-3.10)
Direct Connection -0.0090(-0.26)
Subadvisor Connection -0.0700∗∗
(-2.40)
Broker Connection -0.0182(-0.87)
Corporate Plan Indicator -0.0220 -0.0227
(-1.14)(-1.18)
Public Plan Indicator -0.0149 -0.0160
(-0.96) (-1.03)
Constant -0.3391∗∗∗ -0.3405∗∗∗
(-3.21) (-3.24)
Observations 3,154 3,154R2 0.119 0.119
35

Table 11: Manager Hiring Decision - Restricting the number of CandidatesConditional logit model to estimate the effect of connections on hiring decisions. Each active US equity
mandate hiring decision from iiSearches matched to all managers with a product in the mandate asset styleavailable in eVestment. With this data I generate propensity scores for managers based on Model 1 in table3 and for each mandate I keep only up to 30 managers having propensity score closest to the hired manager.Time period: 1995-2014. Standard errors are corrected for clustering in observations for the same fund.t-statistics in parentheses. *** indicates significance at 1% level, ** indicates significance at 5% level, *indicates significance at 10% level.
Model 1 Model 2 Model 3 Model 4 Model 5
Alpha(t-1) 1.6346∗∗∗ 1.6358∗∗∗ 1.7168∗∗∗ 1.6444∗∗∗ 1.7210∗∗∗
(10.28) (10.17) (12.53) (10.20) (12.66)Fee($100M) -0.0173∗∗∗ -0.0177∗∗∗ -0.0180∗∗∗ -0.0178∗∗∗ -0.0181∗∗∗
(-8.29) (-8.42) (-8.71) (-8.42) (-8.79)Return std 1yr(t-1) -15.0729∗∗∗ -14.7959∗∗∗ -14.9686∗∗∗ -14.9962∗∗∗ -15.1694∗∗∗
(-6.10) (-5.88) (-6.12) (-5.97) (-6.27)Log Firm Size 0.4845∗∗∗ 0.4626∗∗∗ 0.4663∗∗∗ 0.4632∗∗∗ 0.4666∗∗∗
(11.93) (11.27) (11.85) (11.28) (11.92)%AUM in Mandate Asset Class 2.8931∗∗∗ 2.8817∗∗∗ 2.9011∗∗∗ 2.8892∗∗∗ 2.9080∗∗∗
(12.66) (12.43) (12.99) (12.45) (13.10)Manager Firm age -0.0065∗∗∗ -0.0067∗∗∗ -0.0067∗∗∗ -0.0066∗∗∗ -0.0067∗∗∗
(-5.75) (-5.82) (-5.88) (-5.76) (-5.82)Connection 1.5291∗∗∗ 1.6375∗∗∗
(13.29) (5.98)Connection*Alpha(t-1) -0.5549∗
(-1.80)Connection*Fee($100M) 0.0001
(0.03)Direct Connection 2.0568∗∗∗ 2.3335∗∗∗
(14.45) (4.63)Indirect Connection 1.3414∗∗∗ 1.3868∗∗∗
(10.32) (4.50)Direct Connection*Alpha(t-1) -0.2854
(-0.78)Hired Indirect Connection*Alpha(t-1) -0.5778
(-1.64)Direct Connection*Fee($100M) -0.0036
(-0.46)Indirect Connection*Fee($100M) 0.0013
(0.31)
Observations 84,721 84,721 84,721 84,721 84,721Pseudo R2 0.029 0.043 0.044 0.044 0.045
36

Table 12: Drivers of Hiring Decision when Connected Managers are Hired - Restrictingthe number of Candidates
Conditional logit model to estimate the effect of connections on hiring decisions. Each active US equitymandate hiring decision from iiSearches matched to all managers with a product in the mandate asset styleavailable in eVestment. With this data I generate propensity scores for managers based on Model 1 in table3 and for each mandate I keep only up to 30 managers having propensity score closest to the hired manager.First column presents the results for mandates where unconnected manager was hired. Second columnpresents results for mandates where directly connected manager was hired. Third column presents resultsfor mandates where indirectly connected manager was hired. Time period: 1995-2014. Standard errorsare corrected for clustering in observations for the same fund. t-statistics in parentheses. *** indicatessignificance at 1% level, ** indicates significance at 5% level, * indicates significance at 10% level.
Hired Hired Direct Hired IndirectUnconnected Connection Connection
Alpha(t-1) 1.8147∗∗∗ 0.7019 0.7749∗
(13.44) (0.84) (1.73)
Fee($100M) -0.0186∗∗∗ -0.0058 -0.0127∗∗
(-8.72) (-0.66)(-2.45)
Return std 1yr(t-1) -16.5445∗∗∗ -5.7249 -8.9715
(-6.66) (-0.51) (-1.21)
Log Firm Size 0.4983∗∗∗ 0.5741∗∗∗ 0.4425∗∗∗
(13.00) (3.31)(4.39)
%AUM in Mandate Asset Class 3.0008∗∗∗ 2.2117∗∗ 2.6702∗∗∗
(13.72) (2.06) (4.97)
Manager Firm Age -0.0078∗∗∗ -0.0137∗∗∗ 0.0026(-6.13) (-2.88) (0.96)
Observations 72,450 2,540 9,731Pseudo R2 0.031 0.050 0.039
37