
Connecticut’s Model for Property Assessed Financing for ... · Page | 1 Proactive By Design. Our...
29
Page | 1 Proactive By Design. Our Company Commitment Connecticut’s Model for Property Assessed Financing for Affordable Flood Resilience Wayne Cobleigh,CPSM, GZA GeoEnvironmental, Inc. Howard Kunreuther, Risk Management and Decision Process Center, The Wharton School, University of Pennsylvania Rebecca French, Ph.D., Connecticut Institute for Climate Resilience and Adaptation (CIRCA), University of Connecticut
Transcript of Connecticut’s Model for Property Assessed Financing for ... · Page | 1 Proactive By Design. Our...
Page | 1
Proactive By Design.
Our Company Commitment
Connecticut’s Model for Property Assessed Financing for Affordable Flood Resilience
Wayne Cobleigh,CPSM, GZA GeoEnvironmental, Inc.
Howard Kunreuther, Risk Management and Decision Process Center, The Wharton School, University of Pennsylvania
Rebecca French, Ph.D., Connecticut Institute for Climate Resilience and Adaptation (CIRCA), University of Connecticut
Page | 2Proactive By Design. Our Company Commitment
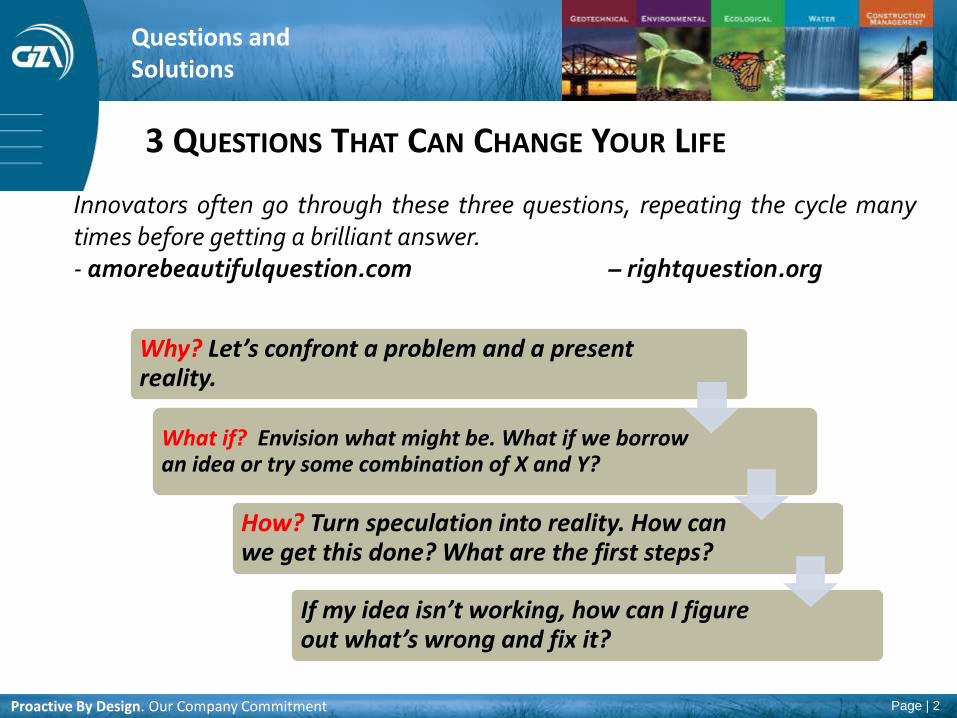
Innovators often go through these three questions, repeating the cycle manytimes before getting a brilliant answer.- amorebeautifulquestion.com – rightquestion.org
Questions andSolutions
3 QUESTIONS THAT CAN CHANGE YOUR LIFE
Why? Let’s confront a problem and a present reality.
What if? Envision what might be. What if we borrow an idea or try some combination of X and Y?
How? Turn speculation into reality. How can we get this done? What are the first steps?
If my idea isn’t working, how can I figure out what’s wrong and fix it?
Page | 3
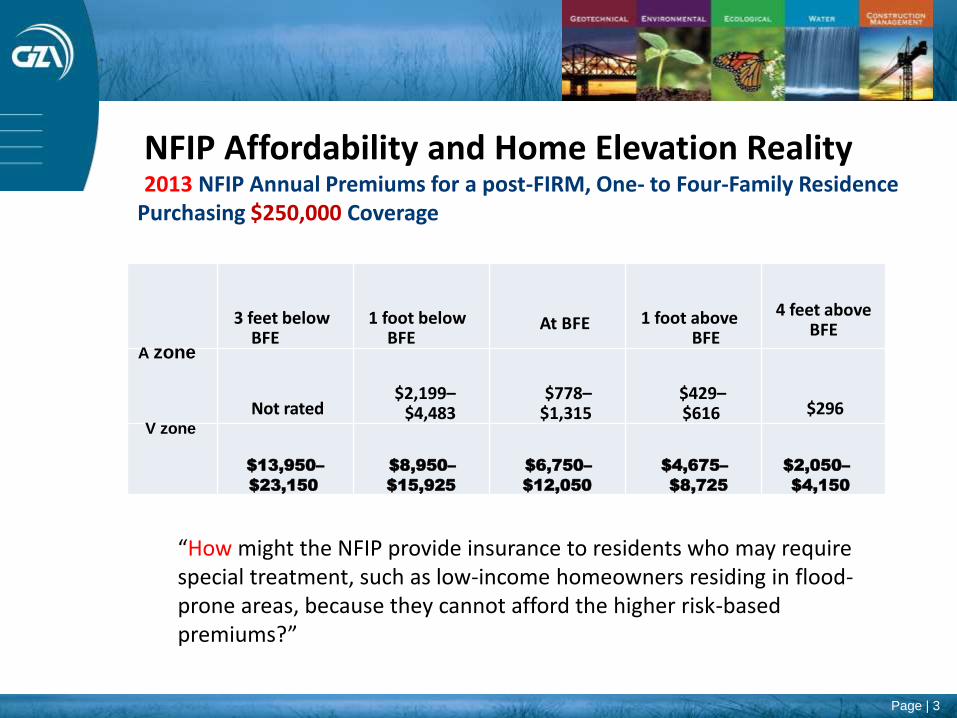
“How might the NFIP provide insurance to residents who may require special treatment, such as low-income homeowners residing in flood-prone areas, because they cannot afford the higher risk-based premiums?”
3 feet belowBFE
1 foot belowBFE
At BFE 1 foot aboveBFE
4 feet above BFE
A zone
Not rated$2,199–
$4,483$778–
$1,315$429–$616 $296
V zone
$13,950–
$23,150
$8,950–
$15,925
$6,750–
$12,050
$4,675–
$8,725
$2,050–
$4,150
NFIP Affordability and Home Elevation Reality 2013 NFIP Annual Premiums for a post-FIRM, One- to Four-Family Residence
Purchasing $250,000 Coverage
Page | 4
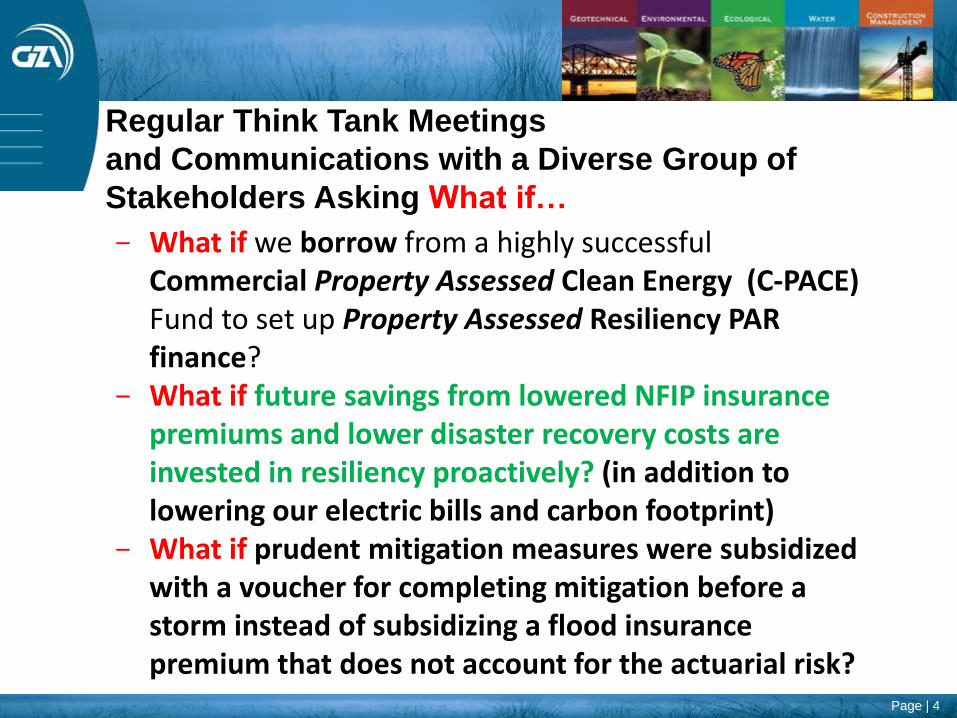
Regular Think Tank Meetings
and Communications with a Diverse Group of
Stakeholders Asking What if…
- What if we borrow from a highly successful Commercial Property Assessed Clean Energy (C-PACE) Fund to set up Property Assessed Resiliency PAR finance?
- What if future savings from lowered NFIP insurance premiums and lower disaster recovery costs are invested in resiliency proactively? (in addition to lowering our electric bills and carbon footprint)
- What if prudent mitigation measures were subsidized with a voucher for completing mitigation before a storm instead of subsidizing a flood insurance premium that does not account for the actuarial risk?
Page | 5
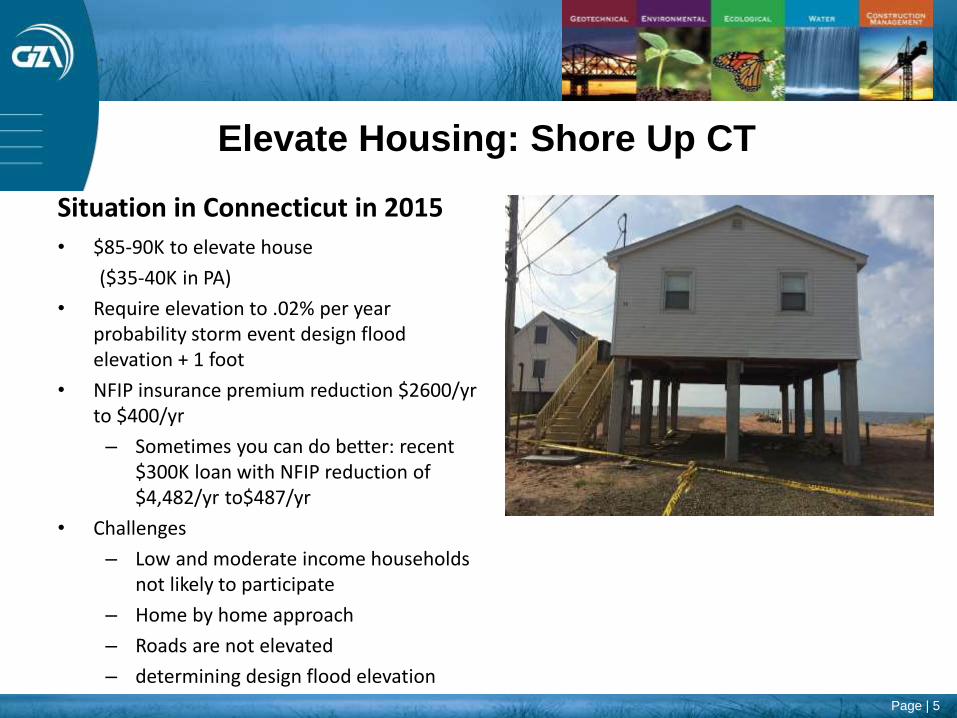
Elevate Housing: Shore Up CT
Situation in Connecticut in 2015
• $85-90K to elevate house
($35-40K in PA)
• Require elevation to .02% per year probability storm event design flood elevation + 1 foot
• NFIP insurance premium reduction $2600/yrto $400/yr
– Sometimes you can do better: recent $300K loan with NFIP reduction of $4,482/yr to$487/yr
• Challenges
– Low and moderate income households not likely to participate
– Home by home approach
– Roads are not elevated
– determining design flood elevation
Page | 6
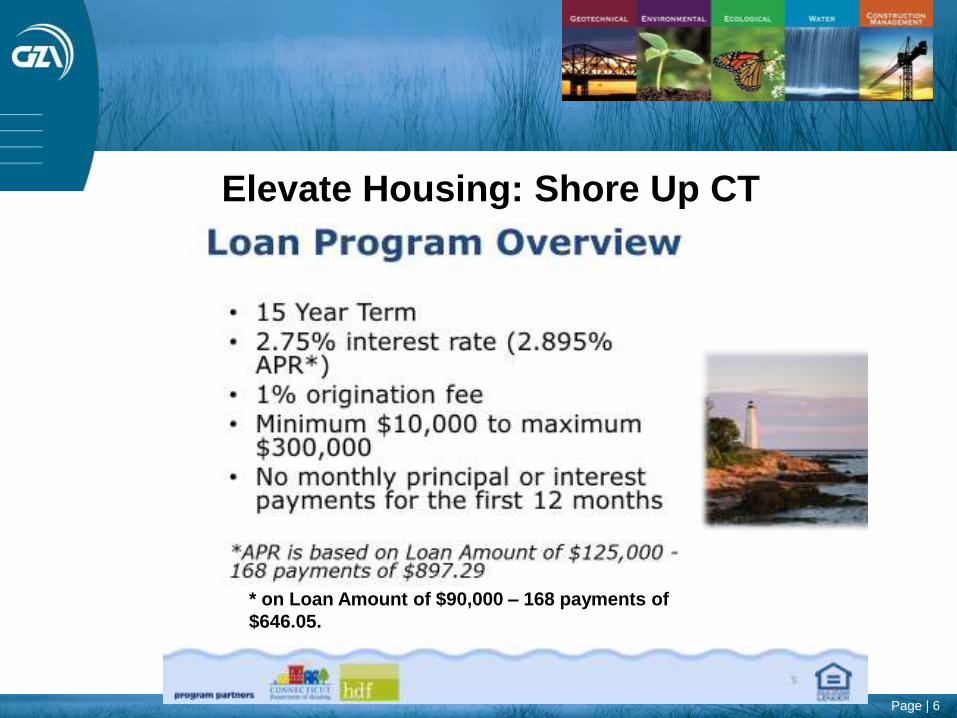
Elevate Housing: Shore Up CT
* on Loan Amount of $90,000 – 168 payments of
$646.05.
Page | 7
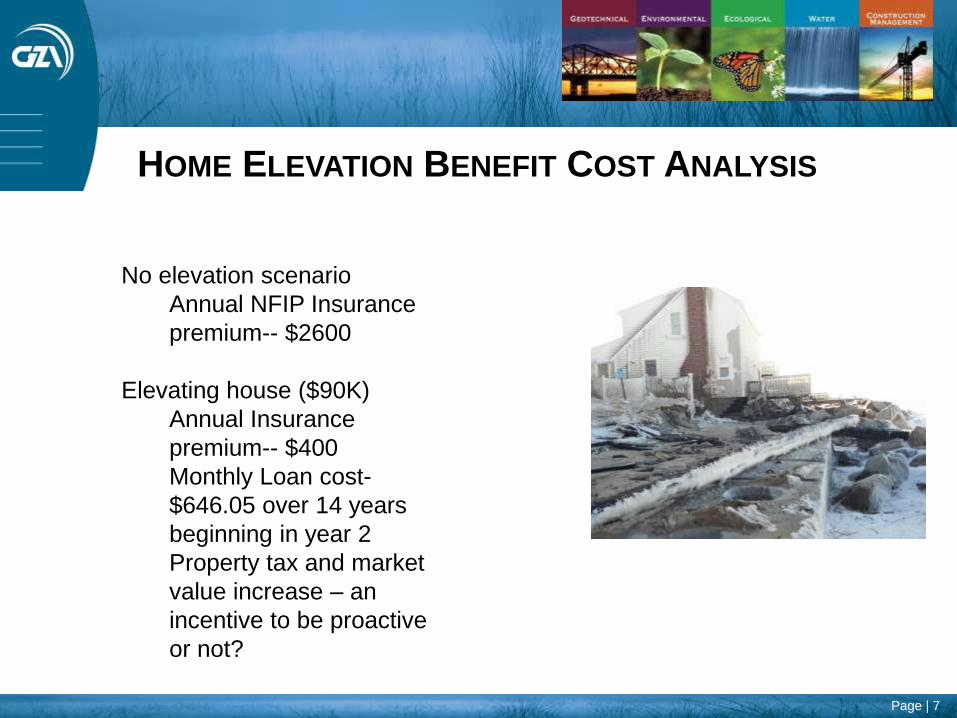
HOME ELEVATION BENEFIT COST ANALYSIS
No elevation scenario
Annual NFIP Insurance
premium-- $2600
Elevating house ($90K)
Annual Insurance
premium-- $400
Monthly Loan cost-
$646.05 over 14 years
beginning in year 2
Property tax and market
value increase – an
incentive to be proactive
or not?
Page | 8
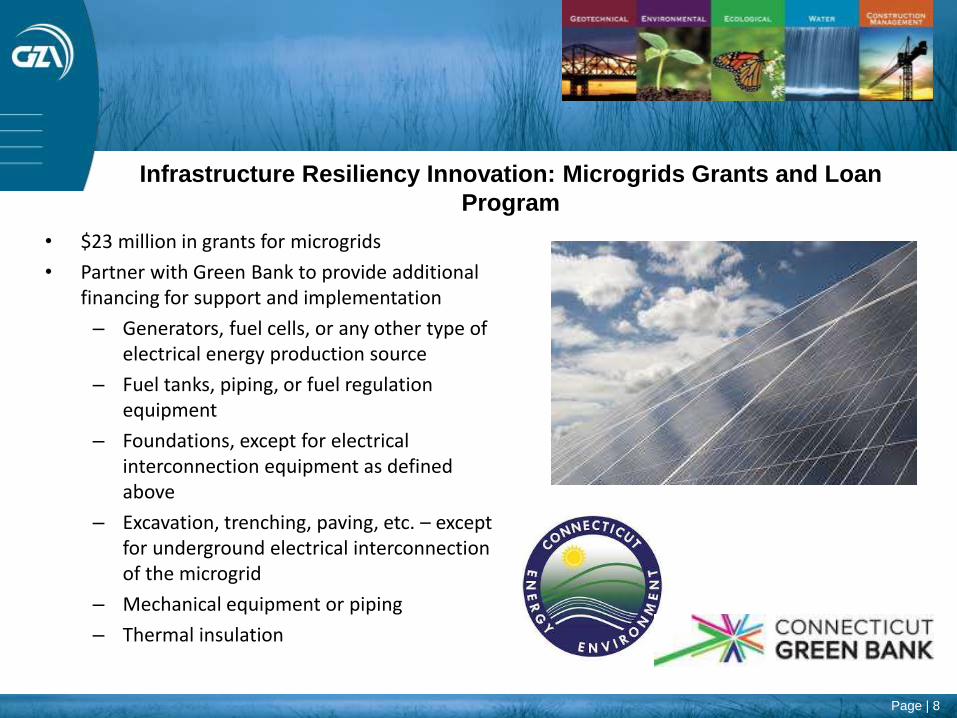
Infrastructure Resiliency Innovation: Microgrids Grants and Loan
Program
• $23 million in grants for microgrids
• Partner with Green Bank to provide additional financing for support and implementation
– Generators, fuel cells, or any other type of electrical energy production source
– Fuel tanks, piping, or fuel regulation equipment
– Foundations, except for electrical interconnection equipment as defined above
– Excavation, trenching, paving, etc. – except for underground electrical interconnection of the microgrid
– Mechanical equipment or piping
– Thermal insulation
Page | 9
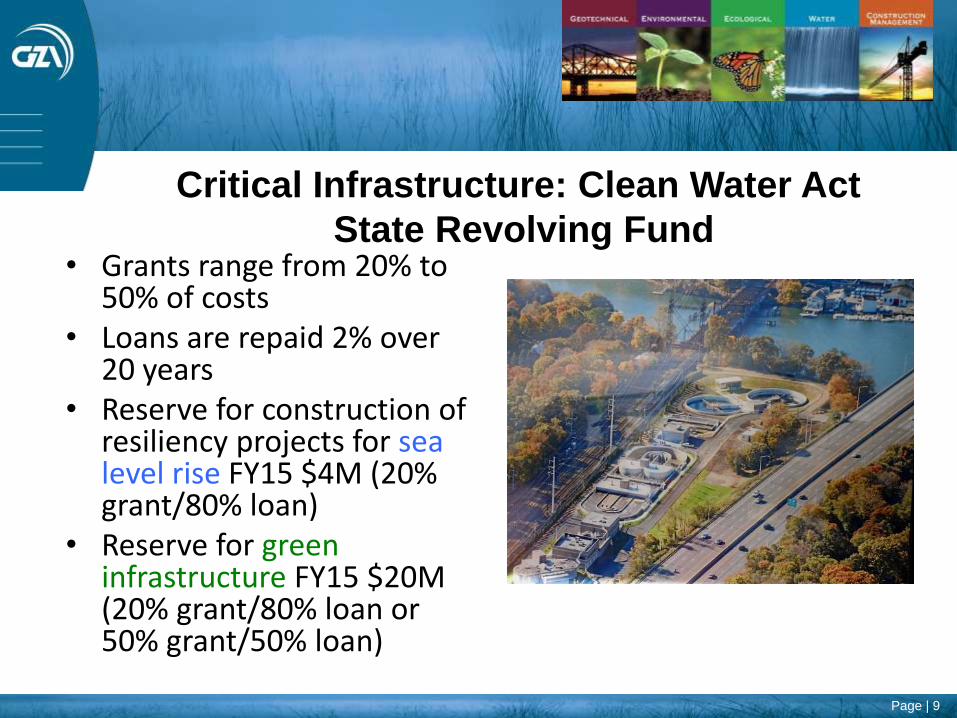
Critical Infrastructure: Clean Water Act
State Revolving Fund• Grants range from 20% to
50% of costs• Loans are repaid 2% over
20 years• Reserve for construction of
resiliency projects for sea level rise FY15 $4M (20% grant/80% loan)
• Reserve for green infrastructure FY15 $20M (20% grant/80% loan or 50% grant/50% loan)
Page | 10
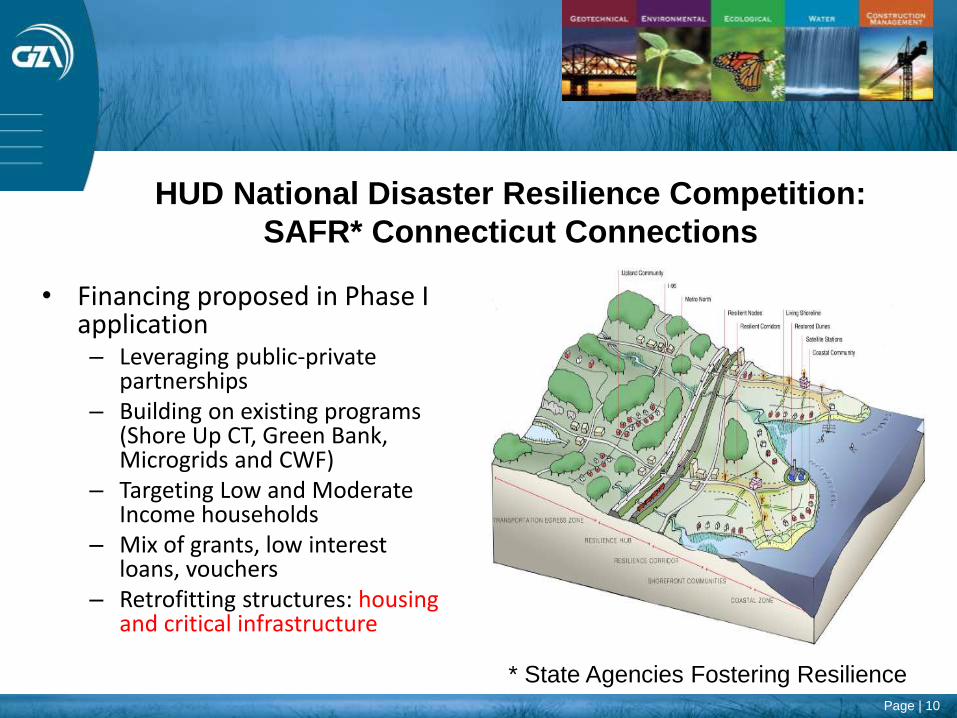
HUD National Disaster Resilience Competition:
SAFR* Connecticut Connections
• Financing proposed in Phase I application– Leveraging public-private
partnerships– Building on existing programs
(Shore Up CT, Green Bank, Microgrids and CWF)
– Targeting Low and Moderate Income households
– Mix of grants, low interest loans, vouchers
– Retrofitting structures: housing and critical infrastructure
* State Agencies Fostering Resilience
Page | 11
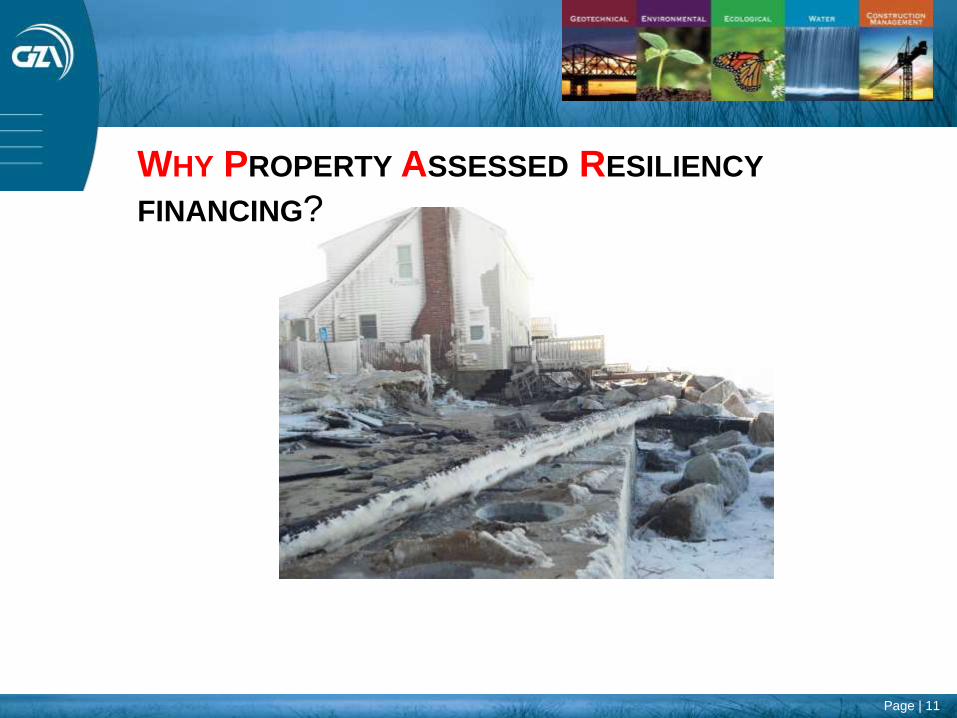
WHY PROPERTY ASSESSED RESILIENCY
FINANCING?
Page | 12
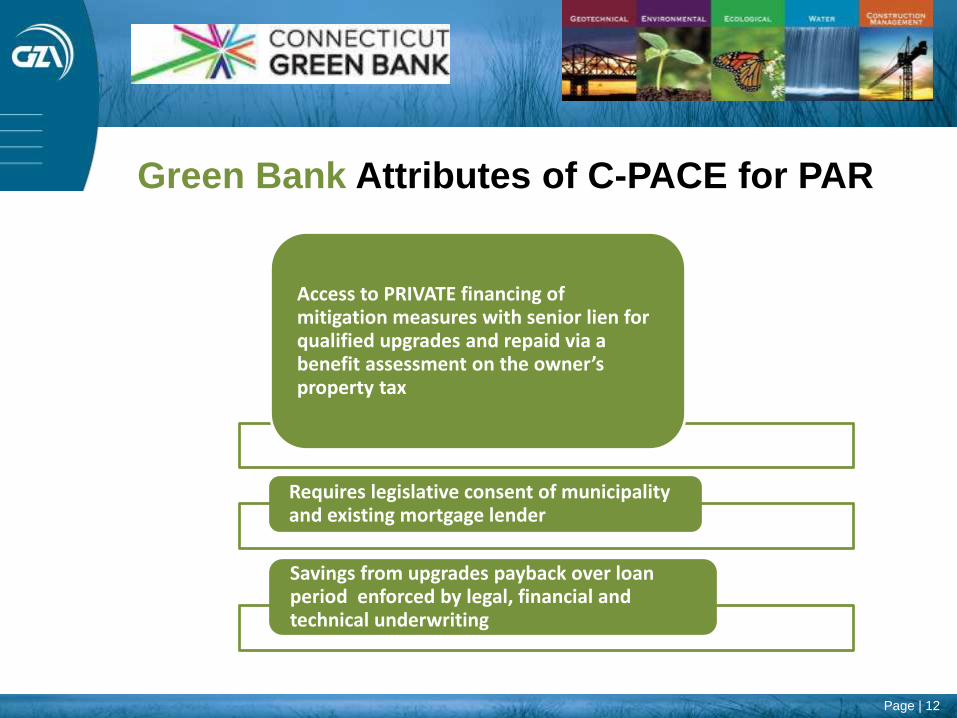
Green Bank Attributes of C-PACE for PAR
Access to PRIVATE financing of mitigation measures with senior lien for qualified upgrades and repaid via a benefit assessment on the owner’s property tax
Requires legislative consent of municipality and existing mortgage lender
Savings from upgrades payback over loan period enforced by legal, financial and technical underwriting
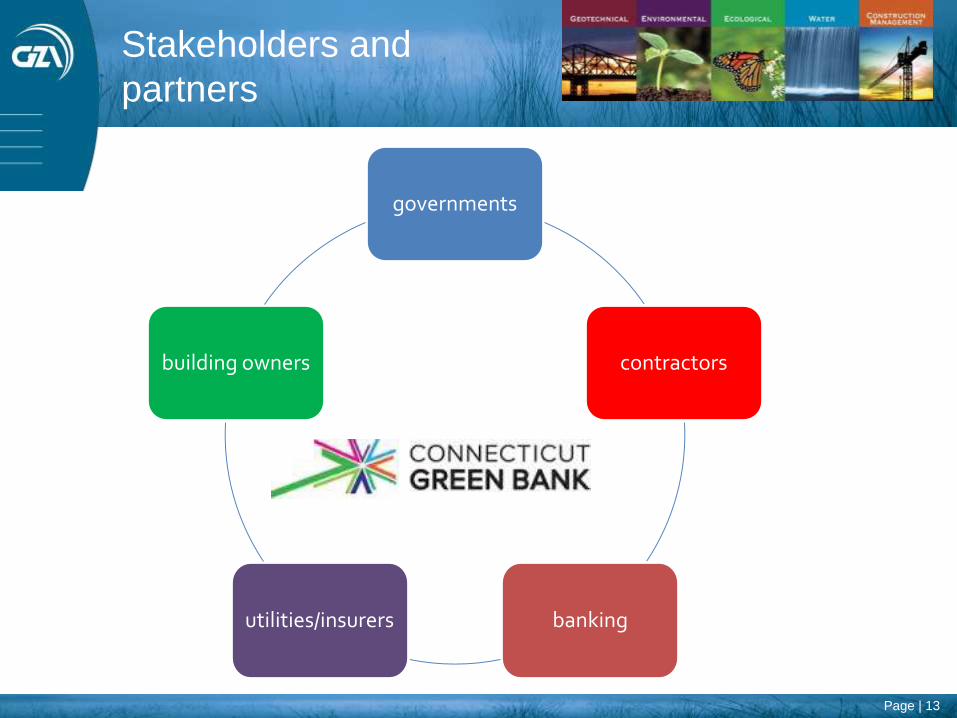
Page | 13
governments
contractors
bankingutilities/insurers
building owners
Stakeholders and
partners
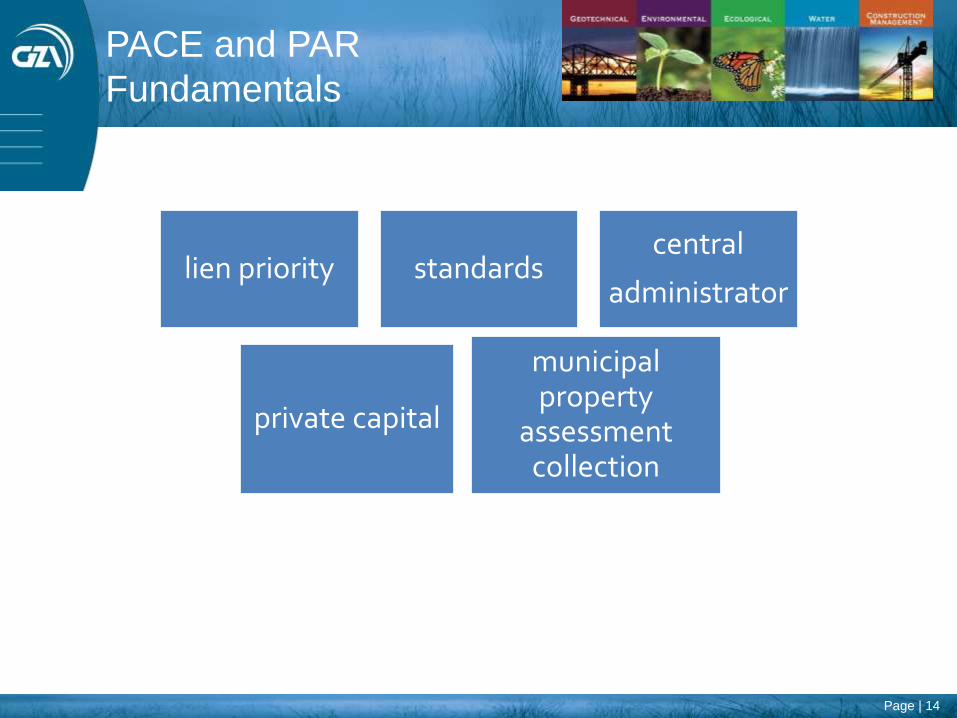
Page | 14
lien priority standardscentral
administrator
private capital
municipal property
assessment collection
PACE and PAR
Fundamentals
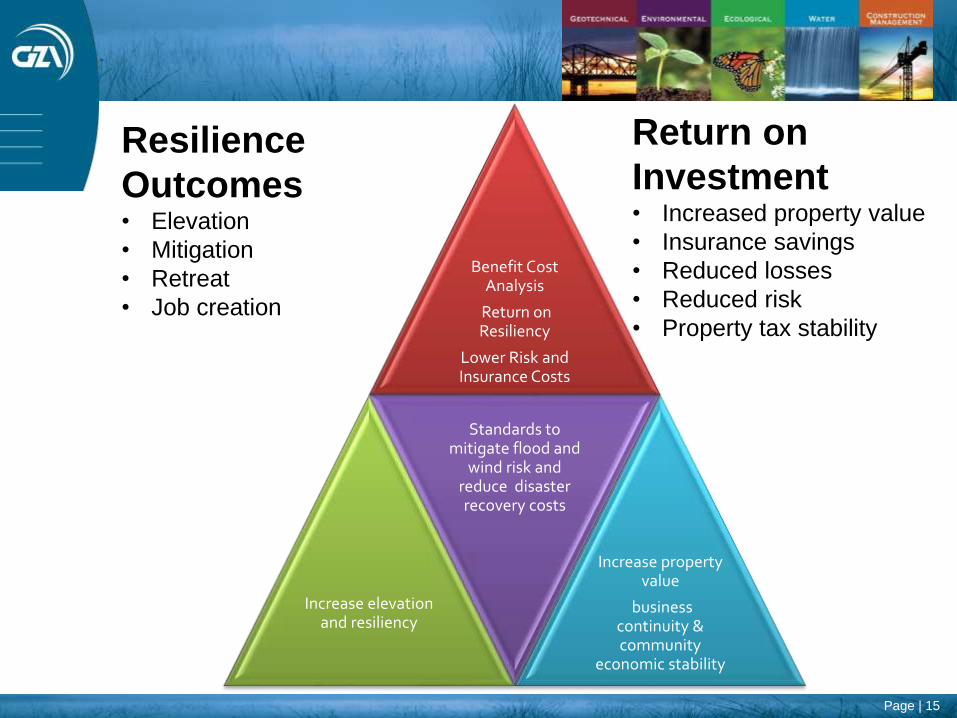
Page | 15
Benefit Cost Analysis
Return on Resiliency
Lower Risk and Insurance Costs
Increase elevation and resiliency
Standards to mitigate flood and
wind risk and reduce disaster recovery costs
Increase property value
business continuity & community
economic stability
Resilience
Outcomes• Elevation
• Mitigation
• Retreat
• Job creation
Return on
Investment• Increased property value
• Insurance savings
• Reduced losses
• Reduced risk
• Property tax stability
Page | 16
• C-PACE retrofits commercial buildings and multi-family (5 or more units) not single family residential.
• Fannie Mae and Freddie Mac has $5 trillion in federally backed mortgages (R-PACE/PAR lien needs to be senior to other debt on the property).
• R-PACE/PAR needs consumer protection for debt risks and affordability.
R-PACE/PAR Issues and Solutions
Needed
Page | 17
• Private investors and Central Administrator need access to risk underwriting to acceptable standards for building improvements (Ex. ASCE-24-14, Fortified for Safer Living®, Resilience Home™ and Resilience STAR™).
• Benefit Cost Analysis and resilience performance standards need to be predictable to monetize long-term savings on NFIP premiums.
R-PACE/PAR Issues and Solutions
Needed
IBHS- Insurance Institute for Business and Home Safety provides contractor training programs on their standards.
Page | 18
Streamlined R-PACE/PAR Financial
Underwriting Guidelines Needed
• Eligible resiliency products to be financed.
• Loan to Value Ratio ( mortgage debt + financing by PACE/PAR to property value)
• Lien to Value Ratio (R-PACE/PAR to property value).
• Annual Benefit Assessment to Value Ratio (R-PACE/PAR annual charge to property value OR annual R-PACE/PAR charge + property taxes to property value.
Page | 19
• Hybrid and Innovative Financial Products for Resiliency can be developed to meet the property owners’ and lender’s needs.
• Need more P3 financing solutions.
• See Bloomberg Finance Resilience (FiRe) 2015 competition examples for other innovative ideas.
In Summary

Page | 20
Thank You!
Any Questions?
Page | 21
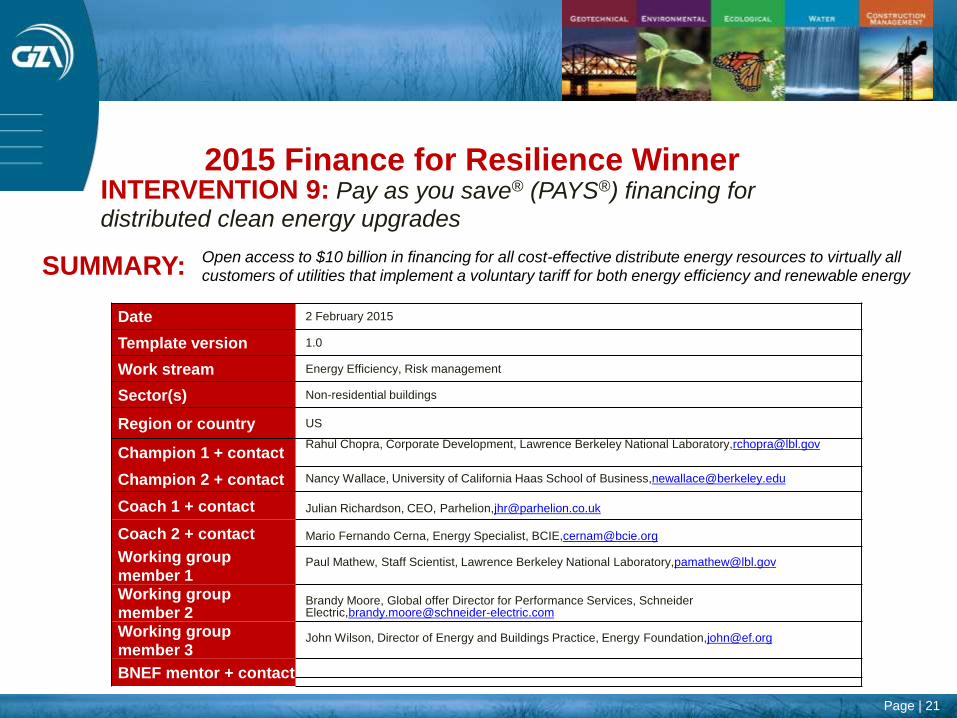
2015 Finance for Resilience Winner INTERVENTION 9: Pay as you save® (PAYS®) financing for
distributed clean energy upgrades
SUMMARY: Open access to $10 billion in financing for all cost-effective distribute energy resources to virtually all
customers of utilities that implement a voluntary tariff for both energy efficiency and renewable energy
Date 2 February 2015
Template version 1.0
Work stream Energy Efficiency, Risk management
Sector(s) Non-residential buildings
Region or country US
Champion 1 + contact Rahul Chopra, Corporate Development, Lawrence Berkeley National Laboratory,[email protected]
Champion 2 + contact Nancy Wallace, University of California Haas School of Business,[email protected]
Coach 1 + contact Julian Richardson, CEO, Parhelion,[email protected]
Coach 2 + contact Mario Fernando Cerna, Energy Specialist, BCIE,[email protected]
Working group member 1
Paul Mathew, Staff Scientist, Lawrence Berkeley National Laboratory,[email protected]
Working group member 2
Brandy Moore, Global offer Director for Performance Services, Schneider Electric,[email protected]
Working group member 3
John Wilson, Director of Energy and Buildings Practice, Energy Foundation,[email protected]
BNEF mentor + contact
Page | 22
PAYS® Long description relevant literature
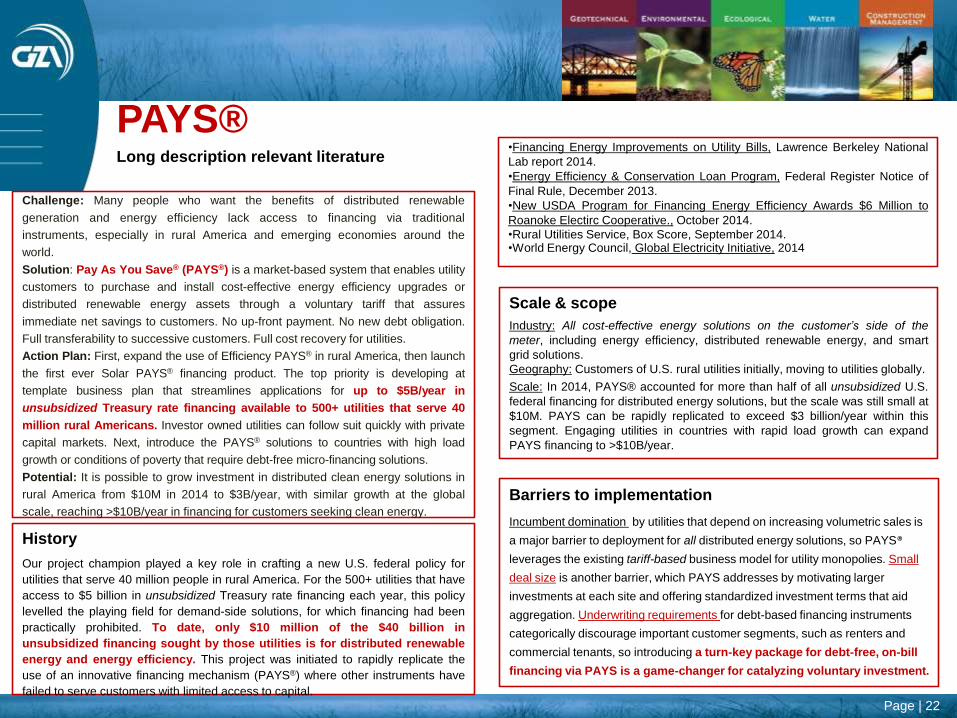
Challenge: Many people who want the benefits of distributed renewable
generation and energy efficiency lack access to financing via traditional
instruments, especially in rural America and emerging economies around the
world.
Solution: Pay As You Save® (PAYS®) is a market-based system that enables utility
customers to purchase and install cost-effective energy efficiency upgrades or
distributed renewable energy assets through a voluntary tariff that assures
immediate net savings to customers. No up-front payment. No new debt obligation.
Full transferability to successive customers. Full cost recovery for utilities.
Action Plan: First, expand the use of Efficiency PAYS® in rural America, then launch
the first ever Solar PAYS® financing product. The top priority is developing at
template business plan that streamlines applications for up to $5B/year in
unsubsidized Treasury rate financing available to 500+ utilities that serve 40
million rural Americans. Investor owned utilities can follow suit quickly with private
capital markets. Next, introduce the PAYS® solutions to countries with high load
growth or conditions of poverty that require debt-free micro-financing solutions.
Potential: It is possible to grow investment in distributed clean energy solutions in
rural America from $10M in 2014 to $3B/year, with similar growth at the global
scale, reaching >$10B/year in financing for customers seeking clean energy.
History
Our project champion played a key role in crafting a new U.S. federal policy for
utilities that serve 40 million people in rural America. For the 500+ utilities that have
access to $5 billion in unsubsidized Treasury rate financing each year, this policy
levelled the playing field for demand-side solutions, for which financing had been
practically prohibited. To date, only $10 million of the $40 billion in
unsubsidized financing sought by those utilities is for distributed renewable
energy and energy efficiency. This project was initiated to rapidly replicate the
use of an innovative financing mechanism (PAYS®) where other instruments have
failed to serve customers with limited access to capital.
•Financing Energy Improvements on Utility Bills, Lawrence Berkeley National
Lab report 2014.
•Energy Efficiency & Conservation Loan Program, Federal Register Notice of
Final Rule, December 2013.
•New USDA Program for Financing Energy Efficiency Awards $6 Million to
Roanoke Electirc Cooperative., October 2014.
•Rural Utilities Service, Box Score, September 2014. •World Energy Council, Global Electricity Initiative, 2014
Scale & scope
Industry: All cost-effective energy solutions on the customer’s side of the
meter, including energy efficiency, distributed renewable energy, and smart
grid solutions.
Geography: Customers of U.S. rural utilities initially, moving to utilities globally.
Scale: In 2014, PAYS® accounted for more than half of all unsubsidized U.S.
federal financing for distributed energy solutions, but the scale was still small at
$10M. PAYS can be rapidly replicated to exceed $3 billion/year within this
segment. Engaging utilities in countries with rapid load growth can expand
PAYS financing to >$10B/year.
Barriers to implementation
Incumbent domination by utilities that depend on increasing volumetric sales is
a major barrier to deployment for all distributed energy solutions, so PAYS®
leverages the existing tariff-based business model for utility monopolies. Small
deal size is another barrier, which PAYS addresses by motivating larger
investments at each site and offering standardized investment terms that aid
aggregation. Underwriting requirements for debt-based financing instruments
categorically discourage important customer segments, such as renters and
commercial tenants, so introducing a turn-key package for debt-free, on-bill
financing via PAYS is a game-changer for catalyzing voluntary investment.
Page | 23
QUANTITATIVE ANALYSIS Analysis
Justification for scale metrics
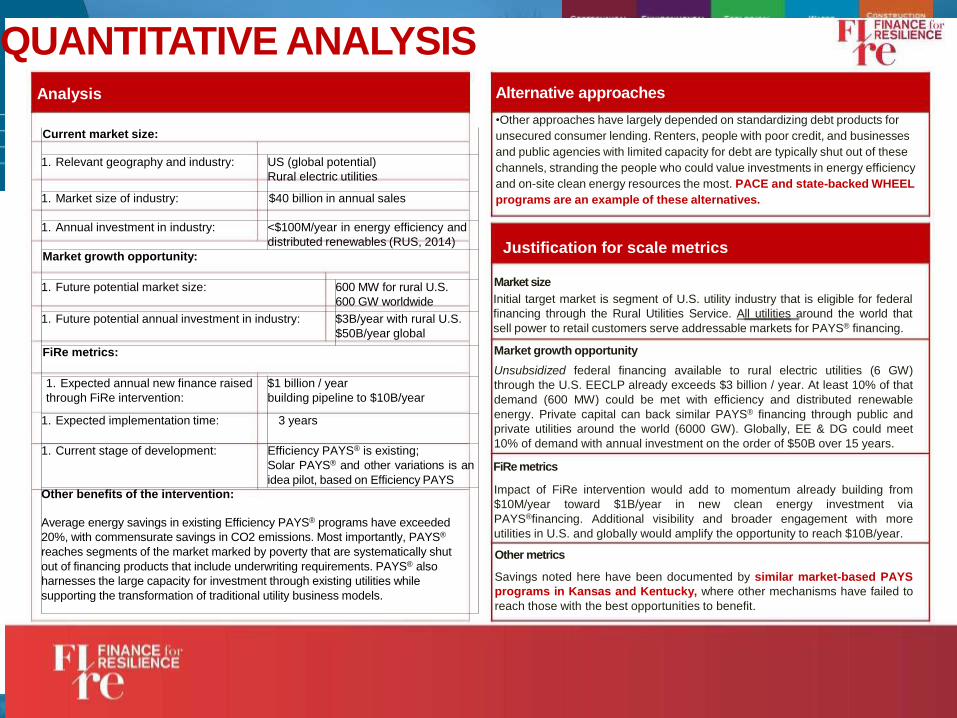
Market size
Initial target market is segment of U.S. utility industry that is eligible for federal
financing through the Rural Utilities Service. All utilities around the world that
sell power to retail customers serve addressable markets for PAYS® financing.
Alternative approaches
•Other approaches have largely depended on standardizing debt products for
unsecured consumer lending. Renters, people with poor credit, and businesses
and public agencies with limited capacity for debt are typically shut out of these
channels, stranding the people who could value investments in energy efficiency
and on-site clean energy resources the most. PACE and state-backed WHEEL
programs are an example of these alternatives.
Other metrics
Savings noted here have been documented by similar market-based PAYS
programs in Kansas and Kentucky, where other mechanisms have failed to
reach those with the best opportunities to benefit.
Market growth opportunity
Unsubsidized federal financing available to rural electric utilities (6 GW)
through the U.S. EECLP already exceeds $3 billion / year. At least 10% of that
demand (600 MW) could be met with efficiency and distributed renewable
energy. Private capital can back similar PAYS® financing through public and
private utilities around the world (6000 GW). Globally, EE & DG could meet
10% of demand with annual investment on the order of $50B over 15 years.
FiRe metrics
Impact of FiRe intervention would add to momentum already building from
$10M/year toward $1B/year in new clean energy investment via
PAYS®financing. Additional visibility and broader engagement with more
utilities in U.S. and globally would amplify the opportunity to reach $10B/year.
Current market size:
1. Relevant geography and industry: US (global potential)
Rural electric utilities
1. Market size of industry: $40 billion in annual sales
1. Annual investment in industry: <$100M/year in energy efficiency and
distributed renewables (RUS, 2014)
Market growth opportunity:
1. Future potential market size: 600 MW for rural U.S.
600 GW worldwide
1. Future potential annual investment in industry: $3B/year with rural U.S.
$50B/year global
FiRe metrics:
1. Expected annual new finance raised
through FiRe intervention:
$1 billion / year
building pipeline to $10B/year
1. Expected implementation time: 3 years
1. Current stage of development: Efficiency PAYS® is existing;
Solar PAYS® and other variations is an
idea pilot, based on Efficiency PAYS
Other benefits of the intervention:
Average energy savings in existing Efficiency PAYS® programs have exceeded
20%, with commensurate savings in CO2 emissions. Most importantly, PAYS®
reaches segments of the market marked by poverty that are systematically shut
out of financing products that include underwriting requirements. PAYS® also
harnesses the large capacity for investment through existing utilities while
supporting the transformation of traditional utility business models.
Page | 24
Municipal Adaptation Bonds
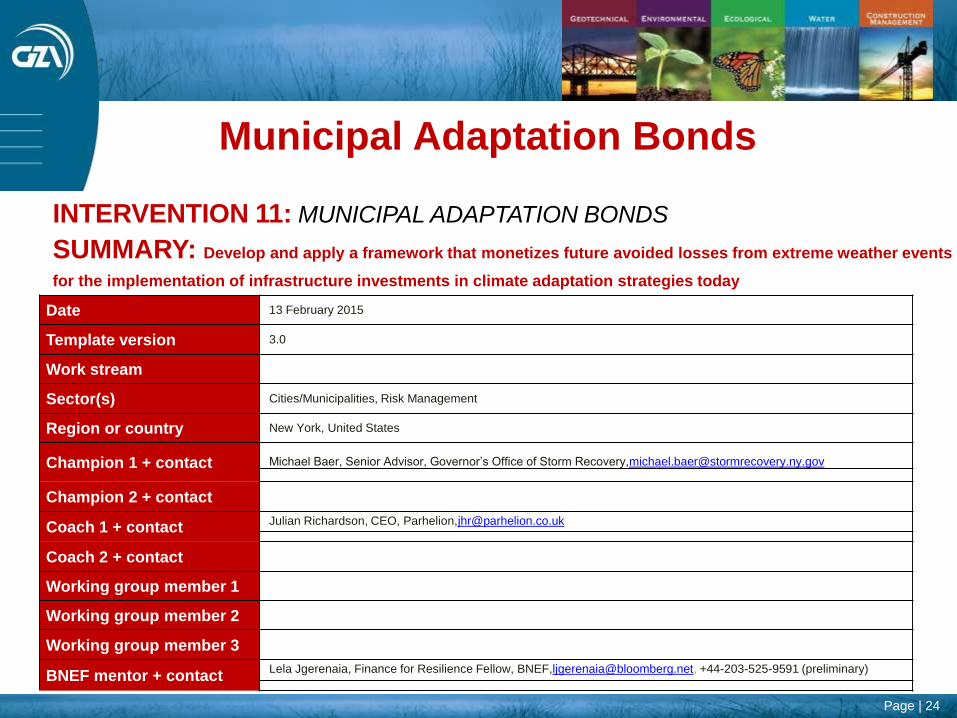
INTERVENTION 11: MUNICIPAL ADAPTATION BONDS
SUMMARY: Develop and apply a framework that monetizes future avoided losses from extreme weather events
for the implementation of infrastructure investments in climate adaptation strategies today
Date 13 February 2015
Template version 3.0
Work stream
Sector(s) Cities/Municipalities, Risk Management
Region or country New York, United States
Champion 1 + contact Michael Baer, Senior Advisor, Governor’s Office of Storm Recovery,[email protected]
Champion 2 + contact
Coach 1 + contact Julian Richardson, CEO, Parhelion,[email protected]
Coach 2 + contact
Working group member 1
Working group member 2
Working group member 3
BNEF mentor + contact Lela Jgerenaia, Finance for Resilience Fellow, BNEF,[email protected], +44-203-525-9591 (preliminary)
Page | 25
Municipal Adaptation Bonds
Long description & Relevant literature
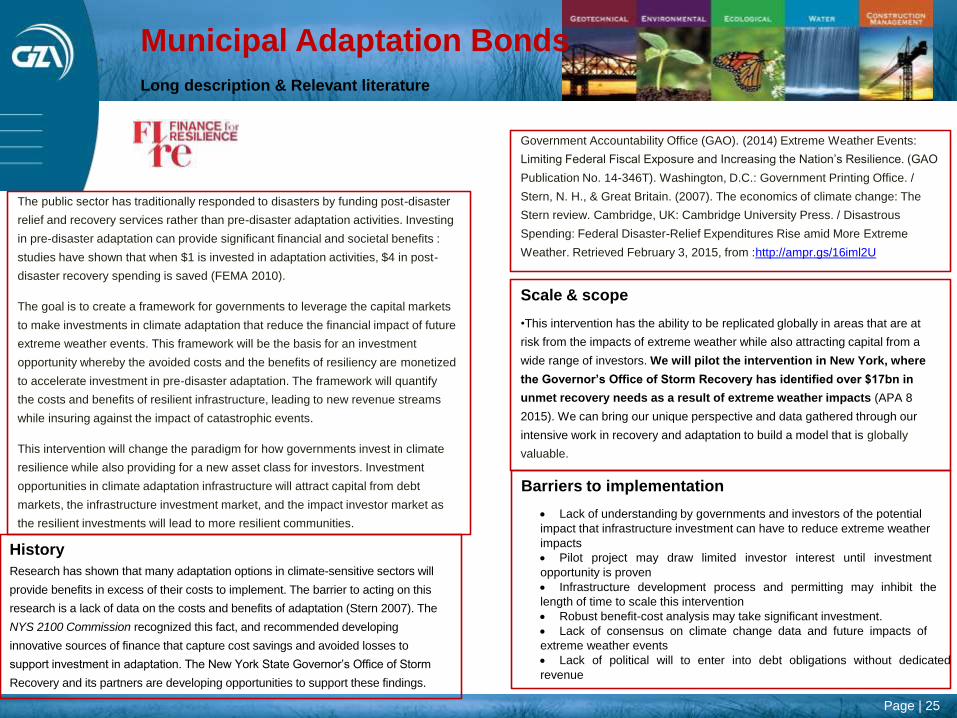
Government Accountability Office (GAO). (2014) Extreme Weather Events:
Limiting Federal Fiscal Exposure and Increasing the Nation’s Resilience. (GAO
Publication No. 14-346T). Washington, D.C.: Government Printing Office. /
Stern, N. H., & Great Britain. (2007). The economics of climate change: The
Stern review. Cambridge, UK: Cambridge University Press. / Disastrous
Spending: Federal Disaster-Relief Expenditures Rise amid More Extreme
Weather. Retrieved February 3, 2015, from :http://ampr.gs/16iml2U
Scale & scope
•This intervention has the ability to be replicated globally in areas that are at
risk from the impacts of extreme weather while also attracting capital from a
wide range of investors. We will pilot the intervention in New York, where
the Governor’s Office of Storm Recovery has identified over $17bn in
unmet recovery needs as a result of extreme weather impacts (APA 8
2015). We can bring our unique perspective and data gathered through our
intensive work in recovery and adaptation to build a model that is globally
valuable.
Barriers to implementation
Lack of understanding by governments and investors of the potential
impact that infrastructure investment can have to reduce extreme weather
impacts
Pilot project may draw limited investor interest until investment
opportunity is proven
Infrastructure development process and permitting may inhibit the
length of time to scale this intervention
Robust benefit-cost analysis may take significant investment.
Lack of consensus on climate change data and future impacts of
extreme weather events
Lack of political will to enter into debt obligations without dedicated
revenue
The public sector has traditionally responded to disasters by funding post-disaster
relief and recovery services rather than pre-disaster adaptation activities. Investing
in pre-disaster adaptation can provide significant financial and societal benefits :
studies have shown that when $1 is invested in adaptation activities, $4 in post-
disaster recovery spending is saved (FEMA 2010).
The goal is to create a framework for governments to leverage the capital markets
to make investments in climate adaptation that reduce the financial impact of future
extreme weather events. This framework will be the basis for an investment
opportunity whereby the avoided costs and the benefits of resiliency are monetized
to accelerate investment in pre-disaster adaptation. The framework will quantify
the costs and benefits of resilient infrastructure, leading to new revenue streams
while insuring against the impact of catastrophic events.
This intervention will change the paradigm for how governments invest in climate
resilience while also providing for a new asset class for investors. Investment
opportunities in climate adaptation infrastructure will attract capital from debt
markets, the infrastructure investment market, and the impact investor market as
the resilient investments will lead to more resilient communities.
History
Research has shown that many adaptation options in climate-sensitive sectors will
provide benefits in excess of their costs to implement. The barrier to acting on this
research is a lack of data on the costs and benefits of adaptation (Stern 2007). The
NYS 2100 Commission recognized this fact, and recommended developing
innovative sources of finance that capture cost savings and avoided losses to
support investment in adaptation. The New York State Governor’s Office of Storm
Recovery and its partners are developing opportunities to support these findings.
Page | 26
QUANTITATIVE ANALYSIS Analysis
Justification for scale metrics
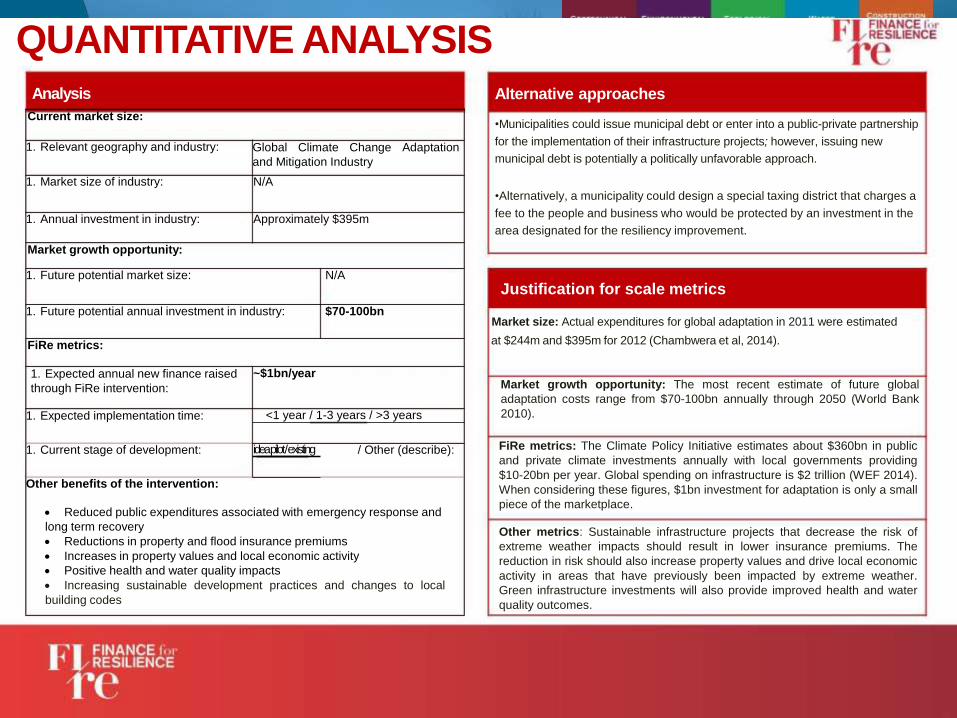
Market size: Actual expenditures for global adaptation in 2011 were estimated
at $244m and $395m for 2012 (Chambwera et al, 2014).
Market growth opportunity: The most recent estimate of future global
adaptation costs range from $70-100bn annually through 2050 (World Bank
2010).
FiRe metrics: The Climate Policy Initiative estimates about $360bn in public
and private climate investments annually with local governments providing
$10-20bn per year. Global spending on infrastructure is $2 trillion (WEF 2014).
When considering these figures, $1bn investment for adaptation is only a small
piece of the marketplace.
Other metrics: Sustainable infrastructure projects that decrease the risk of
extreme weather impacts should result in lower insurance premiums. The
reduction in risk should also increase property values and drive local economic
activity in areas that have previously been impacted by extreme weather.
Green infrastructure investments will also provide improved health and water
quality outcomes.
Alternative approaches
•Municipalities could issue municipal debt or enter into a public-private partnership
for the implementation of their infrastructure projects; however, issuing new
municipal debt is potentially a politically unfavorable approach.
•Alternatively, a municipality could design a special taxing district that charges a
fee to the people and business who would be protected by an investment in the
area designated for the resiliency improvement.
Current market size:
1. Relevant geography and industry: Global Climate Change Adaptation
and Mitigation Industry
1. Market size of industry: N/A
1. Annual investment in industry: Approximately $395m
Market growth opportunity:
1. Future potential market size: N/A
1. Future potential annual investment in industry: $70-100bn
FiRe metrics:
1. Expected annual new finance raised
through FiRe intervention:
~$1bn/year
1. Expected implementation time: <1 year / 1-3 years / >3 years
1. Current stage of development: idea pilot / existing / Other (describe):
Other benefits of the intervention:
Reduced public expenditures associated with emergency response and
long term recovery
Reductions in property and flood insurance premiums
Increases in property values and local economic activity
Positive health and water quality impacts
Increasing sustainable development practices and changes to local
building codes
Page | 27
•
•
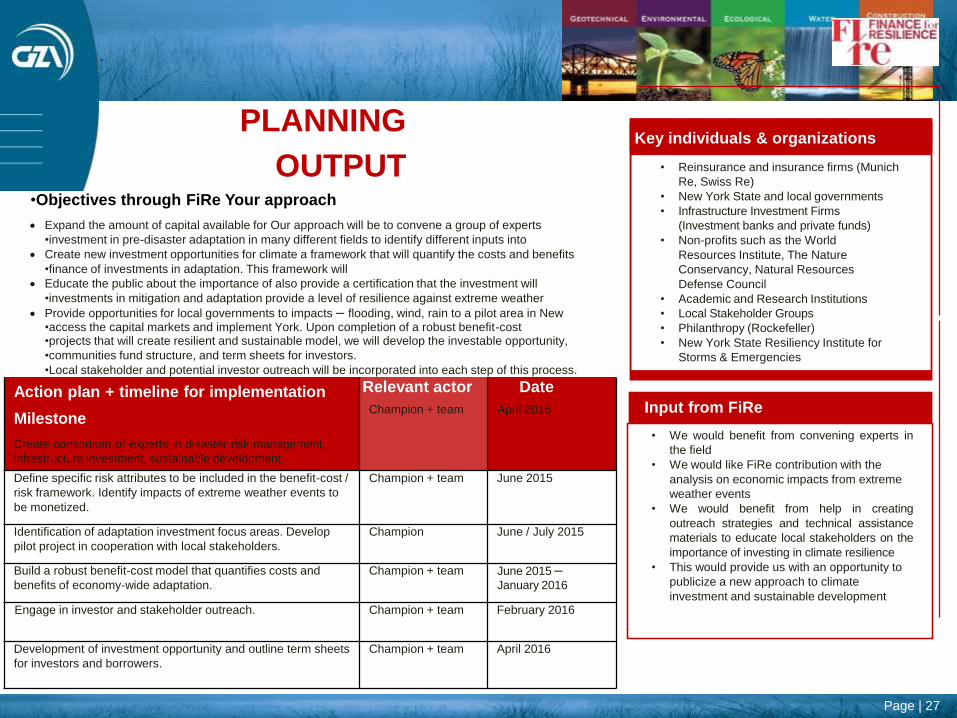
•Objectives through FiRe Your approach
Expand the amount of capital available for Our approach will be to convene a group of experts
•investment in pre-disaster adaptation in many different fields to identify different inputs into
Create new investment opportunities for climate a framework that will quantify the costs and benefits
•finance of investments in adaptation. This framework will
Educate the public about the importance of also provide a certification that the investment will
•investments in mitigation and adaptation provide a level of resilience against extreme weather
Provide opportunities for local governments to impacts – flooding, wind, rain to a pilot area in New •access the capital markets and implement York. Upon completion of a robust benefit-cost •projects that will create resilient and sustainable model, we will develop the investable opportunity,
•communities fund structure, and term sheets for investors.
•Local stakeholder and potential investor outreach will be incorporated into each step of this process.
Key individuals & organizations
• Reinsurance and insurance firms (Munich
Re, Swiss Re)
• New York State and local governments
• Infrastructure Investment Firms
(Investment banks and private funds)
• Non-profits such as the World
Resources Institute, The Nature
Conservancy, Natural Resources
Defense Council
• Academic and Research Institutions
• Local Stakeholder Groups
• Philanthropy (Rockefeller)
• New York State Resiliency Institute for
Storms & Emergencies
• We would benefit from convening experts in
the field
• We would like FiRe contribution with the
analysis on economic impacts from extreme
weather events
• We would benefit from help in creating
outreach strategies and technical assistance
materials to educate local stakeholders on the
importance of investing in climate resilience
• This would provide us with an opportunity to
publicize a new approach to climate
investment and sustainable development
PLANNING
OUTPUT
Action plan + timeline for implementation
Milestone
Create consortium of experts in disaster risk management,
infrastructure investment, sustainable development.
Relevant actor
Champion + team
Date
April 2015
Define specific risk attributes to be included in the benefit-cost /
risk framework. Identify impacts of extreme weather events to
be monetized.
Champion + team June 2015
Identification of adaptation investment focus areas. Develop
pilot project in cooperation with local stakeholders.
Champion June / July 2015
Build a robust benefit-cost model that quantifies costs and
benefits of economy-wide adaptation.
Champion + team June 2015 –January 2016
Engage in investor and stakeholder outreach. Champion + team February 2016
Development of investment opportunity and outline term sheets
for investors and borrowers.
Champion + team April 2016
Input from FiRe
Page | 28
1. Berger, Warren, A More Beautiful Question: The Power of Inquiry to Spark Breakthrough Ideas (Bloomsbury, March, 2014).
2. Berger, Warren, Chasing Beautiful Questions, Spirit Magazine, p. 69-74, April, 2014.
3. Kunreuther, Howard; Kousky, Carolyn; Addressing Affordability in the National Flood Insurance Program, Journal of Extreme Events, Vol. 1, No. 1, April, 2014.
4. Bailey, Jessica, C-PACE: Commercial & Industrial Property Assessed Clean Energy Presentation to ICSC May 2013 and www.c-pace.com .
5. American Society of Civil Engineers, Flood Resistant Design and Construction Guidance Standard, ASCE 24-14.
6. Insurance Institute for Business and Home Safety, Fortified Overview at www.disastersafety.org/fortified-main/
7. Petrenko, Fedor, Finance for Resilience Chooses Winning Innovations. Yale Center for Business and the Environment. http://cleanenergyfinanceforum.com/2015/04/24/finance-for-
resilience-chooses-winning-innovations/
References
Page | 29
References (continued)
8. Editorial, $25,887,000,000,000 ( Wall Street Journal, Pg. A12, May 26, 2015.9. Bailey, Jessica, PACENow, March 16, 2015, Public Comments to Members of the Energy and Technology Committee of the Connecticut Legislature on H.B. No. 6995 (Raised) An Act Concerning a Residential Property Assessed Clean Energy Program. http://www.cga.ct.gov/asp/menu/CommDocTmyBillAllComm.asp?bill=HB-06995&doc_year=2015