Connect + Monitor - GE | The Digital Industrial Company ... Internet software to manage and analyze...
13
How to manage your assets— and drive value from them—step by step Jeremiah Stone is the General Manager of GE’s Industrial Data Intelligence (IDI) business unit. GE’s IDI business focuses on helping Industrial companies effectively access, manage, and leverage their industrial data to achieve their asset, equipment and business performance goals through advanced data management and predictive analytics solutions and services. In the current difficult and competitive environment, your business probably is being challenged to improve productivity by optimizing asset reliability and operational performance. To help, technology gurus around the world are working hard and fast to develop next-generation Industrial Internet software to manage and analyze your asset and process data and help you gain value from it. The problem is—it’s all very confusing. It’s hard to understand the functionalities of all this software— what all the individual pieces do and how they all fit together. What do you really need and when? How do you go about building a proper technology stack—in an organized and simple manner? In fact, how do you even get started? In reality, all of this software can be divided into four easy-to-understand groups, each of which has a particular function on a four-step continuum. The following describes the types of software you will need as you progress to gain more and more value from your data and grow closer to optimizing your asset reliability and performance. We’ll discuss how to move from reactive monitoring to the most advanced prescriptive strategies—and, in doing so, how to transform your data’s trends and patterns from uncontrolled noise into more actionable information. indicate that the use of Big Data analytics has the power to shift the competitive landscape for their industry. “ Accenture, January 2015 84 % OF COMPANIES SURVEYED
-
Upload
nguyenphuc -
Category
Documents
-
view
215 -
download
0
Transcript of Connect + Monitor - GE | The Digital Industrial Company ... Internet software to manage and analyze...

How to manage your assets—and drive value from them—step by step
Jeremiah Stone is the General Manager of GE’s Industrial Data Intelligence (IDI) business unit. GE’s IDI business focuses on helping Industrial companies effectively access, manage, and leverage their industrial data to achieve their asset, equipment and business performance goals through advanced data management and predictive analytics solutions and services.
In the current difficult and competitive environment, your business probably is being challenged to improve productivity by optimizing asset reliability and operational performance. To help, technology gurus around the world are working hard and fast to develop next-generation Industrial Internet software to manage and analyze your asset and process data and help you gain value from it.
The problem is—it’s all very confusing. It’s hard to understand the functionalities of all this software—what all the individual pieces do and how they all fit together. What do you really need and when? How do you go about building a proper technology stack—in an organized and simple manner? In fact, how do you even get started?
In reality, all of this software can be divided into four easy-to-understand groups, each of which has a particular function on a four-step continuum.
The following describes the types of software you will need as you progress to gain more and more value from your data and grow closer to optimizing your asset reliability and performance. We’ll discuss how to move from reactive monitoring to the most advanced prescriptive strategies—and, in doing so, how to transform your data’s trends and patterns from uncontrolled noise into more actionable information.
indicate that the use of Big Data analytics has the power to shift the competitive landscape for their industry. “ Accenture, January 2015
84%OF COMPANIES
SURVEYED

Connect + Monitor
How to get startedThe first step in the journey begins with connecting your machines and data and basic monitoring of critical assets to see what happened in the past and in near real time. This means collecting and storing data, providing context to it , and visualizing it.
To accomplish this level of monitoring, you need to instrument your critical equipment with sensors and control networks. Online systems, at the point of control, often include SCADA systems, but they also can include cloud-based monitoring systems.
Monitor facilities, beyond equipmentIn addition to using these types of software to monitor your operations, you also can use them to monitor your facilities—and then tie the two together. Even with this basic level of monitoring, you can learn from the combined data and make improvements. GE helped one company do just that.y didn’t we see this before?
1
Collect
Archive
Distribute Visualize
“Everybody wants to start too far up the continuum. They want the change-the-world analytics. But you need to lay the foundation. That’s not as sexy as the analytics that have an impact on your balance sheets. However, if you have the foundation set up, your ability to accelerate up that value continuum increases exponentially.”
Jim Walsh General Manager, GE Software and Services
Sensors
Controls networks
SCADA
Historian
Threshold-based alarming
Control charting
Historian trend analysis
Software requirements
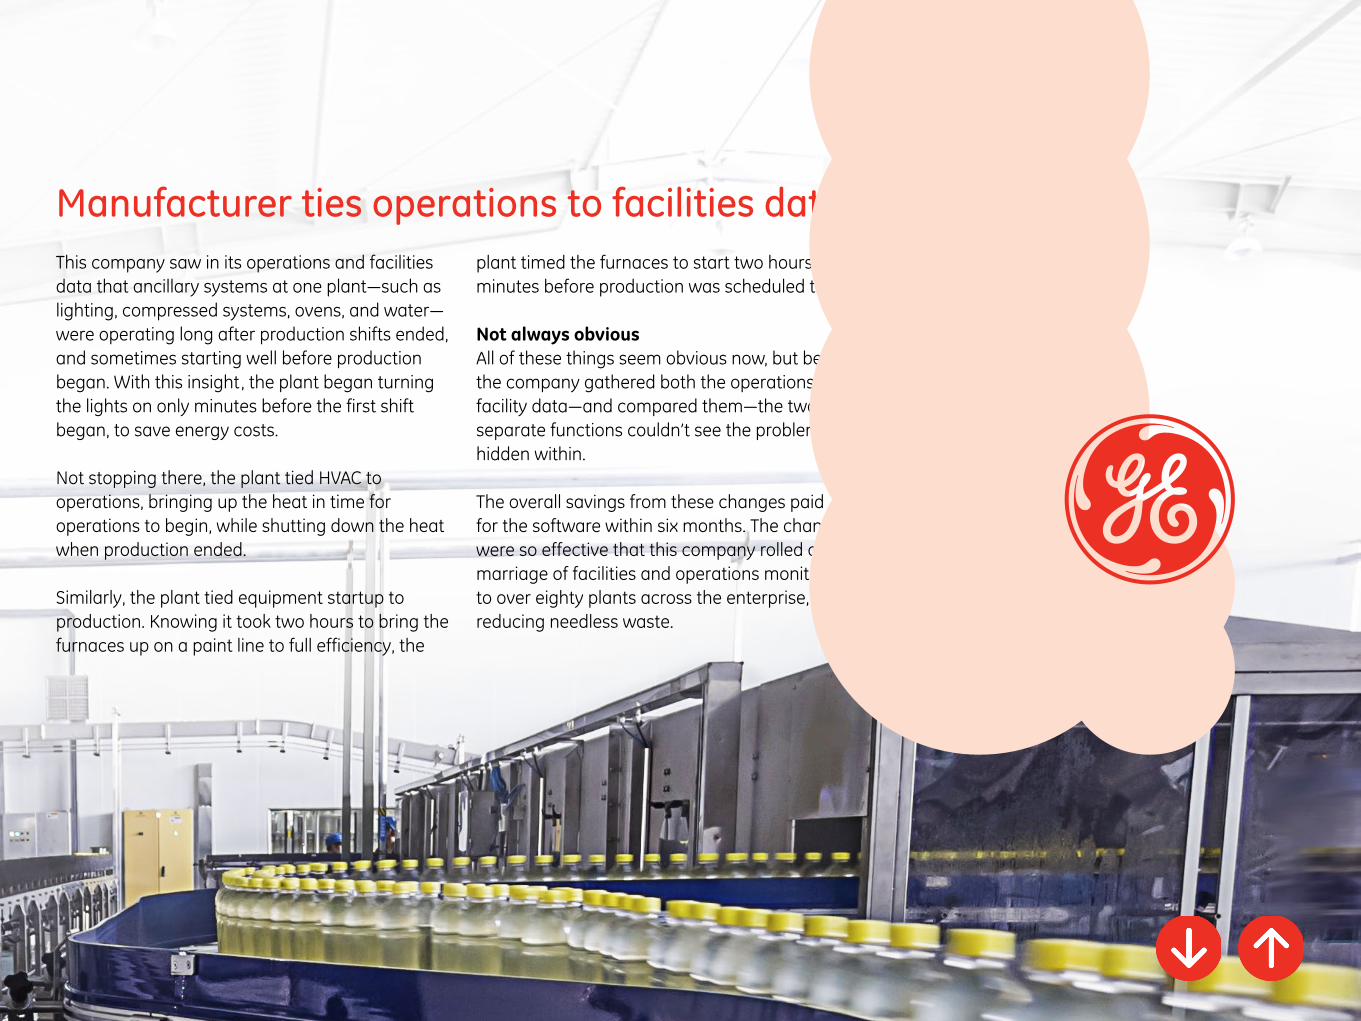
This company saw in its operations and facilities data that ancillary systems at one plant—such as lighting, compressed systems, ovens, and water—were operating long after production shifts ended, and sometimes starting well before production began. With this insight, the plant began turning the lights on only minutes before the first shift began, to save energy costs.
Not stopping there, the plant tied HVAC to operations, bringing up the heat in time for operations to begin, while shutting down the heat when production ended.
Similarly, the plant tied equipment startup to production. Knowing it took two hours to bring the furnaces up on a paint line to full efficiency, the
plant timed the furnaces to start two hours and five minutes before production was scheduled to begin.
Not always obviousAll of these things seem obvious now, but before the company gathered both the operations and facility data—and compared them—the two separate functions couldn’t see the problems hidden within.
The overall savings from these changes paid for the software within six months. The changes were so effective that this company rolled out the marriage of facilities and operations monitoring to over eighty plants across the enterprise, greatly reducing needless waste.
Manufacturer ties operations to facilities data
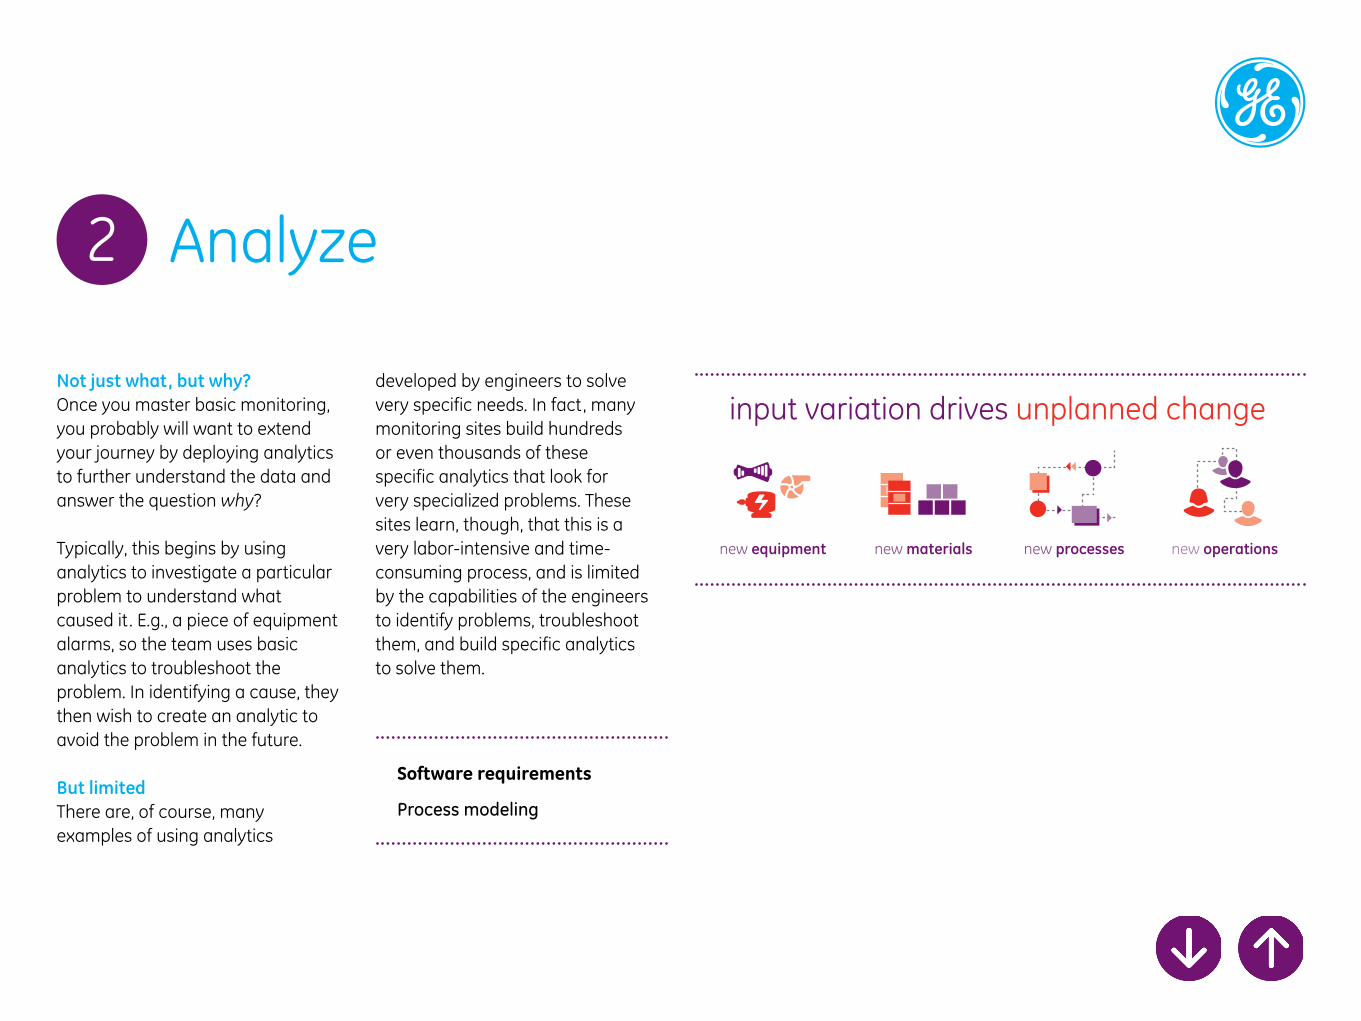
Not just what, but why?Once you master basic monitoring, you probably will want to extend your journey by deploying analytics to further understand the data and answer the question why?
Typically, this begins by using analytics to investigate a particular problem to understand what caused it. E.g., a piece of equipment alarms, so the team uses basic analytics to troubleshoot the problem. In identifying a cause, they then wish to create an analytic to avoid the problem in the future.
But limited There are, of course, many examples of using analytics
developed by engineers to solve very specific needs. In fact, many monitoring sites build hundreds or even thousands of these specific analytics that look for very specialized problems. These sites learn, though, that this is a very labor-intensive and time-consuming process, and is limited by the capabilities of the engineers to identify problems, troubleshoot them, and build specific analytics to solve them.
Analyze2
Software requirements
Process modeling
new equipment new materials new processes new operations
input variation drives unplanned change
Monitoring PID loopsMost companies in most industries use and leverage PID loops to save millions of dollars in unneeded equipment wear-and-tear that can result from large-scale process variability.
Some use analytics to create confidence intervals on the PID loops so they can understand how well the loops behave given process variation. By creating intervals, these companies are able to monitor the intervals as KPIs. When input variation occurs (e.g., new equipment, new materials, new processes, or new operations) and the variation drives unplanned change in
system behavior, these companies can see the confidence intervals decrease. These changes alert the companies to the need to tune their PID loops to the new input realities.
One company was able to monitor its PID loops via GE software, delivered via a remote GE monitoring service. This company learned that many PID loops were running in manual mode because they needed tuning. This customer retuned the loops and saved $2 million. Without the monitoring and analytics, the customer would not have known that the loops needed this service.

At this next level of maturity, you can shift from using self-defined analytics to machine-learning techniques by using predictive-analytic software.
This software can be much more sophisticated and successful at identifying problems earlier and better. It can help you shift from unplanned outages to planned outages, significantly reducing maintenance costs and optimizing asset lifespans.
See the future before it happensPredictive-analytic software can use several techniques, e.g., cluster anal-ysis or similarity-based modeling. These kinds of analytics learn what normal equipment behavior is, and then they predict future behavior. This class of analytic leverages multi-variant analysis techniques, where very complex relationships in data can be modeled accurately, and predicts future states based on any
variation in input. For example, am-bient temperature can be taken into consideration when looking at equip-ment temperature to understand if the current equipment temperature accurately reflects modeled tem-perature based on the current ambi-ent conditions or if the equipment temperature is unusual and requires examination.
$30 million in savingsUsing predictive-analytic software, GE was able to identify unexplained vibration coming from the inside of a combustion turbine. The customer thought that the unusual vibration could be explained away due to
excess load, particularly since the vibration was well within alarm limits. Without the predictive software, the customer would have done nothing, and, in fact, he initially questioned the accuracy of the software vs. his experience and the control alarms. Through continued monitoring and tracking with the software, though, GE monitoring engineers were able to convince the customer to shut down operations to perform more detailed diagnostics on the turbine to analyze the vibration. In this case, visual inspection was needed via a boroscope.
What the customer saw amazed him. One blade inside the turbine had cracked and was within 3-5 days of liberation. If the blade had broken, it would have shattered the internals of the turbine, possibly resulting in $30 million+ in replacement and lost-production costs. Instead, a scheduled outage avoided production loss and excessive turbine repair costs.
The predictive-analytic software was able to “predict” this problem before it happened.
Predict3
“Operators have to trust the analytics more than their own brains.”
Automation World, October 2013
3-5 daysfrom liberation
$30MM
in replacement costsand lost production
Software requirements
Asset health modeling

An example of a “small problem” that was detected early with predictive-analytic software happened at a facility in a remote part of Russia, which was operating a lights-out facility, and GE was monitoring the facility with its software out of GE’s remote monitoring center near Chicago. GE alerted its customer to a vibration issue with the key asset, identified by the software but not identified by the control alarms. The customer sent out a technician, who found that a footing bolt had come loose. He tightened the bolt, and the issue was fixed.
If the bolt at that remote location had stayed loose, the customer could have had a much bigger problem on its hands down the line. Because the software is so sensitive, though, it can identify abnormalities further and further into the future—sometimes weeks or months ahead of time—and can prevent small issues, like a loose bolt, from becoming big and expensive problems.
How the software works
With GE’s predictive-analytic software, users are warned of future problems. The software provides alerts well ahead of hard alarms, which are set wide to accommodate all possible highs and lows under all possible ambient conditions. The GE predictive software, though, takes into consideration the ambient, load, and speed conditions for each specific piece of equipment, allowing for precise and dynamic models. The software won’t tell you that your bearing is hot because it is 265 degrees, a pre-determined level. Rather, it will tell you well before it reaches 265, when it is 5-10 degrees higher than it should be given the current load and speed.
What’s the value of a loose bolt?

Stablize, standardize, and optimizeOnce you make the aforementioned leap and trust predictive analytics, you will be ready to move to the final step along the continuum to use more sophisticated software analytics to not only predict equipment problems before they happen but also to stabilize, standardize, and optimize processes.
Some things can’t be done manuallyTypically, advanced process-control and model predictive-control analytics are used to adjust equipment at high speed to variances in input or process in a way that a human operator could never achieve. Done with real-time data, industrial process-optimization analytics run as closed-loop systems often at the point of control within the controls hardware.
Optimize4
Software requirements
Advanced process controls
proc
ess
stabilize optimize
Huge productivity increase for drying operationOne example is a company that used advanced process control to handle variation in a drying operation where input variability to the dryer often meant that operators would overreact and overdry materials to reduce production risks— such as clogging—from occurring. This conservative practice resulted in lower dryer throughput and higher energy consumption. The net result was that the dryer became a bottleneck that limited overall plant production.
By leveraging advanced process control methods, though, the customer allowed the analytics to determine drying time
based on input variability. As a result, the customer used the proper drying time for each input load. This resulted in 10% more throughput, while also driving down energy costs.
In this case, there was capacity in the system to absorb the 10% increase in throughput from the drying stage, which resulted, therefore, in 10% more throughput for the entire operation.
This resulted in pure profit in the range of $20 million.

Industrial Big Data is about gathering much more data than you’ve ever been able to accumulate—from multiple sources, over longer periods of time—and doing it much more quickly. Comparing and correlating years of diverse historical data to real-time data allows for a myriad of new analysis possibilities, allowing you to rapidly detect trends and patterns never before possible to better understand how equipment and processes are running vs. how they should be running and to help you make even better and quicker decisions
to improve operational performance.
To accomplish this, you need an Industrial Big Data Historian built on Apache™ Hadoop®. Hadoop is a technology specifically designed to handle large data sets by clustering large numbers of low-cost commodity computers together to act as one, in the “cloud.” This makes it possible to analyze much more data, to store it economically, and to get answers in a much more expedited fashion. A historian built on Hadoop can compare data across time and across the enterprise, and it can scale both horizontally for any data volume and variety, and vertically for any velocity.
Add the benefits of Industrial Big Data
Software requirements
Industrial Big Data Historian
Using an Industrial Big Data Historian built on Hadoop, you will be able to ask questions like...
Have I ever seen this start-up sequence in the past ten years—anywhere across my fleet of global assets? What did it mean and how did I fix it? How long did it take to fail? How do I optimize performance of my plant of 50 assets by comparing their performances over the past 12 months? ...and get answers within minutes.
Get answers to
questions you couldn’t ask
before.

Ready to take the next step?After reading the above, you probably understand where you are on the journey towards optimizing your productivity. And, if I’ve done my job right, you also understand what steps you still need to take to add even more value to your operation.
If you take it one step at a time, you’ll be able to accomplish your goals. We’re here to help you make that happen. Get started with GE.
Get Connected > Get Insights > Get Optimized
www.ge.com/digital

Contact informationAmericas: 1-855-YOUR1GE (1-855-968-7143) [email protected]
www.ge.com/digital
©2015 General Electric. All rights reserved. *Trademark of General Electric. All other brands or names are property of their respective holders. Specifications are subject to change without notice.
About GEGE (NYSE: GE) is the world’s Digital Industrial Company, transforming industry with software-defined machines and solutions that are connected, responsive and predictive. GE is organized around a global exchange of knowledge, the "GE Store," through which each business shares and accesses the same technology, markets, structure and intellect. Each invention further fuels innovation and application across our industrial sectors. With people, services, technology and scale, GE delivers better outcomes for customers by speaking the language of industry. www.ge.com
davidcaldwell
Typewritten Text