
CONJUGATE HEAT TRANSFER STUDY OF A CENTRIFUGAL COMPRESSOR ...€¦ · centrifugal compressor and...
9
Proceedings of Global Power and Propulsion Society Technical Conference 2019 16 th – 17 th January, 2019 www.gpps.global This work is licensed under a Creative Commons Attribution-NonCommercial-NoDerivatives 4.0 International License CC-BY-NC-ND 4.0 GPPS-TC-2019-0054 CONJUGATE HEAT TRANSFER STUDY OF A CENTRIFUGAL COMPRESSOR WITH IMPELLER CAVITIES Maurice Stahl MAN Energy Solutions SE [email protected] Oberhausen, Germany Dr.-Ing. Holger Franz MAN Energy Solutions SE [email protected] Oberhausen, Germany Dr.-Ing. Lutz Itter MAN Energy Solutions SE [email protected] Oberhausen, Germany ABSTRACT In this study the effects of heat transfer on the rotor- stator cavity temperatures and the characteristics of one industrial, single stage centrifugal compressor are examined. A baseline Computational Fluid Dynamics (CFD) analysis of the fluid with adiabatic (AD) boundary conditions is conducted. The relevant solid bodies are added to the model and a Conjugate Heat Transfer (CHT) calculation of the machine is performed. The two models are compared and validated by experimental data. Most research regarding heat transfer in centrifugal compressors focusses on turbocharger or gas turbine applications, where a significant heat flux from the adjacent turbine is expected. Industrial compressors are often treated as adiabatic. Some publications include the solid body of the impeller in the calculation, but cavities are often not in the focus of the study. Efforts to obtain reliable Heat Transfer Coefficients (HTC) by employing simple correlations for the impeller flow in the presence of a shroud cavity leakage have not yet proven to be successful. When comparing the CHT and the adiabatic model, differences can be observed in wall- and cavity flow temperatures. The adiabatic approach exceeds the measured cavity temperatures by 40%, whereas the CHT calculation yields significantly better results and stays within a margin of error of 1-4%. Additionally, the qualitative temperature distribution and calculated frictional power loss of both models differ noticeably. The bulk flow seems nearly unchanged and the adiabatic approach proves to be sufficient to describe overall compressor performance. Differences in efficiency, total pressure ratio and total temperature ratio between the two models are negligible. For machines engineered to maximum mechanical loads, with tight restrictions in fluid temperature, or if thermal expansion of the components is critical (e.g. tight sealing clearances), a CHT simulation is recommended for more accurate temperature predictions. INTRODUCTION The optimal design strategy for turbomachinery components requires a good understanding of the thermo- and fluid-dynamical processes. Of equal interest are the structural-mechanical properties. Both fields are influenced by the fluid- and solid body temperatures. In some industrial applications of centrifugal compressors, certain gas temperatures must not be exceeded to prevent exothermal decay of the gas. From a mechanical viewpoint, the solid temperatures greatly influence material properties, strain, stress and therefore the structural integrity of the design. Given the right boundary conditions, modern CFD codes are, within a certain degree of accuracy, capable of predicting the temperature distribution in the flow. But obtaining the right boundary conditions is critical. Adiabatic walls represent a widely used assumption in comparatively low temperature applications like centrifugal compressors. CHT calculations, which are often used in high temperature environments such as gas turbines or turbochargers, can shift the problem: By including the solid bodies in the CFD calculation, heat transfer through the bodies eliminates the need for temperature or heat flux assumptions at fluid wall boundaries. But modelling effort increases and valid boundary conditions at external solid walls are still necessary. (Bohn et al., 2005) show that a full CHT calculation of a centrifugal compressor in a turbocharger has significant influence on the compression process and efficiency. (Borm et al., 2011) include the solid body of the impeller in a CHT calculation. Only a small impact on efficiency was found. In both studies, cavity flows were not extensively researched. By comparison with a full CHT including cavity modelling (Kluck et al., 2006) found that simple 1D correlations for HTCs are often not valid and that secondary flows complicate heat transfer predictions.
Transcript of CONJUGATE HEAT TRANSFER STUDY OF A CENTRIFUGAL COMPRESSOR ...€¦ · centrifugal compressor and...
Proceedings of Global Power and Propulsion Society Technical Conference 2019
16th – 17th January, 2019 www.gpps.global
This work is licensed under a Creative Commons Attribution-NonCommercial-NoDerivatives 4.0 International License CC-BY-NC-ND 4.0
GPPS-TC-2019-0054
CONJUGATE HEAT TRANSFER STUDY OF A CENTRIFUGAL COMPRESSOR WITH IMPELLER CAVITIES
Maurice Stahl MAN Energy Solutions SE [email protected]
Oberhausen, Germany
Dr.-Ing. Holger Franz MAN Energy Solutions SE [email protected]
Oberhausen, Germany
Dr.-Ing. Lutz Itter MAN Energy Solutions SE
[email protected] Oberhausen, Germany
ABSTRACT
In this study the effects of heat transfer on the rotor-
stator cavity temperatures and the characteristics of one
industrial, single stage centrifugal compressor are examined.
A baseline Computational Fluid Dynamics (CFD) analysis of
the fluid with adiabatic (AD) boundary conditions is
conducted. The relevant solid bodies are added to the model
and a Conjugate Heat Transfer (CHT) calculation of the
machine is performed. The two models are compared and
validated by experimental data.
Most research regarding heat transfer in centrifugal
compressors focusses on turbocharger or gas turbine
applications, where a significant heat flux from the adjacent
turbine is expected. Industrial compressors are often treated
as adiabatic. Some publications include the solid body of the
impeller in the calculation, but cavities are often not in the
focus of the study. Efforts to obtain reliable Heat Transfer
Coefficients (HTC) by employing simple correlations for the
impeller flow in the presence of a shroud cavity leakage have
not yet proven to be successful.
When comparing the CHT and the adiabatic model,
differences can be observed in wall- and cavity flow
temperatures. The adiabatic approach exceeds the measured
cavity temperatures by 40%, whereas the CHT calculation
yields significantly better results and stays within a margin of
error of 1-4%. Additionally, the qualitative temperature
distribution and calculated frictional power loss of both
models differ noticeably.
The bulk flow seems nearly unchanged and the adiabatic
approach proves to be sufficient to describe overall
compressor performance. Differences in efficiency, total
pressure ratio and total temperature ratio between the two
models are negligible.
For machines engineered to maximum mechanical
loads, with tight restrictions in fluid temperature, or if
thermal expansion of the components is critical (e.g. tight
sealing clearances), a CHT simulation is recommended for
more accurate temperature predictions.
INTRODUCTION
The optimal design strategy for turbomachinery
components requires a good understanding of the thermo-
and fluid-dynamical processes. Of equal interest are the
structural-mechanical properties. Both fields are influenced
by the fluid- and solid body temperatures. In some industrial
applications of centrifugal compressors, certain gas
temperatures must not be exceeded to prevent exothermal
decay of the gas. From a mechanical viewpoint, the solid
temperatures greatly influence material properties, strain,
stress and therefore the structural integrity of the design.
Given the right boundary conditions, modern CFD codes
are, within a certain degree of accuracy, capable of
predicting the temperature distribution in the flow. But
obtaining the right boundary conditions is critical.
Adiabatic walls represent a widely used assumption in
comparatively low temperature applications like centrifugal
compressors. CHT calculations, which are often used in high
temperature environments such as gas turbines or
turbochargers, can shift the problem: By including the solid
bodies in the CFD calculation, heat transfer through the
bodies eliminates the need for temperature or heat flux
assumptions at fluid wall boundaries. But modelling effort
increases and valid boundary conditions at external solid
walls are still necessary.
(Bohn et al., 2005) show that a full CHT calculation of a
centrifugal compressor in a turbocharger has significant
influence on the compression process and efficiency.
(Borm et al., 2011) include the solid body of the
impeller in a CHT calculation. Only a small impact on
efficiency was found. In both studies, cavity flows were not
extensively researched.
By comparison with a full CHT including cavity
modelling (Kluck et al., 2006) found that simple 1D
correlations for HTCs are often not valid and that secondary
flows complicate heat transfer predictions.
2
(Lei et al., 2007) introduced a so called “fast CHT”
method, by connecting a 1D flow solver to a solid body
model. The body temperatures of a previous full CHT
calculation could be approximated, but cavity leakages were
not further researched.
Literature shows that the inclusion of rotor-stator
cavities is crucial to the correct reproduction of stage
characteristics:
(Hu et al., 2017) and (Sun et al., 2009), amongst others,
research centripetal flow through rotor-stator cavities and
show how axial thrust and disk torque are affected.
(Guidotti et al., 2012) show the influence of cavity
modelling on the efficiency and pressure ratio.
(Mischo et al., 2009) find that the shroud cavity leakage
can induce flow separation and thereby severely influence
compressor performance.
In most studies, the walls are modelled as adiabatic. But
especially in rotor-stator cavities, where disc friction heats up
the flow, this simplification yields comparatively high
temperatures since heat can only be transported over domain
boundaries by a through-flow.
The aim of this study is to examine the influence of a
CHT calculation on the cavity temperatures in an industrial
centrifugal compressor and the effects on wall temperatures
and compressor performance.
METHODOLOGY
Experimental Setup
The measurement of the examined centrifugal
compressor stage was conducted back in 2011. The
experimental data was collected during the development
phase of a new stage design. It was chosen for this paper due
to the fact that cavity temperatures were measured and an
impact of cavity flow on the stage performance was
suspected.
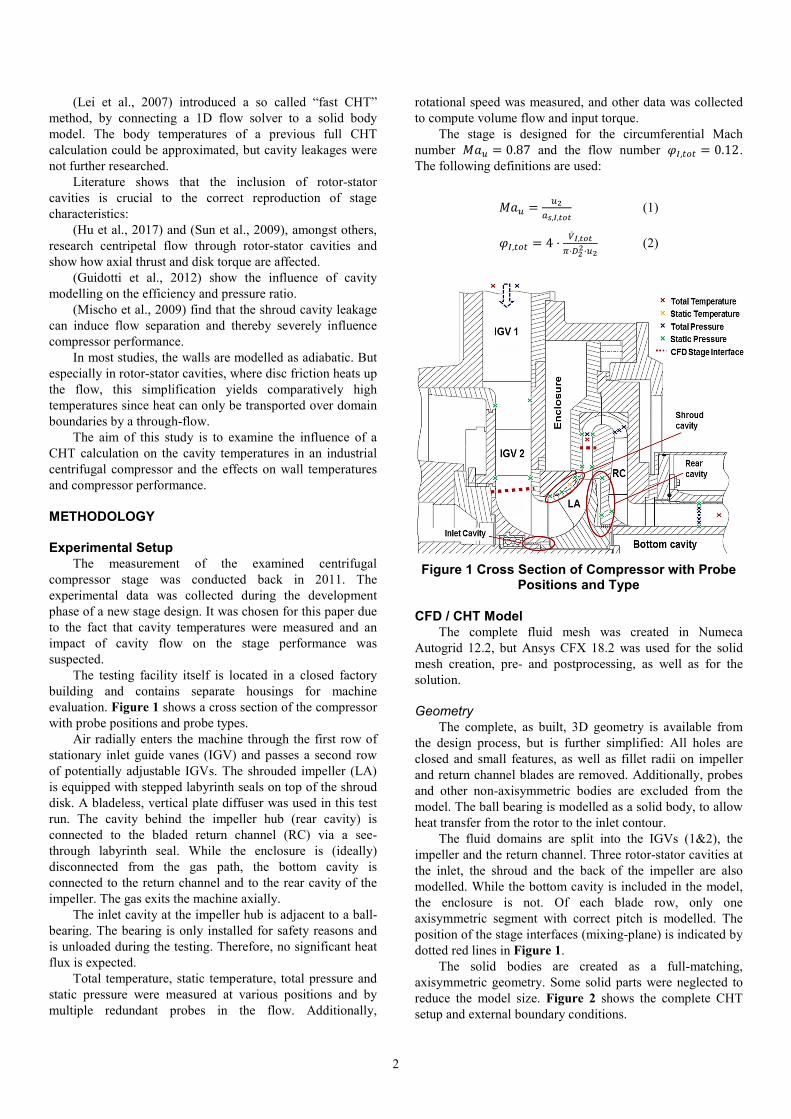
The testing facility itself is located in a closed factory
building and contains separate housings for machine
evaluation. Figure 1 shows a cross section of the compressor
with probe positions and probe types.
Air radially enters the machine through the first row of
stationary inlet guide vanes (IGV) and passes a second row
of potentially adjustable IGVs. The shrouded impeller (LA)
is equipped with stepped labyrinth seals on top of the shroud
disk. A bladeless, vertical plate diffuser was used in this test
run. The cavity behind the impeller hub (rear cavity) is
connected to the bladed return channel (RC) via a see-
through labyrinth seal. While the enclosure is (ideally)
disconnected from the gas path, the bottom cavity is
connected to the return channel and to the rear cavity of the
impeller. The gas exits the machine axially.
The inlet cavity at the impeller hub is adjacent to a ball-
bearing. The bearing is only installed for safety reasons and
is unloaded during the testing. Therefore, no significant heat
flux is expected.
Total temperature, static temperature, total pressure and
static pressure were measured at various positions and by
multiple redundant probes in the flow. Additionally,
rotational speed was measured, and other data was collected
to compute volume flow and input torque.
The stage is designed for the circumferential Mach
number ��� � 0.87 and the flow number ,� � � 0.12.
The following definitions are used:
��� � ��
��,�,��� (1)
,� � � 4 ⋅ �� �,���
�⋅���⋅��
(2)
Figure 1 Cross Section of Compressor with Probe Positions and Type
CFD / CHT Model
The complete fluid mesh was created in Numeca
Autogrid 12.2, but Ansys CFX 18.2 was used for the solid
mesh creation, pre- and postprocessing, as well as for the
solution.
Geometry
The complete, as built, 3D geometry is available from
the design process, but is further simplified: All holes are
closed and small features, as well as fillet radii on impeller
and return channel blades are removed. Additionally, probes
and other non-axisymmetric bodies are excluded from the
model. The ball bearing is modelled as a solid body, to allow
heat transfer from the rotor to the inlet contour.
The fluid domains are split into the IGVs (1&2), the
impeller and the return channel. Three rotor-stator cavities at
the inlet, the shroud and the back of the impeller are also
modelled. While the bottom cavity is included in the model,
the enclosure is not. Of each blade row, only one
axisymmetric segment with correct pitch is modelled. The
position of the stage interfaces (mixing-plane) is indicated by
dotted red lines in Figure 1.
The solid bodies are created as a full-matching,
axisymmetric geometry. Some solid parts were neglected to
reduce the model size. Figure 2 shows the complete CHT
setup and external boundary conditions.
3
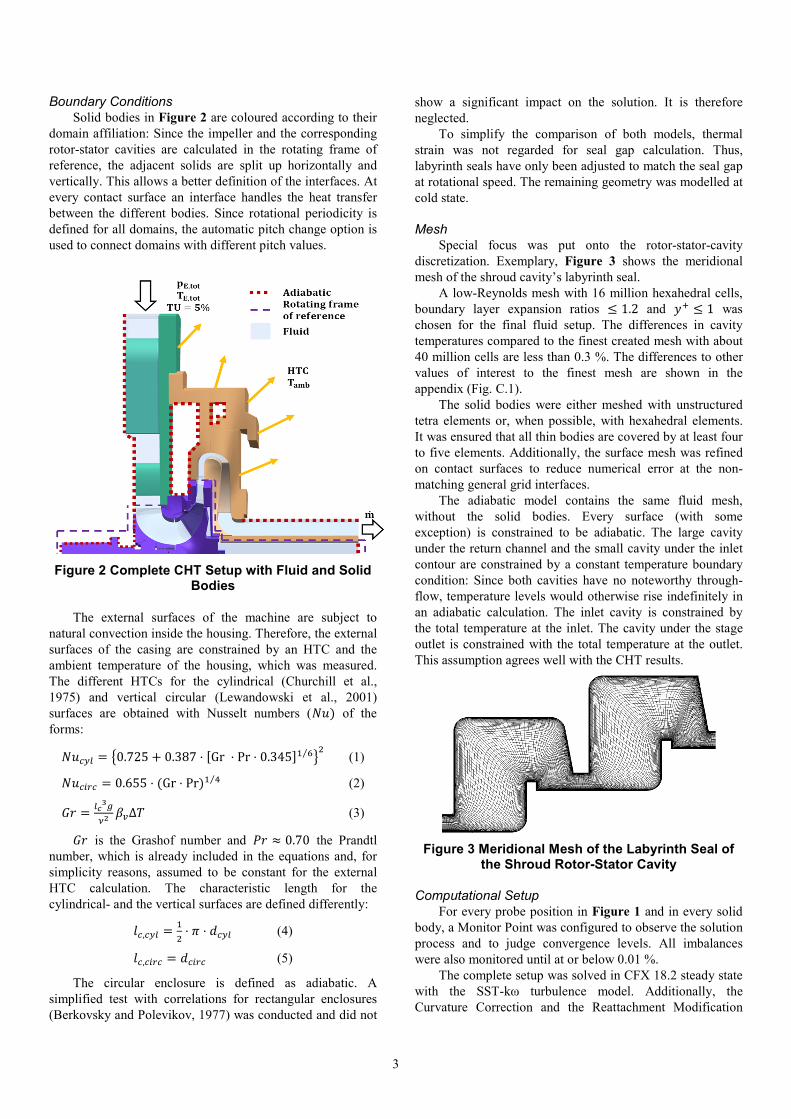
Boundary Conditions
Solid bodies in Figure 2 are coloured according to their
domain affiliation: Since the impeller and the corresponding
rotor-stator cavities are calculated in the rotating frame of
reference, the adjacent solids are split up horizontally and
vertically. This allows a better definition of the interfaces. At
every contact surface an interface handles the heat transfer
between the different bodies. Since rotational periodicity is
defined for all domains, the automatic pitch change option is
used to connect domains with different pitch values.
Figure 2 Complete CHT Setup with Fluid and Solid Bodies
The external surfaces of the machine are subject to
natural convection inside the housing. Therefore, the external
surfaces of the casing are constrained by an HTC and the
ambient temperature of the housing, which was measured.
The different HTCs for the cylindrical (Churchill et al.,
1975) and vertical circular (Lewandowski et al., 2001)
surfaces are obtained with Nusselt numbers (��� of the
forms:
��� ! � "0.725 $ 0.387 ⋅ &Gr ⋅ Pr ⋅ 0.345+, -⁄ /0 (1)
���12� � 0.655 ⋅ 4Gr ⋅ Pr�, 5⁄ (2)
67 � !89:
;� <=Δ? (3)
67 is the Grashof number and @7 A 0.70 the Prandtl
number, which is already included in the equations and, for
simplicity reasons, assumed to be constant for the external
HTC calculation. The characteristic length for the
cylindrical- and the vertical surfaces are defined differently:
B�,� ! � ,
0⋅ C ⋅ D� ! (4)
B�,�12� � D�12� (5)
The circular enclosure is defined as adiabatic. A
simplified test with correlations for rectangular enclosures
(Berkovsky and Polevikov, 1977) was conducted and did not
show a significant impact on the solution. It is therefore
neglected.
To simplify the comparison of both models, thermal
strain was not regarded for seal gap calculation. Thus,
labyrinth seals have only been adjusted to match the seal gap
at rotational speed. The remaining geometry was modelled at
cold state.
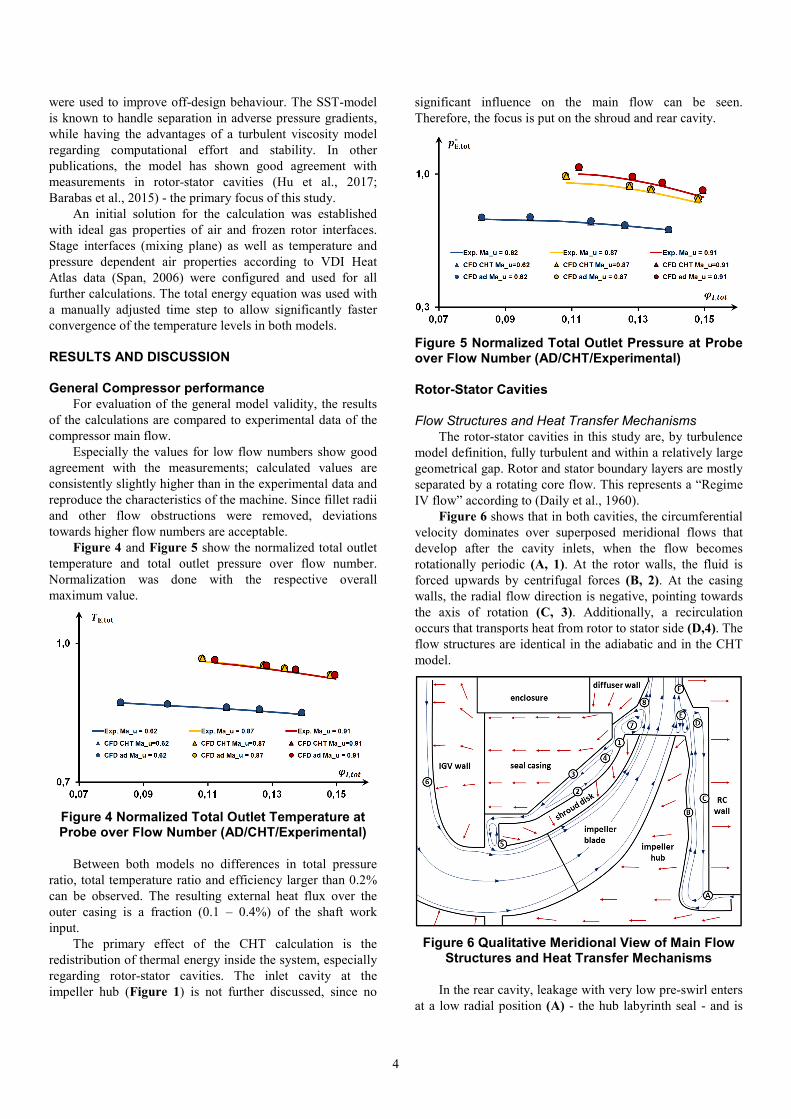
Mesh
Special focus was put onto the rotor-stator-cavity
discretization. Exemplary, Figure 3 shows the meridional
mesh of the shroud cavity’s labyrinth seal.
A low-Reynolds mesh with 16 million hexahedral cells,
boundary layer expansion ratios E 1.2 and FG E 1 was
chosen for the final fluid setup. The differences in cavity
temperatures compared to the finest created mesh with about
40 million cells are less than 0.3 %. The differences to other
values of interest to the finest mesh are shown in the
appendix (Fig. C.1).
The solid bodies were either meshed with unstructured
tetra elements or, when possible, with hexahedral elements.
It was ensured that all thin bodies are covered by at least four
to five elements. Additionally, the surface mesh was refined
on contact surfaces to reduce numerical error at the non-
matching general grid interfaces.
The adiabatic model contains the same fluid mesh,
without the solid bodies. Every surface (with some
exception) is constrained to be adiabatic. The large cavity
under the return channel and the small cavity under the inlet
contour are constrained by a constant temperature boundary
condition: Since both cavities have no noteworthy through-
flow, temperature levels would otherwise rise indefinitely in
an adiabatic calculation. The inlet cavity is constrained by
the total temperature at the inlet. The cavity under the stage
outlet is constrained with the total temperature at the outlet.
This assumption agrees well with the CHT results.
Figure 3 Meridional Mesh of the Labyrinth Seal of the Shroud Rotor-Stator Cavity
Computational Setup
For every probe position in Figure 1 and in every solid
body, a Monitor Point was configured to observe the solution
process and to judge convergence levels. All imbalances
were also monitored until at or below 0.01 %.
The complete setup was solved in CFX 18.2 steady state
with the SST-kω turbulence model. Additionally, the
Curvature Correction and the Reattachment Modification
4
were used to improve off-design behaviour. The SST-model
is known to handle separation in adverse pressure gradients,
while having the advantages of a turbulent viscosity model
regarding computational effort and stability. In other
publications, the model has shown good agreement with
measurements in rotor-stator cavities (Hu et al., 2017;
Barabas et al., 2015) - the primary focus of this study.
An initial solution for the calculation was established
with ideal gas properties of air and frozen rotor interfaces.
Stage interfaces (mixing plane) as well as temperature and
pressure dependent air properties according to VDI Heat
Atlas data (Span, 2006) were configured and used for all
further calculations. The total energy equation was used with
a manually adjusted time step to allow significantly faster
convergence of the temperature levels in both models.
RESULTS AND DISCUSSION
General Compressor performance
For evaluation of the general model validity, the results
of the calculations are compared to experimental data of the
compressor main flow.
Especially the values for low flow numbers show good
agreement with the measurements; calculated values are
consistently slightly higher than in the experimental data and
reproduce the characteristics of the machine. Since fillet radii
and other flow obstructions were removed, deviations
towards higher flow numbers are acceptable.
Figure 4 and Figure 5 show the normalized total outlet
temperature and total outlet pressure over flow number.
Normalization was done with the respective overall
maximum value.
Figure 4 Normalized Total Outlet Temperature at Probe over Flow Number (AD/CHT/Experimental)
Between both models no differences in total pressure
ratio, total temperature ratio and efficiency larger than 0.2%
can be observed. The resulting external heat flux over the
outer casing is a fraction (0.1 – 0.4%) of the shaft work
input.
The primary effect of the CHT calculation is the
redistribution of thermal energy inside the system, especially
regarding rotor-stator cavities. The inlet cavity at the
impeller hub (Figure 1) is not further discussed, since no
significant influence on the main flow can be seen.
Therefore, the focus is put on the shroud and rear cavity.
Figure 5 Normalized Total Outlet Pressure at Probe over Flow Number (AD/CHT/Experimental)
Rotor-Stator Cavities
Flow Structures and Heat Transfer Mechanisms
The rotor-stator cavities in this study are, by turbulence
model definition, fully turbulent and within a relatively large
geometrical gap. Rotor and stator boundary layers are mostly
separated by a rotating core flow. This represents a “Regime
IV flow” according to (Daily et al., 1960).
Figure 6 shows that in both cavities, the circumferential
velocity dominates over superposed meridional flows that
develop after the cavity inlets, when the flow becomes
rotationally periodic (A, 1). At the rotor walls, the fluid is
forced upwards by centrifugal forces (B, 2). At the casing
walls, the radial flow direction is negative, pointing towards
the axis of rotation (C, 3). Additionally, a recirculation
occurs that transports heat from rotor to stator side (D,4). The
flow structures are identical in the adiabatic and in the CHT
model.
Figure 6 Qualitative Meridional View of Main Flow Structures and Heat Transfer Mechanisms
In the rear cavity, leakage with very low pre-swirl enters
at a low radial position (A) - the hub labyrinth seal - and is
5
accelerated upwards at the impeller wall (B). The re-entering
of the leakage into the compressor main flow is characterized
by strong swirling over the edge of the impeller (E), before
re-entering mainly on the suction side of the blade (3D
effect) (F).
The flow at the shroud cavity’s inlet (1) is characterized
by a pre-swirl originating from the impeller main flow. An
eddy over the blunt edge of the shroud disk (7) blocks most
of the cavity’s inlet. As a result, the leakage flow on the
pressure side of the blade is forced into the cavity at the
casing wall while a portion recirculates around the eddy (7).
On the blades suction side, a partial amount of the previously
circulating flow re-enters the main flow path (8). Therefore,
two heated streaks of leakage pass along the diffuser and the
return channel walls (F, 8).
The remaining leakage of the shroud cavity descends at
the seal casing (3) and exits at the impeller inlet (5). It
continues to flow alongside the shroud disk. As a result, the
convective heat transport in the cavities strongly depends on
leakage direction and mass flow.
Heat Flux
For the CHT model, the direction of the heat flux density
inside the surrounding solid bodies (represented by red
arrows in Figure 6) can be derived from the body
temperatures and Fourier’s law:
H⃗� � JKL ⋅ ∇? (6)
Thermal energy in the shroud cavity is transported to the
main flow through the shroud disk, the impeller blade and
the seal casing. This results in a pre-heating effect of the flow
at the IGV wall (6). The rear cavity is primarily cooled by
the impeller hub and secondarily by the return channel wall.
Due to rising temperatures towards the impeller outlet,
the temperature difference between the main flow and the
cavities decreases. At the shroud cavity outlet (5) the hot, re-
entering leakage impedes heat flux. Therefore, the heat flux
is directed towards central streamwise locations of the
impeller (exaggerated in Figure 6, for illustrative purposes).
The heat flux parallel to the enclosure wall is evidence
of the adiabatic wall boundary condition.
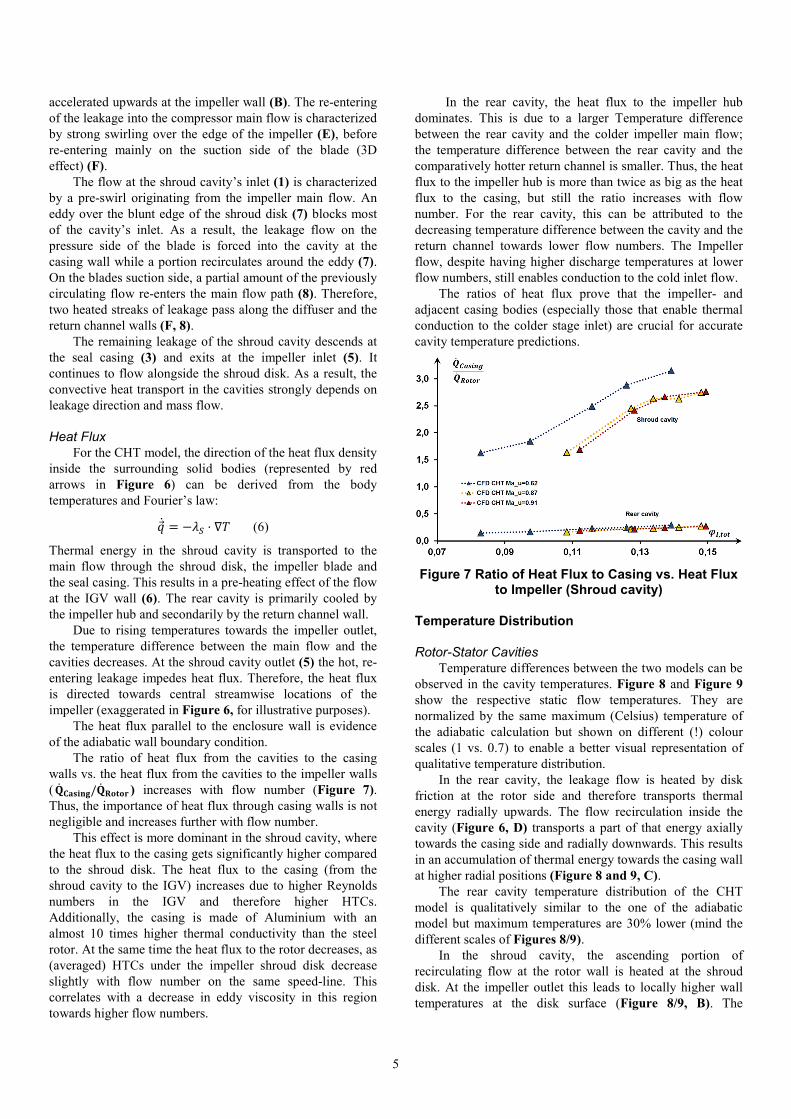
The ratio of heat flux from the cavities to the casing
walls vs. the heat flux from the cavities to the impeller walls
( N� OPQRST/N� VWXWY ) increases with flow number (Figure 7).
Thus, the importance of heat flux through casing walls is not
negligible and increases further with flow number.
This effect is more dominant in the shroud cavity, where
the heat flux to the casing gets significantly higher compared
to the shroud disk. The heat flux to the casing (from the
shroud cavity to the IGV) increases due to higher Reynolds
numbers in the IGV and therefore higher HTCs.
Additionally, the casing is made of Aluminium with an
almost 10 times higher thermal conductivity than the steel
rotor. At the same time the heat flux to the rotor decreases, as
(averaged) HTCs under the impeller shroud disk decrease
slightly with flow number on the same speed-line. This
correlates with a decrease in eddy viscosity in this region
towards higher flow numbers.
In the rear cavity, the heat flux to the impeller hub
dominates. This is due to a larger Temperature difference
between the rear cavity and the colder impeller main flow;
the temperature difference between the rear cavity and the
comparatively hotter return channel is smaller. Thus, the heat
flux to the impeller hub is more than twice as big as the heat
flux to the casing, but still the ratio increases with flow
number. For the rear cavity, this can be attributed to the
decreasing temperature difference between the cavity and the
return channel towards lower flow numbers. The Impeller
flow, despite having higher discharge temperatures at lower
flow numbers, still enables conduction to the cold inlet flow.
The ratios of heat flux prove that the impeller- and
adjacent casing bodies (especially those that enable thermal
conduction to the colder stage inlet) are crucial for accurate
cavity temperature predictions.
Figure 7 Ratio of Heat Flux to Casing vs. Heat Flux to Impeller (Shroud cavity)
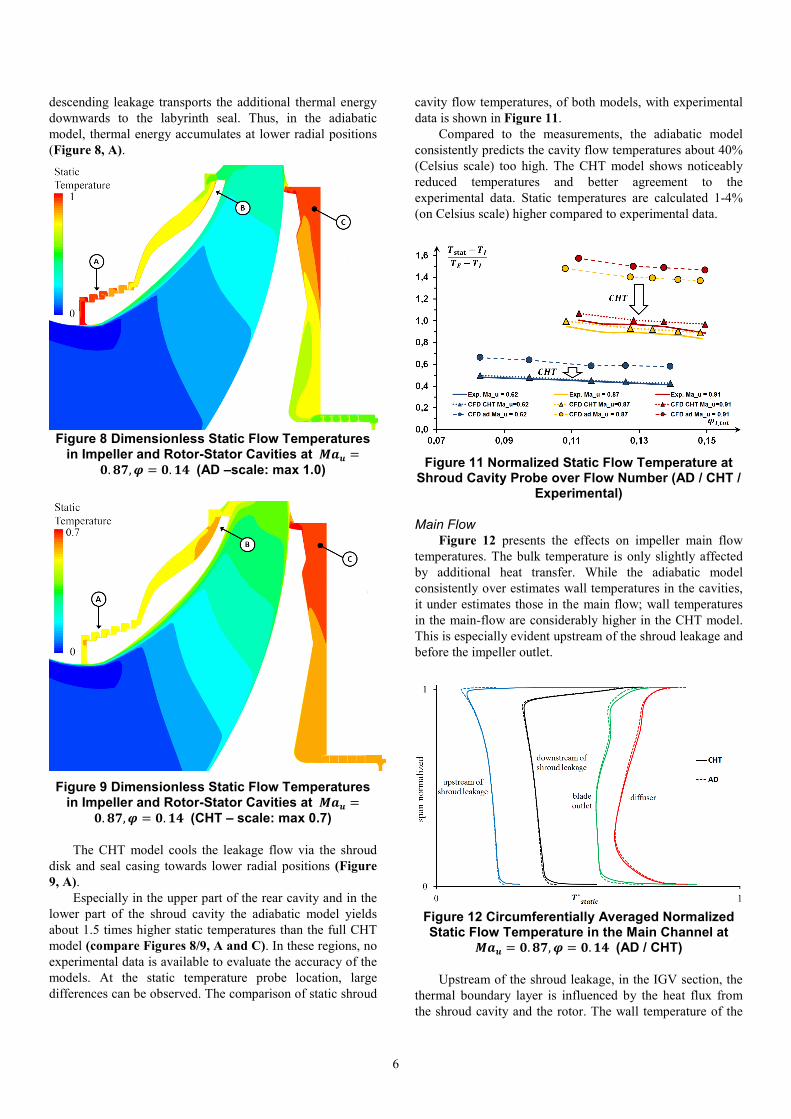
Temperature Distribution
Rotor-Stator Cavities
Temperature differences between the two models can be
observed in the cavity temperatures. Figure 8 and Figure 9
show the respective static flow temperatures. They are
normalized by the same maximum (Celsius) temperature of
the adiabatic calculation but shown on different (!) colour
scales (1 vs. 0.7) to enable a better visual representation of
qualitative temperature distribution.
In the rear cavity, the leakage flow is heated by disk
friction at the rotor side and therefore transports thermal
energy radially upwards. The flow recirculation inside the
cavity (Figure 6, D) transports a part of that energy axially
towards the casing side and radially downwards. This results
in an accumulation of thermal energy towards the casing wall
at higher radial positions (Figure 8 and 9, C).
The rear cavity temperature distribution of the CHT
model is qualitatively similar to the one of the adiabatic
model but maximum temperatures are 30% lower (mind the
different scales of Figures 8/9).
In the shroud cavity, the ascending portion of
recirculating flow at the rotor wall is heated at the shroud
disk. At the impeller outlet this leads to locally higher wall
temperatures at the disk surface (Figure 8/9, B). The
6
descending leakage transports the additional thermal energy
downwards to the labyrinth seal. Thus, in the adiabatic
model, thermal energy accumulates at lower radial positions
(Figure 8, A).
Figure 8 Dimensionless Static Flow Temperatures in Impeller and Rotor-Stator Cavities at Z[\ �
]. ^_, ` � ]. ab (AD –scale: max 1.0)
Figure 9 Dimensionless Static Flow Temperatures in Impeller and Rotor-Stator Cavities at Z[\ �
]. ^_, ` � ]. ab (CHT – scale: max 0.7)
The CHT model cools the leakage flow via the shroud
disk and seal casing towards lower radial positions (Figure
9, A).
Especially in the upper part of the rear cavity and in the
lower part of the shroud cavity the adiabatic model yields
about 1.5 times higher static temperatures than the full CHT
model (compare Figures 8/9, A and C). In these regions, no
experimental data is available to evaluate the accuracy of the
models. At the static temperature probe location, large
differences can be observed. The comparison of static shroud
cavity flow temperatures, of both models, with experimental
data is shown in Figure 11.
Compared to the measurements, the adiabatic model
consistently predicts the cavity flow temperatures about 40%
(Celsius scale) too high. The CHT model shows noticeably
reduced temperatures and better agreement to the
experimental data. Static temperatures are calculated 1-4%
(on Celsius scale) higher compared to experimental data.
Figure 11 Normalized Static Flow Temperature at Shroud Cavity Probe over Flow Number (AD / CHT /
Experimental)
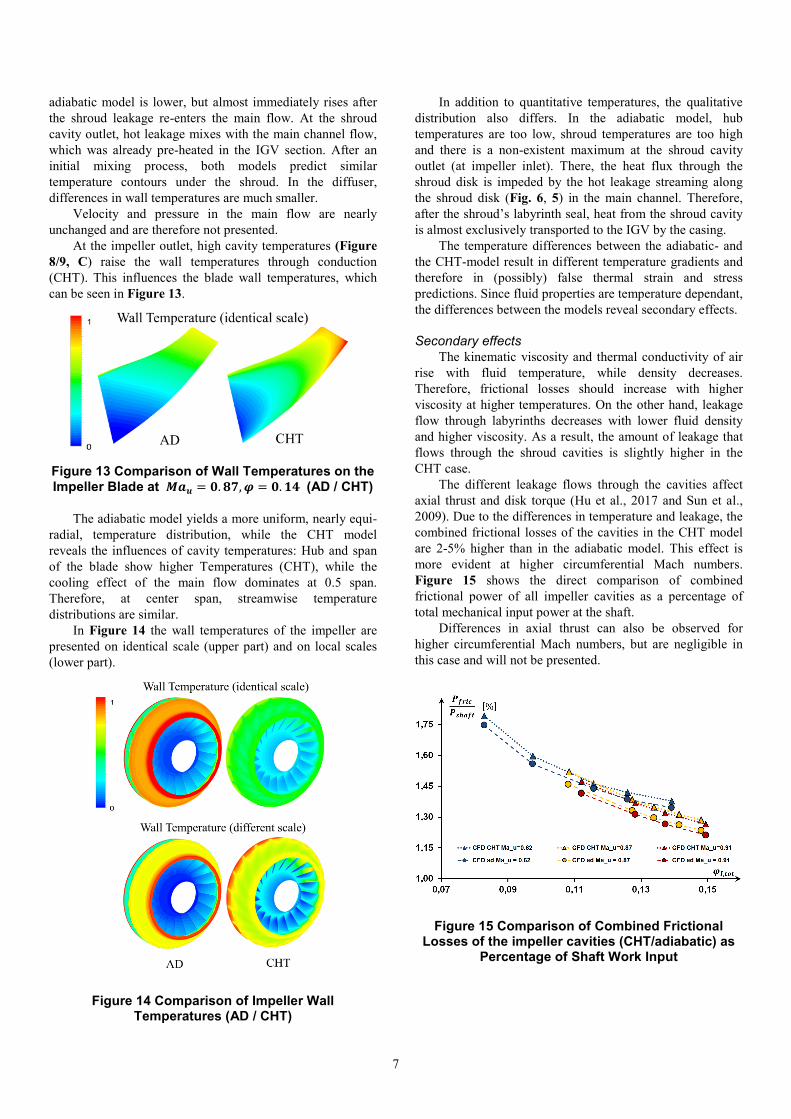
Main Flow
Figure 12 presents the effects on impeller main flow
temperatures. The bulk temperature is only slightly affected
by additional heat transfer. While the adiabatic model
consistently over estimates wall temperatures in the cavities,
it under estimates those in the main flow; wall temperatures
in the main-flow are considerably higher in the CHT model.
This is especially evident upstream of the shroud leakage and
before the impeller outlet.
Figure 12 Circumferentially Averaged Normalized Static Flow Temperature in the Main Channel at
Z[\ � ]. ^_, ` � ]. ab (AD / CHT)
Upstream of the shroud leakage, in the IGV section, the
thermal boundary layer is influenced by the heat flux from
the shroud cavity and the rotor. The wall temperature of the
7
adiabatic model is lower, but almost immediately rises after
the shroud leakage re-enters the main flow. At the shroud
cavity outlet, hot leakage mixes with the main channel flow,
which was already pre-heated in the IGV section. After an
initial mixing process, both models predict similar
temperature contours under the shroud. In the diffuser,
differences in wall temperatures are much smaller.
Velocity and pressure in the main flow are nearly
unchanged and are therefore not presented.
At the impeller outlet, high cavity temperatures (Figure
8/9, C) raise the wall temperatures through conduction
(CHT). This influences the blade wall temperatures, which
can be seen in Figure 13.
Figure 13 Comparison of Wall Temperatures on the Impeller Blade at Z[\ � ]. ^_, ` � ]. ab (AD / CHT)
The adiabatic model yields a more uniform, nearly equi-
radial, temperature distribution, while the CHT model
reveals the influences of cavity temperatures: Hub and span
of the blade show higher Temperatures (CHT), while the
cooling effect of the main flow dominates at 0.5 span.
Therefore, at center span, streamwise temperature
distributions are similar.
In Figure 14 the wall temperatures of the impeller are
presented on identical scale (upper part) and on local scales
(lower part).
Figure 14 Comparison of Impeller Wall Temperatures (AD / CHT)
In addition to quantitative temperatures, the qualitative
distribution also differs. In the adiabatic model, hub
temperatures are too low, shroud temperatures are too high
and there is a non-existent maximum at the shroud cavity
outlet (at impeller inlet). There, the heat flux through the
shroud disk is impeded by the hot leakage streaming along
the shroud disk (Fig. 6, 5) in the main channel. Therefore,
after the shroud’s labyrinth seal, heat from the shroud cavity
is almost exclusively transported to the IGV by the casing.
The temperature differences between the adiabatic- and
the CHT-model result in different temperature gradients and
therefore in (possibly) false thermal strain and stress
predictions. Since fluid properties are temperature dependant,
the differences between the models reveal secondary effects.
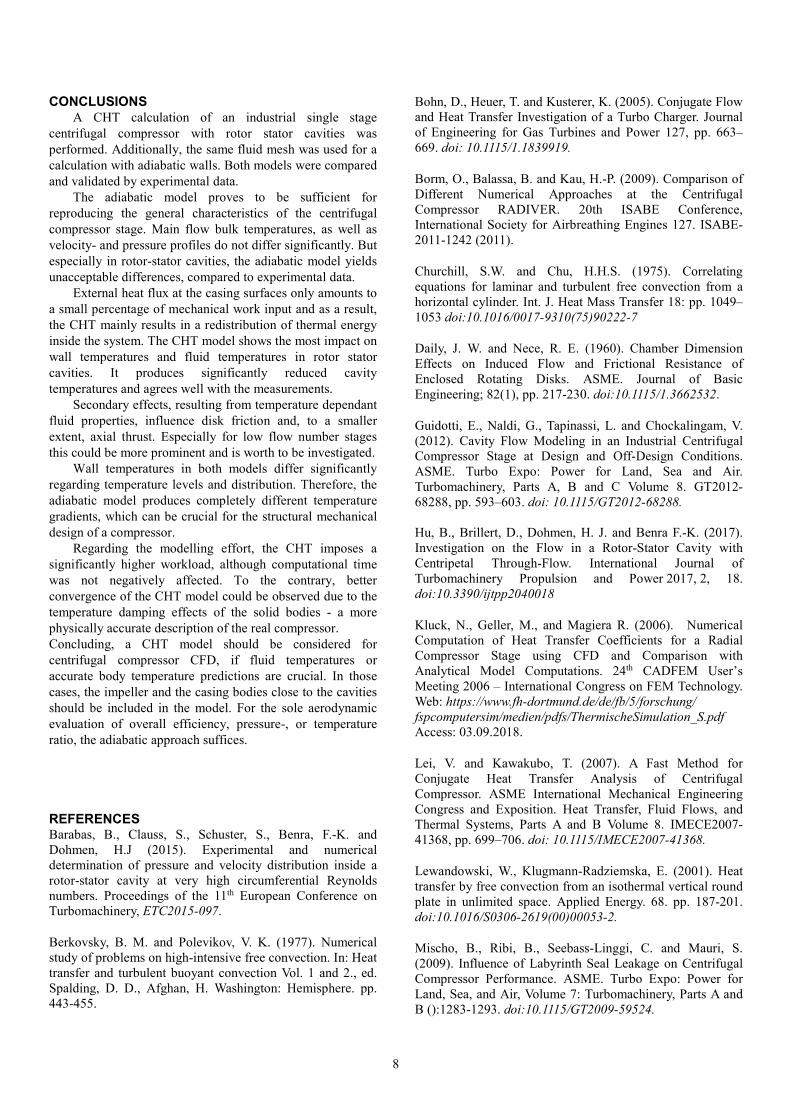
Secondary effects
The kinematic viscosity and thermal conductivity of air
rise with fluid temperature, while density decreases.
Therefore, frictional losses should increase with higher
viscosity at higher temperatures. On the other hand, leakage
flow through labyrinths decreases with lower fluid density
and higher viscosity. As a result, the amount of leakage that
flows through the shroud cavities is slightly higher in the
CHT case.
The different leakage flows through the cavities affect
axial thrust and disk torque (Hu et al., 2017 and Sun et al.,
2009). Due to the differences in temperature and leakage, the
combined frictional losses of the cavities in the CHT model
are 2-5% higher than in the adiabatic model. This effect is
more evident at higher circumferential Mach numbers.
Figure 15 shows the direct comparison of combined
frictional power of all impeller cavities as a percentage of
total mechanical input power at the shaft.
Differences in axial thrust can also be observed for
higher circumferential Mach numbers, but are negligible in
this case and will not be presented.
Figure 15 Comparison of Combined Frictional
Losses of the impeller cavities (CHT/adiabatic) as Percentage of Shaft Work Input
8
CONCLUSIONS
A CHT calculation of an industrial single stage
centrifugal compressor with rotor stator cavities was
performed. Additionally, the same fluid mesh was used for a
calculation with adiabatic walls. Both models were compared
and validated by experimental data.
The adiabatic model proves to be sufficient for
reproducing the general characteristics of the centrifugal
compressor stage. Main flow bulk temperatures, as well as
velocity- and pressure profiles do not differ significantly. But
especially in rotor-stator cavities, the adiabatic model yields
unacceptable differences, compared to experimental data.
External heat flux at the casing surfaces only amounts to
a small percentage of mechanical work input and as a result,
the CHT mainly results in a redistribution of thermal energy
inside the system. The CHT model shows the most impact on
wall temperatures and fluid temperatures in rotor stator
cavities. It produces significantly reduced cavity
temperatures and agrees well with the measurements.
Secondary effects, resulting from temperature dependant
fluid properties, influence disk friction and, to a smaller
extent, axial thrust. Especially for low flow number stages
this could be more prominent and is worth to be investigated.
Wall temperatures in both models differ significantly
regarding temperature levels and distribution. Therefore, the
adiabatic model produces completely different temperature
gradients, which can be crucial for the structural mechanical
design of a compressor.
Regarding the modelling effort, the CHT imposes a
significantly higher workload, although computational time
was not negatively affected. To the contrary, better
convergence of the CHT model could be observed due to the
temperature damping effects of the solid bodies - a more
physically accurate description of the real compressor.
Concluding, a CHT model should be considered for
centrifugal compressor CFD, if fluid temperatures or
accurate body temperature predictions are crucial. In those
cases, the impeller and the casing bodies close to the cavities
should be included in the model. For the sole aerodynamic
evaluation of overall efficiency, pressure-, or temperature
ratio, the adiabatic approach suffices.
REFERENCES Barabas, B., Clauss, S., Schuster, S., Benra, F.-K. and
Dohmen, H.J (2015). Experimental and numerical
determination of pressure and velocity distribution inside a
rotor-stator cavity at very high circumferential Reynolds
numbers. Proceedings of the 11th European Conference on
Turbomachinery, ETC2015-097.
Berkovsky, B. M. and Polevikov, V. K. (1977). Numerical
study of problems on high-intensive free convection. In: Heat
transfer and turbulent buoyant convection Vol. 1 and 2., ed.
Spalding, D. D., Afghan, H. Washington: Hemisphere. pp.
443-455.
Bohn, D., Heuer, T. and Kusterer, K. (2005). Conjugate Flow
and Heat Transfer Investigation of a Turbo Charger. Journal
of Engineering for Gas Turbines and Power 127, pp. 663–
669. doi: 10.1115/1.1839919.
Borm, O., Balassa, B. and Kau, H.-P. (2009). Comparison of
Different Numerical Approaches at the Centrifugal
Compressor RADIVER. 20th ISABE Conference,
International Society for Airbreathing Engines 127. ISABE-
2011-1242 (2011).
Churchill, S.W. and Chu, H.H.S. (1975). Correlating
equations for laminar and turbulent free convection from a
horizontal cylinder. Int. J. Heat Mass Transfer 18: pp. 1049–
1053 doi:10.1016/0017-9310(75)90222-7
Daily, J. W. and Nece, R. E. (1960). Chamber Dimension
Effects on Induced Flow and Frictional Resistance of
Enclosed Rotating Disks. ASME. Journal of Basic
Engineering; 82(1), pp. 217-230. doi:10.1115/1.3662532.
Guidotti, E., Naldi, G., Tapinassi, L. and Chockalingam, V.
(2012). Cavity Flow Modeling in an Industrial Centrifugal
Compressor Stage at Design and Off-Design Conditions.
ASME. Turbo Expo: Power for Land, Sea and Air.
Turbomachinery, Parts A, B and C Volume 8. GT2012-
68288, pp. 593–603. doi: 10.1115/GT2012-68288.
Hu, B., Brillert, D., Dohmen, H. J. and Benra F.-K. (2017).
Investigation on the Flow in a Rotor-Stator Cavity with
Centripetal Through-Flow. International Journal of
Turbomachinery Propulsion and Power 2017, 2, 18.
doi:10.3390/ijtpp2040018
Kluck, N., Geller, M., and Magiera R. (2006). Numerical
Computation of Heat Transfer Coefficients for a Radial
Compressor Stage using CFD and Comparison with
Analytical Model Computations. 24th CADFEM User’s
Meeting 2006 – International Congress on FEM Technology.
Web: https://www.fh-dortmund.de/de/fb/5/forschung/
fspcomputersim/medien/pdfs/ThermischeSimulation_S.pdf
Access: 03.09.2018.
Lei, V. and Kawakubo, T. (2007). A Fast Method for
Conjugate Heat Transfer Analysis of Centrifugal
Compressor. ASME International Mechanical Engineering
Congress and Exposition. Heat Transfer, Fluid Flows, and
Thermal Systems, Parts A and B Volume 8. IMECE2007-
41368, pp. 699–706. doi: 10.1115/IMECE2007-41368.
Lewandowski, W., Klugmann-Radziemska, E. (2001). Heat
transfer by free convection from an isothermal vertical round
plate in unlimited space. Applied Energy. 68. pp. 187-201.
doi:10.1016/S0306-2619(00)00053-2.
Mischo, B., Ribi, B., Seebass-Linggi, C. and Mauri, S.
(2009). Influence of Labyrinth Seal Leakage on Centrifugal
Compressor Performance. ASME. Turbo Expo: Power for
Land, Sea, and Air, Volume 7: Turbomachinery, Parts A and
B ():1283-1293. doi:10.1115/GT2009-59524.
9
Span, R. (2006). Stoffwerte von Luft. In: VDI Wärmeatlas,
ed. Verein Deutscher Ingenieure, VDI-Gesellschaft
Verfahrenstechnik und Chemieingenieurwesen (GVC).
Berlin, Heidelberg: Springer. Dbb1-Dbb16
Sun Z., Tan C. and Zhang, D. (2009). Flow Field Structures
of the Impeller Backside Cavity and its Influences on the
Centrifugal Compressor. ASME. Turbo Expo: Power for
Land, Sea, and Air, Volume 7: Turbomachinery, Parts A and
B ():1349-1360. doi:10.1115/GT2009-59879.
NOMENCLATURE
Abbreviations
AD Adiabatic
CFD Computational Fluid Dynamics
CHT Conjugate Heat Transfer
Exp. Experimental
HTC Heat Transfer Coefficient
IGV Inlet Guide Vane
LA Impeller
RC Return Channel
Dimensionless Quantities
67 Grashof number
��� Circumferential Mach number
@7 Prandtl number
TU Turbulence intensity
,� � Flow number
Non-Dimensionless Quantities
�e,,� � Speed of sound at inlet (total) &f g⁄ + h0 Impeller outer Diameter &f+ i Gravitational constant (= 9.81) &f g2⁄ +
B� Characteristic length &f+ m� Massflow &ki g⁄ + @l21� Frictional power (at disk) &km+ @en�l� Mechanical work &km+ H⃗� Heat flux density &m/f0+ o�p�e1q: Heat flux (cavity to stator walls) &km+ o�r � 2 Heat flux (cavity to rotor walls) &km+ ?�st Ambient temperature &u+ �0 Impeller circumferential speed &f/g + v�,� � Total volume flow at stage inlet &fw g⁄ + <= Isobaric expansion coefficient &1 u⁄ + Δ? Driving temperature difference &u+ x Kinematic viscosity (fluid) &f0 g⁄ +
KL Thermal conductivity (solid body) ymf uz {
Indices
2 Impeller outlet
cyl Cylindrical
circ Circular
E Stage exit
I Stage inlet
stat Static (flow)
tot Total (flow)
* Normalized (by overall maximum value)
ACKNOWLEDGMENTS
The authors gratefully acknowledge the MAN Energy
Solutions SE and the German Federal Ministry of Economics
and Technology (BMWi). The work was conducted within
the funding programme Cooreflex-turbo 1.1.4 ‘Experimental
and numerical investigation of side cavities in centrifugal
compressors’ (03ET7020R)
APPENDIX A - COPYRIGHT/OPEN ACCESS The GPPS policy is that all articles will be Open Source
accessible. All articles will be published using the Creative
Commons Attribution CC-BY 4.0 or, if commercial rights
are important, CC-BY-NC 4.0 or CC-BY-NC-ND 4.0, thus
allowing the author(s) to retain their copyright.
For answers to frequently asked questions about
Creative Commons Licences, please see
https://creativecommons.org/faq/.
APPENDIX B - GPPS PRESENTER POLICY AND PAPER ACCEPTANCE
According to GPPS's presenter attendance policy, a
paper cannot be published or be indexed and may not be
cited as a published paper until at least one author pays the
registration fee and attends the conference. The GPPS
reserves the right to withdraw from its publications any paper
that is not presented by an author of the paper at the
appropriate conference. Any paper that is withdrawn may not
be cited as a published paper.
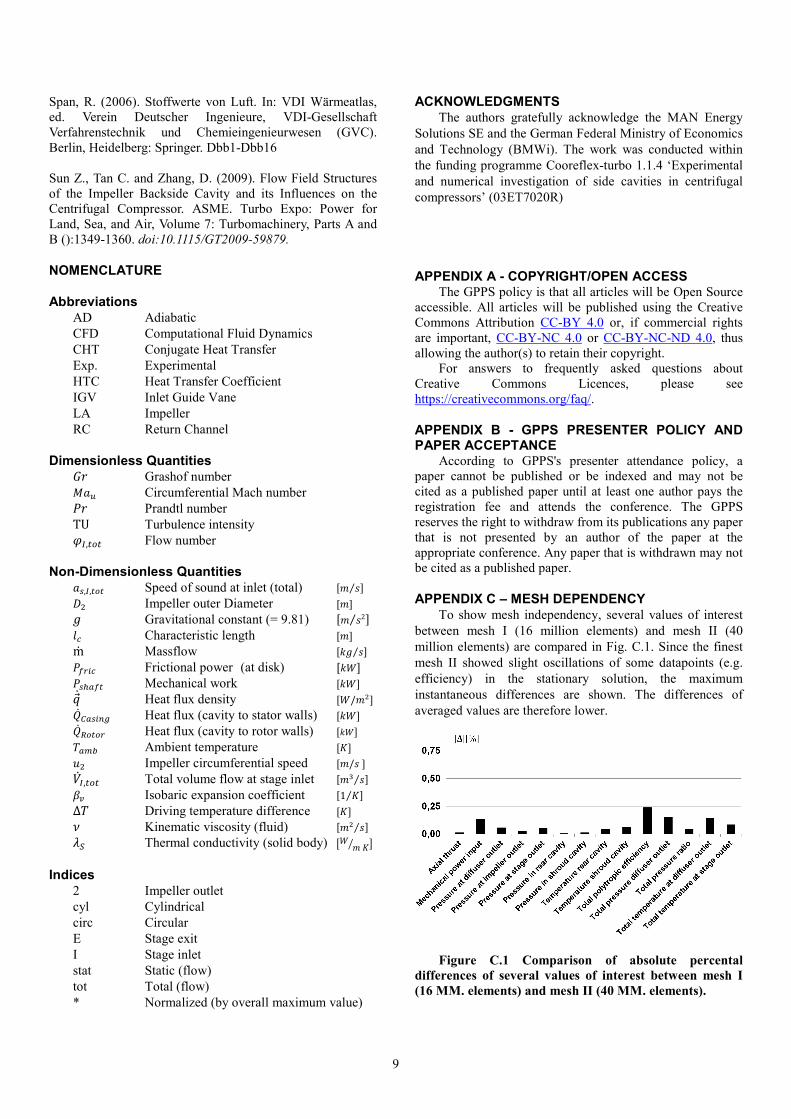
APPENDIX C – MESH DEPENDENCY
To show mesh independency, several values of interest
between mesh I (16 million elements) and mesh II (40
million elements) are compared in Fig. C.1. Since the finest
mesh II showed slight oscillations of some datapoints (e.g.
efficiency) in the stationary solution, the maximum
instantaneous differences are shown. The differences of
averaged values are therefore lower.
Figure C.1 Comparison of absolute percental
differences of several values of interest between mesh I
(16 MM. elements) and mesh II (40 MM. elements).