Conflict and Climate: a Micro-level...
59
Conflict and Climate: a Micro-level Analysis * Laura Ralston, World Bank January 2015 Abstract Several studies have identified the impact of adverse economic shocks on civil conflict using rainfall varia- tion as an instrument for income or growth. This paper contributes to this literature by carrying out a micro-level analysis on the relationship between climate and resource variation with armed conflict using a novel dataset on inter-tribal violence manifested through livestock raids in a pastoral-dependent region of East African. Con- sistent with previous work, I find that across the region there is a negative relationship between resources and conflict. In particular, a standard deviation decrease in average level of forage across the region leads to a 44% increase in the number of livestock stolen per month. At the same time, there is a U-shaped relationship be- tween precipitation and conflict, as a 10% increase in the proportion of land with no rainfall leads to about a 4% increase in the number of raids, but a standard deviation increase in the average level of precipitation leads to an increase in raids per month of about 22% as well. This bimodal relationship between precipitation and con- flict persists when I analyse raid-location and tribe specific variation in rainfall, while the relationship between forage and raiding is less clear. There is some indication that forage-scarcity motivates tribes to carry out raids and forage-scarce sublocations appear to be more vulnerable to raids and livestock losses, but these results are not robust to all specifications. Together these results suggest that raids occur in the Karamoja region both when tribes encounter the greatest marginal gains to raiding because they are resource-scarce, but also when climatic conditions increase the ease through which raids can be carried out. JEL codes: D74, K42, Q34, N47, N57 * I thank my MIT advisers Esther Duflo, Michael Greenstone and Ben Olken for their guidance throughout this project, and the staff at CEWARN for providing me access to their data. Additional thanks are due to Melissa Dell, Ben Feigenberg, Nina Harari, Horacio Larreguy, Jennifer Peck, Jessica Leight, Tavneet Suri and participants at the MIT Development and Political Economy Research Workshop for helpful discussions. All errors are my own. Email: [email protected] 1
Transcript of Conflict and Climate: a Micro-level...
Conflict and Climate: a Micro-level Analysis∗
Laura Ralston, World Bank
January 2015
Abstract
Several studies have identified the impact of adverse economic shocks on civil conflict using rainfall varia-
tion as an instrument for income or growth. This paper contributes to this literature by carrying out a micro-level
analysis on the relationship between climate and resource variation with armed conflict using a novel dataset
on inter-tribal violence manifested through livestock raids in a pastoral-dependent region of East African. Con-
sistent with previous work, I find that across the region there is a negative relationship between resources and
conflict. In particular, a standard deviation decrease in average level of forage across the region leads to a 44%
increase in the number of livestock stolen per month. At the same time, there is a U-shaped relationship be-
tween precipitation and conflict, as a 10% increase in the proportion of land with no rainfall leads to about a 4%
increase in the number of raids, but a standard deviation increase in the average level of precipitation leads to
an increase in raids per month of about 22% as well. This bimodal relationship between precipitation and con-
flict persists when I analyse raid-location and tribe specific variation in rainfall, while the relationship between
forage and raiding is less clear. There is some indication that forage-scarcity motivates tribes to carry out raids
and forage-scarce sublocations appear to be more vulnerable to raids and livestock losses, but these results are
not robust to all specifications. Together these results suggest that raids occur in the Karamoja region both when
tribes encounter the greatest marginal gains to raiding because they are resource-scarce, but also when climatic
conditions increase the ease through which raids can be carried out.
JEL codes: D74, K42, Q34, N47, N57
∗I thank my MIT advisers Esther Duflo, Michael Greenstone and Ben Olken for their guidance throughout this project, and the staff atCEWARN for providing me access to their data. Additional thanks are due to Melissa Dell, Ben Feigenberg, Nina Harari, Horacio Larreguy,Jennifer Peck, Jessica Leight, Tavneet Suri and participants at the MIT Development and Political Economy Research Workshop for helpfuldiscussions. All errors are my own. Email: [email protected]
1
Introduction
Internal armed conflict is a prevalent issue in the modern world. Conflict events with at least 25 battle deaths
per annum have occured in half of all nations since 1960 (Blattman and Miguel 2010 [10]).1 Yet, the incidence
of conflict is still somewhat of an economic puzzle: why do individuals, or groups, decide to engage in conflict,
when it appears to be such a costly and rent destroying activity? Over the last two decades this puzzle has drawn
significant academic attention, but according to a survey of the literature there is still little consensus on the most
effective policies to avert conflicts, which may be due to a lack of micro-level analysis that focuses on causal
identification of conflict (Blattman and Miguel 2010 [10]).
More recently, an expansive cross-disciplinary literature has emerged that examines the relationship between
climatic changes and conflict, with particular attention to Sub-Saharan Africa. Sub-Saharan Africa has a history of
civil conflict, political instability and non-state violence, with 74 of the 127 civil wars recorded between 1945-1999
and 112 of the 154 non-state conflicts recorded between 2002-2007 occurring in this part of the world (Harari and
La Ferrara 2012 [19] and UCDP Non-State Conflict Dataset v2.1 2002-2007 [47]). The region is also expected to
face some of the worst consequences of climate change, as a large proportion of the population rely on weather
dependent agricultural practices, such as growing rainfed crops and raising livestock, and the region is predicted
to be particularly vulnerable to future climate changes. For example, estimates of aggregate yield changes for the
five main rainfed crops in the region range between -8% and -22% over the next fifty years (Schlenker and Lobell
2010 [44]). Thus, a large body of research has emerged that attempts to establish whether there is a causal link
between weather deviations and the propensity for conflict in the region, with most studies focusing on the impact
negative weather shocks have on poverty.2
This study is able to contribute to both debates by analysing conflict at a micro-level and focusing on a region
within Sub-Saharan Africa that is extremely vulnerable to weather fluctuations. I use a unique dataset that contains
detailed information on conflict between tribes in the Karamoja region of East Africa. Moreover, this conflict arises
during livestock raids, where tribes in the region attack each other with the intention of obtaining livestock. Since
1These definitions come from the well-known UCDP-PRIO dataset developed by Nils Petter Gleditsch et al. (2002) and extendedin Lotta Harbom and Peter Wallensteen (2007). UCDP-PRIO defines conflict as "a contested incompatibility that concerns governmentand/or territory where the use of armed force between two parties, of which at least one is the government of a state, results in at least 25battle-related deaths."
2This literature started with the seminal contribution by Miguel, Satyanath and Sergenti (2004) [32], and has since been followed bymany other papers (see Hsiang, Burke and Miguel (2013) [22] for a recent review.
2
pastoralism is the dominant livelihood in the region, this type of conflict corresponds to resource appropriation,
where the resources are the animals stolen during raids, and these resources (livestock), will fluctuate in quality and
quantity with climatic variation in the region. For example, prolonged periods of low rainfall reduce the availability
of forage for the animals, which will diminish their health and can lead to reductions in herd sizes. At the same
time, my analysis will not exclude the possibility that climatic conditions may directly influence the ease at which
livestock raids can be carried out. For example, other studies on pastoral conflict have suggested that vegetation
coverage enables raiders to hide before ambushing their target, and surface water from rainfall makes tracking
animals easier (Adano and Witsenburg 2005 [48]). Thus, what I hope to contribute is a thorough investigation of
the spatial patterns of conflict over a relatively homogeneous region, where I can carefully consider if it is possible
to identify the direction of conflict based on any differences in the climatic exposure between tribes. That is, as
well as examining the location of conflict as it pertains to weather and forage variation, I will examine the direction
of conflict between tribes, based on differences in the availability of water and forage between their grazing areas.
This study has several advantages that I believe will help improve our understanding of how climate varia-
tion influences resource-related conflict in Sub-Saharan Africa, and elucidate our knowledge of the micro-level
determinants of conflict at a more general level. First, is the data that I use for this study. The data comes from
comes from CEWARN (Conflict Early Warning and Response Mechanism), an initiative that was set up by the
Intergovernmental Authority on Development (IGAD) in 2003 to monitor, prevent escalation or mitigate the worst
effects of violent conflicts. CEWARN collects detailed accounts of all episodes of pastoral conflict and crime in
the Karamoja Cluster by using field monitors to record reports of all these incidents. These incident reports contain
detailed information on where livestock raids occur,3 the date of each raid, the number of people involved, the
outcomes to human life and property (such as the number of livestock taken), and which tribes were involved (who
was the initiator and who was the target).4 In addition, I have gridded precipitation and forage data. The precipi-
tation estimates are available for the Africa region (20W-55E, 40S-40N) on a 0.1 degree resolution (approximately
11km x 11km) from FEWSNET- Famine Early Warning Systems Network [49], and are based on daily rain gauge
data and 6-hourly satellite images, while the forage data comes from a joint project between USAID and Texas
3Up to the sublocation level in Kenya, the subcounty level in Uganda, and by the area of reporting of the field monitor in Ethiopia.4The following tribal groups are recorded as being involved in raids. Within Ethiopia: Borana, Dassenech, Hamer, Mursi, Nyangatom,
Toposa. Within Kenya: Kenyan Pokot, Central Turkana, Southern Turkana, Northern Turkana. Within Uganda: Bokora, Dodoth, Jie,Matheniko, Pian, Ugandan Pokot, Sabiny.
3
A&M University that developed monthly estimates of the forage available for livestock at a 4km x 4km resolution
in kg/hectare [46]. The forage data is estimated using satellite (NDVI) data but also uses a simulation model called
PHYGROW that takes into account soil types and the demands of forage for different types of livestock, and the
output of the model is then calibrated to data from around 430 monitoring sites. Thus, I am able to more precisely
match the rainfall and forage conditions to the location of livestock raids, and I can attempt to match the forage and
rainfall exposure of different tribes to their propensity to initiate and be a target of raids, using additional anthro-
pological and sociological accounts of the traditional grazing areas of the different tribes.5 No other study has yet
used the CEWARN data at this level of detail, and I know of no other studies on conflict and climate variation that
have been able to so closely tie climate exposure to the perpetrators and targets of violence. For example, studies
that rely on national-level measures, may not capture the climate exposure relevant to those directly involved in
conflict, and even the disaggregated analysis carried out at the spatial-level of detail of a 1 degree grid cell resolu-
tion (about 100km x 100km), such as Harari and La Ferrara 2012 [19] and O’Loughlin et al. 2012 [35], cannot as
precisely tie climate exposure to conflict, as I can in this study.
The second advantage of this paper, is that I focus on a single geographic region and a relatively homogeneous
type of conflict. This has the advantage over cross-country or within continent empirical studies in several respects.
First, I am able to confidently control for time-varying region-specific trends that may confound cross-country or
cross-region empirical studies. Second, within the Karamoja region livestock raiding is a relatively homogeneous
form of conflict, more so I would argue, than a comparison of all types of conflict events, that many studies hope to
understand when they use the combined PRIO/Uppsala Armed Conflict Location and Event (ACLED) dataset [40].
This dataset includes not only battles with more than 25 casualties, but also rebel recruitment, riots, and violence
against civilians. Even when just battles or violence against civilians is considered, there is still a large amount of
heterogeneity in this type of conflict, in terms of the length of conflict or the consequences on human lives. Thus,
by focusing on livestock raiding, I hope to more robustly analyse the relationship between climate variation and
one particular type of conflict.
The third advantage of this paper, is that my regression analysis accounts for both spatial and temporal cor-
relation in livestock raiding and climate variation. As discussed by Harari and La Ferrara (2012), it is important
5I use remotely sensed data on forage as a source of resource variation, since there is a significant amount of ecological evidence on adirect relationship between the carrying capacity of land (the numer of livestock that can be effectively grazed per unit of land) and remotelysensed vegetation data (Oesterheld et al. 1998 [34], Box et al. 1989 [12], Coe et al. 1975 [14], East 1984 [16], Hill and Donald 2003 [20]).
4
to consider not only the immediate effects of climate variation on conflict in a particular location, but also the
persistance of any effects, both across time and space. In addition, when dealing with highly disaggregated data,
one needs to be cognisant of spatial correlation in the covariates, as well as serial correlation in the dependent
variable and residuals. Another nuance of this analysis, is the dyadic approach I use to consider how differences in
the availability of water and forage between the grazing areas of tribes’ influences the direction of conflict, which
requires careful modelling of the error covariance matrix. Thus, I use empirical approaches that best address these
considerations, and I present my results in a systematic and structured fashion, to transparently demonstrate any
sensitivity of my results to modelling assumptions.
My results suggest that across the region there is a bimodal relationship between conflict and precipitation,
with more pastoral raids occurring when there is both very little and a lot of rainfall across the Karamoja region.
A standard deviation increase in the average level of precipitation leads to an increase in raids per month of about
22%, and an increase in the proportion of land with no rainfall of 0.1 leads to a 4% increase in raids per month.
A standard deviation decrease in average level of forage has no impact on the number of raids per month, but
increases the number of deaths by 23% and the number of livestock stolen by 44%. Thus, at the aggregate level
there is evidence of resource-scarcity leading to more conflict as well as wet weather improving the conditions for
raiding.
When tribe specific and sublocation specific variation in resources is examined, the relationship between forage
and raiding is less clear. There is some indication that forage-scarcity motivates tribes to carry out raids and forage-
scarce sublocations appear to be more vulnerable to raids and livestock losses, but these results are not robust to all
specifications. There is, however, a bimodal relationship between conflict and precipitation at the sublocation level,
with a higher likelihood of raids occurring in the month following both very little and a lot of rainfall. The death
rate is also higher in months with either very little or a lot of rainfall as well. At the tribe-dyad level, I find that
tribes that have recently experienced very dry weather are more likely to initiate raids, steal more livestock, and be
responsible for a larger number of pastoral deaths, but I do not find that extreme positive deviations of precipitation
affect these outcomes.
Together these results suggest that conflict in the Karamoja region is correlated with extreme precipitation
fluctuations in either a positive or negative direction. Forage-scarcity may also be a motivator for tribes to initiate
raids, but this relationship is less clear. Thus, these results are consistent with raids occurring when tribes encounter
5
the greatest marginal gains to raiding because they are resource-scarce, but they are also consistent with several
other explanations, such as climatic conditions directly influencing the ease through which raids are carried out.
There are two considerations to make when interpreting the findings of this paper. Firstly, there is the question
of external validity. While there are advantages in focusing on a single geographic area and a homogenous form
of resource related conflict, such as the increased plausibility that if any systematic relationship between climate
variation and conflict exists, it will be identified, there is the concern that these results lack the basis for generaliza-
tion. Although, location and tribe dyad fixed effects will at least partially control for potential confounding factors,
such as political, social and geographic considerations, there remains the concern that the relationship between
climate variation and conflict that I find is Karamoja region specific and not relevant to other forms of conflict.
I would argue that these results could have meaningful implications in helping us understand pastoral conflict in
other regions, such as the Somalia Cluster, Ethiopia and Sudan. Regardless however, given the significant costs to
human lifes in the Karamoja region due to pastoral conflict, this issue is worth attention, even if the results may
have limited external validity.
The second consideration of this paper is the ease to which forage and precipitation fluctuations can be attributed
to different tribes. Pastoralists practice a transhumance livelihood, whereby the tribes move livestock dependent on
the availability and quality of grazing. Thus, while the tribes tend to move their livestock within a particular territory
and do not often use the same grazing areas, I cannot exclude the possibility that at times different tribes will use
the same area to graze their animals. In fact other research on pastoralists has reported that during dry periods
households from different tribes may be closer together, aggregating in temporary camps nearer the remaining
water sources (Mathew and Boyd 2011 [27] and Stites, Fries and Akabwai 2010 [45]). My approach is to present
results both based on the imputed forage and precipitation measurements of each tribe involved in a raid, and the
forage and precipitation measurements at the location of a raid. Thus, I first look for a tribe-relevant climate effect
on the direction of conflict, and then I consider location-relevant climate effect on the incidence of conflict, in case
the first channel cannot be determined.
This paper contributes to the burgeoning literature on climate and violent conflict. This literature emerged
following the seminal work by Miguel, Satyanath and Sergenti (2004) that used negative rainfall fluctuations as an
instrument for income shocks in Sub Saharan Africa to identify a causal relationship between income and conflict in
a cross-country analysis. They demonstrated that the likelihood of conflict increases by one half following negative
6
growth shocks of five percentage points [32]. Since this paper, the literature has had many recent contributions,
with the focus turned not only to the impact weather has on income, mainly through agricultural revenue and
wages, but also to the more direct impacts of weather variation on the logistics of conflict, state capacity to resist
conflict, as well as other channels, such as migration and urbanization, food price volatility and human behavioral
tendencies. For a comprehensive review of the literature, I refer you to Hsiang, Burke and Miguel (2013) [22], who
assemble the 50 most rigorous quantitative studies from across the disciplines of archaeology, psychology, political
science and economics. Their meta analysis reports that for each standard deviation change in climate towards
more extreme rainfall the frequency of interpersonal violence rises by 4% and the frequency of intergroup conflict
rises by 12%. This paper complements this literature by following similar methodological approaches to earlier
studies, but uses a different source of conflict data that contains much more detailed information on the location of
conflict and the groups involved in conflict.
Several other recent studies have examined the relationship between climate and pastoral conflict in the Horn of
Africa [4], [3], [13], [27], [31], [33], [38], [39], [41], [43], [45]. Meier, Bond and Bond (2007) is the most closely
related study to this paper, as they also use the CEWARN data [31]. They report finding no relationship between
precipitation or forage and livestock raiding, but that increases in vegetation coverage, measured through NDVI,
are associated with increases in the level of raiding. This paper is differs, through using a longer times series of the
CEWARN data, 2004-2009, compared to 2004-2005, and examining the relationship between conflict and climate
at a greater degree of spatial disaggregation, with greater attention to potential econometric concerns. For example,
Meier, Bond and Bond analyze the data using a single geographic unit for Kenya, another unit for Ethiopia and
four units for Uganda. Given this, they do not directly address the spatial impacts of either climate variation or
spillovers in conflict across neighboring areas. Furthermore, their regression approaches do not correct for either
spatial correlation or serial correlation in conflict, or control for seasonal patterns in conflict that may spuriously
coincide with seasonal weather patterns, nor do they control for location fixed effects or systematic time trends in
conflict across their data period.
Obtaining detailed information on pastoral conflict over an extended time period has been a constraint faced
by most other studies, that tend to instead present qualitative analysis based on case studies and in depth field
interviews. Karen Witsenburg, Wario R Adano and Tom Dietz, have contributed numerous articles, where they
emphasize resource scarcity leads to a greater degree of cooperation and fewer livestock raids. For example, they
7
report fewer deaths in the Marsabit District of Kenya in drought years than in wet years, using archival records
and annual reports of government ministries [3]. In another article, they explain that the herders, "see droughts as
difficult times when animals are weak, survival is hard and people are more inclined to stop fighting, patch up their
differences, renegotiate access rules and rights, and reconcile to cooperate" [41]. However, they acknowledge that,
"there are only a few thorough empirical works on the relationships between natural resources scarcity and pastoral
conflicts based on long-term time-series data" [41].
In contrast to findings of Witsenburg, Adano and Dietz, a group of researchers at Tufts University, including
Darlington Akabwai, Elizabeth Stites and Lorin Fries, have instead noted that in the Uganda Karamoja, conflict
tends to erupt when different groups are more likely to be accessing resources in close proximity, which tends
to occur during dry periods [45]. Akabwai, Fries and Stites, note that, "respondents within the study population
did not state that conflict or insecurity was caused by tension over resources, competition in accessing resources,
or resource scarcity. They did make clear, however, that conflict is most likely to occur in areas where natural
resources are being accessed and utilized" [45]. Given these contrasting accounts, this study will help address the
debate through presenting a structured empirical analysis using six years of pastoral conflict data for the entire the
Karamoja region.
My research also relates to the theoretical literature on pastoral raiding. Mathew and Boyd (2011) study the
Turkana of Kenya and discuss the extent to which livestock raids involve cooperation among large parties, pro-
viding detailed case study information on this effect [27]. Butler and Gates (2012) present a theoretical model
that shows how increases in resources could lead to increases in the level of raiding, while also demonstrating that
asymmetry in pastoral strength may lead to more conflict, with poorer groups focusing their efforts on raiding and
not producing, while richer groups raid in retaliation [13]. This paper will complement this research by presenting
a contest function model similar to Butler and Gates (2012), but I abstract from considering asymmetry in prop-
erty rights between tribes, which is a focus of Butler and Gates’ model. Through differences in resources alone,
I demonstrate how weather variation may influence the fighting strength of each tribe as well as the rewards to
fighting, making the direction of conflict ambiguous.
The remainder of this paper is organized as follows. Section one discusses in more detail the background of the
geographic region I study and the type of violence prevalent in the region. Section two introduces a simple contest
model framework to help motivate the empirical analysis. Section three describes the conflict and climate data and
8
outlines the methodology of my empirical analysis. Section four presents results. And section five finishes with a
discussion of the main findings from the study and their implications.
1 Background
The region I study for this analysis of conflict is the Karamoja Cluster - a region located across the borders of
Uganda, Sudan, Ethiopia and Kenya, covering an area of 25,000 square miles and with a human population es-
timated between 1 and 1.6 million (see figure 1). Tribal communities populate the region and form the groups
between which conflict occurs. In Uganda, most tribes belong to the Karamojong ethnic group, which can be
further divided into the Dodoth, Jie, Pian, Matheniko and Bokora; in Kenya, the predominant tribal group are the
Turkana; and an ethnic group known as the Pokot live in the southern parts of the Cluster across the Kenya-Uganda
border. Within Ethiopia the following tribes are present: Borana, Dassenech, Hamer, Mursi, Nyangatom, Toposa
(see figure 2) (Gartell 1985 [18], Quam 1997 [37], Gray et al. 1999 [42], Powell 2010 [36]). All the tribes from
Kenya and Uganda are closely ethno-linguistically related and come from the same Aketer subdivision of the East-
ern Nilotic linguistic group (Ethnologue 2011) [2]. Thus, they are linguistically intelligible to each other, and share
much history and culture, which makes it unlikely that their animosity towards each other is rooted in primordial
differences (Horowitz 1985 [21]).
The traditional livelihood, and that which is still practised today, is nomadic pastoralism whereby cattle and
livestock are raised to provide a diet of milk and blood to their owners. This type of transhumance pastoralism
is thought to be the most effective method of subsistence for the region, given the fragile nature of the ecosystem
and the harsh and unpredictable climate of the semi-arid terrain (Gray et al. 1999 [42]; Little 1999 [26]). While
some grain, such as sorghum and millet, may be grown in small amounts to supplement their diet, the pastoralists
rely heavily on their livestock as their primary source of nutrition as well as a measure of wealth, through which
important transactions, such as bride or gun purchases, are denominated (Mburu 2007 [28], Jabs 2010 [23]).
Conflict is not a new phenomenon in the region and the activity of livestock raiding has a strong cultural
heritage. Traditionally groups of young men would obtain the blessing of elders from their tribe to go out and
raid a neighboring tribe with the intention of bringing back additional livestock and mark their coming of age into
manhood. However, in more recent years the cultural aspect of raiding appears to be less important as the frequency
9
and ferocity of raiding has increased, with raiding being undertaken by bands of young men who have guns. While
they still identify with their ethnic tribal group (i.e., they call themselves the Dodoth, or the Jie warriors), and they
do not raid from their own tribe, they no longer seek permission from their tribe’s elders, and spend much time
away from the tribal communities, effectively as roaming criminals (Akabwai and Ateyo 2007) [4]. This suggests
that raiding is an appropriation activity, and given the level of violence associated with it, livestock raiding provides
a unique setting for conflict analysis.6
There is evidence of significant population increases in the region over the last fifty years, that can be at-
tributed to a greater access to healthcare facilities due to the increased number of development projects active in
the region. At the same time, there are limited opportunities for pastoralists to migrate out of the region due to
both political containment of pastoralists’ movements and the difficulties pastoralists face when trying to integrate
into mainstream society, which holds strong prejudices against pastoralists (McCabe and Ellis 1987 [30], McCabe
1990 [29], Gray et al. 1999 [42], Kratli 2001 [24], Powell 2010 [36]). However, drought conditions prevailed in
the years 1992, 1994, 1998, 2000, 2004, and 2010-11, and depleted livestock populations [36], effectively reducing
the demand for young men to present within the tribal communities for animal husbandry, and creating an excess
supply of male labor.
Statistical indicators for the region are suggestive of extreme poverty and deprivation. An estimated 82% of
the population in Uganda and 74% of the population in Kenya live below the corresponding national poverty lines.
Less than half the population have access to safe drinking water, less than a third have access to sanitation units, and
most of the region surpasses the World Food Organistaion’s emergency threshold for malnutrition rates. Similarly,
statistics on other health indicators and literacy rates are very low (see table 1).
2 Conceptual Framework
I present a simple contest model that specifies how resource variation could influence conflict and use this to
motivate my empirical analysis.
I assume there are two states: {H,L}, that represent high resources or low resources. Each tribe’s initial wealth,
or endowment, depends on which state they are in: {ESi=H ,ESi=L} with ESi=H > ESi=L. When a tribe is in a state
6Bevan 2008 [9] and the Small Arms Survey [1] report homicide rates of over 60 per 100,000, and my own data suggests estimates 50-60per 100,000.
10
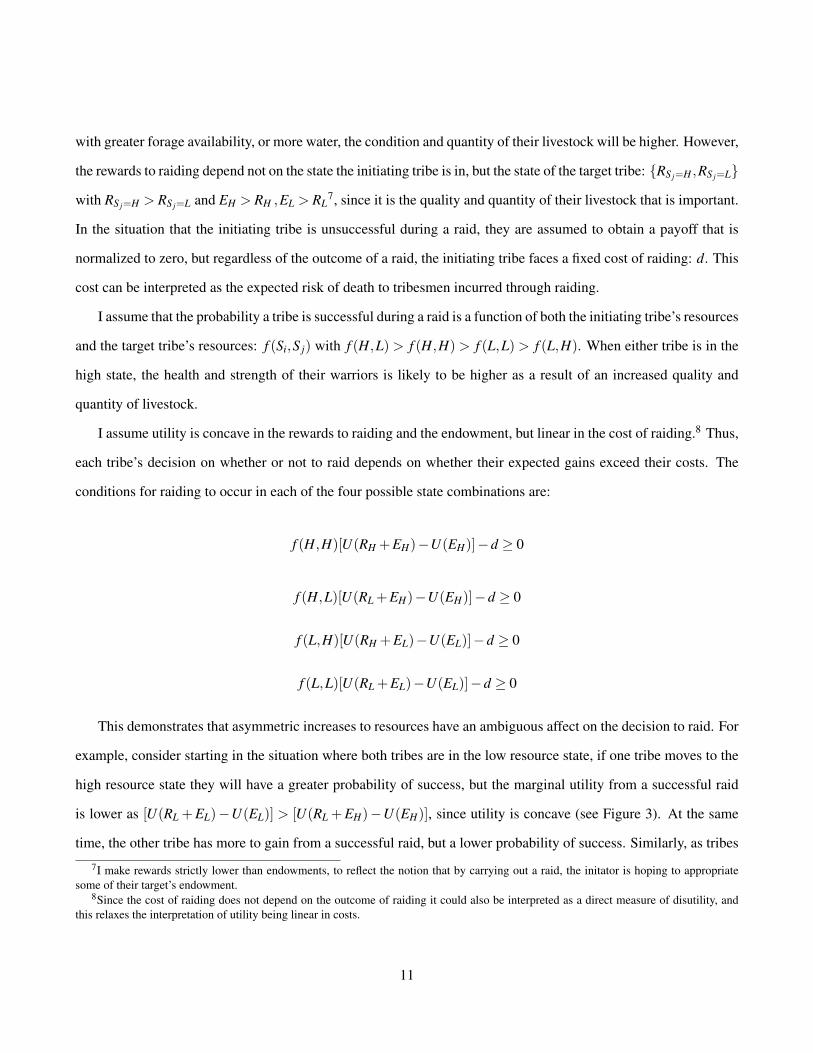
with greater forage availability, or more water, the condition and quantity of their livestock will be higher. However,
the rewards to raiding depend not on the state the initiating tribe is in, but the state of the target tribe: {RS j=H ,RS j=L}
with RS j=H > RS j=L and EH > RH ,EL > RL7, since it is the quality and quantity of their livestock that is important.
In the situation that the initiating tribe is unsuccessful during a raid, they are assumed to obtain a payoff that is
normalized to zero, but regardless of the outcome of a raid, the initiating tribe faces a fixed cost of raiding: d. This
cost can be interpreted as the expected risk of death to tribesmen incurred through raiding.
I assume that the probability a tribe is successful during a raid is a function of both the initiating tribe’s resources
and the target tribe’s resources: f (Si,S j) with f (H,L)> f (H,H)> f (L,L)> f (L,H). When either tribe is in the
high state, the health and strength of their warriors is likely to be higher as a result of an increased quality and
quantity of livestock.
I assume utility is concave in the rewards to raiding and the endowment, but linear in the cost of raiding.8 Thus,
each tribe’s decision on whether or not to raid depends on whether their expected gains exceed their costs. The
conditions for raiding to occur in each of the four possible state combinations are:
f (H,H)[U(RH +EH)−U(EH)]−d ≥ 0
f (H,L)[U(RL +EH)−U(EH)]−d ≥ 0
f (L,H)[U(RH +EL)−U(EL)]−d ≥ 0
f (L,L)[U(RL +EL)−U(EL)]−d ≥ 0
This demonstrates that asymmetric increases to resources have an ambiguous affect on the decision to raid. For
example, consider starting in the situation where both tribes are in the low resource state, if one tribe moves to the
high resource state they will have a greater probability of success, but the marginal utility from a successful raid
is lower as [U(RL +EL)−U(EL)] > [U(RL +EH)−U(EH)], since utility is concave (see Figure 3). At the same
time, the other tribe has more to gain from a successful raid, but a lower probability of success. Similarly, as tribes
7I make rewards strictly lower than endowments, to reflect the notion that by carrying out a raid, the initator is hoping to appropriatesome of their target’s endowment.
8Since the cost of raiding does not depend on the outcome of raiding it could also be interpreted as a direct measure of disutility, andthis relaxes the interpretation of utility being linear in costs.
11
experience asymmetric decreases to resources, the most affected tribe will have more to gain from a successful
raid, but a lower probability of success (see Figure 4).
Therefore, the empirical analysis will assess whether resource variation has a greater impact on the rewards
to raiding vis-á-vis its impact on the probability of success, since I can attempt to directly estimate the impact
variation in a tribe’s own resources has on its probability of commiting a raid controlling for the resources of the
other tribes. If there is a positive relationship between a tribe’s own resources and their decision to raid, this would
suggest that the impact on the probability of success outweighs the impact on the marginal rewards to raiding.
However, a negative relationship between a tribe’s own resources and their decision to raid, this would suggest that
the impact on the rewards to raiding outweighs the impact on the probability of success. Similarly, I can investigate
the influence a potential target tribe’s resources have on the initiating tribe’s decision to raid.
The conceptual framework has so far abstracted from any direct impact that weather variation may have on
ease through which tribes can carry out livestock raids. However, as was discussed earlier, it is plausible that
weather conditions may directly influence the probability that tribes can carry out raids. For example, Adano and
Witsenburg note that, "During the rainy seasons animals are in good condition and strong to withstand long distance
trek, manpower demand is low, enhanced chance of rain to wash away tracks and rich vegetation cover, each or
all in combination, enable raiding and increase the prospects of successful raiding" [41]. If this explanation fits
the technology of livestock raiding across the Karamoja, increases in precipitation or forage for both the target and
the initiator should increase the probability that the initiating tribe can successfully carry out a raid. In effect this
justifies the assumption that f (H,H) > f (L,L), particularly when the high resource state coincides with greater
vegetation coverage and more surface water. To evaluate whether the model predicts raiding to be more or less
likely when both parties move from the low resource to the high resource state, we should consider if:
f (H,H)[U(RH +EH)−U(EH)]> f (L,L)[U(RL +EL)−U(EL)]
Given the concavity of the utility function, it is likely that U(RH +EH)−U(EH) < U(RL +EL)−U(EL), which
suggests that the impact of such correlated changes to resources is ambiguous (see Figure 5).
12
3 Data and Empirical Methodology
3.1 Data
The conflict data comes from CEWARN (Conflict Early Warning and Response Mechanism), an initiative that
was set up by the Intergovernmental Authority on Development (IGAD) in 2003 to monitor, prevent escalation
or mitigate the worst effects of violent conflicts. CEWARN collects detailed accounts of all episodes of pastoral
conflict and crime in the Karamoja Cluster by using field monitors to record reports of all these incidents. 9 These
incident reports are coded by the level at which the information was obtained, and over 90% of the reports have
either the field monitor as a direct observer, or the informant to the field monitor as a direct observer. The remainder
are compiled based on police, newspaper, or radio reports.
The incident reports record the type of crime (livestock raid or theft, banditry, abduction, murder or rape),
the date each crime occurs, the number of people involved, the outcomes to human life and property (such as the
number of livestock taken), the tribes involved (who was the initiator and who was the target), and the location
of the crime (up to the village level). This study focuses on the livestock thefts and raids for two reasons. First,
livestock raids are the most salient form of conflict in the region and second, they are an appropriation activity
where the rewards to raiding can plausibly be expected to vary with resource and water availability. Descriptive
statistics on livestock raids and pastoral indicators are covered in Table 2.
The data on precipitation comes from FEWSNET - Famine Early Warning Systems Network [49], which pro-
vides gridded daily precipitation estimates for the Africa region (20W-55E, 40S-40N) on a 0.1 degree resolution.
These precipitation estimates are based on four sources: daily GTS rain gauge data, AM SU microwave satel-
lite precipitation 6-hourly estimates, SSM/I satellite precipitation 6-hourly estimates and GPI cloud-top infra-red
temperature precipitation half-hourly estimates.
The forage data comes from a joint project between USAID and Texas A&M University that developed an
early warning livestock system that reports on the monthly amount of forage available for livestock [46]. The
data is gridded and available at a 4km x 4km resolution in kg/hectare. The forage data is estimated using satellite
NDVI data as an input to a simulation model called PHYGROW that takes into account soil types and the demands
9Field monitors are CEWARN employees and must be able to speak the local dialects in the region they are deployed. In addition, theymust be literate and are not natives of the region.
13
of forage for different types of livestock, and the output of the model is then calibrated to data from around 430
monitoring sites.
I use three levels of spatial resolution to carry out my analysis. I first consider the aggregate relationship
between forage and precipitation across the Karamoja region as a whole. I begin by summing the daily precipitation
recorded for each grid cell into a monthly total to match the frequency at which forage is available. Then for each
of the forage and precipitation measures I compute a standardized measure for each monthly grid cell data point
by using the long term (2000-2011) mean and standard deviation of each respective grid cell. This allows me to
interpret these variables as location-specific deviations from long term or "natural" levels, which is an approach
adopted by most other papers in the related literature to avoid unobservable confounding factors that may be
location specific. In addition, a new weather-index insurance scheme in a nearby area, has adopted a payment
schedule that relies on using such standardized measures of NDVI, a key determinant of the forage measure, to
decide what payment should be made to pastoralists, demonstrating that there is a robust relationship between
NDVI deviations and livestock mortality. 10 To obtain a monthly measure of forage and precipitation for the region
as a whole, I simply take the unweighted mean level of these standardized grid cell observations for the Karamoja
region. 11 As a complementary measure to assist my analysis, I calculate the proportion of monthly grid cell
observations that recorded no precipitation. I refer to this measure as a drought index, as it is scaled between
0-1, and I use it to capture any direct and potentially non-linear impacts that the absence of rainfall may have on
livestock raiding.
As a second level of spatial resolution, I consider the forage, precipitation and drought of both initiating and
target tribes. To do this I need to make an assumption about the location of tribes to be able to attribute these
resource and climate measures to each tribe. My method is to obtain detailed administrative maps of the region
from the International Livestock Research Institute and combine these maps with multiple anthropological accounts
on each tribe’s traditional grazing area to match each tribe to different geographic areas. Most administrative
geographic units take the name of a main tribal group, for example, Dodoth County is in the northern part of the
Ugandan Karamoja and is where most anthropological accounts suggest the Dodoth tribe are located. Similarly,
the Rift Valley Province of Kenya is divided into the districts of North, Central and South Turkana, and this is
10See the International Livestock Research Institute’s website: http://livestockinsurance.wordpress.com/ for more information.11This part of the data preparation was done using ArcGIS software. I overlaid the co-ordinates of the centre of each grid cell observation
on an adminstrative map of the region downloaded from http://web.mit.edu/geoweb/ (see Figure 1) to identify which grid cells to include.
14
how I match the different Turkana tribes to geographic areas. While this methodology does rely on the assumption
that geographic units can be meaningfully attributed to different tribes, there is also additional evidence to suggest
this is reasonable: these administrative units originate from boundaries laid out by the British in 1911, to assign
permanent territorial rights to different tribes, to aid the colonialist’s control of order in the area [4], [41], [45]. The
mapping of different tribes to particular geographic locations that I use is shown in Figure 2. Since both the forage
and rainfall data is in gridded format, while the tribes traditional grazing areas are irregular shaped polygons, I use
arcGIS software to map the gridded data into measures that are representative of each tribe by averaging across
datapoints spatially.
The third level of spatial resolution that I consider is the location of livestock raids. The CEWARN data
includes detailed information on where raids take place and in some cases information up to the village level of
spatial resolution is available. In order to obtain a consistent geographic unit of measurement, while trying to
maintain a high level of spatial disaggregation, I have identified raids up to the sublocation level of detail in Kenya
(74), the subcounty in Uganda (58), and by the area of reporting of field monitors in Ethiopia (3). A map of these
geographic units for Kenya and Uganda is shown in Figure 6, and to see which geographic units I use for Ethiopia
you can refer to the boundaries shown in Figure 2 as these also depict the areas covered by the field monitors. I
present this third level of spatial analysis to complement the tribe level analysis, which may have limitations due to
the possible concern that the forage and precipitations fluctuations cannot be precisely attributed to specific tribes.
Thus, my approach is to present results both at the level of conflict interactions between tribes and at the most
detailed level of location of conflict, to first look for a tribe-relevant climate effect on the direction of conflict, as
well as considering location-relevant climate effect on the incidence of conflict, in case the first channel cannot be
determined.
3.2 Empirical Methodology
3.2.1 Regionwide Analysis
To examine the incidence of conflict across the region as whole in relation to the average level of forage and
precipitation. I estimate the following model:
15
log(con f lictt) = α +β1 f oraget +β2 precipitationt +β3droughtt + γ′t +ΣMδMI[montht = M]+ εt
where con f lictt is a measure of the total number of livestock raids, deaths due to livestock raiding, or livestock
stolen during a month, f oraget is a standardized monthly measure of forage, precipitationt is a standardized
monthly measure of total precipitation, droughtt is an index between 0 to 1 that captures the proportion of the grid
cell observations across the region that record zero rainfall, γ ′t controls for a regional time trend, δM controls for
month of year fixed effects, and Newey-West standard errors that allow for serial correlation over 4 months are
estimated.
To address potential concerns of serial correlation in the dependent variable, I also estimate the model in first
differences with the resource measures f oraget and precipitationt :12
∆log(con f lictt) = α +β1∆ f oraget +β2∆precipitationt ++γ′t +ΣMδMI[montht = M]+ εt
3.2.2 Between Tribe Analysis
To examine the direction of conflict between tribes based on both the initiator’s and the target’s level of forage and
precipitation, I construct a directed dyadic monthly panel. I consider all contiguous tribe pairs, as well as pairs that
have ever violently interacted, even if they are not located next to each other. This panel is directed in the sense
that a raid initiated by the Dodoth tribe on the Bokora tribe is classified separately to raid by the Bokora tribe to the
Dodoth tribe. I estimate versions of the following model, where subscript i denotes the initiating tribe and subscript
j denotes the target tribe:
con f licti jt = α +ρcon f licti jt−1 +Σs=0,1βinit1,s f orageit−s +Σs=0,1β
tgt1,s f orage jt−s
+Σs=0,1βinit2,s precipitationit−s +Σs=0,1β
tgt2,s precipitation jt−s +Σs=0,1β
init3,s droughtit−s
+Σs=0,1βtgt3,s drought jt−s + γ
′t +ΣMδMI[montht = M]+αi j + εi jt
12I do not include ∆droughtt since the coefficient on such a variable would be difficult to interpret, given that droughtt is an index measure.
16
For the dependent variable I use both an indicator variable, I[raidi jt > 0], for any raiding, as well as logarithmic
measures for the number of deaths and amount of livestock stolen. I estimate the model using a lag of the dependent
variable as a covariate to directly address autocorrelation in conflict itself. I include forage, precipitation and
drought measures for both the target and the initiator to identify whether resource and weather variations have
asymmetric impacts dependent on whether it is the target or the initiator who encounters them, and I allow for
persistence in such impacts through including the lags of these covariates. The inclusion of the lagged dependent
variable makes this a dynamic panel regression specification and I adopt the generalized method of moments
estimation technique proposed by Blundell and Bond (1998) [11]. Blundell and Bond (1998) show that the lagged-
level instruments in the traditional Arellano-Bond estimator for linear dynamic panel-data estimation can become
weak if the autoregressive process is too persistent, so they developed an alternative system estimator [6] [11].13 In
addition, given the potential for unobserved factors to influence the conflict relationship between pairs of tribes in
either direction, I cluster the standard errors by undirected dyads in the specifications where con f licti jt−1 is omitted
and I cluster the standard errors by directed dyads in the specifications where con f licti jt−1 is included. I include
directed dyad fixed effects to address systematic conflict trends between tribes, and include month fixed effects and
a linear time trend, to address regionwide variation in conflict.14
3.2.3 Raid Location Analysis
For the third level of spatial analysis, where I estimate both the spatial and serial impacts of resource and weather
fluctuations and I allow for spatial spillovers in conflict in neighboring locations, I construct a panel of geographic
unit by month observations. I have identified raids up to the sublocation level of detail in Kenya (74), the subcounty
in Uganda (58), and by the area of reporting of field monitors in Ethiopia (3), but for ease of notation I will refer
to this data as a sublocation by month panel. In spatial statistical analysis the structure of spatial autocorrelation
is commonly summarized using a spatial weighting matrix, W , where the spatial lag of a given variable, such as
13Building on the work of Arellano and Bover (1995), Blundell and Bond (1998) suggest using moment conditions in which laggeddifferences are used as instruments for the level equation in addition to the moment conditions of lagged levels as instruments for thedifferenced equation, and this estimator is now implementable using the xtdpd command in stata [7] [11]. The stata manual provides auseful summary of the required assumptions for valid estimation, one of which is that the the initial condition E[αi j∆con f licti j2] = 0 holdsfor all ij dyads. In effect this means that there should be no correlation between the directed dyad fixed effects and the initial difference inconflict for a dyad.
14I have also estimated these regressions with month by year fixed effects to even more flexibly control for any regionwide variation inconflict, and I find that my results are robust to this additional control.
17
f orageit , is obtained by pre-multiplying the vector of observations across all sublocations at time t by the spatial
weighting matrix, for example: W f oraget . I use an inverse distance matrix that can be created from new stata
routines that prepare spatial data [15]. The co-ordinates of the centroid of each sublocation are used to calculate the
distance between sublocations and then W is created with the weights inversely related to the distance between the
sublocations. I truncate the weighting matrix such that sublocations that are greater than 50 km apart have weights
set to zero and I minmax normalize the matrix so that each element is divided by the minimum of the largest row
or column sum of the matrix.15 Using this spatial framework I estimate versions of the following model, where
subscript i denotes the sublocation where a raid occurs:
con f lictit = α +ρcon f lictit−1 +λW.con f lictt +Σs=0,1βown1,s f orageit−s +Σs=0,1β
w1,sW. f oraget−s
+Σs=0,1βown2,s precipitationit−s +Σs=0,1β
w2,sW.precipitationt−s +Σs=0,1β
own3 droughtit−s
+Σs=0,1βw3,sW.droughtt−s + γ
′t +ΣMδMI[montht = M]+αi + εit
For the dependent variable I again use both an indicator variable, I[raidit > 0], for any raiding, as well as log-
arithmic measures for the number of deaths and amount of livestock stolen. In all the specifications at this level of
analysis I include sublocation fixed effects, αi, month of year fixed effects, δM, and a linear time trend.16 However, I
build up the specification shown above in several steps. First, I include only the covariates f orageit , precipitationit ,
droughtit , but specify the structure of the error to be spatial in nature:
εit = τW.εt +µit
Second, I include spatial lags of the forage and precipitation measures as well as sublocation-specific measures, but
15This maintains symmetry in the matrix which would not occur by normalizing by the row sum. However, it makes interpreting thecoefficients from the regressions more complicated. Sublocations that are smaller will mechnically obtain more variation in their term of(W ) f oraget , since they will have more non-zero weights in their corresponding row of W . The coefficient estimates for β w
1,s,βw2,s,β
w3,s, s =
0,1, should be interpreted as the benchmark of the marginal impact on conflict for a unit change in forage or precipitation in all sublocationswithin a 50km radius of the sublocation with the most closely located neighbours. For this sublocation the row sum of weights is one. Forother sublocations the row sum of weights will be less than one, reflecting the fact that the neighbouring sublocations are geographicallyfurther away, and thus, the spatial matrix imposes that spatial variation over greater distances has less influence. I have experimented withusing row sum normalization instead, but I do not find that my results are significantly affected by the choice of normalization.
16Unfortunately, I was not able to check the robustness of these regressions by adding with month by year fixed effects instead of monthof year fixed effects due to computational constraints.
18
consider only contemporaneous effects for both sets of measures, and I continue to use a spatial error model. Third,
I add lagged effects for both direct and spatial measures of forage and precipitation. These three specifications
are static in that they do not include a lag of the dependent variable and can be considered spatial Durbin models
(Anselin, 1988 [5]), which are estimable using GMM.
Next I introduce spatial and serial lags of the dependent variable. I start by including only con f lictit−1 and
estimate the model using the Blundell and Bond (1998) estimator with standard errors clustered by sublocation.
Then I include W.con f lictt and estimate using both a spatial autoregressive model and a spatial durbin model,
where I also include serial lags of the forage and precipitation measures. For both these latter specifications,
standard errors are clustered by sublocation. Spatial dynamic models encounter not only endogeneity concerns
through the inclusion of the lagged dependent variable, but also need special consideration to both the direct effects
of the covariates on the dependent variable and the indirect effects of the covariates on the conflict in nearby
sublocations, that in turn affects conflict in the primary sublocation. Elhorst (2010) and Lee and Yu (2010) have
proposed quasi-maximum likelihood techniques to estimate such spatial dynamic models and this approach is now
easy to implement using the stata xsmle command developed by Belotti, Hughes and Mortari (2013) [17] [25] [8].
4 Results
4.1 Regionwide Analysis
Table 4 examines the aggregate impact of forage and precipitation variation across the Karamoja Region using
conflict and weather data that is collapsed into a single time series. Looking at column (1), I find that a standard
deviation increase in the average level of forage across the region has no impact on the total number of raids, but
a standard deviation increase in the average level of precipitation leads to about a 22% increase in the number of
raids and increases in the proportion of land with no rainfall, also leads to increases in the number of raids. The
coefficient estimates suggest that an increase in the proportion of land with no rainfall of 10% would lead to a
4% increase in the number of raids. This non-linear impact of rainfall can be observed by looking at Figure 8.
This figure shows the total number of raids observed for each decile of average precipitation for the region, and
demonstrates that there is both a large number of raids in the lowest deciles as well as in the highest deciles of the
precipitation distribution. In contrast, at the aggregate level there appears to be no systematic relationship between
19
forage and raiding.
However, columns (2) and (3) suggest that decreases in the average level of forage across the region is ac-
companied by increases to the number of deaths and the amount of livestock stolen during raids. The regression
results suggest that a standard deviation decrease in the average level of forage coincides with a 23% increase in
the number of deaths and a 44% increase in the number of livestock. Figures 9 and 10 show the number of deaths
and livestock stolen for each decile in the average forage for the region. Figure 10 reinforces the results of a nega-
tive correlation between livestock stolen and forage, while Figure 9 shows some nonlinearities in the relationship
between deaths and forage, questioning the robustness of the results from the linear regression analysis.
The analysis on the relationship between precipitation and the number of deaths and the amount of livestock
stolen during raids, also suggests some nonlinearities. While the regression results shown in Table 4 find only
a significant positive correlation between precipitation and these measures of conflict, Figures 9 and 10 show
nonlinearities as I see both a greater number of deaths and more livestock being stolen during low precipitation
deciles as well as high precipitation deciles.
As a robustness check to address concerns about serial correlation in residuals, I also present regression results
in first differences in Table 5. Here I find that increases in precipitation are associated with increases in both the
number of raids and the amount of livestock stolen, but no relationship between forage and conflict. As a further
robustness check on the results shown in Table 4, Tables 12 to 14 in the appendix, repeat the level regressions,
with each measure of precipitation or forage included individually as a regressor. The coefficient estimates are
approximately stable, whether or not each measure of weather variation is controlled for separately. This is not that
unusual given that there is low contemporaneous correlation between these measures (see Table 3 and Figure 7).
These results on the aggregate impact of forage and precipitation variation on conflict across the Karamoja
Region show a non-linear relationship between pastoral raiding and precipitation, with both more raids occuring
during dry periods as well as during wet periods. This contrasts the earlier qualititative and case study research
by Adano et al. (2009), which found that within Kenya raiding did not occur during dry periods [41], but is in
line with the results reported by Stites et al. (2010) [45], which found that more conflict tended to occur during
the dry periods in Uganda when tribes were forced to graze their animals in closer proximity and share access to
water holes. The results on the relation between forage and conflict are not conclusive for the total number of raids
or deaths measures, but there does appear to be a robust negative relationship between the amount of livestock
20
stolen and forage availability, suggesting that in times of plenty the risk of losing livestock through pastoral raids
decreases. In the following section I will attempt to unpack these results by examining how pastoral raiding is
directed based on tribe level variation in forage and precipitation, to assess whether resource scarcity is at the root
of pastoral raiding, and also whether raids occur in localities with more surface water following rainfall.
4.2 Between Tribe Analysis
Column (1) of Table 6 shows that there appears to be a negative relationship between the level of forage of an
initiating tribe and the probability that they initiate at least one raid. One interpretation of this result is that when
tribes have healthy livestock and larger herd sizes, reflecting their own high level of forage, the marginal gains
to raiding are sufficiently low so that these tribes are unwilling to carry out raids, even though they may have
some advantage in carrying out such raids. This result, however, is not robust to the inclusion of measures of the
target tribe’s forage or precipitation, or lagged measures for either the target’s or initiator’s forage or precipitation.
Correlation between forage or precipitation measures for both the initiating and target tribe is high: 0.913 for
forage, 0.824 for precipitation and 0.836 for drought (see Table 3). This makes it difficult to identify the impact of
each variable separately, as such a high degree of collinearity makes the point estimates imprecise. The coefficient
estimates on the target’s forage measures are also negative, which could suggest that the probability of being able to
successfully execute a raid is important as well. However, given that neither coefficient can be precisely estimated
when the regression controls for both the initiator’s and the target’s resources, it is not possible to conclude whether
the decrease in the likelihood that the initiator attempts a raid is due to a decrease in the marginal returns as the
initiating tribe is resource rich or a decrease in the probability they will be successful, when their target is also
resource rich and more able to resist a raid.
The results on precipitation measure face similar problems of collinearity, and there does not appear to be a
clear relationship between how precipitation fluctuations experienced by either the target or the initiator influence
the direction of raiding. The results on the drought measure are more promising and suggest that when more
of the initiator’s grazing area lacks rainfall, the initiator is more likely to attempt a raid. This result is robust to
controlling for the measure of drought for the target, which does not appear to directly influence the direction of
raiding. Together, these results for the forage and drought measures suggest that desperation is a greater motivator
of pastoral raiding, than strategic predation, with raids being initiated when the marginal returns to raiding are
21
greatest, rather than when the probability of success is highest.17
There is significant serial correlation in the direction of raiding, as demonstrated by the inclusion of the lagged
dependent variable. If the initiator raided the target in the previous month, they are about 11% more likely to
raid them again in the current month. This suggests that there are underlying reasons for raiding that are neither
captured by weather fluctuations or by time constant tensions, such as long term animosity between specific pairs,
or proximity to each other, which should be captured by the directed dyad fixed effects. Grievances and retribution
could potentially explain these trends, since such motives could plausibly vary across time and involve a high level
of autocorrelation. This autocorrelation in conflict is found with the other conflict measures: deaths due to raids
and livestock stolen, and these results can be seen in Table 7 and Table 8.18
Table 7 examines the relationship between forage and precipitation with the death rate due to raids. These
results echo the results found in Table 6 as there does not appear to be a pronounced relationship between either the
initiator’s forage or precipitation measures, or the target’s measures, and the deaths that occur due to raiding. The
results on the drought measure are stronger and suggest that when more of the initiator’s grazing area lacks rainfall,
the total number of deaths due to raiding increases. This result is robust to controlling for the measure of drought
for the target, which appears to have a weakly negative impact on the total number of deaths. Thus, dry weather for
the initiator appears to not only encourage more raiding, but also leads to a higher death rate, while dry weather for
the target may reduce the number of deaths they incur due to raiding.
Table 8 examines the relationship between forage and precipitation with the total number of livestock stolen.
These results are in line with the earlier results as they show that dry weather for the initiator leads to a greater
volume of livestock being stolen, while dry weather for the target appears to weakly reduce this outcome. However,
unlike the earlier analysis, there appears to be a more robust negative relationship between the initiator’s forage and
the amount of livestock they obtain during raids, lending further support to the explanation that during times of
resource scarcity, tribes raid more frequently.
Figures 11 to 16 complement this regression analysis, and show a negative correlation between the target’s
17The results shown in Tables 6 to 8 remain unchanged when monthly fixed effects are included instead of month of year fixed effects,which enable more flexible treatment of any regionwide trends in conflict.
18Tables 15 to 17 estimate the dynamic panel specifications using OLS as well as the GMM procedure proposed by Blundell and Bond(1998) [11]. A comparison of the coefficient estimates on the lagged dependent variable in the OLS results, shown in columns (1)-(3), to theGMM results, shown in columns (4)-(6), demonstrates the positive bias in the OLS estimates, which do not take into account the mechanicalcorrelation between the unobserved panel-level effects and this covariate.
22
forage and the frequency at which they are raided and the amount of livestock they lose through raids. The figures
examining the relationship between the initiator’s forage and raiding, however, show some degree of nonlinearity
with both more raids and more livestock being taken during low and high deciles of the initiator’s forage, which
is not captured in the linear specifications adopted in the regression analysis. The figures examining precipitation
show no systematic relationship between conflict and either the initiator’s or the target’s rainfall exposure.
To summarize these results, I find that:
• there is significant autocorrelation in the direction of raiding, suggesting that grievances and retribution play
an important motivating role for conflict, beyond weather fluctuations or traditional rivalries,
• dry weather increases the likelihood that tribes initiate raids and increases the number of livestock stolen,
but, where feasible, tribes appear to raid targets who were less exposed to the decline in rainfall,
• increases in rainfall to either the target or the initiator do not lead to increases in the level of raiding or impact
the number of livestock stolen,
• while increases to forage reduce the demand to raid by the initiating tribe and the targets’ vulnerability
to raids, the visual analysis from the figures show that there may be some degree of nonlinearity in this
relationship,
• collinearity in the precipitation and forage measures makes it difficult to identify the impact of each variable
separately in the regression analysis.
4.3 Raid Location Analysis
Tables 9 to 11 present the third level of spatial analysis where I use the sublocation by month panel to consider
the relationship between conflict and location-specific weather using more detailed information about where raids
take place. Tables 9 and 11 show a negative relationship between the availability of forage and the location of raids
and the amount of livestock stolen, although the coefficient estimates are only significant for some of the livestock
specifications and relate to about a 2.5-6.5% increase in the number of livestock stolen following a standard de-
viation decrease in the average level of forage in the sublocation. Figures 17 and 19, however, show a less clear
relationship, with both a large number of raids and livestock losses occuring when sublocations record low and
23
high forage levels. The results in Tables 9 to 11 suggest no relationship between the availability of forage in the
surrounding sublocations and conflict in the immediate sublocation. For the regression results at the sublocation
level to be in line with the results analysed at the tribe dyad level, this implies that tribes must raid locally, as the
tribe-dyad analysis showed forage-scarce tribes were more likely to initiate raids.
Tables 9 and 11 show a positive relationship between precipitation in the previous month and the incidence
of raids and the amount of livestock stolen, with a standard deviation increase in precipitation leading to about
a 2% increase in the probability that the sublocation will be raided and about a 8% increase in the number of
livestock stolen, in the following month. These results are consistent with the explanations put forward by Adano
et al. (2009), as they suggested that surface water enables tribes to more easily carry out raids [41], although
it is somewhat surprising that precipitation in the surrounding sublocations does not appear to have any impact
livestock raiding, as one would anticipate the livestock would be moved across sublocations after a raid. However,
this finding is also in line with the explanation that raiding occurs at a very local level. Table 10 shows that the
death rate significantly increases when wet weather is experienced both in the sublocation of the raid and in the
surrounding sublocations: a standard deviation increase in precipitation in the sublocation of the raid increases the
number of deaths by about 2% and a standard deviation increase in precipitation in the neighbouring sublocations
increases the number of deaths by about 5%.
Interestingly, conflict is also more likely to occur in sublocations that lack rainfall. Table 11 shows that after
a month with very little rainfall, sublocations are more vulnerable to livestock losses and Table 10 shows that
during this month sublocations incur more deaths from livestock raids. These findings could be consistent with the
explanations put forward by Stites et al. (2010) [45], that more conflict occurs during the dry periods when tribes
are forced to graze their animals in closer proximity and share access to water holes. Thus, my analysis at the
highest degree of spatial resolution, finds agreement with both the research carried out by Witsenburg, Adano and
Dietz, and Akabwai, Stites and Fries - there is both a greater risk of pastoral raids occuring during months in which
a sublocation experiences very little rainfall and following months in which there has been an abundance of rainfall.
Figures 17 to 19 reinforce these findings and show a bimodal relationship between conflict and precipitation.
At the sublocation level there is also a high degree of serial autocorrelation, with raids being around 10%
more likely to occur if they occurred in the previous month. However, there does not appear to be any spatial
autocorrelation in conflict, indicating that pastoral raiding is less vulnerable to contagion and spatial spillover
24
effects.
To summarize these results I find:
• there is significant serial autocorrelation in the incidence of raiding, but no spatial autocorrelation,
• both dry and wet weather increases the likelihood that a sublocation will be vulnerable to raids, livestock
losses and the associated deaths due to this type of conflict. These impacts are contemporaneous with respect
to the outcomes on deaths, while they occur with a month’s lag with respect to livestock losses.
• the data available has not enabled me to find a strong relationship between forage and raiding at the sublo-
cation level of analysis. There is some indication that sublocations with lower levels of forage are more
vulnerable to raids, but this result is weak.
5 Conclusions
Internal armed conflict is a prevalent issue in the modern world that has attracted a significant amount of academic
attention. In particular, an expansive cross-disciplinary literature has emerged that examines the relationship be-
tween climatic changes and conflict. A recent review of the literature compiled the 50 most rigorous quantitative
studies and found that for each standard deviation change in climate towards more extreme rainfall the frequency
of interpersonal violence rises by 4% and the frequency of intergroup conflict rises by 12% [22]. This paper com-
plements this literature by following similar methodological approaches to earlier studies and focuses on conflict
in Sub-Saharan Africa, but uses a different source of conflict data that contains much more detailed information
on the location of conflict and the groups involved in conflict, enabling a more micro-level analysis of conflict and
weather variation.
The data I use contains detailed information on conflict between tribes in the Karamoja region of East Africa.
This conflict arises during livestock raids where tribes in the region attack each other with the intention of obtaining
livestock. Since pastoralism is the dominant livelihood in the region, this type of conflict can be considered a type
of resource appropriation, where the resources are the animals stolen during raids, and these resources (livestock),
can be expected to fluctuate in quality and quantity with forage and precipitation variation in the region.
However, even within this context of conflict between tribes, forage and precipitation variation could have an
25
ambiguous effect. On the one hand, positive resource fluctuations could increase a tribe’s probability of completing
a successful raid, but on the other hand, positive resource fluctuations may lower a tribe’s marginal utility from
a successful raid. Similarly, the resources of the target could have an ambiguous impact on the initiating tribe’s
decision to raid: a target with greater resources may be more attractive as the potential rewards to raiding them will
be higher, but the probability of successfully raiding them may be lower. Furthermore, climatic conditions may
directly influence the ease at which livestock raids can be carried out. For example, vegetation coverage can help
raiders to hide before ambushing their target, and surface water from rainfall can making tracking animals easier
(Adano and Witsenburg 2005 [48]).
My results suggest that across the region there is a bimodal relationship between conflict and precipitation,
with more pastoral raids occurring when there is both very little and a lot of rainfall across the Karamoja region.
A standard deviation increase in the average level of precipitation leads to an increase in raids per month of about
22%, and an increase in the proportion of land with no rainfall of 0.1 leads to a 4% increase in raids per month.
A standard deviation decrease in average level of forage has no impact on the number of raids per month, but
increases the number of deaths by 23% and the number of livestock stolen by 44%. Thus, at the aggregate level
there is evidence of resource-scarcity leading to more conflict and wet weather improving the conditions for raiding.
When tribe specific and sublocation specific variation in resources is examined, the relationship between forage
and raiding is less clear. There is some indication that forage-scarcity motivates tribes to carry out raids and forage-
scarce sublocations appear to be more vulnerable to raids and livestock losses, but these results are not robust to all
specifications. Regardless though, my results are not in agreement with earlier empirical work using the same data,
that found that greater vegetation coverage led to more raids [31].
There is also a bimodal relationship between conflict and precipitation at the sublocation level, with a higher
likelihood of raids occurring in the month following both very little and a lot of rainfall. The death rate is higher in
months with either very little or a lot of rainfall as well. At the tribe-dyad level, I find that tribes that have recently
experienced very dry weather are more likely to initiate raids, steal more livestock, and be responsible for a larger
number of pastoral deaths, but I do not find that extreme positive deviations of precipitation affect these outcomes.
Together these results suggest that conflict in the Karamoja region is correlated with extreme precipitation
fluctuations in either a positive or negative direction. Forage-scarcity may also be a motivator for tribes to initiate
raids, but this relationship is weak and would benefit from a longer time series of data or direct data on herd sizes
26
and health, to help to conclusively identify any type of systematic relationship. Thus, these results are consistent
with raids occurring when tribes encounter the greatest marginal gains to raiding because they are resource-scarce,
due to both negative forage and precipitation deviations, but they are also consistent with several other explanations.
First, that surface water may increase the ease at which tribes can successully carry out raids, encouraging more
raiding, and second, that conflict is more likely to erupt when tribes are forced to locate in closer proximity because
access to forage and water is more scarce. To distinguish between these channels, more precise data on the grazing
locations of different tribes, across time and space, would be very helpful. Furthermore, there is a significant degree
of serial autocorrelation in conflict, suggesting that there are other important motives for pastoral raiding that are
not correlated with weather variation, but do vary across time.
27
References
[1] Small Arms Survey 2006: Unfinished Business. Oxford University Press, 2006.
[2] Ethnologue: Languages of the World, 2011.
[3] Wario R Adano, Ton Dietz, Karen Witsenburg, and Fred Zaal. Climate change, violent conflict and local
institutions in Kenya’s drylands. Journal of Peace Research, 49(1):65–80, 2012.
[4] Darlington Akabwai and Priscillar E. Ateyo. The Scramble for Cattle, Power and Guns in Karamoja. Feinstein
International Center, Tufts University, 2007.
[5] Luc Anselin. Spatial econometrics: methods and models, volume 4. Kluwer Academic Pub, 1988.
[6] Manuel Arellano and Stephen Bond. Some tests of specification for panel data: Monte Carlo evidence and an
application to employment equations. The Review of Economic Studies, 58(2):277–297, 1991.
[7] Manuel Arellano and Olympia Bover. Another look at the instrumental variable estimation of error-
components models. Journal of econometrics, 68(1):29–51, 1995.
[8] Federico Belotti, Gordon Hughes, and Andrea Piano Mortari. XSMLE: Stata module for spatial panel data
models estimation. Statistical Software Components, 2013.
[9] James Bevan. Crisis in Karamoja: Armed Violence and the Failure of Disarmament in Uganda’s Most De-
prived Region. An Occasional Paper of the Small Arms Survey, 2008.
[10] C. Blattman and E. Miguel. Civil War. Journal of Economic Literature, 48:3–57, 2010.
[11] Richard Blundell and Stephen Bond. Initial conditions and moment restrictions in dynamic panel data models.
Journal of econometrics, 87(1):115–143, 1998.
[12] E.O. Box, B.N. Holben, and V. Kalb. Accuracy of the AVHRR vegetation index as a predictor of biomass,
primary productivity and net CO2 flux. Plant Ecology, 80(2):71–89, 1989.
[13] Christopher K Butler and Scott Gates. African range wars: Climate, conflict, and property rights. Journal of
Peace Research, 49(1):23–34, 2012.
28
[14] MJ Coe, DH Cumming, and J. Phillipson. Biomass and production of large African herbivores in relation to
rainfall and primary production. Oecologia, 22(4):341–354, 1976.
[15] David M Drukker, Hua Peng, Ingmar Prucha, and Rafal Raciborski. SPPACK: Stata module for cross-section
spatial-autoregressive models. Statistical Software Components, 2012.
[16] R. East. Rainfall, soil nutrient status and biomass of large African savanna mammals. African Journal of
Ecology, 22(4):245–270, 1984.
[17] J Paul Elhorst. Spatial panel data models. In Handbook of applied spatial analysis, pages 377–407. Springer,
2010.
[18] Beverly Gartrell. The Roots of Famine: The Case of Karamoja. Review of African Political Economy, pages
102–110, 1985.
[19] Mariaflavia Harari and Eliana La Ferrara. Conflict, Climate and Cells: A disaggregated analysis. 2012.
[20] M.J. Hill and G.E. Donald. Estimating spatio-temporal patterns of agricultural productivity in fragmented
landscapes using AVHRR NDVI time series. Remote Sensing of Environment, 84(3):367–384, 2003.
[21] D.L. Horowitz. Ethnic groups in conflict, volume 387. Univ of California Pr, 1985.
[22] M. Burke Hsiang, S.M. and E. Miguel. Quantifying the climatic influence on human conflict, violence and
political instability. unpublished manuscript, 2013.
[23] L.B. Jabs. You can’t kill a louse with one finger: A case study of interpersonal conflict in Karamoja, Uganda.
Peace & Change, 35(3):483–501, 2010.
[24] S. Kratli. Education provision to nomadic pastoralists. Institute of Development Studies (IDS), 2001.
[25] Lung-fei Lee and Jihai Yu. Estimation of spatial autoregressive panel data models with fixed effects. Journal
of Econometrics, 154(2):165–185, 2010.
[26] Michael Little. Human biology, health, and ecology of nomadic Turkana pastoralists, chapter 7. The Human
Biology of Pastoral Populations. Cambridge University Press, 2008.
29
[27] Sarah Mathew and Robert Boyd. Punishment sustains large-scale cooperation in prestate warfare. Proceedings
of the National Academy of Sciences, 108(28):11375–11380, 2011.
[28] N. Mburu. Warriors and guns: The anthropology of cattle rustling in Northeastern Africa. Open fire: under-
standing global gun cultures, page 71, 2007.
[29] J.T. McCabe. Turkana pastoralism: A case against the tragedy of the commons. Human Ecology, 18(1):81–
103, 1990.
[30] J.T. McCabe and J.E. Ellis. Beating the odds in arid africa. Natural history. New York NY, 96(1):32–32, 1987.
[31] Patrick Meier, Doug Bond, and Joe Bond. Environmental influences on pastoral conflict in the Horn of Africa.
Political Geography, 26(6):716–735, 2007.
[32] E. Miguel, S. Satyanath, and E. Sergenti. Economic shocks and civil conflict: An instrumental variables
approach. Journal of Political Economy, pages 725–753, 2004.
[33] Beth Njeri Njiru. Climate change, resource competition, and conflict amongst pastoral communities in Kenya.
In Climate Change, Human Security and Violent Conflict, pages 513–527. Springer, 2012.
[34] M. Oesterheld, CM DiBella, and H. Kerdiles. Relation between NOAA-AVHRR satellite data and stocking
rate of rangelands. Ecological Applications, 8(1):207–212, 1998.
[35] John O’Loughlin, Frank DW Witmer, Andrew M Linke, Arlene Laing, Andrew Gettelman, and Jimy Dudhia.
Climate variability and conflict risk in East Africa, 1990–2009. Proceedings of the National Academy of
Sciences, 109(45):18344–18349, 2012.
[36] Joe Powell. Karamoja: A Literature Review. SaferWorld Policy Paper, 2010.
[37] Michael D. Quam. Creating Peace in an Armed Societ: Karamoja, Uganda. African Studies Quarterly,
1:33–46, 1997.
[38] Clionadh Raleigh. Political marginalization, climate change, and conflict in African Sahel states. International
Studies Review, 12(1):69–86, 2010.
30
[39] Clionadh Raleigh and Dominic Kniveton. Come rain or shine: An analysis of conflict and climate variability
in East Africa. Journal of Peace Research, 49(1):51–64, 2012.
[40] Clionadh Raleigh, Andrew Linke, Håvard Hegre, and Joakim Karlsen. Introducing ACLED: An armed con-
flict location and event dataset special data feature. Journal of peace Research, 47(5):651–660, 2010.
[41] A Wario Roba, Karen Witsenburg, and Ton Dietz. Scarcity of natural resources and pastoral conflicts in
northern Kenya: an inquiry. Horn of Africa Bulletin, 2009(1):1–5, 2009.
[42] Paul Leslie Sandra Gray and Helen Alinga Akol. Uncertain disaster: environmental instability, colonial
policy, and resilience of East African pastoral systems, chapter 5. The Human Biology of Pastoral Populations.
Cambridge University Press, 2008.
[43] Janpeter Schilling, Francis EO Opiyo, and Jürgen Scheffran. Raiding pastoral livelihoods: motives and effects
of violent conflict in north-western Kenya. Pastoralism, 2(1):1–16, 2012.
[44] Wolfram Schlenker and David B Lobell. Robust negative impacts of climate change on African agriculture.
Environmental Research Letters, 5(1):014010, 2010.
[45] Elizabeth Stites, Lorin Fries, and Darlington Akabwai. Foraging and fighting: Community perspectives on
natural resources and conflict in Southern Karamoja. Medford, MA: Feinstein International Center, 2010.
[46] Angerer Jay Kaitho Robert Jama Abdi Marambii Raphael Boken VK Cracknell AP Stuth, Jerry W and
RL Heathcote. Livestock early warning system for Africa rangelands. Monitoring and predicting agricultural
drought: a global study. New York, NY, USA: Oxford, pages 283–296, 2005.
[47] Department of Peace Uppsala Conflict Data Program (UCDP) and Uppsala University Conflict Research.
Ucdp non-state conflict dataset v2.1 2002-2007. http://www.ucdp.uu.se/gpdatabase/search.php, Accessed
March 2013.
[48] Karen Margaret Witsenburg and Adano Wario Roba. Surviving pastoral decline: pastoral sedentarisation,
natural resource management and livelihood diversification in Marsabit District, Northern Kenya: Vol. ii.
2005.
31
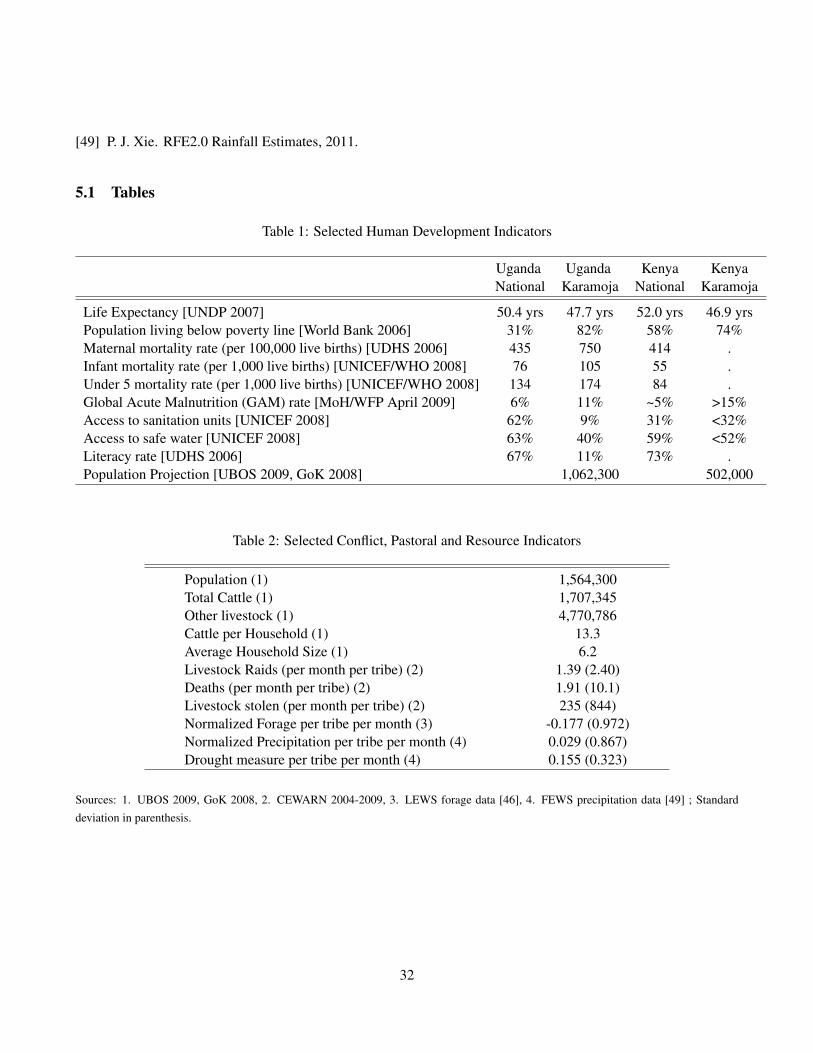
[49] P. J. Xie. RFE2.0 Rainfall Estimates, 2011.
5.1 Tables
Table 1: Selected Human Development Indicators
Uganda Uganda Kenya KenyaNational Karamoja National Karamoja
Life Expectancy [UNDP 2007] 50.4 yrs 47.7 yrs 52.0 yrs 46.9 yrsPopulation living below poverty line [World Bank 2006] 31% 82% 58% 74%Maternal mortality rate (per 100,000 live births) [UDHS 2006] 435 750 414 .Infant mortality rate (per 1,000 live births) [UNICEF/WHO 2008] 76 105 55 .Under 5 mortality rate (per 1,000 live births) [UNICEF/WHO 2008] 134 174 84 .Global Acute Malnutrition (GAM) rate [MoH/WFP April 2009] 6% 11% ~5% >15%Access to sanitation units [UNICEF 2008] 62% 9% 31% <32%Access to safe water [UNICEF 2008] 63% 40% 59% <52%Literacy rate [UDHS 2006] 67% 11% 73% .Population Projection [UBOS 2009, GoK 2008] 1,062,300 502,000
Table 2: Selected Conflict, Pastoral and Resource Indicators
Population (1) 1,564,300Total Cattle (1) 1,707,345Other livestock (1) 4,770,786Cattle per Household (1) 13.3Average Household Size (1) 6.2Livestock Raids (per month per tribe) (2) 1.39 (2.40)Deaths (per month per tribe) (2) 1.91 (10.1)Livestock stolen (per month per tribe) (2) 235 (844)Normalized Forage per tribe per month (3) -0.177 (0.972)Normalized Precipitation per tribe per month (4) 0.029 (0.867)Drought measure per tribe per month (4) 0.155 (0.323)
Sources: 1. UBOS 2009, GoK 2008, 2. CEWARN 2004-2009, 3. LEWS forage data [46], 4. FEWS precipitation data [49] ; Standard
deviation in parenthesis.
32
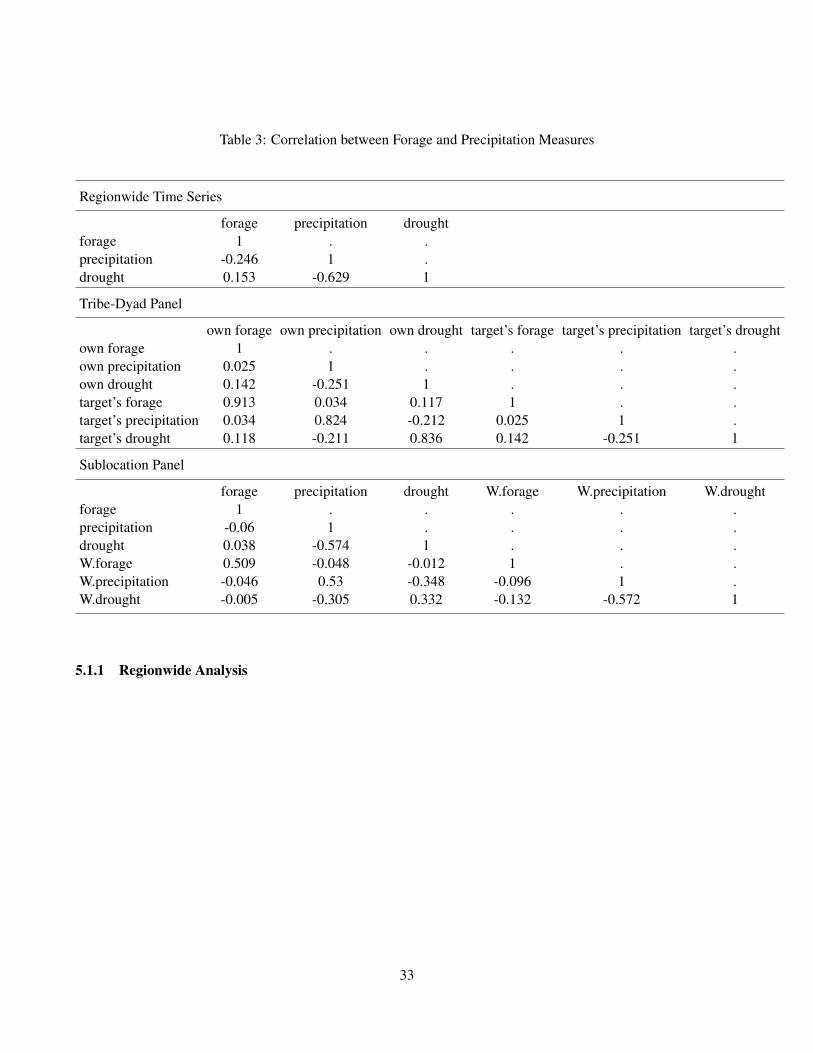
Table 3: Correlation between Forage and Precipitation Measures
Regionwide Time Series
forage precipitation droughtforage 1 . .precipitation -0.246 1 .drought 0.153 -0.629 1
Tribe-Dyad Panel
own forage own precipitation own drought target’s forage target’s precipitation target’s droughtown forage 1 . . . . .own precipitation 0.025 1 . . . .own drought 0.142 -0.251 1 . . .target’s forage 0.913 0.034 0.117 1 . .target’s precipitation 0.034 0.824 -0.212 0.025 1 .target’s drought 0.118 -0.211 0.836 0.142 -0.251 1
Sublocation Panel
forage precipitation drought W.forage W.precipitation W.droughtforage 1 . . . . .precipitation -0.06 1 . . . .drought 0.038 -0.574 1 . . .W.forage 0.509 -0.048 -0.012 1 . .W.precipitation -0.046 0.53 -0.348 -0.096 1 .W.drought -0.005 -0.305 0.332 -0.132 -0.572 1
5.1.1 Regionwide Analysis
33
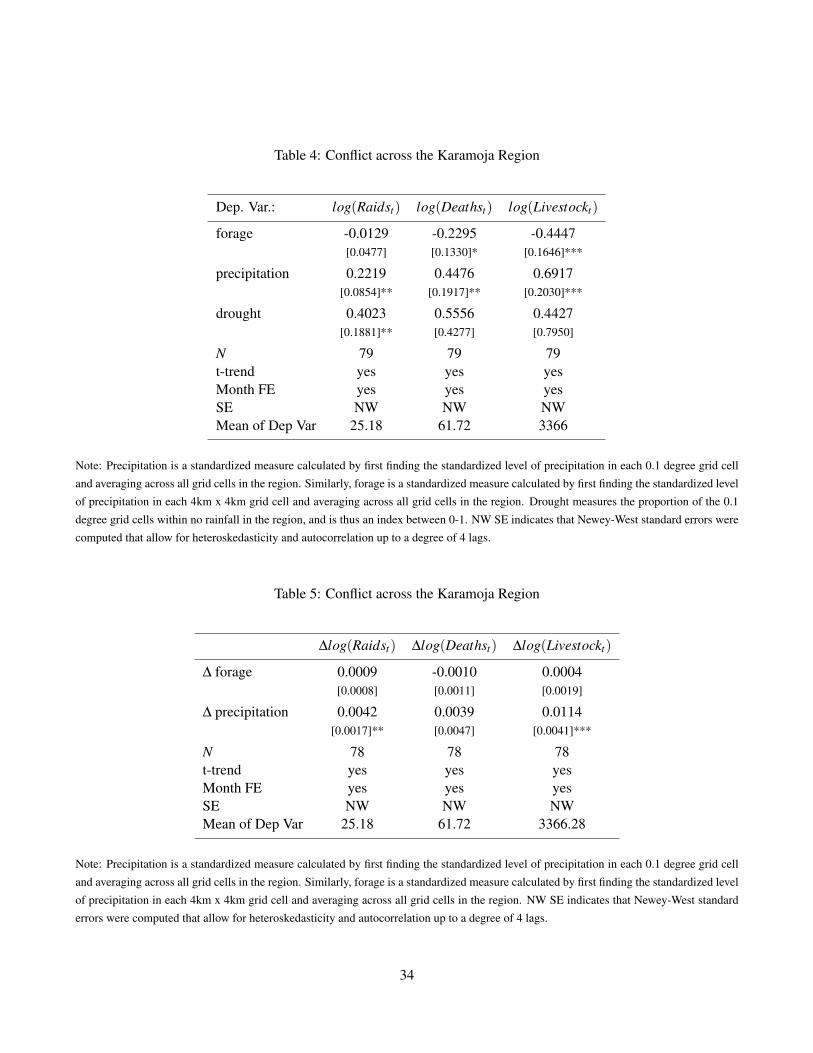
Table 4: Conflict across the Karamoja Region
Dep. Var.: log(Raidst) log(Deathst) log(Livestockt)
forage -0.0129 -0.2295 -0.4447[0.0477] [0.1330]* [0.1646]***
precipitation 0.2219 0.4476 0.6917[0.0854]** [0.1917]** [0.2030]***
drought 0.4023 0.5556 0.4427[0.1881]** [0.4277] [0.7950]
N 79 79 79t-trend yes yes yesMonth FE yes yes yesSE NW NW NWMean of Dep Var 25.18 61.72 3366
Note: Precipitation is a standardized measure calculated by first finding the standardized level of precipitation in each 0.1 degree grid cell
and averaging across all grid cells in the region. Similarly, forage is a standardized measure calculated by first finding the standardized level
of precipitation in each 4km x 4km grid cell and averaging across all grid cells in the region. Drought measures the proportion of the 0.1
degree grid cells within no rainfall in the region, and is thus an index between 0-1. NW SE indicates that Newey-West standard errors were
computed that allow for heteroskedasticity and autocorrelation up to a degree of 4 lags.
Table 5: Conflict across the Karamoja Region
∆log(Raidst) ∆log(Deathst) ∆log(Livestockt)
∆ forage 0.0009 -0.0010 0.0004[0.0008] [0.0011] [0.0019]
∆ precipitation 0.0042 0.0039 0.0114[0.0017]** [0.0047] [0.0041]***
N 78 78 78t-trend yes yes yesMonth FE yes yes yesSE NW NW NWMean of Dep Var 25.18 61.72 3366.28
Note: Precipitation is a standardized measure calculated by first finding the standardized level of precipitation in each 0.1 degree grid cell
and averaging across all grid cells in the region. Similarly, forage is a standardized measure calculated by first finding the standardized level
of precipitation in each 4km x 4km grid cell and averaging across all grid cells in the region. NW SE indicates that Newey-West standard
errors were computed that allow for heteroskedasticity and autocorrelation up to a degree of 4 lags.
34

5.1.2 Tribe-dyad Analysis
35
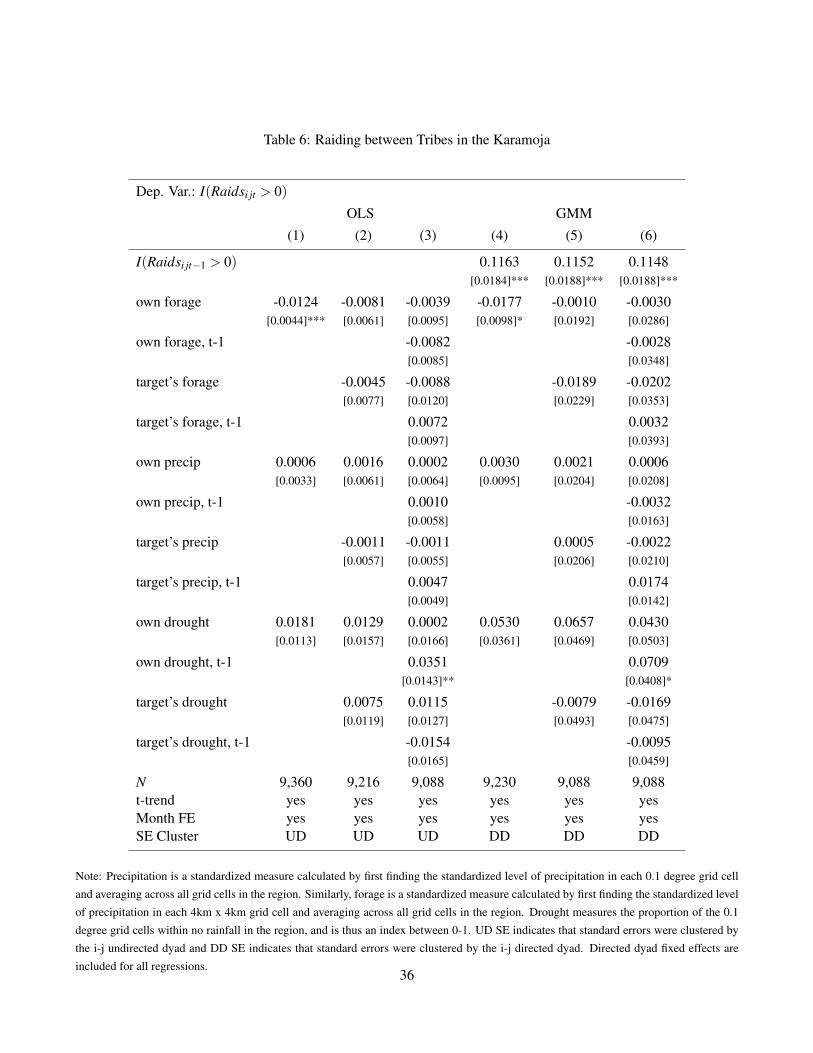
Table 6: Raiding between Tribes in the Karamoja
Dep. Var.: I(Raidsi jt > 0)
OLS GMM
(1) (2) (3) (4) (5) (6)
I(Raidsi jt−1 > 0) 0.1163 0.1152 0.1148[0.0184]*** [0.0188]*** [0.0188]***
own forage -0.0124 -0.0081 -0.0039 -0.0177 -0.0010 -0.0030[0.0044]*** [0.0061] [0.0095] [0.0098]* [0.0192] [0.0286]
own forage, t-1 -0.0082 -0.0028[0.0085] [0.0348]
target’s forage -0.0045 -0.0088 -0.0189 -0.0202[0.0077] [0.0120] [0.0229] [0.0353]
target’s forage, t-1 0.0072 0.0032[0.0097] [0.0393]
own precip 0.0006 0.0016 0.0002 0.0030 0.0021 0.0006[0.0033] [0.0061] [0.0064] [0.0095] [0.0204] [0.0208]
own precip, t-1 0.0010 -0.0032[0.0058] [0.0163]
target’s precip -0.0011 -0.0011 0.0005 -0.0022[0.0057] [0.0055] [0.0206] [0.0210]
target’s precip, t-1 0.0047 0.0174[0.0049] [0.0142]
own drought 0.0181 0.0129 0.0002 0.0530 0.0657 0.0430[0.0113] [0.0157] [0.0166] [0.0361] [0.0469] [0.0503]
own drought, t-1 0.0351 0.0709[0.0143]** [0.0408]*
target’s drought 0.0075 0.0115 -0.0079 -0.0169[0.0119] [0.0127] [0.0493] [0.0475]
target’s drought, t-1 -0.0154 -0.0095[0.0165] [0.0459]
N 9,360 9,216 9,088 9,230 9,088 9,088t-trend yes yes yes yes yes yesMonth FE yes yes yes yes yes yesSE Cluster UD UD UD DD DD DD
Note: Precipitation is a standardized measure calculated by first finding the standardized level of precipitation in each 0.1 degree grid cell
and averaging across all grid cells in the region. Similarly, forage is a standardized measure calculated by first finding the standardized level
of precipitation in each 4km x 4km grid cell and averaging across all grid cells in the region. Drought measures the proportion of the 0.1
degree grid cells within no rainfall in the region, and is thus an index between 0-1. UD SE indicates that standard errors were clustered by
the i-j undirected dyad and DD SE indicates that standard errors were clustered by the i-j directed dyad. Directed dyad fixed effects are
included for all regressions.36

Table 7: Deaths due to Raids between Tribes in the Karamoja
Dep. Var.: log(Deathsi jt)
OLS GMM
(1) (2) (3) (4) (5) (6)
log(Deathsi jt−1) 0.1315 0.1321 0.1306[0.0249]*** [0.0251]*** [0.0252]***
own forage -0.0046 -0.0081 -0.0053 -0.0086 -0.0271 -0.0434[0.0057] [0.0074] [0.0128] [0.0134] [0.0235] [0.0391]
own forage, t-1 -0.0077 0.0212[0.0110] [0.0358]
target’s forage 0.0037 0.0059 0.0179 0.0343[0.0065] [0.0141] [0.0256] [0.0381]
target’s forage, t-1 0.0034 -0.0194[0.0116] [0.0347]
own precip 0.0034 -0.0019 -0.0029 0.0165 0.0032 0.0061[0.0061] [0.0094] [0.0095] [0.0183] [0.0230] [0.0248]
own precip, t-1 -0.0062 -0.0099[0.0080] [0.0303]
target’s precip 0.0066 0.0085 0.0130 0.0127[0.0066] [0.0065] [0.0227] [0.0247]
target’s precip, t-1 0.0007 0.0028[0.0072] [0.0296]
own drought 0.0443 0.0744 0.0647 0.2160 0.2995 0.2717[0.0153]*** [0.0293]** [0.0283]** [0.0525]*** [0.0759]*** [0.0746]***
own drought, t-1 0.0268 0.0843[0.0192] [0.0845]
target’s drought -0.0392 -0.0334 -0.1207 -0.1339[0.0245] [0.0214] [0.0852] [0.0771]*
target’s drought, t-1 -0.0191 -0.0106[0.0199] [0.0651]
N 9,360 9,216 9,088 9,230 9,088 9,088t-trend yes yes yes yes yes yesMonth FE yes yes yes yes yes yesSE Cluster UD UD UD DD DD DD
Note: Precipitation is a standardized measure calculated by first finding the standardized level of precipitation in each 0.1 degree grid cell
and averaging across all grid cells in the region. Similarly, forage is a standardized measure calculated by first finding the standardized level
of precipitation in each 4km x 4km grid cell and averaging across all grid cells in the region. Drought measures the proportion of the 0.1
degree grid cells within no rainfall in the region, and is thus an index between 0-1. UD SE indicates that standard errors were clustered by
the i-j undirected dyad and DD SE indicates that standard errors were clustered by the i-j directed dyad. Directed dyad fixed effects are
included for all regressions.37
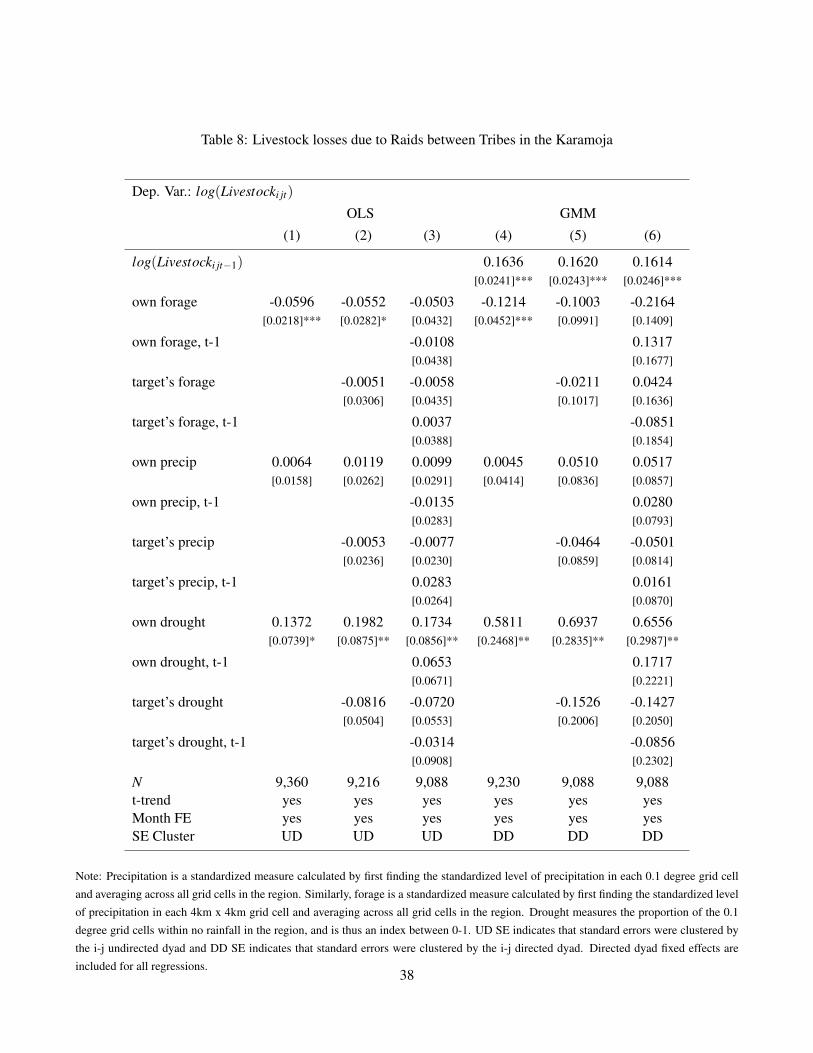
Table 8: Livestock losses due to Raids between Tribes in the Karamoja
Dep. Var.: log(Livestocki jt)
OLS GMM
(1) (2) (3) (4) (5) (6)
log(Livestocki jt−1) 0.1636 0.1620 0.1614[0.0241]*** [0.0243]*** [0.0246]***
own forage -0.0596 -0.0552 -0.0503 -0.1214 -0.1003 -0.2164[0.0218]*** [0.0282]* [0.0432] [0.0452]*** [0.0991] [0.1409]
own forage, t-1 -0.0108 0.1317[0.0438] [0.1677]
target’s forage -0.0051 -0.0058 -0.0211 0.0424[0.0306] [0.0435] [0.1017] [0.1636]
target’s forage, t-1 0.0037 -0.0851[0.0388] [0.1854]
own precip 0.0064 0.0119 0.0099 0.0045 0.0510 0.0517[0.0158] [0.0262] [0.0291] [0.0414] [0.0836] [0.0857]
own precip, t-1 -0.0135 0.0280[0.0283] [0.0793]
target’s precip -0.0053 -0.0077 -0.0464 -0.0501[0.0236] [0.0230] [0.0859] [0.0814]
target’s precip, t-1 0.0283 0.0161[0.0264] [0.0870]
own drought 0.1372 0.1982 0.1734 0.5811 0.6937 0.6556[0.0739]* [0.0875]** [0.0856]** [0.2468]** [0.2835]** [0.2987]**
own drought, t-1 0.0653 0.1717[0.0671] [0.2221]
target’s drought -0.0816 -0.0720 -0.1526 -0.1427[0.0504] [0.0553] [0.2006] [0.2050]
target’s drought, t-1 -0.0314 -0.0856[0.0908] [0.2302]
N 9,360 9,216 9,088 9,230 9,088 9,088t-trend yes yes yes yes yes yesMonth FE yes yes yes yes yes yesSE Cluster UD UD UD DD DD DD
Note: Precipitation is a standardized measure calculated by first finding the standardized level of precipitation in each 0.1 degree grid cell
and averaging across all grid cells in the region. Similarly, forage is a standardized measure calculated by first finding the standardized level
of precipitation in each 4km x 4km grid cell and averaging across all grid cells in the region. Drought measures the proportion of the 0.1
degree grid cells within no rainfall in the region, and is thus an index between 0-1. UD SE indicates that standard errors were clustered by
the i-j undirected dyad and DD SE indicates that standard errors were clustered by the i-j directed dyad. Directed dyad fixed effects are
included for all regressions.38

5.1.3 Sublocation Analysis
39
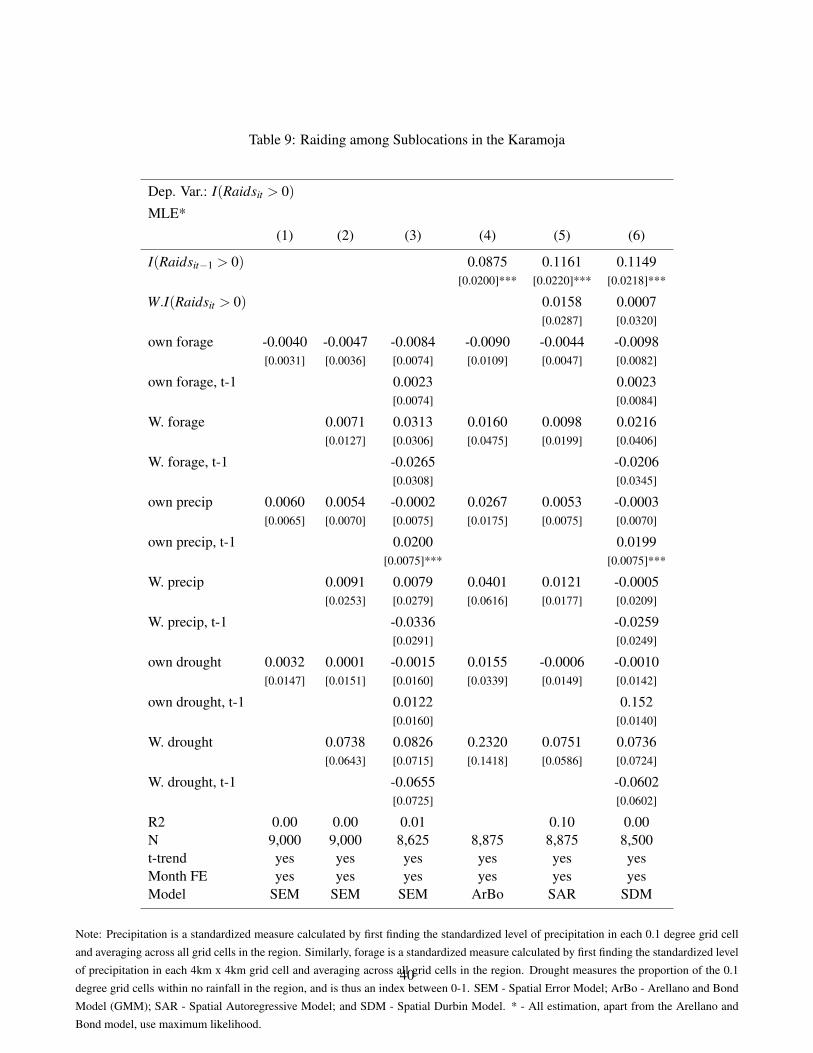
Table 9: Raiding among Sublocations in the Karamoja
Dep. Var.: I(Raidsit > 0)
MLE*
(1) (2) (3) (4) (5) (6)
I(Raidsit−1 > 0) 0.0875 0.1161 0.1149[0.0200]*** [0.0220]*** [0.0218]***
W.I(Raidsit > 0) 0.0158 0.0007[0.0287] [0.0320]
own forage -0.0040 -0.0047 -0.0084 -0.0090 -0.0044 -0.0098[0.0031] [0.0036] [0.0074] [0.0109] [0.0047] [0.0082]
own forage, t-1 0.0023 0.0023[0.0074] [0.0084]
W. forage 0.0071 0.0313 0.0160 0.0098 0.0216[0.0127] [0.0306] [0.0475] [0.0199] [0.0406]
W. forage, t-1 -0.0265 -0.0206[0.0308] [0.0345]
own precip 0.0060 0.0054 -0.0002 0.0267 0.0053 -0.0003[0.0065] [0.0070] [0.0075] [0.0175] [0.0075] [0.0070]
own precip, t-1 0.0200 0.0199[0.0075]*** [0.0075]***
W. precip 0.0091 0.0079 0.0401 0.0121 -0.0005[0.0253] [0.0279] [0.0616] [0.0177] [0.0209]
W. precip, t-1 -0.0336 -0.0259[0.0291] [0.0249]
own drought 0.0032 0.0001 -0.0015 0.0155 -0.0006 -0.0010[0.0147] [0.0151] [0.0160] [0.0339] [0.0149] [0.0142]
own drought, t-1 0.0122 0.152[0.0160] [0.0140]
W. drought 0.0738 0.0826 0.2320 0.0751 0.0736[0.0643] [0.0715] [0.1418] [0.0586] [0.0724]
W. drought, t-1 -0.0655 -0.0602[0.0725] [0.0602]
R2 0.00 0.00 0.01 0.10 0.00N 9,000 9,000 8,625 8,875 8,875 8,500t-trend yes yes yes yes yes yesMonth FE yes yes yes yes yes yesModel SEM SEM SEM ArBo SAR SDM
Note: Precipitation is a standardized measure calculated by first finding the standardized level of precipitation in each 0.1 degree grid cell
and averaging across all grid cells in the region. Similarly, forage is a standardized measure calculated by first finding the standardized level
of precipitation in each 4km x 4km grid cell and averaging across all grid cells in the region. Drought measures the proportion of the 0.1
degree grid cells within no rainfall in the region, and is thus an index between 0-1. SEM - Spatial Error Model; ArBo - Arellano and Bond
Model (GMM); SAR - Spatial Autoregressive Model; and SDM - Spatial Durbin Model. * - All estimation, apart from the Arellano and
Bond model, use maximum likelihood.
40
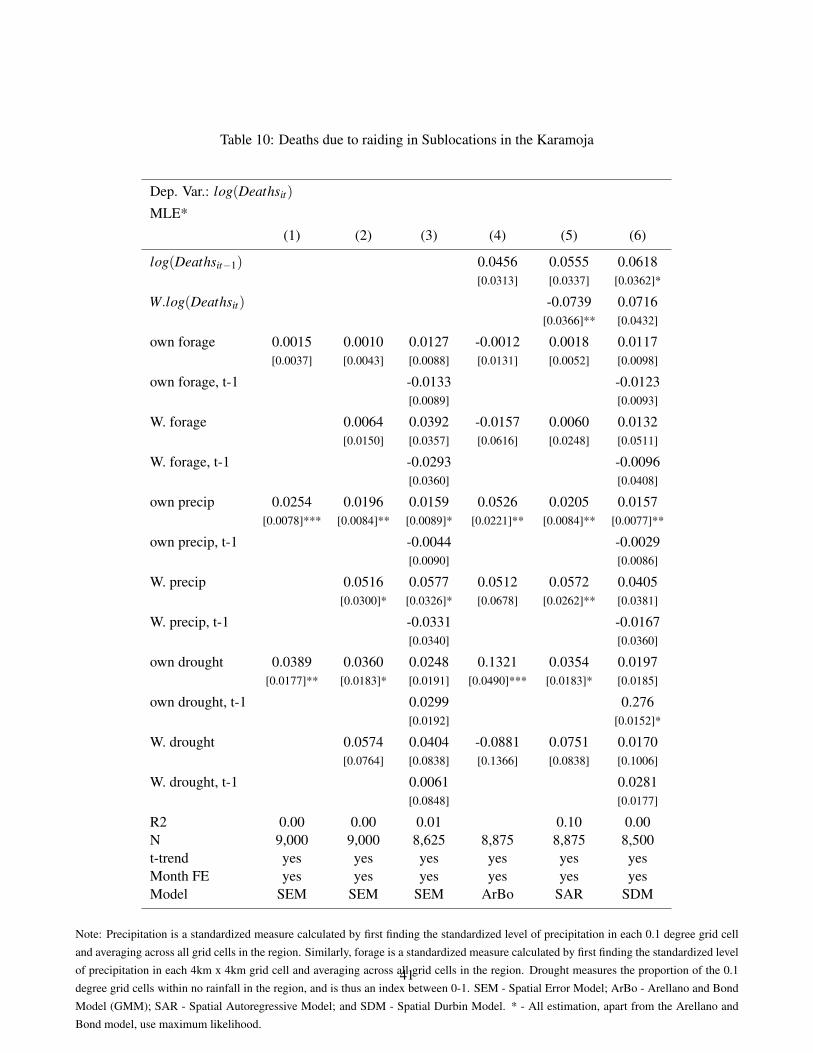
Table 10: Deaths due to raiding in Sublocations in the Karamoja
Dep. Var.: log(Deathsit)
MLE*
(1) (2) (3) (4) (5) (6)
log(Deathsit−1) 0.0456 0.0555 0.0618[0.0313] [0.0337] [0.0362]*
W.log(Deathsit) -0.0739 0.0716[0.0366]** [0.0432]
own forage 0.0015 0.0010 0.0127 -0.0012 0.0018 0.0117[0.0037] [0.0043] [0.0088] [0.0131] [0.0052] [0.0098]
own forage, t-1 -0.0133 -0.0123[0.0089] [0.0093]
W. forage 0.0064 0.0392 -0.0157 0.0060 0.0132[0.0150] [0.0357] [0.0616] [0.0248] [0.0511]
W. forage, t-1 -0.0293 -0.0096[0.0360] [0.0408]
own precip 0.0254 0.0196 0.0159 0.0526 0.0205 0.0157[0.0078]*** [0.0084]** [0.0089]* [0.0221]** [0.0084]** [0.0077]**
own precip, t-1 -0.0044 -0.0029[0.0090] [0.0086]
W. precip 0.0516 0.0577 0.0512 0.0572 0.0405[0.0300]* [0.0326]* [0.0678] [0.0262]** [0.0381]
W. precip, t-1 -0.0331 -0.0167[0.0340] [0.0360]
own drought 0.0389 0.0360 0.0248 0.1321 0.0354 0.0197[0.0177]** [0.0183]* [0.0191] [0.0490]*** [0.0183]* [0.0185]
own drought, t-1 0.0299 0.276[0.0192] [0.0152]*
W. drought 0.0574 0.0404 -0.0881 0.0751 0.0170[0.0764] [0.0838] [0.1366] [0.0838] [0.1006]
W. drought, t-1 0.0061 0.0281[0.0848] [0.0177]
R2 0.00 0.00 0.01 0.10 0.00N 9,000 9,000 8,625 8,875 8,875 8,500t-trend yes yes yes yes yes yesMonth FE yes yes yes yes yes yesModel SEM SEM SEM ArBo SAR SDM
Note: Precipitation is a standardized measure calculated by first finding the standardized level of precipitation in each 0.1 degree grid cell
and averaging across all grid cells in the region. Similarly, forage is a standardized measure calculated by first finding the standardized level
of precipitation in each 4km x 4km grid cell and averaging across all grid cells in the region. Drought measures the proportion of the 0.1
degree grid cells within no rainfall in the region, and is thus an index between 0-1. SEM - Spatial Error Model; ArBo - Arellano and Bond
Model (GMM); SAR - Spatial Autoregressive Model; and SDM - Spatial Durbin Model. * - All estimation, apart from the Arellano and
Bond model, use maximum likelihood.
41
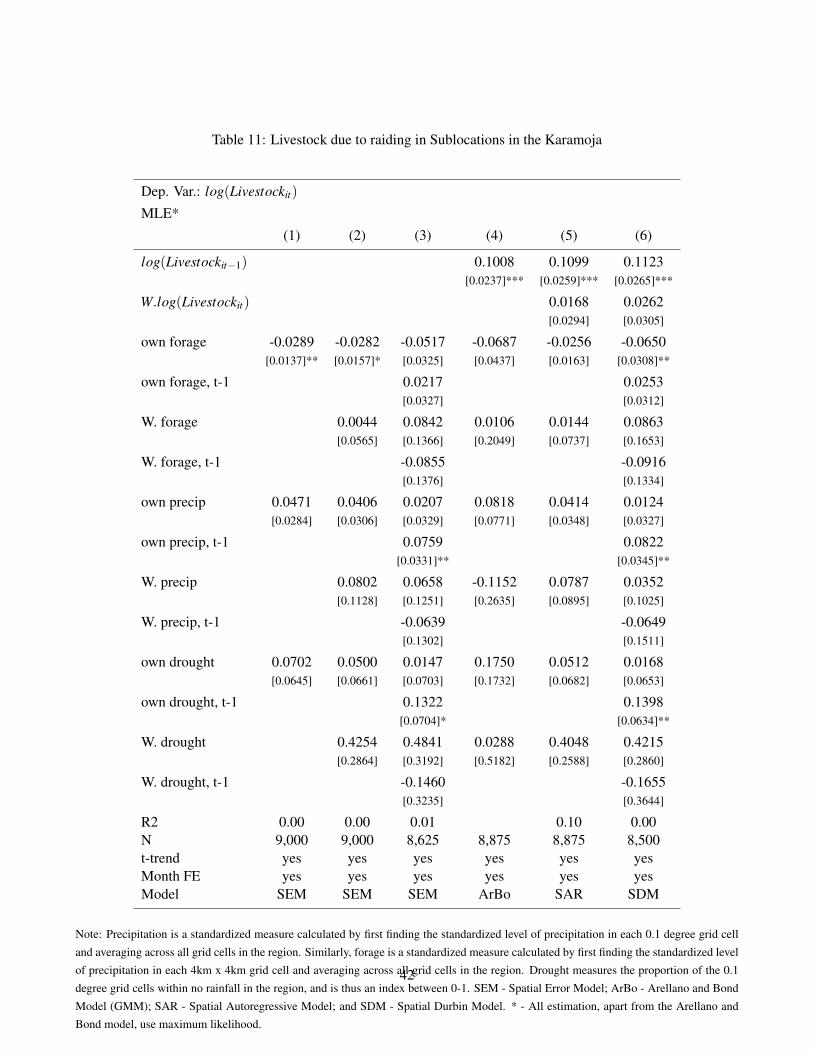
Table 11: Livestock due to raiding in Sublocations in the Karamoja
Dep. Var.: log(Livestockit)
MLE*
(1) (2) (3) (4) (5) (6)
log(Livestockit−1) 0.1008 0.1099 0.1123[0.0237]*** [0.0259]*** [0.0265]***
W.log(Livestockit) 0.0168 0.0262[0.0294] [0.0305]
own forage -0.0289 -0.0282 -0.0517 -0.0687 -0.0256 -0.0650[0.0137]** [0.0157]* [0.0325] [0.0437] [0.0163] [0.0308]**
own forage, t-1 0.0217 0.0253[0.0327] [0.0312]
W. forage 0.0044 0.0842 0.0106 0.0144 0.0863[0.0565] [0.1366] [0.2049] [0.0737] [0.1653]
W. forage, t-1 -0.0855 -0.0916[0.1376] [0.1334]
own precip 0.0471 0.0406 0.0207 0.0818 0.0414 0.0124[0.0284] [0.0306] [0.0329] [0.0771] [0.0348] [0.0327]
own precip, t-1 0.0759 0.0822[0.0331]** [0.0345]**
W. precip 0.0802 0.0658 -0.1152 0.0787 0.0352[0.1128] [0.1251] [0.2635] [0.0895] [0.1025]
W. precip, t-1 -0.0639 -0.0649[0.1302] [0.1511]
own drought 0.0702 0.0500 0.0147 0.1750 0.0512 0.0168[0.0645] [0.0661] [0.0703] [0.1732] [0.0682] [0.0653]
own drought, t-1 0.1322 0.1398[0.0704]* [0.0634]**
W. drought 0.4254 0.4841 0.0288 0.4048 0.4215[0.2864] [0.3192] [0.5182] [0.2588] [0.2860]
W. drought, t-1 -0.1460 -0.1655[0.3235] [0.3644]
R2 0.00 0.00 0.01 0.10 0.00N 9,000 9,000 8,625 8,875 8,875 8,500t-trend yes yes yes yes yes yesMonth FE yes yes yes yes yes yesModel SEM SEM SEM ArBo SAR SDM
Note: Precipitation is a standardized measure calculated by first finding the standardized level of precipitation in each 0.1 degree grid cell
and averaging across all grid cells in the region. Similarly, forage is a standardized measure calculated by first finding the standardized level
of precipitation in each 4km x 4km grid cell and averaging across all grid cells in the region. Drought measures the proportion of the 0.1
degree grid cells within no rainfall in the region, and is thus an index between 0-1. SEM - Spatial Error Model; ArBo - Arellano and Bond
Model (GMM); SAR - Spatial Autoregressive Model; and SDM - Spatial Durbin Model. * - All estimation, apart from the Arellano and
Bond model, use maximum likelihood.
42
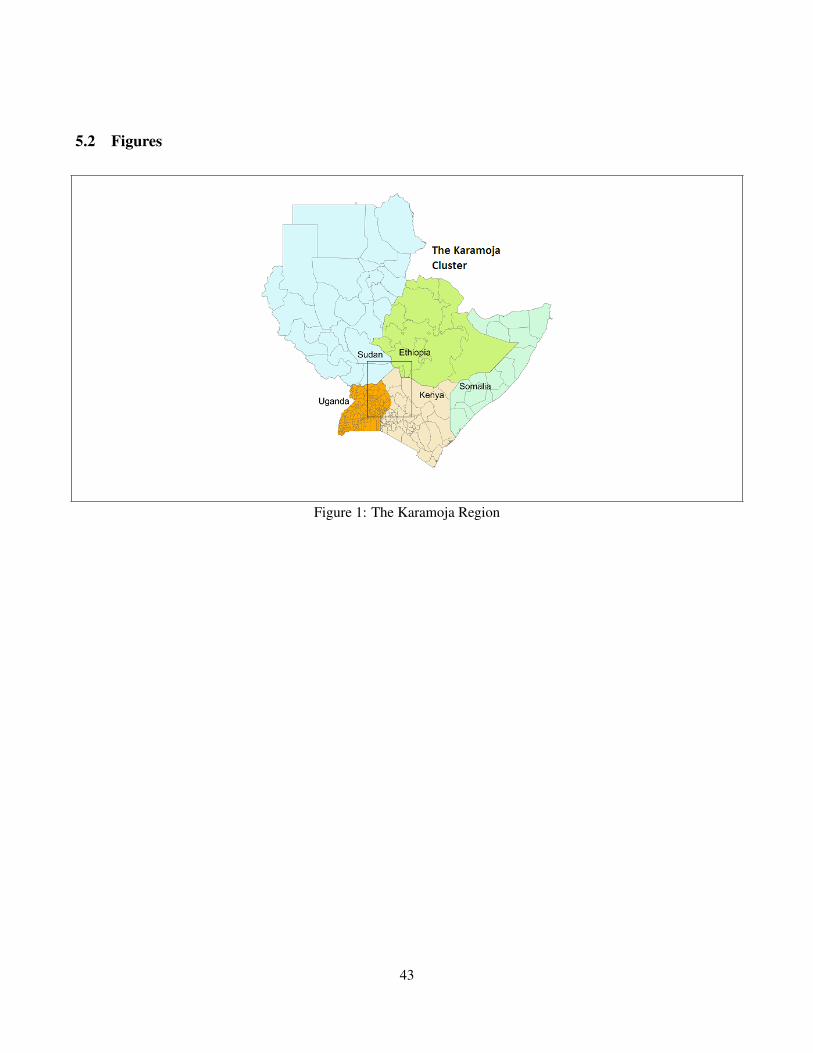
5.2 Figures
Figure 1: The Karamoja Region
43
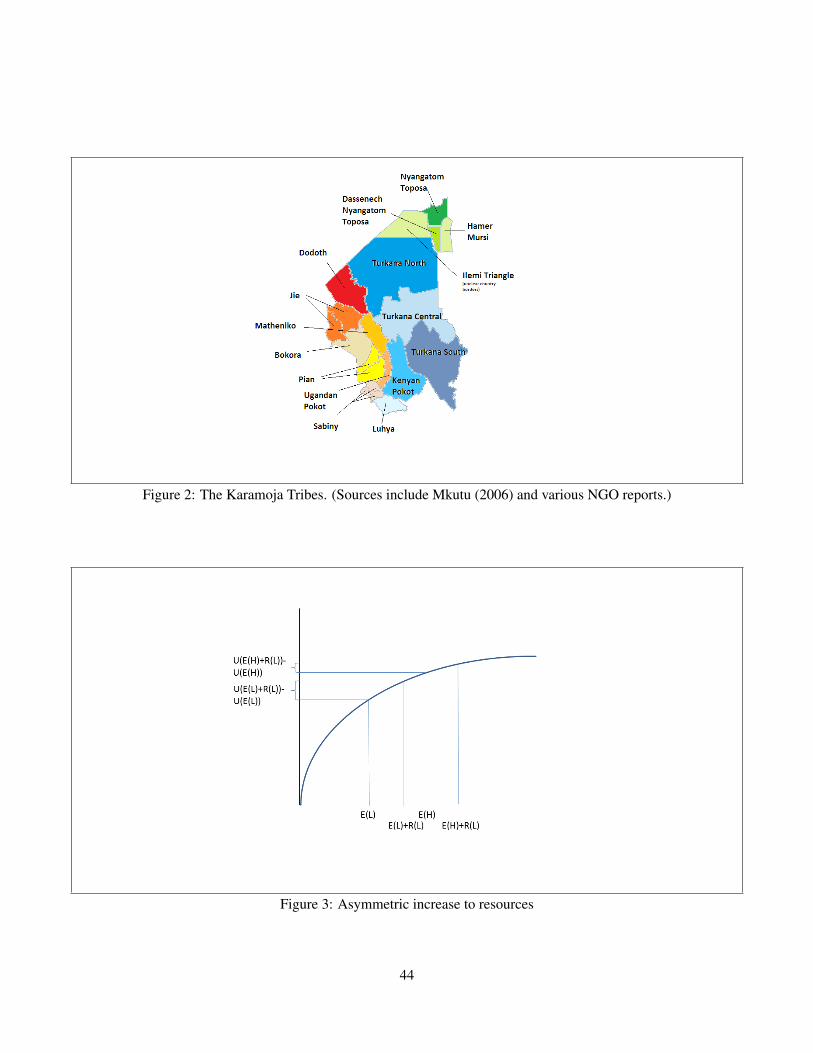
Figure 2: The Karamoja Tribes. (Sources include Mkutu (2006) and various NGO reports.)
Figure 3: Asymmetric increase to resources
44
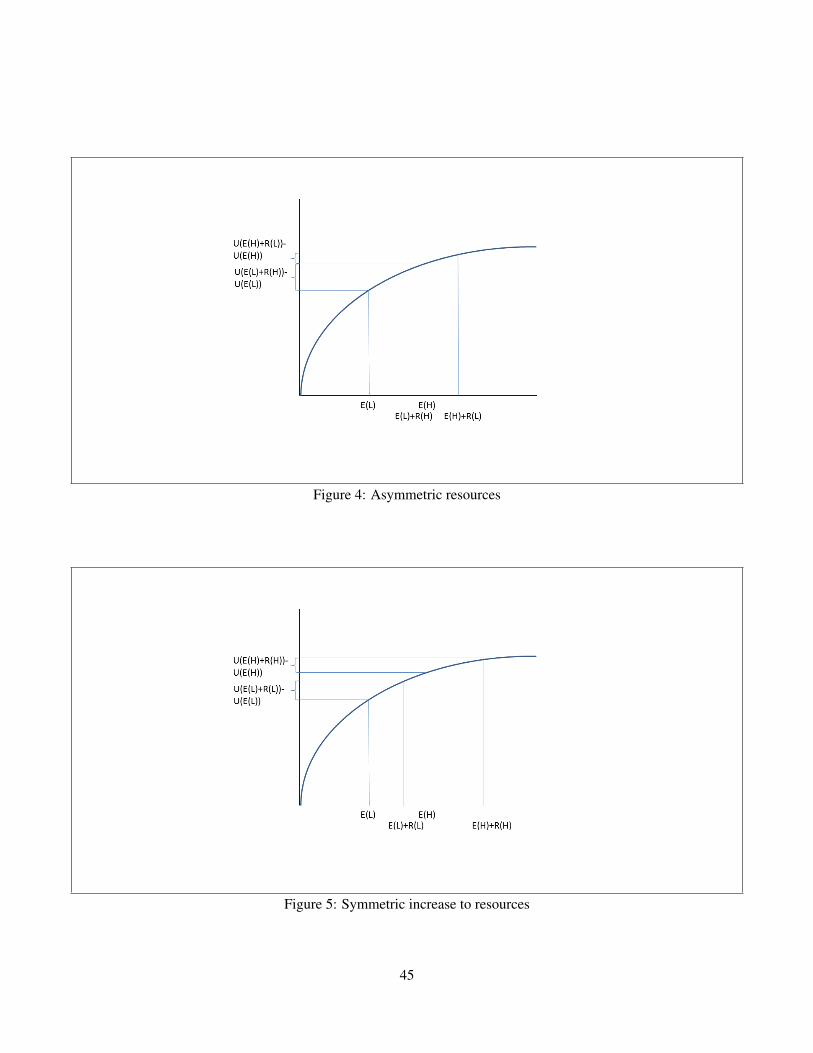
Figure 4: Asymmetric resources
Figure 5: Symmetric increase to resources
45
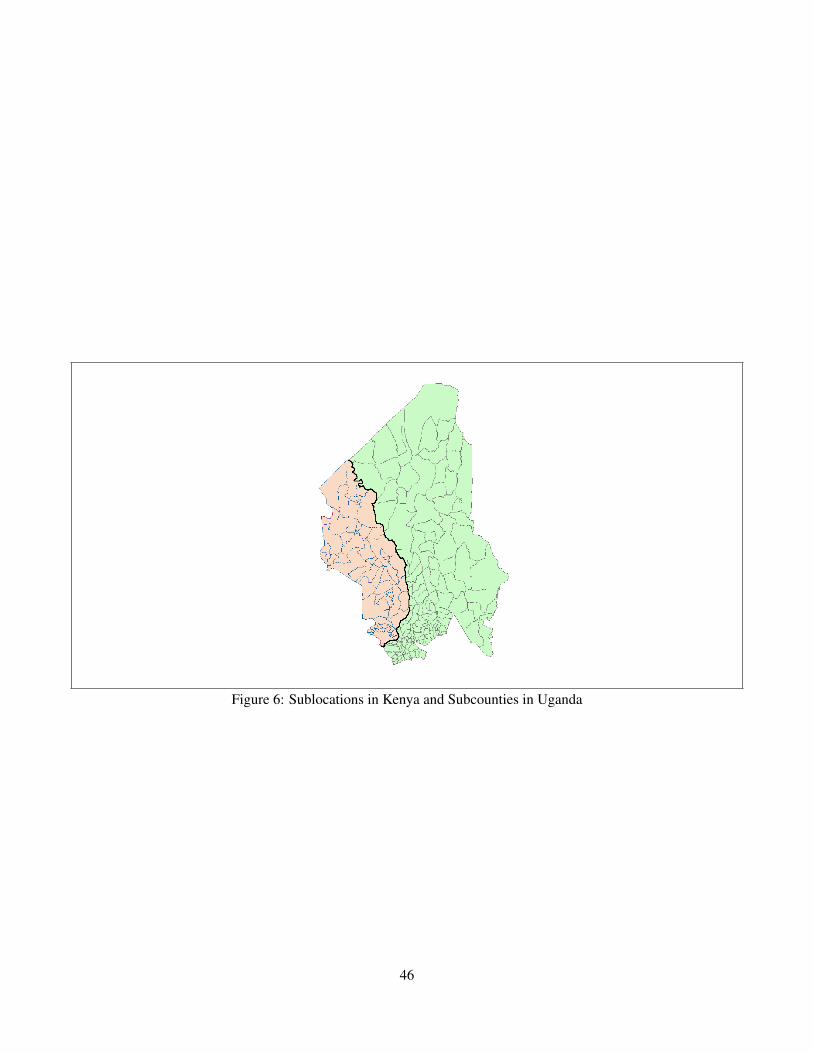
Figure 6: Sublocations in Kenya and Subcounties in Uganda
46
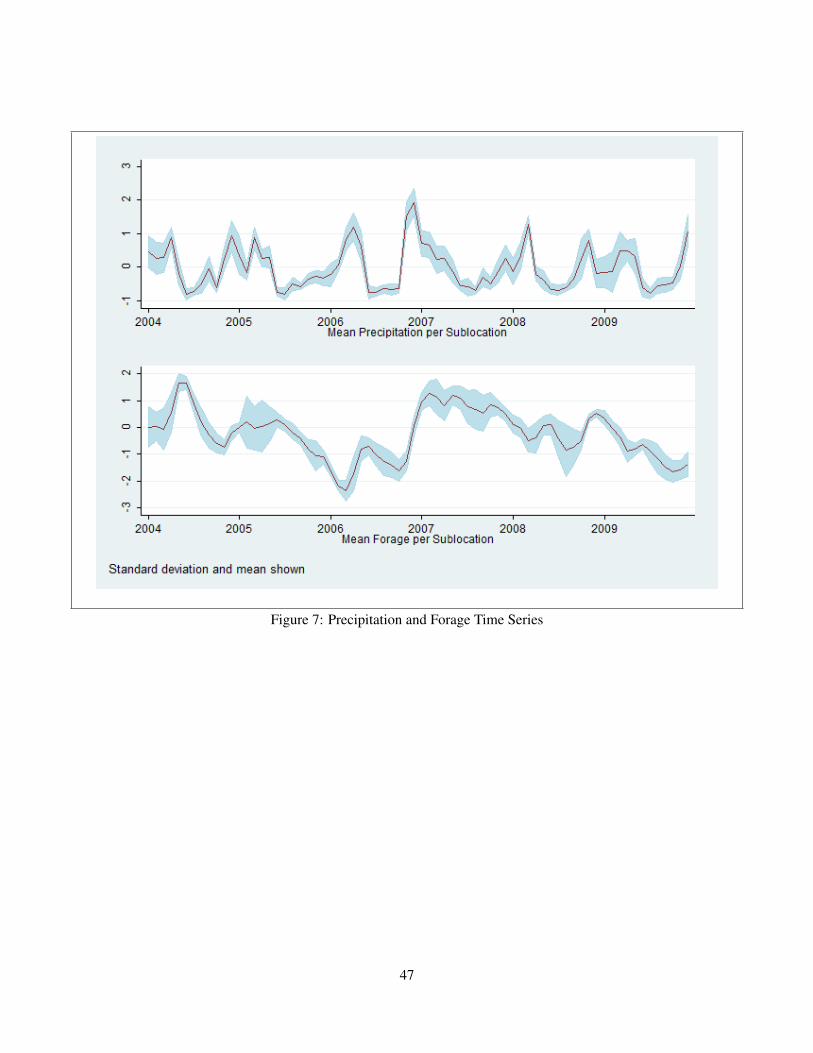
Figure 7: Precipitation and Forage Time Series
47
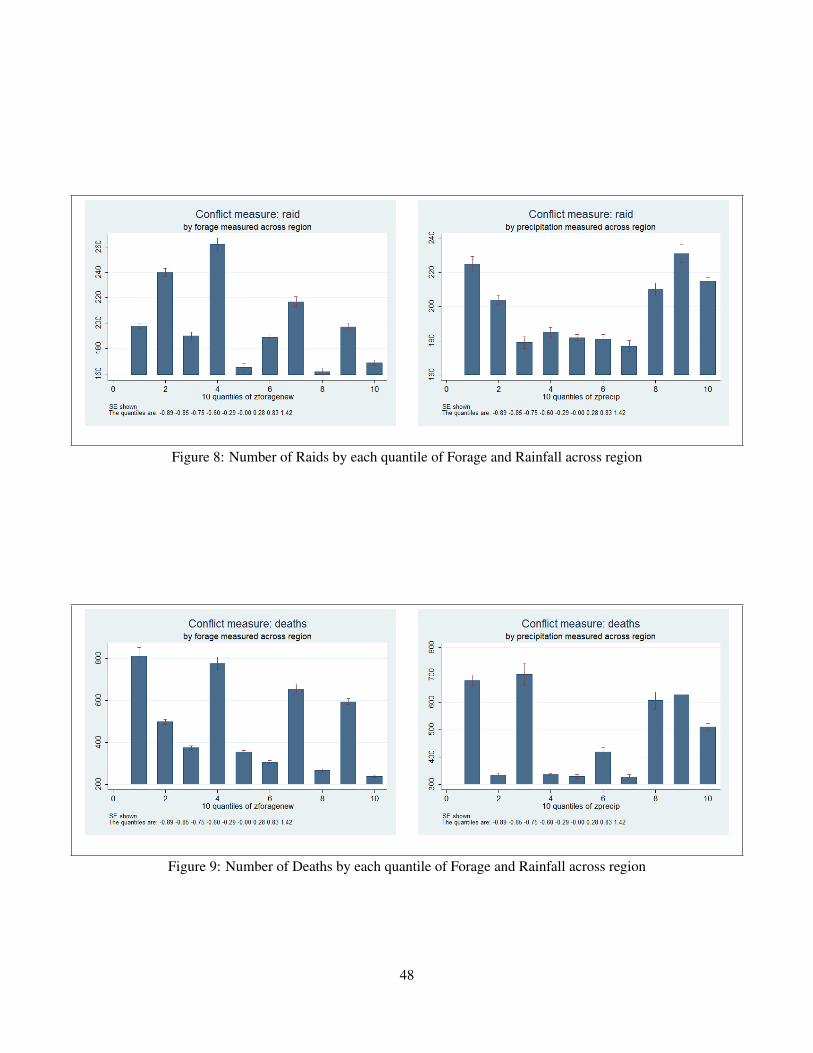
Figure 8: Number of Raids by each quantile of Forage and Rainfall across region
Figure 9: Number of Deaths by each quantile of Forage and Rainfall across region
48
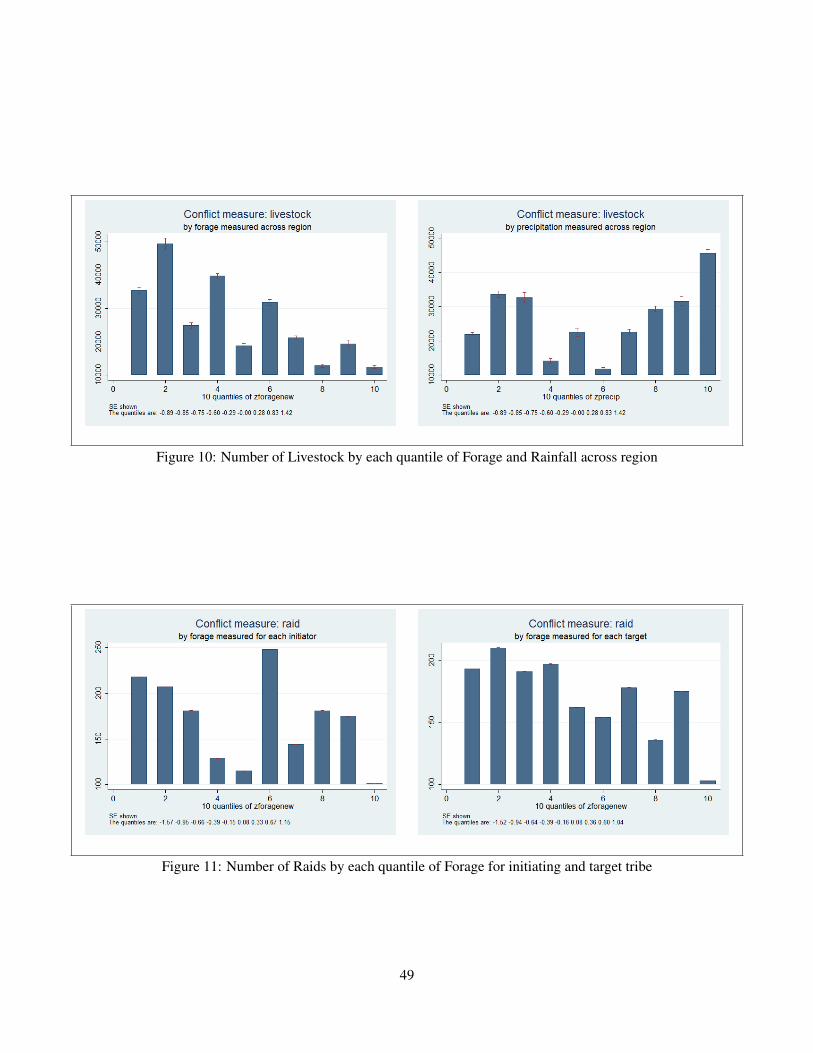
Figure 10: Number of Livestock by each quantile of Forage and Rainfall across region
Figure 11: Number of Raids by each quantile of Forage for initiating and target tribe
49
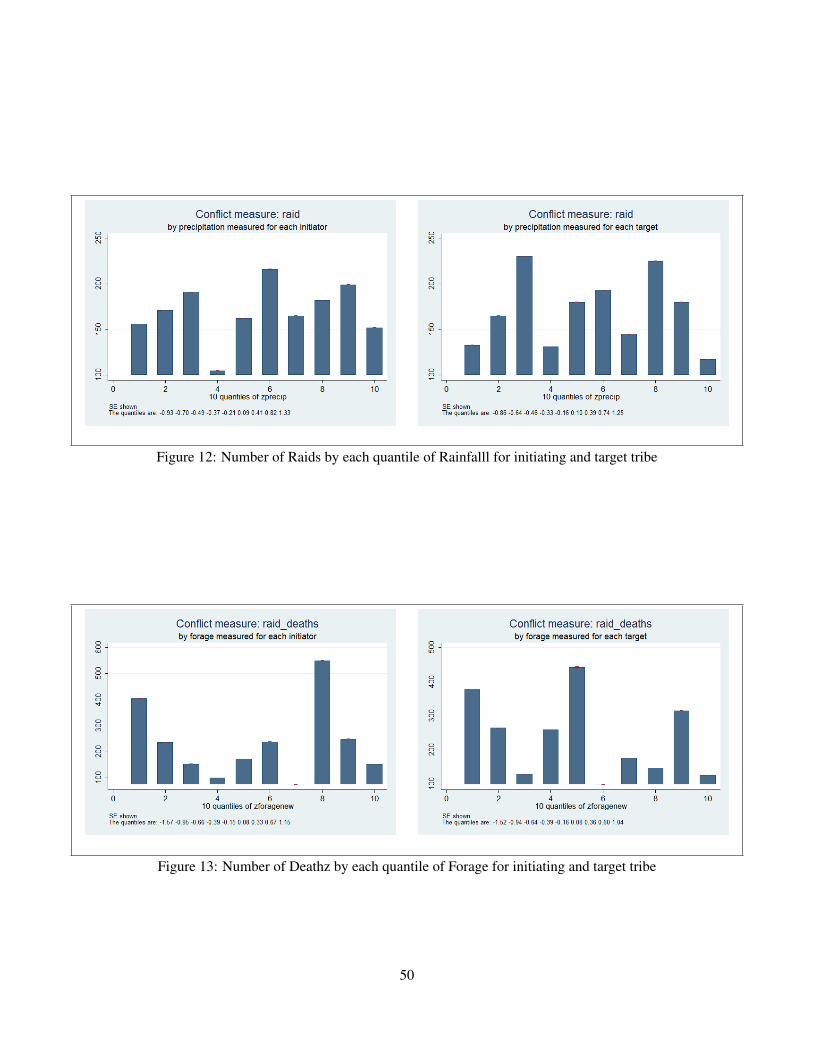
Figure 12: Number of Raids by each quantile of Rainfalll for initiating and target tribe
Figure 13: Number of Deathz by each quantile of Forage for initiating and target tribe
50
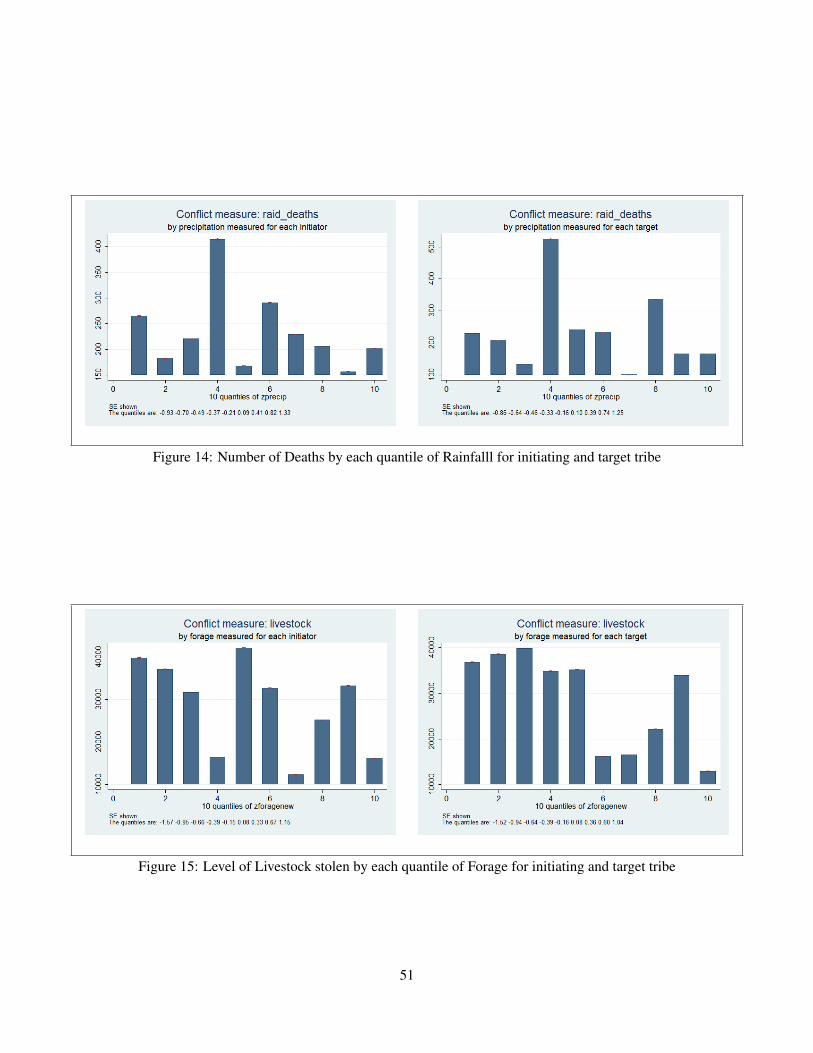
Figure 14: Number of Deaths by each quantile of Rainfalll for initiating and target tribe
Figure 15: Level of Livestock stolen by each quantile of Forage for initiating and target tribe
51
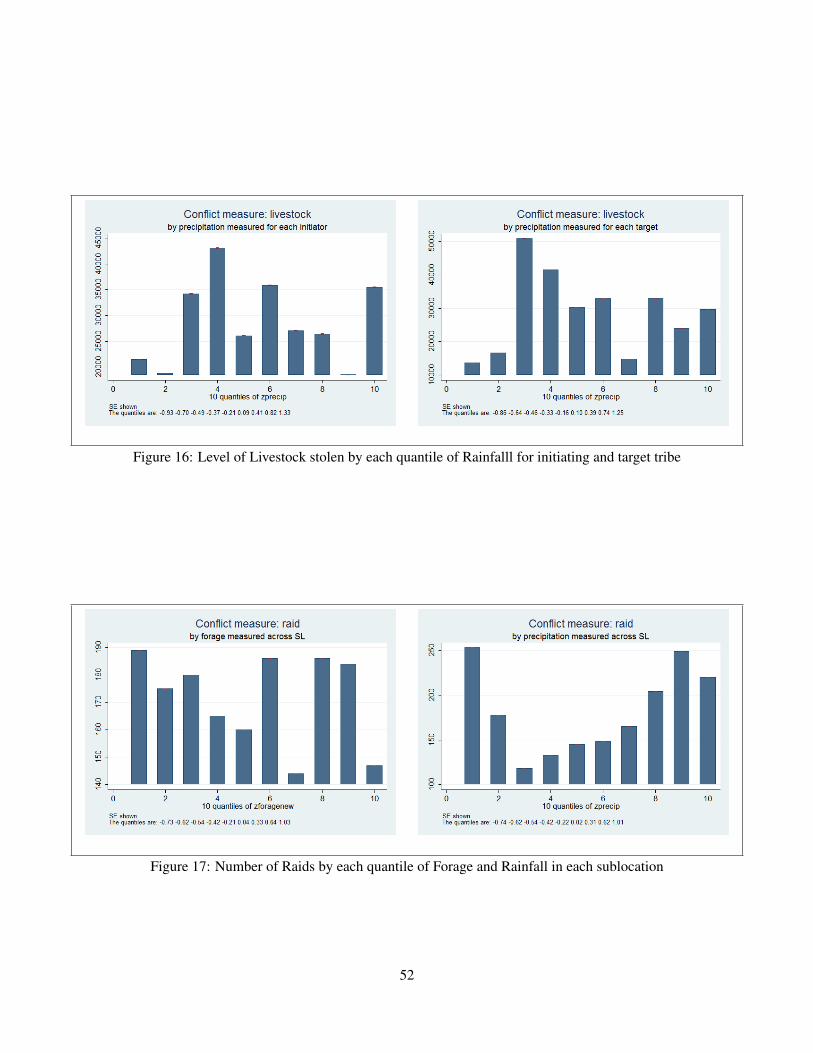
Figure 16: Level of Livestock stolen by each quantile of Rainfalll for initiating and target tribe
Figure 17: Number of Raids by each quantile of Forage and Rainfall in each sublocation
52
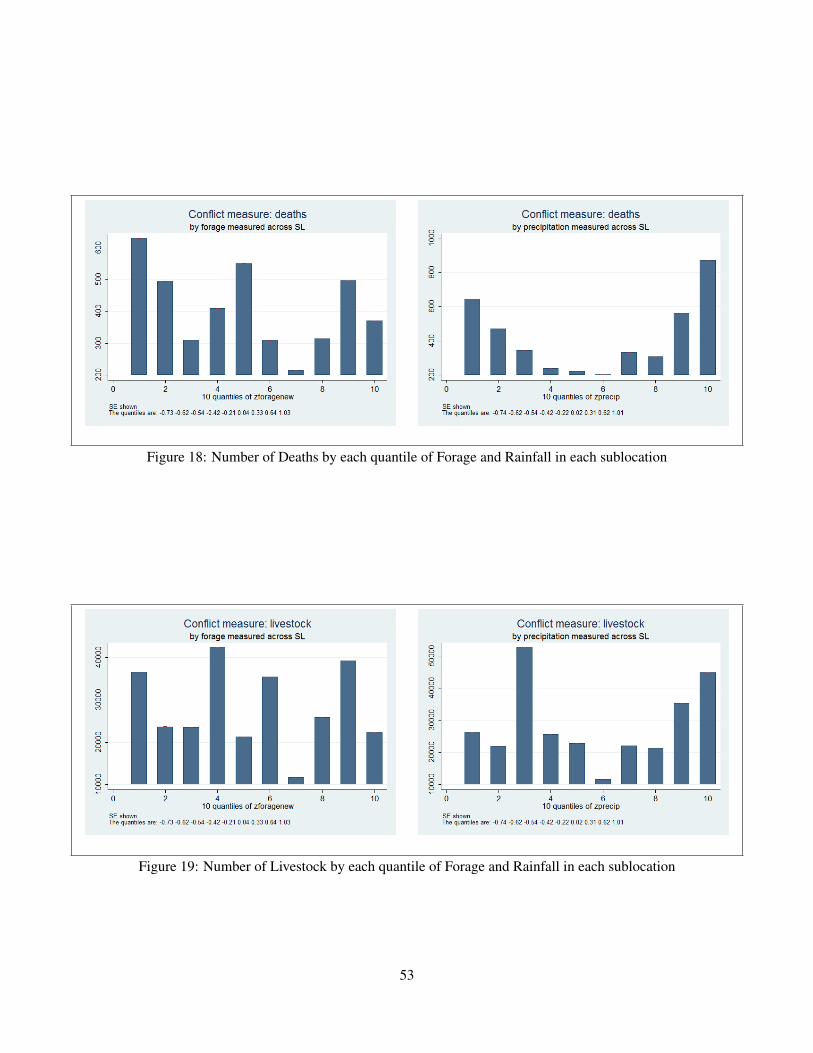
Figure 18: Number of Deaths by each quantile of Forage and Rainfall in each sublocation
Figure 19: Number of Livestock by each quantile of Forage and Rainfall in each sublocation
53
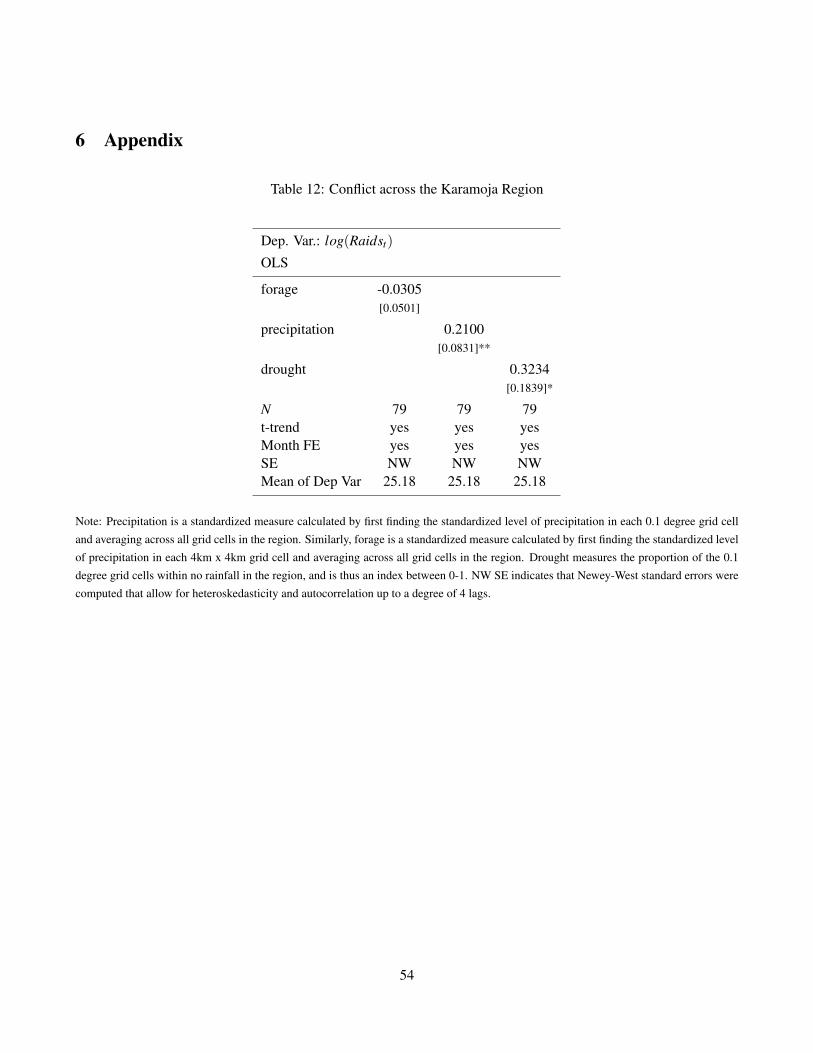
6 Appendix
Table 12: Conflict across the Karamoja Region
Dep. Var.: log(Raidst)
OLS
forage -0.0305[0.0501]
precipitation 0.2100[0.0831]**
drought 0.3234[0.1839]*
N 79 79 79t-trend yes yes yesMonth FE yes yes yesSE NW NW NWMean of Dep Var 25.18 25.18 25.18
Note: Precipitation is a standardized measure calculated by first finding the standardized level of precipitation in each 0.1 degree grid cell
and averaging across all grid cells in the region. Similarly, forage is a standardized measure calculated by first finding the standardized level
of precipitation in each 4km x 4km grid cell and averaging across all grid cells in the region. Drought measures the proportion of the 0.1
degree grid cells within no rainfall in the region, and is thus an index between 0-1. NW SE indicates that Newey-West standard errors were
computed that allow for heteroskedasticity and autocorrelation up to a degree of 4 lags.
54
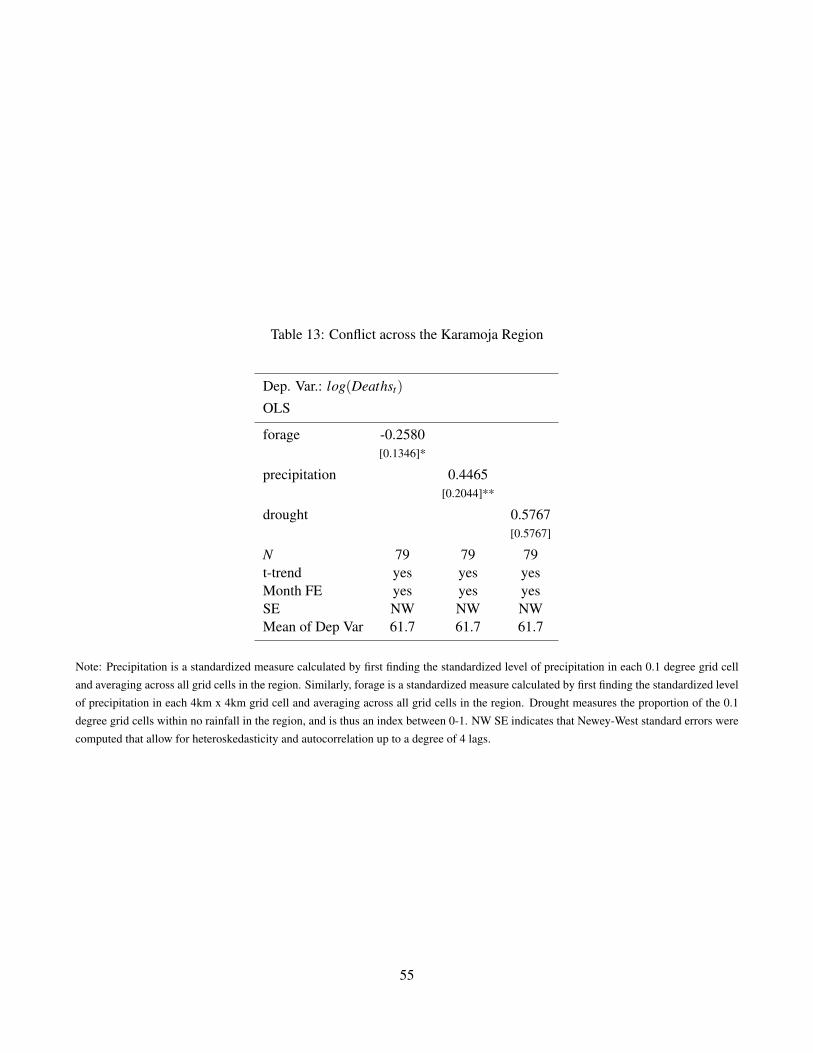
Table 13: Conflict across the Karamoja Region
Dep. Var.: log(Deathst)
OLS
forage -0.2580[0.1346]*
precipitation 0.4465[0.2044]**
drought 0.5767[0.5767]
N 79 79 79t-trend yes yes yesMonth FE yes yes yesSE NW NW NWMean of Dep Var 61.7 61.7 61.7
Note: Precipitation is a standardized measure calculated by first finding the standardized level of precipitation in each 0.1 degree grid cell
and averaging across all grid cells in the region. Similarly, forage is a standardized measure calculated by first finding the standardized level
of precipitation in each 4km x 4km grid cell and averaging across all grid cells in the region. Drought measures the proportion of the 0.1
degree grid cells within no rainfall in the region, and is thus an index between 0-1. NW SE indicates that Newey-West standard errors were
computed that allow for heteroskedasticity and autocorrelation up to a degree of 4 lags.
55
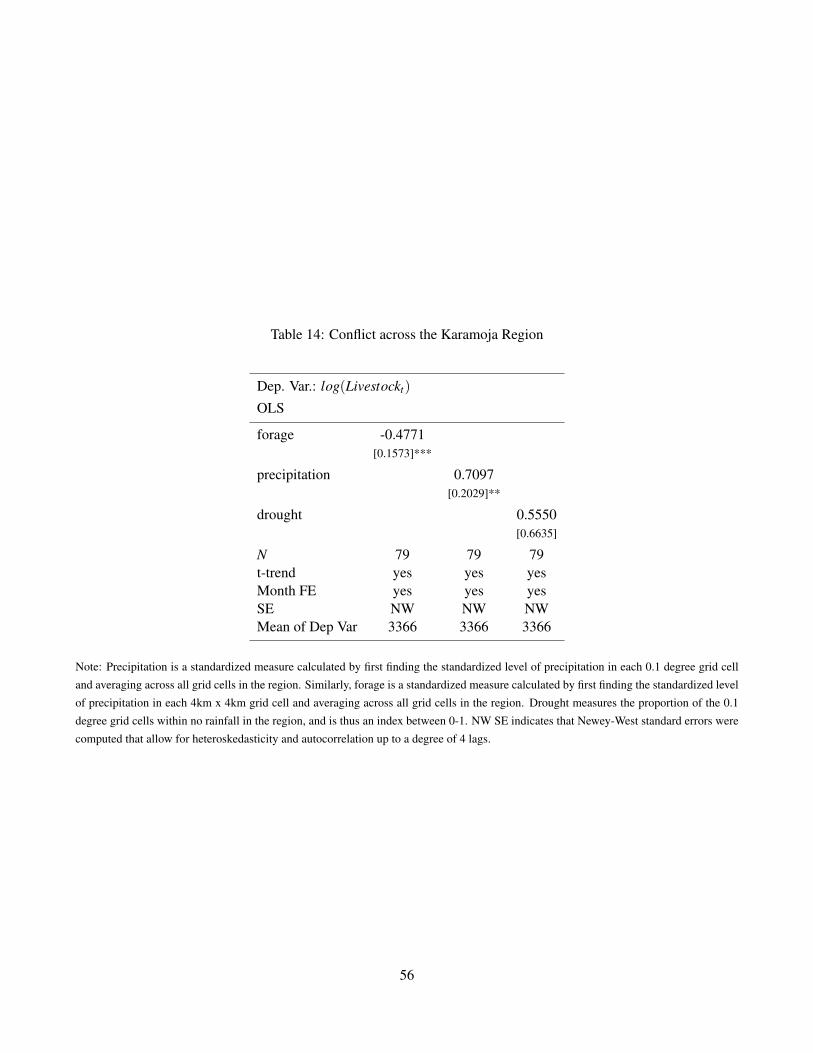
Table 14: Conflict across the Karamoja Region
Dep. Var.: log(Livestockt)
OLS
forage -0.4771[0.1573]***
precipitation 0.7097[0.2029]**
drought 0.5550[0.6635]
N 79 79 79t-trend yes yes yesMonth FE yes yes yesSE NW NW NWMean of Dep Var 3366 3366 3366
Note: Precipitation is a standardized measure calculated by first finding the standardized level of precipitation in each 0.1 degree grid cell
and averaging across all grid cells in the region. Similarly, forage is a standardized measure calculated by first finding the standardized level
of precipitation in each 4km x 4km grid cell and averaging across all grid cells in the region. Drought measures the proportion of the 0.1
degree grid cells within no rainfall in the region, and is thus an index between 0-1. NW SE indicates that Newey-West standard errors were
computed that allow for heteroskedasticity and autocorrelation up to a degree of 4 lags.
56
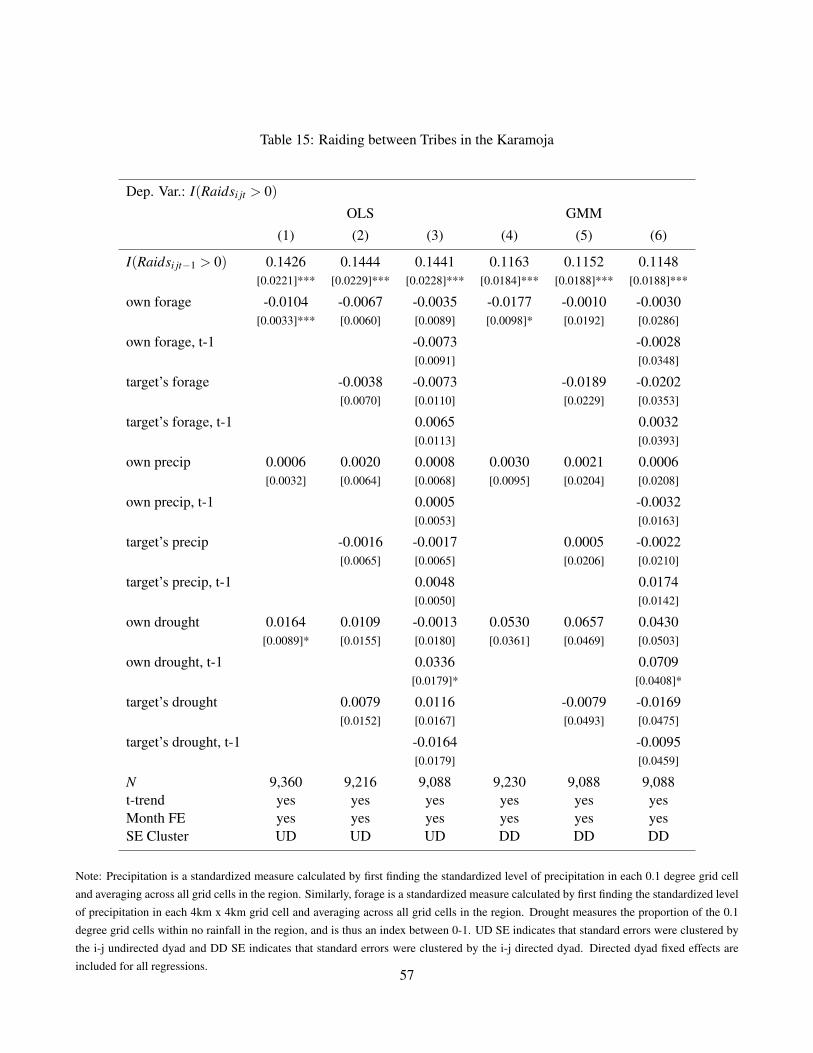
Table 15: Raiding between Tribes in the Karamoja
Dep. Var.: I(Raidsi jt > 0)
OLS GMM
(1) (2) (3) (4) (5) (6)
I(Raidsi jt−1 > 0) 0.1426 0.1444 0.1441 0.1163 0.1152 0.1148[0.0221]*** [0.0229]*** [0.0228]*** [0.0184]*** [0.0188]*** [0.0188]***
own forage -0.0104 -0.0067 -0.0035 -0.0177 -0.0010 -0.0030[0.0033]*** [0.0060] [0.0089] [0.0098]* [0.0192] [0.0286]
own forage, t-1 -0.0073 -0.0028[0.0091] [0.0348]
target’s forage -0.0038 -0.0073 -0.0189 -0.0202[0.0070] [0.0110] [0.0229] [0.0353]
target’s forage, t-1 0.0065 0.0032[0.0113] [0.0393]
own precip 0.0006 0.0020 0.0008 0.0030 0.0021 0.0006[0.0032] [0.0064] [0.0068] [0.0095] [0.0204] [0.0208]
own precip, t-1 0.0005 -0.0032[0.0053] [0.0163]
target’s precip -0.0016 -0.0017 0.0005 -0.0022[0.0065] [0.0065] [0.0206] [0.0210]
target’s precip, t-1 0.0048 0.0174[0.0050] [0.0142]
own drought 0.0164 0.0109 -0.0013 0.0530 0.0657 0.0430[0.0089]* [0.0155] [0.0180] [0.0361] [0.0469] [0.0503]
own drought, t-1 0.0336 0.0709[0.0179]* [0.0408]*
target’s drought 0.0079 0.0116 -0.0079 -0.0169[0.0152] [0.0167] [0.0493] [0.0475]
target’s drought, t-1 -0.0164 -0.0095[0.0179] [0.0459]
N 9,360 9,216 9,088 9,230 9,088 9,088t-trend yes yes yes yes yes yesMonth FE yes yes yes yes yes yesSE Cluster UD UD UD DD DD DD
Note: Precipitation is a standardized measure calculated by first finding the standardized level of precipitation in each 0.1 degree grid cell
and averaging across all grid cells in the region. Similarly, forage is a standardized measure calculated by first finding the standardized level
of precipitation in each 4km x 4km grid cell and averaging across all grid cells in the region. Drought measures the proportion of the 0.1
degree grid cells within no rainfall in the region, and is thus an index between 0-1. UD SE indicates that standard errors were clustered by
the i-j undirected dyad and DD SE indicates that standard errors were clustered by the i-j directed dyad. Directed dyad fixed effects are
included for all regressions.57
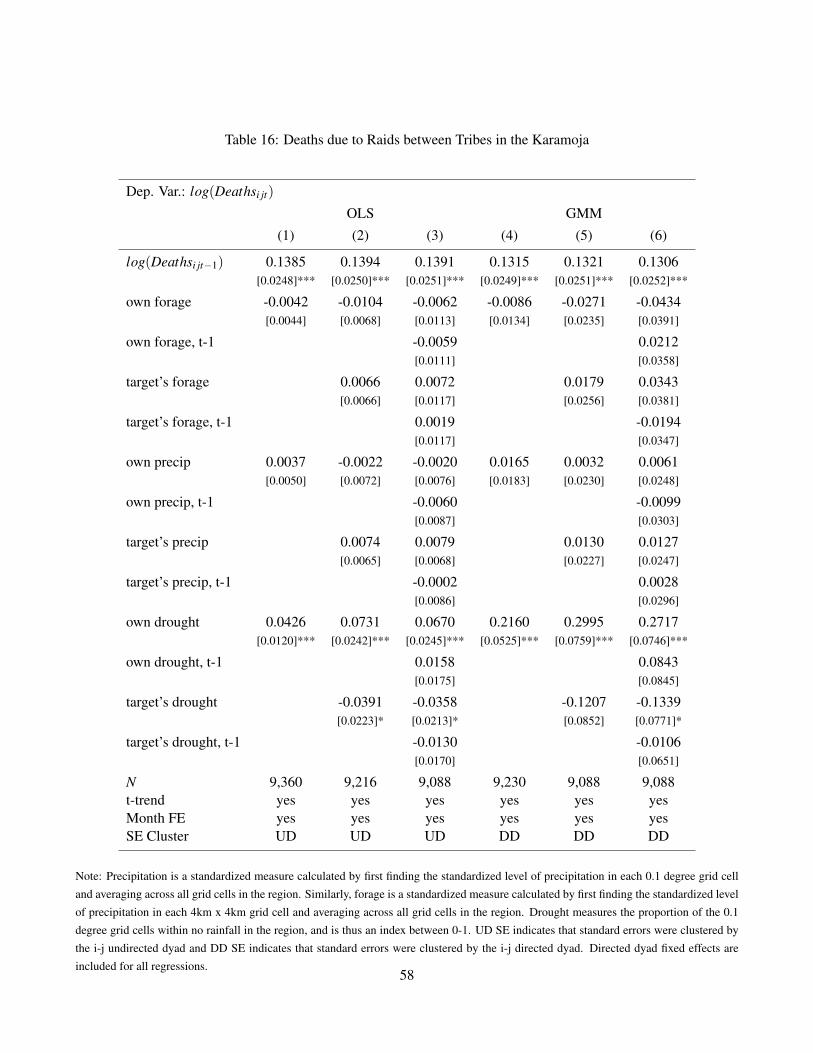
Table 16: Deaths due to Raids between Tribes in the Karamoja
Dep. Var.: log(Deathsi jt)
OLS GMM
(1) (2) (3) (4) (5) (6)
log(Deathsi jt−1) 0.1385 0.1394 0.1391 0.1315 0.1321 0.1306[0.0248]*** [0.0250]*** [0.0251]*** [0.0249]*** [0.0251]*** [0.0252]***
own forage -0.0042 -0.0104 -0.0062 -0.0086 -0.0271 -0.0434[0.0044] [0.0068] [0.0113] [0.0134] [0.0235] [0.0391]
own forage, t-1 -0.0059 0.0212[0.0111] [0.0358]
target’s forage 0.0066 0.0072 0.0179 0.0343[0.0066] [0.0117] [0.0256] [0.0381]
target’s forage, t-1 0.0019 -0.0194[0.0117] [0.0347]
own precip 0.0037 -0.0022 -0.0020 0.0165 0.0032 0.0061[0.0050] [0.0072] [0.0076] [0.0183] [0.0230] [0.0248]
own precip, t-1 -0.0060 -0.0099[0.0087] [0.0303]
target’s precip 0.0074 0.0079 0.0130 0.0127[0.0065] [0.0068] [0.0227] [0.0247]
target’s precip, t-1 -0.0002 0.0028[0.0086] [0.0296]
own drought 0.0426 0.0731 0.0670 0.2160 0.2995 0.2717[0.0120]*** [0.0242]*** [0.0245]*** [0.0525]*** [0.0759]*** [0.0746]***
own drought, t-1 0.0158 0.0843[0.0175] [0.0845]
target’s drought -0.0391 -0.0358 -0.1207 -0.1339[0.0223]* [0.0213]* [0.0852] [0.0771]*
target’s drought, t-1 -0.0130 -0.0106[0.0170] [0.0651]
N 9,360 9,216 9,088 9,230 9,088 9,088t-trend yes yes yes yes yes yesMonth FE yes yes yes yes yes yesSE Cluster UD UD UD DD DD DD
Note: Precipitation is a standardized measure calculated by first finding the standardized level of precipitation in each 0.1 degree grid cell
and averaging across all grid cells in the region. Similarly, forage is a standardized measure calculated by first finding the standardized level
of precipitation in each 4km x 4km grid cell and averaging across all grid cells in the region. Drought measures the proportion of the 0.1
degree grid cells within no rainfall in the region, and is thus an index between 0-1. UD SE indicates that standard errors were clustered by
the i-j undirected dyad and DD SE indicates that standard errors were clustered by the i-j directed dyad. Directed dyad fixed effects are
included for all regressions.58
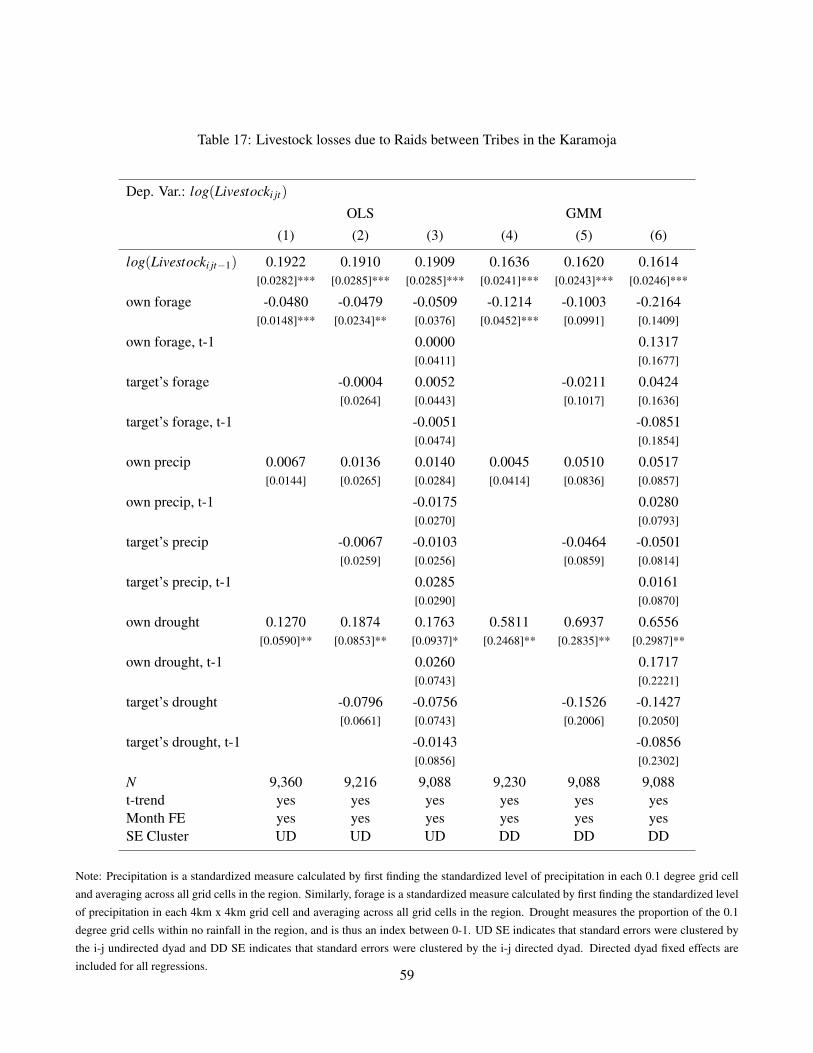
Table 17: Livestock losses due to Raids between Tribes in the Karamoja
Dep. Var.: log(Livestocki jt)
OLS GMM
(1) (2) (3) (4) (5) (6)
log(Livestocki jt−1) 0.1922 0.1910 0.1909 0.1636 0.1620 0.1614[0.0282]*** [0.0285]*** [0.0285]*** [0.0241]*** [0.0243]*** [0.0246]***
own forage -0.0480 -0.0479 -0.0509 -0.1214 -0.1003 -0.2164[0.0148]*** [0.0234]** [0.0376] [0.0452]*** [0.0991] [0.1409]
own forage, t-1 0.0000 0.1317[0.0411] [0.1677]
target’s forage -0.0004 0.0052 -0.0211 0.0424[0.0264] [0.0443] [0.1017] [0.1636]
target’s forage, t-1 -0.0051 -0.0851[0.0474] [0.1854]
own precip 0.0067 0.0136 0.0140 0.0045 0.0510 0.0517[0.0144] [0.0265] [0.0284] [0.0414] [0.0836] [0.0857]
own precip, t-1 -0.0175 0.0280[0.0270] [0.0793]
target’s precip -0.0067 -0.0103 -0.0464 -0.0501[0.0259] [0.0256] [0.0859] [0.0814]
target’s precip, t-1 0.0285 0.0161[0.0290] [0.0870]
own drought 0.1270 0.1874 0.1763 0.5811 0.6937 0.6556[0.0590]** [0.0853]** [0.0937]* [0.2468]** [0.2835]** [0.2987]**
own drought, t-1 0.0260 0.1717[0.0743] [0.2221]
target’s drought -0.0796 -0.0756 -0.1526 -0.1427[0.0661] [0.0743] [0.2006] [0.2050]
target’s drought, t-1 -0.0143 -0.0856[0.0856] [0.2302]
N 9,360 9,216 9,088 9,230 9,088 9,088t-trend yes yes yes yes yes yesMonth FE yes yes yes yes yes yesSE Cluster UD UD UD DD DD DD
Note: Precipitation is a standardized measure calculated by first finding the standardized level of precipitation in each 0.1 degree grid cell
and averaging across all grid cells in the region. Similarly, forage is a standardized measure calculated by first finding the standardized level
of precipitation in each 4km x 4km grid cell and averaging across all grid cells in the region. Drought measures the proportion of the 0.1
degree grid cells within no rainfall in the region, and is thus an index between 0-1. UD SE indicates that standard errors were clustered by
the i-j undirected dyad and DD SE indicates that standard errors were clustered by the i-j directed dyad. Directed dyad fixed effects are
included for all regressions.59