Congestion Revenue Rights Market Trials Call 26 March, 2010.

Congestion Revenue Rights (CRR)Congestion Revenue Rights (CRR)
CRR Basics Overview Training Course
April 2011April 2011
Slide 1

Introduction
CRR Team Members
Format of TrainingFormat of Training– Overview Training Class
MUI Training Class– MUI Training Class
Questions after each Section
This course is for the participants, so your feedback
is appreciated.
Slide 2

Goal of this Training CourseGoal of this Training Course
Provide an overview of the various CRR processes h i i h ld d d i d bthat participants should understand in order to be able to participate in the CRR Allocation and/or CRR A iAuction.
Slide 3

Training Course AgendaTraining Course Agenda
In this presentation we will discuss the followingIn this presentation we will discuss the following topics related to Congestion Revenue Rights:
• Section 1 ‐ General Overview of CRRs
• Section 2 – Simultaneous Feasibility Test
S ti 3 CRR All ti O i• Section 3 ‐ CRR Allocation Overview
• Section 4 ‐ CRR Auction Overview
• Section 5 CRR Holding Requirements• Section 5 ‐ CRR Holding Requirements
• Section 6 ‐ Secondary Registration
• Section 7 – Future CRR EnhancementsSection 7 Future CRR Enhancements
Slide 4

Section 1 – General Overview of CRRs TopicsSection 1 – General Overview of CRRs Topics
G l O i f CRRGeneral Overview of CRRs
• Registration
• CRR Types – Obligations and Options
• CRR Terms and TOU Definition
• CRRs are Financial Rights
• Balancing Account
N Di l A t (NDA) P f t th CRR• Non‐Disclosure Agreement (NDA) Process for access to the CRR FNM
Slide 5

Registration ProcessRegistration Process
E titi d t d t b S h d li C di t• Entities do not need to be a Scheduling Coordinator (SC) to hold CRRs
• The process is similar to the SC registration
• Process takes approximately 60 days to complete
• Contact Latisha Collins at [email protected] or
CRR Team at crrdata@caiso comCRR Team at [email protected]
Slide 6

Registration Process (cont )Registration Process (cont.)
T i t th f ll i it d dTo register, the following items are needed:
• Candidate CRR Holder Application (both SCs and Non‐SCs). pp ( )Application located within the BPM for Candidate CRR Holder Registration. https://bpm.caiso.com/bpm/bpm/list
• Completed CRR Entity Agreement Information Request Sheet
• Execute a CRR Entity Agreement (Pro Forma)
• Demonstrate ability to complete financial transactions
Slide 7

Registration Process (cont )Registration Process (cont.)
• Completed CRR Holder Affiliate form• Completed CRR Holder Affiliate form: http://www.caiso.com/2788/2788c1232740.xls
• Attended the CRR training courses (CRR Overview & Market User Interface (MUI) Hands‐On) – offered annually
• Completed CRR FNM NDA (optional): http://www.caiso.com/1bb4/1bb4745611d10.html
• Completed User Application Access Form: http://www caiso com/pubinfo/info‐http://www.caiso.com/pubinfo/infosecurity/certs/index.html
Slide 8

CRR TypesCRR Types
CRR ObligationCRR Obligation• Entitles CRR Holder to a CRR Payment if Congestion is in the same direction of the CRR and requires a charge if Congestion is in the opposite direction of the CRR
CRR Option• Entitles CRR Holder to a CRR Payment if Congestion is in the same direction as the CRR, but requires no payment if Congestion is in the opposite direction ofpayment if Congestion is in the opposite direction of the CRR
• Currently CRR Options are only available to Project Sponsors of a Merchant Transmission Facility that doSponsors of a Merchant Transmission Facility that do not elect some form of regulatory cost recovery
Slide 9

CRR TermsCRR Terms
Terms of CRRsTerms of CRRs• Seasons are defined on a quarterly basis
⁻ Season 1 = Jan, Feb and Mar⁻ Season 2 = Apr May and JuneSeason 2 = Apr, May and June⁻ Season 3 = Jul, Aug and Sep⁻ Season 4 = Oct, Nov and Dec
• Long Term CRRs extend nine years after annual term for a total of ten years (Allocation only)
M th l d th ( J F b )• Months are calendar months (e.g., January, February, …)
ExampleA PTP CRR for season 1 on peak applies to all ho rs in season 1 thatA PTP CRR for season 1, on‐peak applies to all hours in season 1 that are defined as on‐peak
Slide 10

CRR Time of UseCRR Time of Use
CRR Time of Use DefinitionCRR Time of Use Definition
• The time‐of‐use period definition is consistent with WECC and NERCWECC and NERC
₋ WECC = Western Electric Coordination Council₋ NERC = National Electric Reliability Council
• The on‐peak period
f h h f f d d− Consists of the hours from 6 am to 10 pm for Monday, Tuesday, Wednesday, Thursday, Friday and Saturday, (assuming these days are non‐holidays)
Slide 11

CRR Time of UseCRR Time of Use
CRR Time of Use Definition (cont.)CRR Time of Use Definition (cont.)
• The off‐peak period₋ Consists of the hours from 10 pm to 6 am for Monday,Consists of the hours from 10 pm to 6 am for Monday, Tuesday, Wednesday, Thursday, Friday and Saturday
₋ All 24 hours for days that are Sunday and holidays₋ Holidays are New Year’s day, Memorial Day, Independence y y, y, pday, Labor Day, Thanksgiving Day, Christmas Day
If the holiday falls on a Sunday, the first following Monday is treated as if it were a Sunday (i.e., all hours are off‐peak)
• CRR TOU posted at http://www caiso com/1bb4/1bb4745611d10 html#23http://www.caiso.com/1bb4/1bb4745611d10.html#2376139c721ff0
Slide 12

CRRs are Financial RightsCRRs are Financial Rights
A M k t P ti i t d t d CRR t Bid E• A Market Participant does not need a CRR to Bid Energy into the Day‐Ahead Market (DAM)
• If a Market Participant has a CRR and Bids in Energy the• If a Market Participant has a CRR and Bids in Energy, the Energy Bid does not need to be consistent with the CRR in terms of CRR Sink or CRR Source locations or MW
i iquantities
• On the flip‐side, a Market Participant does not need to Bid i E t h ld CRRin Energy to hold a CRR
• The CRR only settles on the Marginal Cost of Congestion (MCC) f th D Ah d L ti l M i l P i i (LMP)(MCC) of the Day‐Ahead Locational Marginal Pricing (LMP) for each respective hour
Slide 13

CRRs are Financial Rightsg
E h LMP b b k i h• Each LMP can be broken into three components– System Marginal Energy Cost (SMEC)M i l C f L (MCL)– Marginal Cost of Losses (MCL)
– Marginal Cost of Congestion (MCC)
• CRRs only cover the MCC component of the LMP in the DAM
Slide 14

CRRs are Financial Rightsg
• CRR Settlement Formula
[(LMPMCC at Sink) minus (LMPMCC at Source)] * CRR MW
• CRR Settlement Example 10MW CRR from A to B• CRR Settlement Example – 10MW CRR from A to BCRR Source at A LMPMCC A ‐ $5
$CRR Sink at B LMPMCC B ‐ $15
Congestion from A to B of $10
[(LMPMCC at Sink) minus (LMPMCC at Source)] * CRR MW
($15 ‐ $5) * 10MW = $100 Payment to CRR Holder
Slide 15

CRR Balancing AccountCRR Balancing Account
The CRR Balancing Account was created to assist inThe CRR Balancing Account was created to assist in addressing the full funding requirement of CRRs
• The CAISO tries to prevent revenue inadequacy from happening by e C SO t es to p e e t e e ue adequacy o appe g byperforming a Simultaneous Feasibility Test (SFT) within the CRR Allocation and CRR Auction processes.
• The SFT is applied to help ensure that the level of CRRs (i e the MW• The SFT is applied to help ensure that the level of CRRs (i.e., the MW quantity or quantities) that are allocated or auctioned do not create entitlements that generate more payout to CRR holders than what is brought into the CAISO by Congestion revenue.g y g
• However, based on practical matters, it is not possible to make the statement that revenue adequacy will be guaranteed 100% of the timetime
• The CRR Balancing Account is used to offset those hours where there might be a mismatch between CRR payments and Congestion revenue
Slide 16

CRR Balancing AccountCRR Balancing Account
Flow through the CRR Balancing Account
DA Congestion revenues (excluding TOR/ETC with “perfect hedge”)
CRR Auction RevenuesCongestion revenues
from Day‐ahead A/S imports
Hourly CRR Congestion revenue ≥ CRR
CRR Balancing Account(CRR BA)
settlement process entitlements
Hourly surplus into CRR BATracking of hourlyaccumulated surplus
Pay CRR holders based on DA LMP for the hour with any surplus or shortfall
Congestion revenue < CRR entitlements
Hourly shortfall into CRR BA
Tracking of hourly accumulated shortfall
any surplus or shortfall being cleared through the CRR BA
y
Slide 17
Bi‐Monthly clearing on the 15th and end of each month

CRR Balancing AccountCRR Balancing Account
Monthly Clearing of the CRR Balancing AccountMonthly Clearing of the CRR Balancing Account• Full funding is done on an hourly basis with any surplus or shortfall calculated for each hour and the clearing performed twice a monthperformed twice a month.
• On the 15th and at the end of each month all CRR Payment shortfalls and all CRR Charge shortfalls shall be fully cleared through the CRR Balancing Accountbe fully cleared through the CRR Balancing Account clearing process
• Any surplus or shortfall revenue amounts in the CRR Balancing Account will be distributed (charged or paid)Balancing Account will be distributed (charged or paid) to SCs by the following formula:
CRR Balancing Account Balance (positive or negative) *[SC’ M d D d ( t f D d d b[SC’s Measured Demand (net of Demand served by ETC/TOR) / Total Measured Demand for all SCs
Slide 18

• CRR Full Network Model Non‐Disclosure Agreement (CRR
Distribution of CRR FNM datag (
FNM NDA) Holders are provided access to data via SFTP Server
Data that is released to NDA holders are encrypted and– Data that is released to NDA holders are encrypted and uploaded onto the SFTP Server
– Each entity designates a primary recipient– Primary recipient is provided with an account to SFTP server
and responsible for downloading data and distributing to other authorized users within their corporationp
– An email is sent out to notify primary recipients that data is available for download Questions regarding data is sent to crrdata@caiso com– Questions regarding data is sent to [email protected]
• We are working with IT to deploy a new process with accessing this data. To be deployed in 2011.
Slide 19
g p y

Section 1 QUESTIONS ?Section 1 ‐ QUESTIONS ?
G l O i f CRRGeneral Overview of CRRs• Registration
CRR T Obli ti d O ti• CRR Types – Obligations and Options
• CRR Terms and TOU Definition
• CRRs are Financial Rights• CRRs are Financial Rights
• Balancing Account
• Non‐Disclosure Agreement (NDA) Process for access to the CRRNon Disclosure Agreement (NDA) Process for access to the CRR FNM
Slide 20

S ti 2 Si lt F ibilit T tSection 2 – Simultaneous Feasibility Test
Simultaneous Feasibility Test• Full Network Model (FNM)( )
• Operating Constraints and Contingencies
• APNodes
• Distribution/Allocation Factors
• Shift Factors and Effectiveness
• Outages
Slide 21

Si lt F ibilit T tSimultaneous Feasibility Test
• The idea behind the SFT is to apply this test toThe idea behind the SFT is to apply this test to CRR nominations (as part of the CRR Allocation process) and to CRR bids (as part of the CRR p ) ( pAuction process)
• There is a strong connection between the SFT and• There is a strong connection between the SFT and the IFM Congestion Management process (which clears Congestion and calculates the LMPs)clears Congestion and calculates the LMPs)
– The SFT process is conducted in very much the same way as the IFM in using such items as the Full Network Model (FNM) and Constraints limitsConstraints limits
Slide 22

Si lt F ibilit T tSimultaneous Feasibility Test
The idea behind the SFT is to take the CRR Source(s)The idea behind the SFT is to take the CRR Source(s) location, the CRR Sink(s) location and MW quantity(s) of the CRR nomination or CRR bid and apply these to the FNM as if they were Generator(s) and Load(s)the FNM as if they were Generator(s) and Load(s)
• The FNM used here is similar to the FNM used in the IFM
• Th CRR FNM d t h i t th th• The CRR FNM does not have any resistance, thus there are no transmission losses and the total amount injected into the system is equal to the total amount withdrawn from the system
• The SFT process is conducted in very much the same way as the IFM• The SFT process is conducted in very much the same way as the IFM in using such items as the Full Network Model (FNM) and Constraint limits
• When infeasibility does occur a process is applied that reduces the• When infeasibility does occur, a process is applied that reduces the CRR nomination or CRR bid MW quantities until feasibility is achieved
Slide 23

Simultaneous Feasibility Testy
Theoretically, revenue adequacy is ensured assumingTheoretically, revenue adequacy is ensured assuming the following two conditions have been met when applying the SFT for establishing feasibility of the CRRs
• Condition 1: The FNM that is used in the IFM to produce the LMPs is the same as the FNM used in the CRR SFT (this is the general statement))
• Condition 2: The Constraint limits that are used in the IFM are the same that are used in the CRR SFT
More precisely the Constraint limits used in the SFT must be− More precisely, the Constraint limits used in the SFT must be equal to or less than those used in the IFM
• Conditions #1 and #2 are not necessary conditions for assuring revenue adequacy, meaning that even if the FNM and constraint limits are not exactly the same it is still possible to maintain revenue adequacy
Slide 24

Simultaneous Feasibility Test – Full Network Model
Full Network Model (FNM)Full Network Model (FNM)• For CRR purposes, certain simplifying assumptions are made about the
FNM to make it a linear modelFNM to make it a linear model− This linear model is called a DC model− All resistances are set to zero (no transmission losses)
All voltage magnitudes are set to 1 0 per unit− All voltage magnitudes are set to 1.0 per‐unitReactive power is ignored
− The flow across a transmission branch is assumed to be a linear function of the bus angles which are at either end of the linefunction of the bus angles, which are at either end of the line
This results in a linear model, i.e., the injection of power at a bus to the change in flow over a given branch is a linear relationship (i.e., the shift factor) and this relationship is only dependent upon(i.e., the shift factor) and this relationship is only dependent upon the reactance of the transmission branches
− Only active power (MW) flowing over transmission branches can be calculated in the DC FNM
Slide 25

Simultaneous Feasibility Test Full Network ModelSimultaneous Feasibility Test – Full Network Model
F ll N t k M d l ( t )Full Network Model (cont.)• The FNM for the annual process will include seventy five (75) percent
of the Seasonal Available CRR Capacity that is in service for the start ofof the Seasonal Available CRR Capacity that is in service for the start of the annual CRR allocation and auction processes
• For the monthly processes, the FNM will include one hundred (100) t f th M thl A il bl CRR C it i t d ithpercent of the Monthly Available CRR Capacity associated with
transmission facilities that are in‐service when the monthly allocation and auction process begins.
We will not model “expected” upgrades− We will not model expected upgrades.
• The FNM for the Long Term process will include sixty (60) percent of the Seasonal Available CRR Capacity that was used in the annual process
Slide 26

Simultaneous Feasibility Test ‐ Constraints
Constraint limits used in the Day Ahead operation ofConstraint limits used in the Day‐Ahead operation of the power system include limits placed on observable (measurable) variables in the power psystem such as:
• Flows on individual or groups of branchesAlso under contingency analysis− Also under contingency analysis
• Generation levels in certain areas of the system• Voltage levelsg• Relationships between Generation levels, Load levels, voltage levels and branch (or branch group) flows− NomogramsNomograms
Slide 27

Simultaneous Feasibility Test ConstraintsSimultaneous Feasibility Test ‐ Constraints
O ti C t i tOperating Constraints
• Constraints enforced should be consistent with those d i I t t d F d M k t (IFM)used in Integrated Forward Market (IFM)
− Coordinate with IFM team on Interface, branch group and nomogram constraints, thermal constraints and contingency constraintsconstraints
• Constraint limit values will be based on operating procedures utilized by the IFMprocedures utilized by the IFM
• Adjustments will be made to constraint limits to take into consideration the absence of reactive power andinto consideration the absence of reactive power and losses− Monitored facilities limits include reactive power and lossesInterface limits include losses
Slide 28
− Interface limits include losses

Si lt F ibilit T t APN dSimultaneous Feasibility Test ‐ APNodes
Aggregated Pricing Nodes (APNodes)Aggregated Pricing Nodes (APNodes)• Most sinks used in defining CRRs are APNodes• APNodes are also used in the IFM for bidding purposesodes a e a so used t e o b dd g pu poses
Allowable Sources and Sinks• The list of allowable APNodes (Sources and Sinks) will beThe list of allowable APNodes (Sources and Sinks) will be made available on the CAISO website and the CRR System prior to running any allocation or auction markets http://www.caiso.com/1bb4/1bb4745611d10.html#23ac72491a9b0
Slide 29

Simultaneous Feasibility Test ‐ APNodes
• Aggregated Pricing Nodes (APNode)• Aggregated Pricing Nodes (APNode)– A group of PNodes that may represent such items as a Load Aggregation Point or a Trading Hubgg g g
– The term PNode is a location in the FNM, typically a bus
• The main purpose of an APNode is that it represents physical scheduling resources in the
h h hIFM that connect to the FNM at more than one location
Th h th IFM LMP i d t i d f h f th– Through the IFM an LMP is determined for each of the different APNodes that are Bid in into the IFM
Slide 30

Simultaneous Feasibility Test APNodesSimultaneous Feasibility Test ‐ APNodes
• APNodes can also be defined for non Bid• APNodes can also be defined for non‐Bid purposes– A Trading Hub is not Bid in into IFM but an LMP isA Trading Hub is not Bid in into IFM, but an LMP is determined
• The CRR Sources and CRR Sinks are modeled as• The CRR Sources and CRR Sinks are modeled as either PNodes or APNodes in the CRR SFT process
Slide 31

Simultaneous Feasibility Test APNodesSimultaneous Feasibility Test ‐ APNodes
Two Attributes of Aggregated Pricing NodeTwo Attributes of Aggregated Pricing Node • A set of two or more PNodes
− Each PNode provides a mapping back to the underlying FNM− An LMP is calculated by the IFM for each PNode in this set
• A set of allocation factors, one allocation factor for each PNodePNode− These are also called Load (Generator) Distribution Factors for Load (Generator) Aggregation Points
− For the CRR SFT, they are generally called allocation factors − The properties of the allocation factors are:
Each allocation factors is greater than or equal to 0.0Each allocation factors is less than or equal to 1.0The allocation factors for a particular APNode sum to 1.0
Slide 32

Simultaneous Feasibility Test ‐ APNodes
Mappings from the
y
Mappings from the CRR Sink MW quantity to the MW values placed on the
APnode10%
allocation factors
underlying PNodes by allocation factors. These MW values are withdrawals for the
20%5%
40%15%
10%
withdrawals for the CRR Sink
Note that the allocation factors sum to
Slide 33
100%

Simultaneous Feasibility Test APNodesSimultaneous Feasibility Test ‐ APNodes
Use this APNode as a CRR Sink with a MW quantity of 100 MWUse this APNode as a CRR Sink with a MW quantity of 100 MW100 MW
These arrows represent the
APNode maps to underlying PNodes
withdrawals from the FNM
100 × 20% = 20 MW 100 × 40 % = 40 MW 100 × 10 % = 10 MW
100 × 10% = 10 MW 100 × 5% = 5 MW
100 15% 15 MW100 × 15% = 15 MW
Slide 34

Simultaneous Feasibility Test – Distribution FactorsSimultaneous Feasibility Test – Distribution Factors
Distribution FactorsDistribution Factors• Distribution Factors for Load Aggregation Points will be based on load patterns from seasonal base cases – appliesbased on load patterns from seasonal base cases – applies to− Default Load (DLAP) Aggregation Points( ) gg g
− Sub Load (SLAP) Aggregation Points
− Metered Subsystem Load (MLAP) Aggregation Points
− Custom Load (CLAP) Aggregation Points
• Trading HubsDi ib i f b d h i h d i− Distribution factors are based on the weighted average generation output of all Generating Units within a Trading Hub
Slide 35

Simultaneous Feasibility Test – Trading HubSimultaneous Feasibility Test – Trading Hub
Trading Hub• For the CRR Allocation, CRR nominations with Trading Hubs as
sources will be disaggregated into Point‐to‐Point CRRs each of whose CRR Source is a Generating Unit PNode that is an gelement of the Trading Hub− Each nomination will equal the MW quantity of the CRR nomination multiplied by the weighting factor of the p y g gcorresponding Generating PNode.
• The Trading Hub allocation factors will be updated once a year to coincide with the CRR annual processesp
• Due to disaggregation of the Trading Hub and the .001MW limit for CRRs, it is possible that the total disaggregated MW amount could be less than the nominated amount after the SFT is run. In addition, awards less than .001MW will be truncated to zero.
Slide 36
Simultaneous Feasibility Test – Trading HubSimultaneous Feasibility Test – Trading Hub
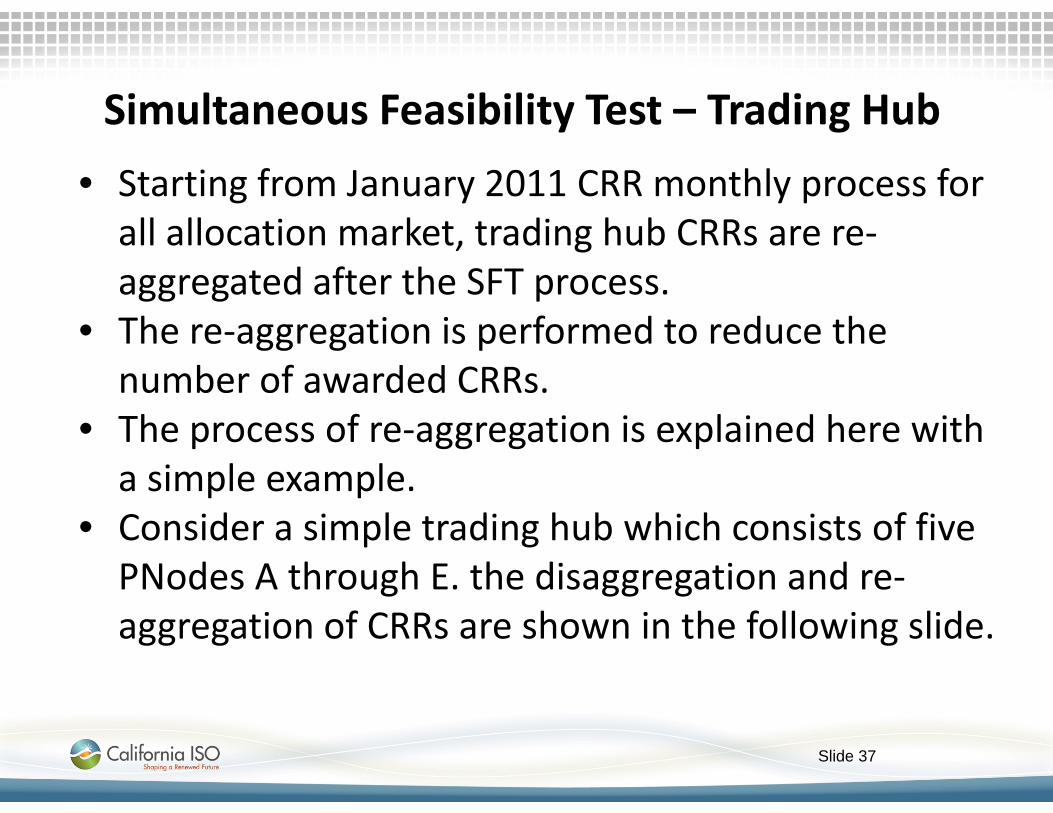
• Starting from January 2011 CRR monthly process for all allocation market, trading hub CRRs are re‐aggregated after the SFT process.
• The re‐aggregation is performed to reduce the number of awarded CRRs.
• The process of re‐aggregation is explained here with a simple example.
• Consider a simple trading hub which consists of five PNodes A through E. the disaggregation and re‐aggregation of CRRs are shown in the following slide.
Slide 37

Simultaneous Feasibility Test – Trading HubSimultaneous Feasibility Test – Trading Hub
Total CRR nominated at trading hub is 50 MW.Max Percent 100%
Nodes AF Nominated Allocated Counter FlowA 0.2 10 10 100% 0B 0.2 10 10 100% 0C 0 2 10 0 0% 10C 0.2 10 0 0% 10D 0.2 10 10 100% 0E 0.2 10 10 100% 0E 0.2 10 10 100% 0
40 1Trading Hub MW 50 1
CRR Count 2
Slide 38

Simultaneous Feasibility Test – Shift Factors
• Shift Factors are also known by other namesShift Factors are also known by other names– Power transfer distribution factors (PTDFs)– Power distribution coefficients (PDCs)– Effectiveness factors– Impedance factors
• This shift factor definition is:• This shift factor definition is: – SFji = shift factor for bus i (with respect to the reference location) on constraint j (i.e., the incremental amount of power flow on constraint j when an additional unit ofpower flow on constraint j when an additional unit of power is injected at bus i and withdrawn from the reference location)
– Shift factors are dependent upon the FNM from which they are derivedare derived
• Later in this section there is an example that will illustrate the application of shift factors in the SFT
Slide 39

Si lt F ibilit T tSimultaneous Feasibility Test
• The CRR Allocation and CRR Auction process willThe CRR Allocation and CRR Auction process will provide CRRs for terms of one season/TOU and one month/TOU, so choosing the proper set of underlying data for the SFT can be difficultdata for the SFT can be difficult.
• When setting up the process for the CRR Allocation or CRR Auction the following data must be used within the SFT processthe SFT process.− FNM (from which the shift factors are derived)− APNodes and their allocation factor sets− Constraint limits
• Given a CRR Allocation or CRR Auction process that will create a bundle of CRRs for a particular term/TOUwill create a bundle of CRRs for a particular term/TOU− Every CRR created will be tested by an SFT that has the one FNM, one set of allocation factors for each APNode and one set of Constraint limits.
Slide 40

Simultaneous Feasibility TestSimultaneous Feasibility Test
IFM timeframeIFM timeframe• The IFM process also uses
− FNM− APNodes and their allocation factor sets− Constraint limits
• The IFM process performs in the Day‐Ahead timeframeThe IFM process performs in the Day Ahead timeframe• However, performed on a daily basis with the possibility
of changing any one of the elements within the FNM, the allocation factor set and the Constraint limits on anallocation factor set and the Constraint limits on an hourly basis
Slide 41

Simultaneous Feasibility TestSimultaneous Feasibility Test
Th SFT d th d ti h iThe SFT and the reduction mechanisms are combined into an optimization formulation
b h h l h• Remember that the SFT process is to apply the CRR Source(s) and CRR Sink(s) (from either CRR nominations or CRR bids) to the FNM to determine the result flows and then those flows are compared to Constraint limits
• Optimization formulation is comprised of two elements− Objective function, which is either maximized or minimized
− Constraints which cannot be violated for theConstraints, which cannot be violated for the optimization process to solve
Slide 42

Si lt F ibilit T tSimultaneous Feasibility Test
• This optimization formulation is used in both the CRR• This optimization formulation is used in both the CRR Allocation and CRR Auction process– The objective function is slightly different in each– The Constraints are the same
• The objective functions in the CRR Allocation and CRR A tiCRR Auction process– CRR Allocation: until the 2010 December monthly allocation
process the objective function used in the allocation process was to maximize the allocation of CRR MWs.
Starting from January 2011 monthly CRR process the objective function has been modified to utilize the weighted j gleast squares (WLS)
– CRR Auction: the objective function used in the CRR Auction process is to maximize the bid based value of the awarded CRRs
Slide 43
p

Simultaneous Feasibility TestSimultaneous Feasibility Test
• Consider the objective function to maximize theConsider the objective function to maximize the CRR allocation MW.
• Assume there are two CRR nominations, CRR1 and CRR2 and one enforced Constraint on the branch that connects buses A and B from the FNMFNM
• Objective Function– Maximize (CRR1 MW quantity + CRR2 MW– Maximize (CRR1 MW quantity + CRR2 MW quantity)
– This objective function is maximizing the MW j gquantities allocated
Slide 44

Simultaneous Feasibility Test
Example DC FNMCRR1 Source
Bus 1
Bus 2Bus
Bus A Bus B
Transmission line CRR1 Sink
Bus 3
Bus 4Branch ABCRR2
Source CRR2 Sink
Slide 45

Simultaneous Feasibility TestSimultaneous Feasibility Test
Example DC FNM showing only the relevant buses andExample DC FNM showing only the relevant buses and branches
B 1 Bus 2Shift Factor on AB = 10%
CRR1: 100 MW PTP CRR nomination from Bus 1 to Bus 2
100 MW 100 MWBus 1 Bus 2
Branch AB OTC = 35 MW
Shift Factor on AB 10%100 MW 100 MW
Bus A Bus B
CRR2: 200 MW PTPCRR nomination from Bus 3 to Bus 4
Bus 3 Bus 4Shift Factor on AB = 15%200 MW 200 MW
OTC O ti T f C bilit
Slide 46
OTC = Operating Transfer Capability

Simultaneous Feasibility TestSimultaneous Feasibility Test
• CRR1: 100 MW PTP CRR nomination from Bus 1 to• CRR1: 100 MW PTP CRR nomination from Bus 1 to Bus 2
• CRR2: 200 MW PTP CRR nomination from Bus 3 to Bus 4
• Flow on Branch AB (from Bus A to Bus B)MW tit Shift f t– MW quantity × Shift factor
• CRR1: 100 × 10% = 10 MW• CRR2: 200 × 15% = 30 MW
T l fl h B h AB (f B A B B)• Total flow on the Branch AB (from Bus A to Bus B)– 10 MW + 30 MW = 40 MW > 35 MW OTC– Feasibility is violated, the SFT failsFeasibility is violated, the SFT fails
• Need to reduce the flow on the Constraint by 5 MW to relieve overload
Slide 47

Simultaneous Feasibility TestSimultaneous Feasibility Test
• Let’s explore the different alternatives for relieving the overload and see the impact of each alternative on the objective function
Th th lt ti• There are three alternatives– Use only CRR1 to relieve the Constraint overload
l l h l d– Use only CRR2 to relieve the Constraint overload
– Use a combination of CRR1 and CRR2 to relieve the C t i t l dConstraint overload
Slide 48

Si lt F ibilit T tSimultaneous Feasibility Test
What if the MW quantity from CRR1 is reducedWhat if the MW quantity from CRR1 is reduced• The impact that CRR1 has (i.e., a change in the MW quantity of CRR1) on the flow on the Constraintq y )− If the MW quantity from CRR1 is increased by 1 MW what is the increase to the flow on Branch AB
1 MW × 10 % = 0.1 MWIf h MW i f CRR1 i d d b 1 MW h i− If the MW quantity from CRR1 is decreased by 1 MW what is the decrease to the flow on Branch AB
(‐1 MW) × 10 % = ‐ 0.1 MW• To get 5 MW off of Branch AB we will need to reduce• To get 5 MW off of Branch AB we will need to reduce the MW quantity from CRR1 by 50 MW− 5 divided by 10% = 50 MW
• Resultant flow on Branch AB• Resultant flow on Branch AB− (100 – 50) × 10% + 200 × 15% = 35 MW
Slide 49

Si lt F ibilit T tSimultaneous Feasibility Test
Wh if h MW i f CRR2 i d dWhat if the MW quantity from CRR2 is reduced• Go through a similar process that was applied to CRR1CRR1
• To get 5 MW off of Branch AB the amount of the MW i f CRR2 d b d d bMW quantity from CRR2 needs to be reduced by
5 divided by 15% = 33.33 MW• Resultant flow on Branch AB
100 × 10% + (200 – 33.33) × 15% = 35 MW
Slide 50

Si lt F ibilit T tSimultaneous Feasibility Test
The two alternatives• Reduce the MW quantity from CRR1 by 50 MW
• Objective function = CRR1 MW quantity + CRR2 quantity MW = (100 – 50) + 200 = 250 MW
or
• Reduce the MW quantity from CRR2 by 33.33 MW
Obj i f i C i C 2• Objective function = CRR1 MW quantity + CRR2 MW quantity = 100 + (200 – 33.33) = 266.67 MW
Slide 51

Si lt F ibilit T tSimultaneous Feasibility Test
• Since 266 67 MW > 250 MW the maximum allocation• Since 266.67 MW > 250 MW the maximum allocation of CRR MW quantities happens in the alternative where the MW quantity from CRR2 is reduced by 33.33 MW
• CRR2 is more effective than CRR1 in alleviating the Constraint violation
This happens because the shift factor associated with– This happens because the shift factor associated with CRR2 is larger than the shift factors associated with CRR1 for the same Constraint
A d d bi ti f th MW tit f• Any reduced combination of the MW quantity from CRR1 and the MW quantity from CRR2 to alleviate the Constraint will result in a value of the objective function less than 266 67 MWless than 266.67 MW
Slide 52

Si lt F ibilit T tSimultaneous Feasibility Test
• Consider the WLS objective function for the previous i
j pscenario
• In the WLS formulation, the reduction on the flow on the constraint is pro‐rated based on squares of the shiftthe constraint is pro‐rated based on squares of the shift factors and the weight (one over nominated MW amount)WLS di ib h il ll CRR• WLS distributes the curtailment across all CRR nominations that are effective in relieving the congestion, and thus spreads the curtailment among multiple allocation participantsmultiple allocation participants
• The WLS is a more equitable formulation for the CRR ll i i h CRR i i h h
qallocation process; in that CRR nominations share the available capacity
Slide 53

Simultaneous Feasibility Testy
• The total overload on branch AB is 5 MW.• The shift factor for CRR1 is 0 01 ( 10 %) and for CRR2• The shift factor for CRR1 is 0.01 ( 10 %) and for CRR2 is 0.015 ( 15 %).
denoteX iCRRforMWnominated
VSF
denoteX
ki
i
Δ,
benominationeachinReductionk constraint wrt i CRR offactor shift be
i CRRfor MW nominated
VVV ik
ΔΔ
Δ ,
iCRRofbecuaseflowinreductionoverload Total
be nominationeach in Reduction
VRVV
kiik
ik
Δ⋅=Δ
Δ
,,
, iCRRofbecuaseflowin reduction
2 NSFX1 where,
)( 1,
2,
2,
, =⋅
⋅= ∑∑ =
N
ikiN
kii
kiiki R
SFX
SFXR
Slide 54
1=i

Simultaneous Feasibility Testy
• Reduction in contribution of CRR1 to flow on branch AB is 0 909 MWbranch AB is 0.909 MW.
• So CRR1 award is ( 100 – (0.90/0.1)) = 90.9 • Reduction in contribution of CRR2 to flow on branch AB is 4.09.S CRR2 d i ( 200 (4 09/0 15)) 172 72• So CRR2 award is ( 200 – (4.09/0.15))= 172.72
• Total CRR award is 263.63 which is less than t t l d i CRR th d hi htotal award in max CRR method which awarded 266.67 MW
• Thus there is a sharing of reduction as• Thus, there is a sharing of reduction as compared to the Max CRR method in which the most effective CRR is reduced first.
Slide 55

Simultaneous Feasibility Test
L t t k th l t f th d th t• Lets take the example one step further and assume that we just ran Tier 2 of the annual CRR Allocation and Branch AB in the example is binding, meaning no further flows are possible in the A to B direction we actually had to reducepossible in the A to B direction, we actually had to reduce the CRR2 nomination
• As we go into Tier 3 no further nominations with a positive contribution to the flows from A to B will be able to clear
• The only way that more CRRs could clear from A to B is if some CRRs are nominated that have a counter‐flow effect on A to B and create flows going from B to Aon A to B and create flows going from B to A
Slide 56

Simultaneous Feasibility Test OutagesSimultaneous Feasibility Test ‐ Outages
O tOutages• Scheduled outages may be considered in the annual process if the transmission facilities will be out‐of‐process if the transmission facilities will be out ofservice for several weeks over a season, otherwise, all lines are considered in‐service for annual process
• For the monthly process, the CAISO will be applying selected 30 days’ rule outages together with an appropriate global de‐rating factor to the model to pp p g gaccount for the planned outages.
• The detailed process will be included in the CRR BPM
Slide 57

S ti 2 QUESTIONS ?Section 2 – QUESTIONS ?
Simultaneous Feasibility Test• Full Network ModelFull Network Model
• Operating Constraints and Contingencies
• APNodesAPNodes
• Distribution/Allocation Factors
• Shift Factors and EffectivenessShift Factors and Effectiveness
• Outages
Slide 58

Section 3 – CRR Allocation Overview TopicsSection 3 – CRR Allocation Overview Topics
CRR Allocation OverviewCRR Allocation Overview• General timeline
Ti d A h d PNP• Tiered Approach and PNP
• Eligibility to Participate
C l l ti Eli ibl Q titi• Calculating Eligible Quantities
• TOR and ETC Modeling
L d Mi i• Load Migration
Slide 59

CRR Allocation and Auction – General TimelineCRR Allocation and Auction General Timeline
Long Term CRR Period – 10 Yearso g e e od 0 ea s
Annual/Seasonal Period ‐ 1 Year
Season 1 Season 2 Season 3 Season 4
Month 1 Month 2 Month iMonth 12
TA2
TA1 TM2
TA2
TLT1 TM1 TM i TLT2 TM12
Slide 60
TLT1 TM1 TM i TLT2 TM12

CRR All ti d A ti A l Ti liCRR Allocation and Auction – Annual Timeline
Annual Process timeline overviewAnnual Process timeline overview• Only 75% of the FNM capacity will be made available
• TA1 &TLT1 : Approximately 4 months before the start of the CRR year, the annual allocation/auction process will begin, which will produce seasonal/TOU CRRs for Seasons 1, 2, 3 pand 4. Tier LT of the annual allocation process will produce seasonal/TOU long term CRRs that will be allocated for the duration of 10 yearsy
Slide 61

CRR All i d A i A l Ti li ( )CRR Allocation and Auction – Annual Timeline (cont.)
• During this annual allocation/auction process:During this annual allocation/auction process:− Tier 1 for all four seasons and TOU will be processed simultaneously, then Tier LT for all four seasons and TOU will be processed− Tier LT for all four seasons and TOU will be processed simultaneously, then
− Tier 2 for all four seasons and TOU will be processed simultaneously thensimultaneously, then
− Tier 3 for all four seasons and TOU will be processed simultaneously, thenThe auction for all four seasons and TOU will be processed− The auction for all four seasons and TOU will be processed simultaneously
• TA2 & TLT2: Approximately 4 months before the start of the next year (year 2) the annual allocation/auctionthe next year (year 2), the annual allocation/auction process will begin, which will produce seasonal/TOU CRRs for Seasons 1, 2, 3 and 4 and seasonal/TOU long term CRRs
Slide 62

CRR Allocation and Auction – Annual Timeline (cont.)
• “Process simultaneously” means when all fourProcess simultaneously means when all four seasonal tier‐one allocation markets are processed, all four are opened for nomination submission and ll f h l d f ball four are then closed for nomination submission at the same time.Th CAISO ill th th SFT f h• The CAISO will then run the SFT process for each seasonal tier‐one (one SFT for the on‐peak period and one SFT for the off‐peak period, for eachand one SFT for the off peak period, for each season).
• The CAISO will post all of these market results at pthe same time.
• The annual process is illustrated in the next figure.
Slide 63

General Annual Process for Seasonal/TOUGeneral Annual Process for Seasonal/TOU
Eligible Quantity of CRRs that may be requested
Historic Load Data
A separate SFT will be run for
CRR Signature Validation from prior annual cleared CRRs Validate Sink Location and Sink MWs to 66.7% of SEQ less CRRs awarded in Tier LT for the same period
Tier 1 – Priority Nomination Process Nominations
Cleared CRRs
will be run for each TOU
CRR Signature Validation based on PNT cleared CRRs Sink Upper Bound up to 50% of ALM less LT CRRs for the same period
Tier LT Nominations
Cleared CRRs
For T1,T2 and T3 the
FNM
CRR ParticipantsInteracting
same period
Nominations
Cleared CRRs
Capacity is Scaled
to 75 Tier 2
Validate Sink location and Sink MW to 66.7% of SEQ less the b f CRR d d i Ti 1 d Ti LT f th i d through the
Market User Interface
Validate Sink Location and Sink MWs to 100% of SEQ less the
Tier 3
Cleared CRRsPercent for Tier LT to 60 P t
number of CRRs awarded in Tier 1 and Tier LT for the same period
Nominations
Cl d CRRValidate Sink Location and Sink MWs to 100% of SEQ less the number of CRRs Awarded in Tier 1, 2 and LT for the same period
Auction Bids
Percent Cleared CRRs
Slide 64
Bids are used to compute estimated exposure and compared to available Collateral, no validation for Sources or Sinks Cleared CRRs

CRR Allocation Annual Tiered ProcessCRR Allocation – Annual Tiered Process
• For the annual allocation process Tier 1 will be the pPriority Nomination Process (PNP)
• Entities that did not participate or did not receive any CRR through the annual allocation processes are notCRR through the annual allocation processes, are not eligible to participate in the PNP.
• In the PNP an LSE or OBAALSE may make nominations up y pto the lesser of:– Two thirds of the Seasonal CRR Eligible Quantity for the current
year minus the quantity of previously allocated Long Term CRRsyear minus the quantity of previously allocated Long Term CRRs for each season, time of use and CRR sink.
– Total quantity of CRRs allocated in the previous annual CRR allocation minus the quantity of those Long‐Term CRRs allocatedallocation minus the quantity of those Long‐Term CRRs allocated in the prior year’s Long‐term CRR allocation for each season, time of use and CRR sink, and minus any reduction for net loss of Load through retail Load migration.
Slide 65
of Load through retail Load migration.

CRR Allocation – Annual Tiered Process (cont )CRR Allocation – Annual Tiered Process (cont.)
• In the PNP CRR nominations are all Signature• In the PNP, CRR nominations are all Signature validated. Meaning the CRR source‐sink pairs have to have been allocated in the immediately previousto have been allocated in the immediately previous annual CRR Allocation process and cannot exceed the MW amounts allocatedthe MW amounts allocated.
• In the PNP, CRR nominations with the Trading Hub as ll d b ll b l da source are not allowed but will be valid in 2012.
• In the PNP, CRR nominations with the Sub‐LAP as a sink are not allowed.
Slide 66

CRR All ti A l Ti d P ( t )CRR Allocation – Annual Tiered Process (cont.)
Ti 2 i li it d t t thi d f th LSE’• Tier 2 is limited to two thirds of the LSE’s or OBAALSE’s Seasonal CRR Eligible Quantity for each season time of use and CRR sink minus theeach season, time of use and CRR sink, minus the quantity of:
– CRRs allocated to that LSE or OBAALSE in tier 1 and,– Long Term CRRs previously allocated that are valid for the CRR term
currently being allocated
• An LSE can nominate Trading HubsAn LSE can nominate Trading Hubs• Sub‐LAPs will be eligible CRR sinks provided that the Sub‐LAP is within the nominating entitiesthe Sub LAP is within the nominating entities Default LAP
Slide 67

CRR All ti A l Ti d P ( t )CRR Allocation – Annual Tiered Process (cont.)
• Tier 3 is limited to 100% of the LSE’s or OBAALSE’s Seasonal CRR Eligible Quantity for each season, i f d LAP i i ftime of use and LAP minus quantity of:
– Any Tier 1 and 2 allocated CRRs and,l ll d h l d f h– Long Term CRRs previously allocated that are valid for the CRR
term currently being allocated
• Sub LAPs will be eligible CRR sinks provided that• Sub‐LAPs will be eligible CRR sinks provided that the Sub‐LAP is within the nominating entities Default LAPDefault LAP
• CRRs sourced at Trading Hubs are eligible
Slide 68

CRR Allocation and Auction Monthly TimelineCRR Allocation and Auction – Monthly Timeline
• 100% of the FNM capacity will be made available after accounting for any adjustments for outages or derates
• T Approximately 6 weeks before the start of the first month• TM1: Approximately 6 weeks before the start of the first month (month 1), the monthly process begins, which produces monthly/TOU CRRs for month 1
• TM2: Approximately 6 weeks before the start of the second month (month 2), the monthly process begins, which produces monthly/TOU CRRs for month 2monthly/TOU CRRs for month 2
• TMi: Approximately 6 weeks before the start of the ith month (month i), the monthly process begins, which produces ( ), y p g , pmonthly/TOU CRRs for month
• The monthly process is illustrated in the monthly process figure
Slide 69

CRR Allocation and Auction – Monthly Process
Eligible Quantity of CRRs that may be requested
Forecasted Load Data
A separate SFT
Input NominationValidate Sink Location and Sink MWs to 100% of (M hl CRR Eli ibl Q i S l d
Tier 1 for one month Nominations
nt s
will be run for each TOU
(Monthly CRR Eligible Quantity – Seasonal and Long Term CRRs for the same period)Conduct SFT
CRR
Cleared CRRs
00 P
erce
nr
de-r
ates
CRR Participants interacting through the
Input NominationValidate Sink Location and Sink MWs to 100% of (Monthly CRR Eligible Quantity – Monthly Tier 1
Tier 2 for one monthNominations
acity
at 1
0ge
s and
/or
Market User
Interface
(Monthly CRR Eligible Quantity Monthly Tier 1 CRRs – Seasonal and Long Term CRRs for the same period)Conduct SFT
Cleared CRRs
NM
Cap
aes
s out
ag
Input BidsBids are used to compute maximum purchase amount and compare against posted CollateralNo Validation for Sources or Sinks
Auction for one month Bids
Cl d CRR
FN L
Slide 70
No Validation for Sources or SinksConduct Auction and SFT Cleared CRRs

CRR All ti M thl Ti d PCRR Allocation – Monthly Tiered Process
• In the monthly allocation process there is not a PNPIn the monthly allocation process there is not a PNP
• In Tier 1 of the monthly allocation LSEs and OBAALSEs can nominate up to 100% of the difference between itscan nominate up to 100% of the difference between its Monthly CRR Eligible Quantity and the total of any Seasonal CRRs allocated in the annual CRR Allocation d h ldi f L T CRR h lid fand any holdings of Long Term CRRs that are valid for
the month and time of use of the CRRs being nominated.nominated.
• Trading Hubs are allowed as sources.
• Sub‐LAPs will be eligible CRR sinks provided that the Sub‐LAP is within the nominating entities Default LAP
Slide 71

CRR All ti M thl Ti d P ( t )CRR Allocation – Monthly Tiered Process (cont.)
I i 2 f h hl ll i LS d O AALS• In Tier 2 of the monthly allocation LSEs and OBAALSEs can nominate up to 100% of the difference between its Monthly CRR Eligible Quantity and the total of anyMonthly CRR Eligible Quantity and the total of any Seasonal CRRs allocated in the annual CRR Allocation and any holdings of Long Term CRRS that are valid for the month and time of use of the CRRs beingthe month and time of use of the CRRs being nominated minus the number on Monthly CRRs allocated in Tier 1.
• Trading Hubs are allowed as sources.
• Sub‐LAPs will be eligible CRR Sinks provided the Sub‐LAP is within the entities Default Lap
Slide 72

Eligible Allocation ParticipantsEligible Allocation Participants
AllocationMust be classified as one of the following:
L d S i E tit (LSE) hi h i l d• Load Serving Entity (LSE), which includes:− Entities serving load within the CAISO Control Area− Metered Subsystems – Gross and Net election
• Out of Balancing Authority Area Load Serving Entity (OBAALSE), which includes:− Load external to the CAISO Balancing Authority Area beingLoad external to the CAISO Balancing Authority Area being served with internally owned or contracted generation that is subject to Congestion on the CAISO controlled grid
− Subject to other conditions such as prepayment of WAC− Subject to other conditions, such as prepayment of WAC
Slide 73

Eligible Allocation Participants (cont.)g p ( )
Merchant Transmission• Will be eligible for MT CRRs only if such entity has turned over the qualifying facilities to the CAISO and has elected not to recover costs of its investmentsnot to recover costs of its investments
• May request up to five nominations for each TOU• Three step process for releasing MT CRRsThree step process for releasing MT CRRs
− Determine the capability of the existing Transmission System− Determine the mitigation of impacts on existing encumbrances
D t i th i t l M h t T i i CRR− Determine the incremental Merchant Transmission CRRs
• Duration of MT CRRs will be 30yrs or pre‐specified intended life of facilityy
• MT holders can elect to receive CRR Options or Obligations
Slide 74

Calculating Eligible Quantities
Once a Candidate CRR Holder has registered and become eligible to participate in the CRR Allocation process the CAISO will require the entity to submit either historical or forecast Load data that is used to determine either the Seasonal CRR Eligible Quantity or Monthly CRR Eligible Quantity, respectively.
Slide 75

C l l ti Eli ibl Q titi ( t )Calculating Eligible Quantities (cont.)
Seasonal CRR Eligible Quantityg Q y• Seasonal CRR Process
₋ Start with historical load duration curves, to derive the 0.5% exceedance level for CRR Load Metric which is based on season, time of use and load area. OBAALSEs will submit similar data but associated with usage ofwill submit similar data but associated with usage of export points and the level of load subject to CAISO congestiong
₋ Subtract load served by TOR and ETC (Adjusted Load Metric)
l l l b₋ Multiply result by 75%₋ This value is the Seasonal CRR Eligible Quantity
Slide 76

C l l ti Eli ibl Q titi ( t )Calculating Eligible Quantities (cont.)
Long Term Eligible Quantity
• Limited up to fifty (50) percent of the• Limited up to fifty (50) percent of the Adjusted Load Metric
• Nominations are validated against cleared CRRs from the Priority Nomination Tier of C s o t e o ty o at o e othe annual process for the current CRR year
Slide 77

C l l ti Eli ibl Q titi ( t )Calculating Eligible Quantities (cont.)
Monthly Eligible QuantityMonthly CRR Process
• Start with forecasted load duration curves to derive the 0 5%• Start with forecasted load duration curves to derive the 0.5% exceedence for the CRR Load Metric based on month, time of use and load areaS bt t l d d b TOR d ETC• Subtract load served by TOR and ETC
• Subtract seasonal allocated CRRs from the annual and long term CRRs that correspond to the month in which the allocation is to be run.
• Validated against the CEC 60‐day ahead forecast• This value is the Monthly CRR Eligible Quantity
Slide 78

C l l ti Eli ibl Q titi ti dCalculating Eligible Quantities ‐ continued
Allocation to Metered Subsystems (MSS)• Annually, must choose net or gross settlement treatment• If gross selected process is the same as non MSS LSEs• If gross selected, process is the same as non‐MSS LSEs• If net selected, MSS Operator submits hourly historical net
Demand data (seasonal) and forecast net Demand data (monthly) from which CAISO constructs net Load duration curves to determine their Seasonal and Monthly CRR Eligible QuantitiesQuantities
Slide 79

Calculating Eligible Quantities continuedCalculating Eligible Quantities ‐ continued
OBAALSE ProcessBefore calculating the eligible quantity for an OBAALSE, it must demonstrate eligibility to participate in the CRR Allocation by the following
• Show legitimate need by demonstrating the entity holds an existing contract with or owns Generation internal to the CAISO Control Areacontract with or owns Generation internal to the CAISO Control Area
• Show legitimate need by demonstrating the entity holds an existing contract with or owns Generation external to the CAISO Control Area
• Pre‐pay the appropriate Wheeling Access Charge based on the amount ofPre pay the appropriate Wheeling Access Charge based on the amount of CRRs being nominated
• Confirm that the external load for which the CRRs are being nominated is not served under Transmission Ownership Rights (TORs), Existingnot served under Transmission Ownership Rights (TORs), Existing Transmission Rights (ETCs) and is exposed to CAISO Congestion charges
• All CRR nominations in all CRR years must be source verified
Slide 80

C l l ti Eli ibl Q titi ( t )Calculating Eligible Quantities (cont.)
OBAALSE Process (cont )OBAALSE Process (cont.)• The OBAALSE will submit two sets of hourly data from which the CRR system will construct load duration curves yfor determining the Seasonal and Monthly CRR Eligible Quantities. Their eligible quantity will be based on the lesser of the 0.5% point on the duration curves generated by the following data− Historical hourly exports at the Scheduling Point (s) for which the CRRHistorical hourly exports at the Scheduling Point (s) for which the CRR request will be sunk at, summed for all Scheduling Points being requested, or
− Hourly data that reflects the prior years hourly metered load associated y p y ywith the load that was subject to CAISO Congestion Charges for use of the CAISO Controlled Grid
Slide 81

TOR and ETC ModelingTOR and ETC Modeling
• There are two basic types of transmission rights thatThere are two basic types of transmission rights that the CAISO models through the CRR process
– Transmission Ownership Rights (TORs)– Existing Transmission Contracts (ETCs)
• These rights are defined through the Transmission g gRights Transmission Curtailment (TRTC) procedures
• When the CAISO models these rights the intent is toWhen the CAISO models these rights the intent is to remove capacity, which has a “perfect hedge”, so that CRRs are not allocated or auctioned on this capacity
• The CAISO holds these CRRs not the rights holder
Slide 82
g

TOR ETC Modeling (cont )TOR, ETC Modeling (cont.)
d li f i i i hModeling of Transmission Rights• Transmission Ownership Rights (TORs) Modeling
E f ll CAISO i h if−Exempt from all CAISO congestion charges if schedules are within rights (“perfect hedge”)CAISO will remove capacity from the FNM by−CAISO will remove capacity from the FNM by modeling TORs as Point‐to‐Point CRR Options (do not provide counter‐flow)( p )
levels based on contractual rights and historical usage
Slide 83

TOR ETC Modeling (cont )TOR, ETC Modeling (cont.)
d li f i i i h ( )Modeling of Transmission Rights (cont.)• Existing Transmission Contract (ETC) Rights
Exempt from all CAISO congestion charges if− Exempt from all CAISO congestion charges if schedules are within rights (“perfect hedge”)
− CAISO will model CRRs to account for the congestion h fcharge exemption of ETCs, so as to ensure CRR revenue adequacy
− ETCs are modeled as Point‐to‐Point CRR ObligationsETCs are modeled as Point to Point CRR Obligations (provide counter‐flow)
levels based on contractual rights and historical usage
Slide 84

Load Migrationg
• Introduction to CAISO Load Migration Process
• Tracking Load Migration
• Simple Load Migration Example
• Conclusion• Conclusion
Slide 85

Introduction to Load Migrationg
Wh t i L d Mi ti ?What is Load Migration?• Load Migration is the process of tracking the transfer of load
between a pair of Load Serving Entities (LSEs).
• LSE may have Congestion Revenue Rights (CRRs) in different Utility Distribution Company (UDC) territories, but only those sinking at a UDC’s location where the migrated load is placedsinking at a UDC s location where the migrated load is placed will be considered in the corresponding transfer. In other words, an LSE losing load only in UDC1 would only lose CRRs in UDC1UDC1.
• The calculation for the transfer of allocated CRRs held by the losing LSE is computed for each source to sink combination in the load‐losing LSE’s portfolio of allocated CRRs, by season and TOU. Only CRRs with the same path can be netted.
Slide 86

Introduction to Load Migration (cont.)
Wh t i L d Mi ti ? ( t )What is Load Migration? (cont.)• Instances where a customer moves within a UDC service area,
the closing or opening of one account are not tracked as load migration between LSEs.
• It is designed to transfer the appropriate quantity of CRR between LSEs involved in migration In other words when loadbetween LSEs involved in migration. In other words, when load move from one LSE to another, allocated CRRs must be transferred to follow the load.
• Load migration holds only for annual allocated CRRs, and LSEs only. Thus, only seasonal and LT CRRs will be transferred.
C SO i i l i hi• CAISO is using a one‐to‐one percentage relationship to determine the CRR transfers.
Slide 87

Tracking Load MigrationTracking Load Migration
Th CAISO ill i hl d f h• The CAISO will receive monthly records from each UDC reflecting transfer of customers between LSEs.UDC i d b i d i h diff• UDCs are required to submit data in three different files, usually on the 20th of each month:
Di t A S i R t (DASR) fil– Direct Access Service Request (DASR) summary files containing the information about the net positive number of end‐use customers per customer class transferring from p gone LSE to another LSE.
– Number of customers (in each customer class) of each LSE d i b i i th i t it idoing business in their territories.
– Average consumption rates for each customer class.
Slide 88

Tracking Load Migration (cont.)g g ( )
• Load Migration adjustments process will be on a thl b imonthly basis.
• The Load Migration Tool (LMT) calculations for CRR transfers usually take place on the 21st of each month for the transactions reported in the DASR summary records which have the effective startsummary records, which have the effective start date as of the first day of the next month.
• The DASR summary records should include the customers completing transfers within the month plus customers which completed transfers prior toplus customers which completed transfers prior to the current month but have not been reported in previous DASR summary records.
Slide 89
p y

T ki L d Mi ti ( t )Tracking Load Migration (cont.)
• The effective start date is the effective start date forThe effective start date is the effective start date for the CRR transfer, which is the first day of the next month.
• For example, for a file to be submitted on April 20thfor May 2011 CRR monthly process, the number of customers will include the customers completing transfers between April 1st and April 30th, 2011 (inclusive) plus customers which completed(inclusive), plus customers which completed transfers before April 1st, 2011 but were never reported in previous DASR summary records. And the effective start date will be May 1st ,2011.
Slide 90

Simple Load Migration ExampleSimple Load Migration Example
The aim of this numerical example is to show the computation of CRR transfer when there are multiple migrations in the same monthly process involving more than two LSEs.
1. Track load migration. After counting the number of customers per class and getting the net load in MW for
h i f LSE d f h l t th i k Xeach pair of LSEs and for each class at the same sink X, the following information is obtained:a. LSE2 loses 20MW to LSE3 in the commercial classa. LSE2 loses 20MW to LSE3 in the commercial class
b. LSE1 loses 10MW to LSE2 in the residential class
c. LSE2 loses 5MW to LSE3 in the industrial class
Slide 91

Simple Load Migration Example (cont )Simple Load Migration Example (cont.)
2. Compute the net Load Migration Quantity (LMQ) for each p g Q y ( Q)load‐losing LSE
LSE1 LSE2 LSE3
LSE1 ------------- 10=10 0
LSE2 -10=-10 -------------- 20+5=25LSE3 0 -20-5=-25 ------------
The net migration for each load-losing LSE is:
a LSE1 loses 10 MW to LSE2a. LSE1 loses 10 MW to LSE2
b. LSE2 loses 25 MW to LSE3
Slide 92

Simple Load Migration Example (cont )Simple Load Migration Example (cont.)
3. Compute the Current Eligible Quantity (CEQ) for the LSEs. With the current number of customers and the current
/MW/customer, the following CEQs are computed:
CEQ CRR holdings
LSE1 140 A-X=100
LSE2 200 B-X=150
LSE3 400 C-X=170
Slide 93

Simple Load Migration Example (cont )Simple Load Migration Example (cont.)
4. Calculate percentage of load migration and CRR
LSE1 loses 10 MW
a) CEQ=140 MWb) MW lost=10 MW
LSE2 gains 10 MW
a) CEQ=200 MWb) CRR owned
transfersa. LSE1 loses 10 MW to LSE2
b) MW lost 10 MWc) Migration
%=10/140=7.142%
d) CRR owned
b) CRR owned B-X=150 MW
c) New issued CRR A-X=7.142 MW
d) Net CRR holdingsd) CRR owned A-X=100 MW
e) New counter-flow CRR X-A=100*7.142%
d) Net CRR holdingsB-X=150 MWA-X=7.142 MW
X A 100 7.142%=7.142 MW
f) Net CRR holdings A-X=100-7.142=92.858 MW9 858
Slide 94

Simple Load Migration Example (cont )Simple Load Migration Example (cont.)
5. Calculate percentage of load migration and CRR
LSE2 loses 25 MW
a) CEQ=200 MWb) MW lost=25 MW
LSE3 gains 25 MW
a) CEQ=400 MWb) CRR ownedtransfers
b. LSE2 loses 25 MW to LSE3
b) MW lost=25 MWc) Migration
%=25/200=12.5%d) CRR owned
B-X=150 MW
b) CRR owned C-X=170 MW
c) New issued CRR B-X=18.75 MW
d) Net base CRRLSE3 B-X=150 MWe) New issued
counter-flow CRR X-B=150*12 5%=18
d) Net base CRR holdingsC-X=170 MWB-X=18.75 MW
B=150 12.5%=18.75 MW
f) Net base CRR holdings B-X=150-B X 15018.75=131.25 MW
Slide 95

Simple Load Migration Example (cont )Simple Load Migration Example (cont.)
6. After the computation of the CRR transfers, a load migration p , gfile is created for uploaded to the Nexant system. This file has the newly created CRR portfolios for LSEs involved in migration. LSE1 LSE2 LSE3 CRR type
A-X=100 B-X=150 C-X=170 Original owned
X-A=7.142 A-X=7.142 New issued, Transfer 1
X-B=18.75 B-X=18.75 New issued, Transfer 2
A-X=100 B-X=150 C-X=170 Updated CRR portfolio forX-A=7.142 X-B=18.75
A-X=7.142B-X=18.75
p peach LSE
Slide 96

Load Migration ConclusionLoad Migration ‐ Conclusion
The CAISO primary purpose for implementing the Load Migration process is to ensure that each Market g pParticipant’s (MP) CRR portfolio would be accurate in the event of transfer of load between LSEs.
Slide 97

Section 3 – QUESTIONS ?Section 3 – QUESTIONS ?
CRR Allocation OverviewCRR Allocation Overview– General timeline
Ti d A h d PNP– Tiered Approach and PNP
– Eligibility to Participate
C l l ti Eli ibl Q titi– Calculating Eligible Quantities
– TOR and ETC Modeling
L d Mi i– Load Migration
Slide 98

Section 4 – CRR AuctionSection 4 – CRR Auction
• Auction Eligibility• Auction Eligibility
• Auction Overview
A ti Cl i P i• Auction Clearing Prices
• Bid Structure
M i P h A• Maximum Purchase Amount
• Pre‐Auction Credit Requirement
d• Credit Margin
Slide 99

CRR Auction: Auction EligibilityCRR Auction: Auction Eligibility
All entities can participate in the auction that have:• Registered as a Candidate CRR Holder with the CAISORegistered as a Candidate CRR Holder with the CAISO
– Registration process is detailed in the BPM for Candidate CRR Holder Registration, which can be found at: https://bpm caiso com/bpm/bpm/listhttps://bpm.caiso.com/bpm/bpm/list
Slide 100

CRR Auction: Auction OverviewCRR Auction: Auction Overview
• Bid‐based market that produces marginal clearing prices (MCP) for each CRR and every APNode(MCP) for each CRR and every APNode
• Based on the MCP for each CRR awarded, the holder mayI h ( iti MCP)– Incur a charge (positive MCP)
– Incur no charge (the MCP is zero for the CRR)– Be paid by the CAISO (negative MCP)
• Monthly Auction begins after the 2‐tiered monthly Allocation process– CRRs are awarded in 1‐month durations
• Annual Auction begins after the 4‐tiered annual Allocation processp– CRRs are awarded in four 3‐month durations (to equal 12 months)
• Auction market open & close dates will be posted
Slide 101
p p

CRR A ti A ti O i ( t )CRR Auction: Auction Overview (cont.)
• All bids submitted into the auction process are subject to:
l l f f l– Initial validations of maximum portfolio credit exposure against Aggregate Credit Limit
– A Simultaneous Feasibility Test with all previously allocated CRRs for the same period and TOU modeled as fixed injections and withdrawalsand withdrawals
• Bids may not be withdrawn after the submission window yhas closed
Slide 102

CRR A ti A ti O i ( t )CRR Auction: Auction Overview (cont.)
Allowable CRR Auction Sources & Sinks
CRR Sources and Sinks
Generating Unit PNodes
Trading Hubs
LAPs
MSS‐LAPs
Sub‐LAPs
Scheduling Points
Slide 103

CRR Auction: Auction Clearing Prices
• All CRR APNode market clearing prices (MCPs) will be published after each marketp
• The clearing price of a CRR is the MCP at the source minus the MCP at the sink
Slide 104

CRR Auction: Bid StructureCRR Auction: Bid Structure
• Bid must contain:Bid must contain:– The associated season and time‐of‐use period– The associated CRR Source and CRR Sink
• All CRR bids are piecewise linear
• MW portion must be greater than or equal to zero and denominated in thousandths of MW
• CRR bid price input in $/MW – Price may be negative– Price may be negative– The first MW quantity used in the bid must be 0
Slide 105

CRR Auction: Bid Structure (cont.)( )
PTP CRR bid• One CRR bid for the CRR, which is similar to a Demand Bid for Energy
• Bid must be monotonically decreasing (MW increase, $ decrease)
• Each price point ($/MW) on the CRR bid curve represents the maximum price the bidder is willing to pay for the next increment of CRR MW quantity
Slide 106

CRR Auction: Maximum Purchase AmountCRR Auction: Maximum Purchase Amount
Maximum Purchase Amount
• Can be calculated before the CRR Auction is processed (before the actual MCPs are determined)
• The maximum purchase amount may not exceed Aggregate Credit Limit
Slide 107

CRR Auction: Maximum Purchase AmountCRR Auction: Maximum Purchase Amount
Th t f l l ti th i hThe steps for calculating the maximum purchase amount.
• For a PTP CRR bid the price at each MW level indicatesFor a PTP CRR bid, the price at each MW level indicates the maximum price the buyer is willing to pay for the next MWTh MCP f l i th t MW l l ill t d th• The MCP for clearing that MW level will not exceed the bid price at that MW level
• The MCP may be less than the bid price at that MW y plevel
• Actual purchase price for a CRR may be less than the maximum purchase amountmaximum purchase amount
• The maximum purchase amount is used as an upper bound for the actual purchase amount
Slide 108

CRR Auction: Maximum Purchase AmountCRR Auction: Maximum Purchase Amount
Example: Maximum Purchase Amount p$/MW
25
3530
10
20
5
15
MW80 10510 13540 100
Maximum Price Buying at Buying at Most Potentially Maximum Amount to Pay ($/MW) To Pay for All
MW PurchasedLeast This Many MW
This Many MW ($) for MW Purchased max( 0 , Price x Quantity)
30 0 10 300 = 30 x 10
25 10 40 1,000 = 25 x 40
15 40 80 1,200 = 15 x 80
10 80 100 1,000= 10 x 100
Slide 109

CRR Auction: Pre‐Auction Credit Requirement
Pre‐Auction Credit Requirement Overview
q
• Calculates the maximum possible credit exposure of each bid should the market participant win the bid made in the auction and includes the credit marginand includes the credit margin
• Evaluated against Available Credit on a portfolio basis− A portfolio can contain multiple bids− Available Credit = Aggregate Credit Limit (“ACL”) – Estimated Aggregate Liability (“EAL”)
• Minimum credit requirement for participating in an auction is:− Annual ‐ $500,000− Monthly ‐ $100,000
• Exceeding available credit results in the rejection of the entire• Exceeding available credit results in the rejection of the entire portfolio
• Additional financial security may be posted
Slide 110

CRR Auction: Pre‐Auction Credit Requirement
Pre‐Auction Credit Requirement Overview (cont.)
q
Pre Auction Credit Requirement Overview (cont.)• Positive Bid: maximum credit exposure of a bid is the maximum
value of the bid quantity (MW) multiplied by the sum of bid q y ( ) p yprice corresponding to the bid quantity and the Credit Margin of the CRR within the range of the minimum and maximum bid quantities
• Negative Bid: maximum credit exposure of a negatively valued bid i th i bid tit (MW) b itt d lti li d bbid is the maximum bid quantity (MW) submitted multiplied by the Credit Margin
• Aggregate Credit Limit must equal or exceed the greater of• Aggregate Credit Limit must equal or exceed the greater of $100K (monthly)/$500K(annual) or the sum of the maximum credit exposures of all MP’s bids for CRRs submitted
Slide 111
p

CRR Auction: Pre‐Auction Credit R i t F lRequirement ‐ Formula
Linear Bid Price = m x MW + n (1)
WhereWhere
Ci+1 and Ci are bid price ($/MW) at bid point i and i+1 respectively for buy bids, Ci+1 ≤ Ci
MW andMW are bid MW at bid point i and i+1 respectively whereMW ≤MWMWi and MWi+1 are bid MW at bid point i and i+1 respectively where MWi ≤ MWi+1
m is the slope of the bid segment
It is equal to zero when MWi = MWi+1 or Ci+1 ≤ 0 and Ci ≤ 0.
Otherwise,
(2)( )
n is a constant bid price of the segment It is defined asn is a constant bid price of the segment. It is defined as
(3)
Slide 112

CRR Auction: Pre‐Auction Credit Requirement – Formula (cont.)
The bid credit exposure is calculated based on the linear bid price plus credit marginThe bid credit exposure is calculated based on the linear bid price plus credit margin as shown in equation 4.
Linear Bid Price plus CM (4)
WhereWhere
(5)
d is the number of days for a specific TOU and month
CM is the credit margin ($/MW‐Day for a specific TOU and monthCM is the credit margin ($/MW Day for a specific TOU and month
M is the number of months in an auction effective period
TOU is defined as off‐peak and 24 hour off‐peak for an off‐peak bid and on peak for an on peak bidon‐peak for an on‐peak bid
Slide 113

CRR Auction: Pre‐Auction Credit R i t F l ( t )Requirement – Formula (cont.)
From the linear bid price plus credit margin in equation (4), the cost ($) of the bid segment, which is Credit Exposure, is defined as:
Credit Exposure (6)
To determine the MW where the highest credit exposure (MW*) of this bid segment is at, solve for the MW l h h i l d i i f h C di E i lMW value where the partial derivative of the Credit Exposure is equal to zero.
(7)
(8)
The MW* as shown in the equation 8 yields the highest credit exposure of the bid segment only when q y g p g yMW* is between two bid MW points (MWi and MWi+1) and m is not equal to zero.
If , set ;
If , set
Slide 114

CRR Auction: Pre‐Auction CreditCRR Auction: Pre Auction Credit Requirement – Formula (cont.)
If m equals zero, the MWi+1 is used to calculate the highest credit exposure of the bid segment (MW* = MWi+1).
Using MW*, the credit exposure in the equation 6 becomes:g , p q
Bid Segment Credit Exposure = (9)
Slide 115

CRR Auction: Pre‐Auction Credit Requirement – Formula (cont.)
Treatment of Negati e Bid PricesTreatment of Negative Bid Prices
When a buy bid segment is between a positive bid price and a negative bid price, the bid MW where the bid price is equal to zero is determined by performing a linearbid MW where the bid price is equal to zero is determined by performing a linear interpolation.
Interpolated MW = (10)
When a buy bid segment is between two negative bid prices, the slope of the bid segment (m) is set to zero.
Final Maximum Bid Exposure
The final pre auction credit requirement of a CRR bid is the maximum value ofThe final pre‐auction credit requirement of a CRR bid is the maximum value of the highest credit exposure of all bid segments.
Slide 116

CRR Auction: Pre‐Auction CreditCRR Auction: Pre Auction Credit Requirement ‐ Example
Bid with positive and negative pricesBid with positive and negative pricesBid Curve
Bid Point Number Bid MW Bid Price ($/MW)1 0 7502 5 6003 10 4504 15 3005 20 1506 25 0
Credit Margin Calculation
6 25 07 30 -1508 35 -300
Month TOU # of days (d)
Credit Margin (CM) d*CM
Jan OFF 25 10 250 64.72128278 SeasonalJan OFF24 6 1 6 45.97895732 JanJan OFF24 6 1 6 45.97895732 JanFeb OFF 24 7.5 180 35.52866046 FebFeb OFF24 4 2 8 30.53290134 MarMar OFF 27 6 162Mar OFF24 4 2 8
Slide 117

CRR Auction: Pre‐Auction CreditCRR Auction: Pre‐Auction Credit Requirement ‐ Example
$
Seasonal Effective Exposure
Maximum Credit
Pre-Auction Credit Requirement =
max($500k,Max Bid MW $/MW CM m n -(n+CM)/(2m) MW* of MW* Exposure Credit Exposure)
0 750 64.7213 -30 750 13.5787 5.0000 3323.6064 5,531.42 500,000.00
5 600 64.7213 -30 750 13.5787 10.0000 5147.2128
10 450 64.7213 -30 750 13.5787 13.5787 5531.4231
15 300 64.7213 -30 750 13.5787 15.0000 5470.8192
20 150 64.7213 -30 750 13.5787 20.0000 4294.4257
25 0 64.7213 0 0 0.0000 30.0000 1941.6385
30 -150 64.7213 0 0 0.0000 35.0000 2265.244935 -300 64.7213
Slide 118

CRR Auction: Credit Marging
Credit Margin CalculationCredit Margin Calculation– The difference between the expected value and the fifth percentile value of the congestion revenue generated bypercentile value of the congestion revenue generated by a one‐MW ST‐CRR
RevenCongCRRPercentile5thRevenCongCRRExpectedMarginCredit =
– Where the Expected and the 5th Percentile CRR Congestion Revenue are determined based on the
.... RevenCongCRRPercentile5thRevenCongCRRExpectedMarginCredit −=
Congestion Revenue are determined based on the probability distribution of the congestion revenue of a one‐MW ST‐CRR, which is derived based on the historical LMP dataLMP data.
Slide 119

CRR Auction: Credit Marging
• Data Used in Credit Margin Calculation– Most current 36 months of hourly LMP congestion prices– LMP study data (until 36 months of real operational data exists)
• Calculation Frequency• Calculation Frequency– Credit margin will be calculated no less than annually, but may be calculated on a more frequent basismay be calculated on a more frequent basis
• Calculation results will be posted no later than 30 days prior to the start of the annual allocationy p
Slide 120

Section 4 – QUESTIONS ?Q
• Auction EligibilityAuction Eligibility
• Auction Overview
• Auction Clearing Prices
• Bid Structure• Bid Structure
• Maximum Purchase Amount
• Pre‐Auction Credit Requirement
• Credit Margin• Credit Margin
Slide 121

Section 5 – CRR Holding RequirementsSection 5 – CRR Holding Requirements
CRR Holding Requirements• OverviewOverview
• Formula for Calculating CRR Holding Requirements
• Extraordinary Circumstancesy
• Compliance Measures
Slide 122

CRR Holding Requirements: OverviewCRR Holding Requirements: Overview
• Once CRRs have been acquired, either through the CRR Allocation, CRROnce CRRs have been acquired, either through the CRR Allocation, CRR Auction or secondary trades, each CRR Holder must maintain sufficient collateral to cover the CRR Holding requirements.
• CRR Holding Requirements consist of two components:
– Credit Requirement
– Credit Margin
• Overall holding requirement is assessed for the whole portfolio of CRRs of each holder
– Excess credit from some CRRs can offset credit requirements of other CRRs in the same portfolioother CRRs in the same portfolio
– Excess credit of the CRR portfolio cannot offsetnon‐CRR credit requirements
Slide 123

CRR Holding Requirements: CalculationCRR Holding Requirements: Calculation
∑ ∑pi pmiM D, ,,
∑ ∑
∑ ∑= =
×
×−=
pi pmiM D
pmdiDaily
pmdi
m dpmdipmdipmdipi
MWMarginCredit
MWlueExpectedVaHistoricalPriceAuctionqHoldingCRR
, ,,
,,,,,,
1 1,,,,,,,,,,
))((
))),min(((Re
∑
∑ ∑
=
= =+piM
mpmi
m dpp
D,
1,,
1 1,,,,,,
i, d, p and m apply to CRR, day, TOU and month, respectively
Mip – remaining months in the term of CRR i for TOU period p
Di,m,p – number of days CRR i has in month m and TOU period p
MW l (MW) f CRR i d d i h d TOU i dMWi,d,m,p – volume (MW) of CRR i on day d in month m and TOU period p
– daily credit margin ($/MW‐Day) for CRR i on day d in month m and TOU p
Auction Pricei,d,m,p – daily auction price ($/MW‐Day) of CRR i on day d in month m and TOU period p
HistoricalExpectedValuei,d,m,p – daily historical expected values ($/MW‐Day) of CRR i on day d in month m and TOU , , ,pperiod p
DailypmdiMarginCredit ,,,
Slide 124

CRR Holding Requirements: Calculation ‐ GroupsCRR Holding Requirements: Calculation ‐ Groups
CRR Holding Requirements Groups:– Short Term Auction group = CRRs obtained from annual and monthly Auctions, and SRS
trades.
– Short‐term Allocation group = (1) CRRs obtained from monthly/seasonal allocation process, (2) load migration CRRs for load transfers of CRRs from seasonal allocations (3) CRRs obtained from long‐term allocations which have remaining effective periods less than a year.
– Long‐term Allocation group (LT1) = (1) CRRs obtained from long‐term allocations which have remaining effective periods longer than a year but less than nine years (2) Load migrationremaining effective periods longer than a year but less than nine years. (2) Load migration CRRs created for load transfer of CRRs originated from markets in the LT1 group.
– Long‐term Allocation group (LT2) = (1) CRRs obtained from long‐term allocations which their effective periods have not been started. (2) Load migration CRRs created for load transfer ofeffective periods have not been started. (2) Load migration CRRs created for load transfer of CRRs originated from markets in the LT2 group
– Long‐term Allocation group (LT3) = (1) CRRs obtained from long‐term allocations which their effective periods have not been started and will be started a year later than long‐term allocations in LT2. (2) Load migration CRRs created for load transfer of CRRs originated from markets in the LT3 group.
– Financial group tracks only the selling of annual allocated CRRs, including CRRs from load migration being traded
Slide 125
migration being traded.

CRR Holding Requirements: Calculation EALCRR Holding Requirements: Calculation ‐ EAL
Credit Holding Requirement(EAL) =Credit Holding Requirement(EAL) =max(0,LT1+LT2+LT3+STAllocation)+max(0,STAuction)+max(0,Financial)
Example:Example:
Participant Name LT2 LT3
ST ALLOCATION ST AUCTION
CreditHoldingReq(EAL)= max(0,LT2+LT3+ST alloc)+max(0,
ST auction)
A -500 400 $400
B -14,000 -16,000 -34,000 -600 $0
C 130 -200 -200 100 $230
D -39,000 -40,000 300 300 $600
E 500 400 $900
F -1,000 1,000 -1,000 -2,000 $1,000F 1,000 1,000 1,000 2,000 $1,000
Slide 126

CRR Holding Requirements: Extraordinary g q yCircumstances ‐ Overview
• CRR holding Credit requirements are systematically evaluated
• Under the Tariff, CAISO may request additional collateral if there are concerns to need it
• Extraordinary Circumstances may change the risk• Extraordinary Circumstances may change the risk profile of CRR portfolios
Slide 127

CRR Holding Requirements: Extraordinary g q yCircumstances: Overview
• An exhaustive list of extra‐ordinary events may not be defined a priory
• This methodology is only for instances of extra‐ordinary events that can be characterized asordinary events that can be characterized as transmission outages
• This does not preclude CAISO to request additional collateral when need it under other circumstances not captured within this approach
Slide 128

CRR Holding Requirements: Extraordinary g q yCircumstances ‐ Standard Evaluation
• Credit requirements is calculated for each CRR
MWCMpi pmiM D
HDaily, ,,
∑ ∑( ) Hpi
D
MWCMMWCR
pi
pi pmi
MHi
m d
Hpmdi
DailypmdiM
m
D
d
Hpmdipmdipmdi
Hpi ,,,,min
,
, ,,1 1
,,,,,,
1 1,,,,,,,,,, ∀
×+Ψ−=
∑
∑ ∑∑ ∑ = =
= =
λ
• For each CRR holder
Dm
pmi1
,,∑=
• For each CRR holder
⎞⎛HCRTCV
pi
Hpi
H ∀⎟⎟⎠
⎞⎜⎜⎝
⎛= ∑ ,,0max
,,
Slide 129

CRR Holding Requirements: Extraordinary Circumstances ‐ Re‐Evaluation
• The process is triggered when an event is deemed as extra‐ordinaryThe process is triggered when an event is deemed as extra ordinary and impacts DA
• The most recent monthly auction is taken as a reference, with the outage(s) is modeled
• New auction monthly prices are generatedpmdi ,,,Ψ
• Re‐evaluate CRR holding requirements using new prices for the duration of the event
p
∑ ∑∑ ∑ = =
×+Ω=
pi pmi
pi pmi
M
m
D
d
Hpmdi
DailypmdiM D
HHMWCM
MWCR
, ,,
, ,,1 1
,,,,,,
)min(λ
∑∑ ∑
=
= =
+Ω−=piM
m
Hpmi
m dpmdipmdipmdipi
D
MWCR,
1,,
1 1,,,,,,,,,, ),min(λ
Slide 130

CRR Holding Requirements: Extraordinary Circumstances ‐ Re‐Evaluation
• New auction prices are only used for the time period of the extra ordinary• New auction prices are only used for the time period of the extra‐ ordinary event
⎪⎪⎨⎧ Δ∈Ψ
=Ωdifpmdi
pmdi,,,
• Re‐evaluation is on a portfolio basis
Ch ill b fl t d i t ll CRR tf li
⎪⎩⎨
Δ∉Ψ difpmdipmdi
,,,,,,
• Changes will be reflected into all CRR portfolios
HCRCRTCVi
Hpi
i
Hpi
H ∀= ∑∑ ),,,0max( ,,
• More than one reevaluation may be needed
• CAISO will publish a report with the details of the reevaluation due to an
pipi ,,
extra‐ordinary event
Slide 131

CRR Holding Requirements: Extraordinary g q yCircumstances ‐ Definitions
Hth CRR h ldH = Hth CRR holder
= ith CRR in the holder’s CRR portfolio
= Time of use piH
= Remaining months in the term of i‐th CRR for TOU period p
= Number of days that the i‐th CRR has in month m and TOU period p
= Volume (MW) of the i‐th CRR on day d in month m and TOU period ppmdiMW
pmiD ,,
piM ,
= Volume (MW) of the i th CRR on day d in month m and TOU period p
= Daily credit margin for i‐th CRR on day d in month m and TOU period p
= CRR auction price of the i‐th CRR on day d in month m and TOU period p Ψ
pmdi ,,,λ
DailypmdiCM ,,,
pmdi ,,,
= Historical expected value of the i‐th CRR for TOU p in month m and day d
= Modified CRR auction prices applicable through the extraordinary event
period
pmdi ,,,Ψ
pmdi ,,,Ψp
H
Slide 132

CRR Holding Requirements: Compliance Measuresg q p
Compliance Measures for Failure to Meet CRRCompliance Measures for Failure to Meet CRR Holding Requirements
• Retain financial security sufficient to cover possible d f lt ldefault value
• Terminate all CRR agreements with the defaulting CRR Holder
• Retain all payments related to the CRRs and release the CRRs in subsequent auctions (if feasible)
• Exclude the holder from CRR Allocation or CRR Auction• Exclude the holder from CRR Allocation or CRR Auction until all defaults have been cured
• Require the CRR Holder to post additional Financial Security Amount for future participation
Slide 133

Section 5 – QUESTIONS ?Q
CRR Holding Requirements• OverviewOverview
• Formula for Calculating CRR Holding Requirements
• Extraordinary CircumstancesExtraordinary Circumstances
• Compliance Measures
Slide 134

Section 6 – Secondary Registration SystemSection 6 Secondary Registration System
• Overview
• Credit CheckCredit Check
Slide 135

Secondary Registration System ‐ OverviewSecondary Registration System Overview
• The Secondary Registration System (SRS) is built into the CRR S t t h l f ilit t th t di f CRR th hCRR System to help facilitate the trading of CRRs through a bilateral mechanism
I f i b CRR h i b d• Information about CRRs that an entity wants to buy and sell is made available on a “bulletin board” in SRS
d h h S S d ff d• In order to have access to the SRS and to effect trades both entities must be fully registered
h l b l• The SRS does not settle transactions but merely facilitates the recording of the owner of record
• Financial settlement is done outside of the SRS
Slide 136

Secondary Registration System – Credit Checky g y
• As part of the CRR Holding Requirements the CRR p g qSystem will perform a credit check on both the trading (“selling) and receiving (“buying”) parties in a SRS ( g) g ( y g ) ptrade.
• This credit check will ensure that the receiving partyThis credit check will ensure that the receiving party has sufficient collateral to add the SRS trade to their CRR portfolioCRR portfolio
• This credit check will also ensure that the trading party if the CRR is positively valued has sufficientparty, if the CRR is positively valued, has sufficient collateral to remove the SRS trade from their CRR portfolio
Slide 137
portfolio

S ti 6 QUESTIONS ?Section 6 – QUESTIONS ?
• Overview
• Credit CheckCredit Check
Slide 138

Section 7 – Future CRR EnhancementsSection 7 – Future CRR Enhancements
• CRR Allocation Overview• CRR Allocation Overview
Slide 139

Section 7 – QUESTIONS ?Section 7 – QUESTIONS ?
• Future CRR Enhancements
Slide 140