Conflicting Indicators of Estuarine Health in a Southwest ...€¦ · Presentation to the National...
22
Conflicting Indicators of Estuarine Health in a Southwest Florida Estuary Susceptible to Harmful Algal Blooms Presentation to the National Water Quality Monitoring Council March 28, 2019 Mike Wessel, Jon Perry, Tony Janicki Jay Leverone, and Mark Alderson
Transcript of Conflicting Indicators of Estuarine Health in a Southwest ...€¦ · Presentation to the National...

Conflicting Indicators of Estuarine Health in a Southwest
Florida Estuary Susceptible to Harmful Algal Blooms
Presentation to the National Water Quality Monitoring Council
March 28, 2019
Mike Wessel, Jon Perry, Tony Janicki Jay Leverone, and Mark Alderson
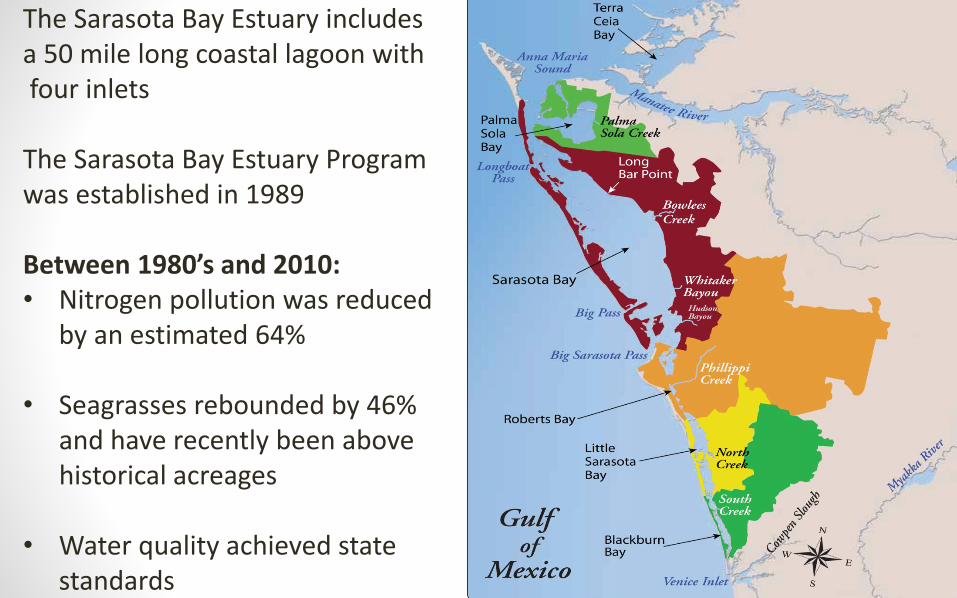
The Sarasota Bay Estuary includes a 50 mile long coastal lagoon withfour inlets
The Sarasota Bay Estuary Program was established in 1989
Between 1980’s and 2010:• Nitrogen pollution was reduced
by an estimated 64%
• Seagrasses rebounded by 46% and have recently been above historical acreages
• Water quality achieved state standards
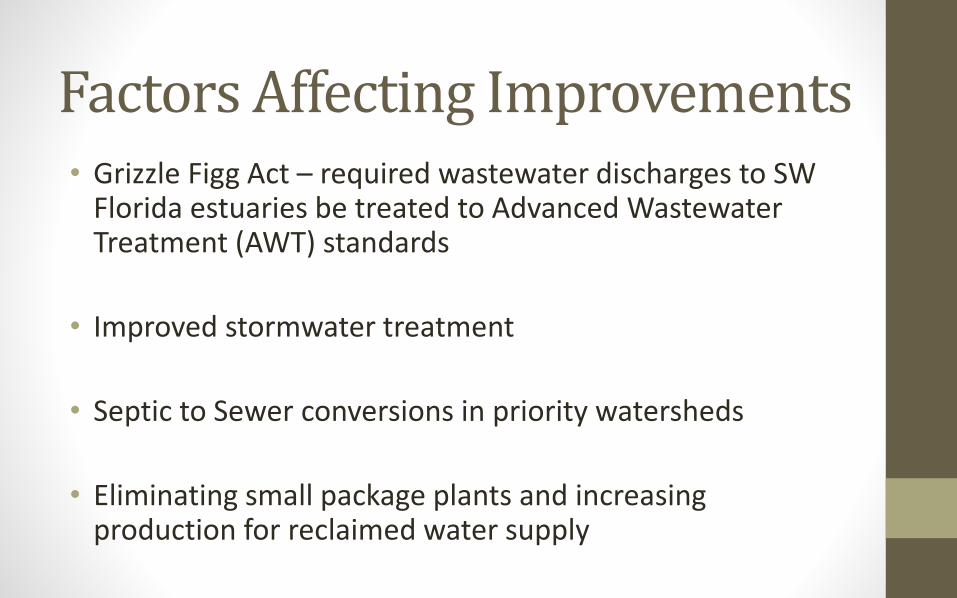
Factors Affecting Improvements• Grizzle Figg Act – required wastewater discharges to SW
Florida estuaries be treated to Advanced Wastewater Treatment (AWT) standards
• Improved stormwater treatment
• Septic to Sewer conversions in priority watersheds
• Eliminating small package plants and increasing production for reclaimed water supply

Increased Volume of Reclaimed Water Production

Increases mostlydue to PSB,SB, and LSB
?
Seagrass – Our Keystone Indicator

However:• Trends in nitrogen concentrations have recently
been increasing throughout the watersheds and estuaries
• Water quality standards for chlorophyll are now being exceeded in most segments
• Coincident episodes of harmful algal blooms have heightened concerns regarding nutrient pollution and its effects on estuarine health

Timeseries Trends in TN2008-20171998-2017
http://www.sarasota.wateratlas.usf.edu

Dra
ft R
esu
lts
“Red Tide”Karenia brevis
Naturally occurring
Historical records back to 1500’s
Blooms initiated offshore
Evidence that intensityAnd duration isincreasing
High P makes areaSusceptible to nitrogen

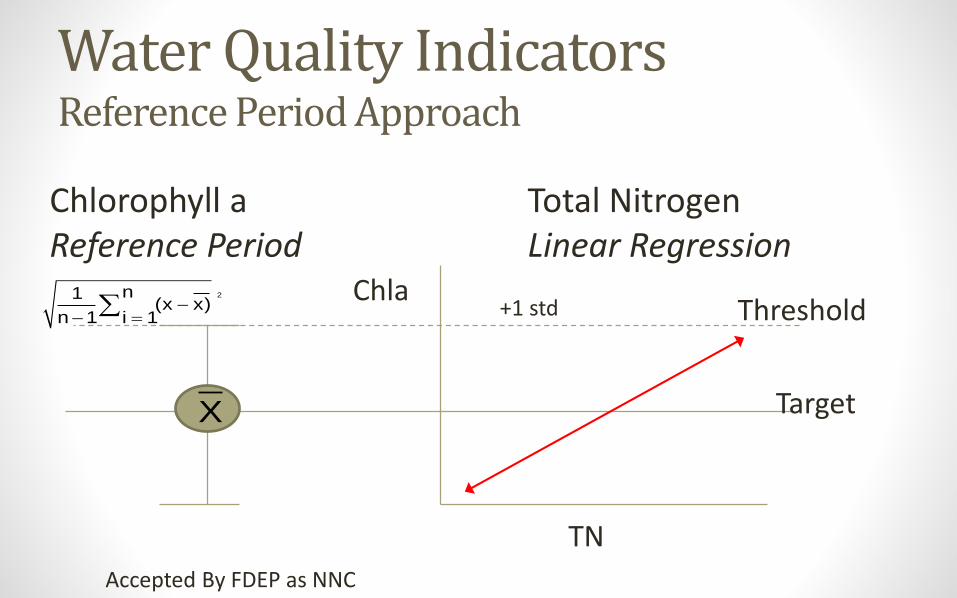
Relevance to Water Quality Standards• Sarasota Bay Estuary Program established targets
and thresholds for chlorophyll and nitrogen
• Based on a reference period when seagrasses (key ecological indicator) were stable
Target
Threshold
Water Quality Indicators Reference Period Approach
X
2n1(x x)
n 1 i 1−
− =
Chla
TN
Chlorophyll aReference Period
Total NitrogenLinear Regression
+1 std
Accepted By FDEP as NNC

ReferencePeriod

ReferencePeriod

Likely Outcome of Next FDEP Assessment
Segment WBID Chlorophyll a TN TP
Sarasota Bay 1968C Impaired Not Impaired Not Impaired
Roberts Bay 1968D Impaired Not Impaired Not Impaired
Little Sarasota Bay 1968E Impaired Not Impaired Not Impaired
Blackburn Bay 1968F Impaired Impaired Not Impaired
FDEP Evaluation Due in 2020

Sarasota Bay2008-2017
Good exchange with Gulf

Robert’s Bay2008-2017
Large creek dischargeLimited exchange with Gulf

Little Sarasota Bay2008-2017
Least exchange with Gulf

Blackburn Bay2008-2017
Mixing of freshwater inputsand exchange with Gulf
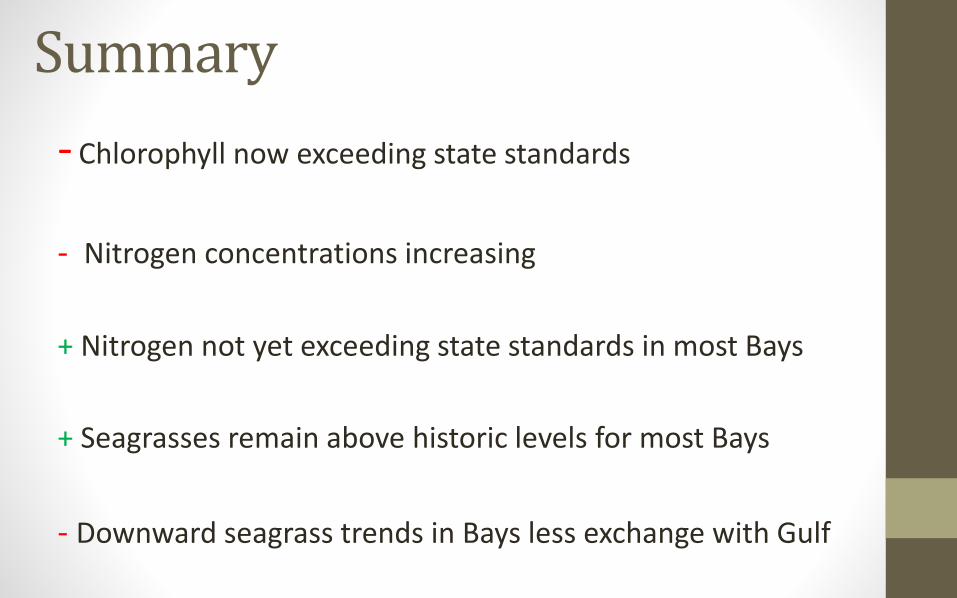
Summary
- Chlorophyll now exceeding state standards
- Nitrogen concentrations increasing
+ Nitrogen not yet exceeding state standards in most Bays
+ Seagrasses remain above historic levels for most Bays
- Downward seagrass trends in Bays less exchange with Gulf

What’s With These TN Trends?• Lots of Ideas
• Laboratory results systematically biased? No
• Rainfall /Atmospheric deposition changing?
• Groundwater concentrations increasing?
• Background conditions increasing?
• Has increased volume of reuse affected nitrogen trends?
• Need for a systematic approach

Proposed Restoration and Protection Strategy (RA Plan)
SBEP serve as honest broker - existing inter-local agreements and WQ consortium and management structure in place
• Reevaluate Water Quality Targets
• Update/Reevaluate Loading Model
• Update Evaluation of Estuarine Responses
• Identify Nutrient Loading Limits
• Identify Nutrient Load Reduction Projects that Achieve Loading Limits
Many of the tools and data sources are in place

Benefits of FDEP Approved RA Plan
• Eligibility for funding and cost sharing
• Stresses proactive efforts to reduce nutrients in the watershed
• Maintains local control - Provides opportunity to demonstrate local efforts and provide local expertise
• Cleaner water faster

Lessons Learned• A lot of benefits of having multiple indicators but it can lead to
confusion / inaction
• Seagrasses may have threshold responses that have not been exceeded in Bays with better exchange
• Power of a strong monitoring program to pick up changes in water quality
• Having targets and thresholds works even if they aren’t perfect