Configuration and calibration of the CE-QUAL- W2 model for ...
47
Configuration and calibration of the CE-QUAL- W2 model for Voëlvlei Dam
Transcript of Configuration and calibration of the CE-QUAL- W2 model for ...

Configuration and calibration of the CE-QUAL-W2 model for Voëlvlei Dam

PRE-FEASIBILITY AND FEASIBILITY STUDIES: i WESTERN CAPE WATER SUPPLY SYSTEM
Calibration of the CE-QUAL-W2 model on Voëlvlei Dam June 2010
TABLE OF CONTENTS
Page No 1. INTRODUCTION ........................................................................................................................ 1
1.1 PURPOSE OF THIS REPORT ...................................................................................... 1 2. A BRIEF OVERVIEW OF THE LIMNOLOGY OF VOËLVLEI DAM ......................................... 2
2.1 INTRODUCTION ........................................................................................................... 2
2.2 WATER LEVELS (1999-2009) ....................................................................................... 4
2.3 PHYSICAL CHARACTERISTICS .................................................................................. 4 2.3.1 Turbidity and Secchi Disk Depth ......................................................................... 4 2.3.2 Suspended Sediment Concentrations ................................................................. 6 2.3.3 Water temperature ............................................................................................... 7
2.4 CHEMICAL CHARACTERISTICS ................................................................................. 8 2.4.1 Salinity ................................................................................................................. 8 2.4.2 Phosphate concentrations ................................................................................... 9 2.4.3 Nitrogen concentrations ..................................................................................... 10
2.5 BIOLOGICAL CHARACTERISTICS ............................................................................ 11 2.5.1 Chlorophyll a ...................................................................................................... 11 2.5.2 Algal species composition ................................................................................. 12
2.6 HYPOTHESIS ABOUT THE CHANGE IN THE WATER QUALITY STATE OF VOELVLEI DAM ................................................................................................................... 12
2.7 COMMENTS ON MONITORING AT VOËLVLEI DAM ................................................ 13 3. MODELLING THE PHYSICAL AND CHEMICAL PROCESSES IN VOËLVLEI DAM ........... 14
3.1 INTRODUCTION TO THE CE-QUAL-W2 RESERVOIR WATER QUALITY MODEL 14
3.2 INTRODUCTION TO CONFIGURATION AND CALIBRATION OF THE MODEL TO VOËLVLEI DAM ................................................................................................ 14
3.3 MODEL CONFIGURATION ......................................................................................... 14
3.4 BATHYMETRY FOR VOËLVLEI DAM ........................................................................ 15
3.5 PREPARATION OF MODEL INPUT DATA (BOUNDARY CONDITIONS) ................. 17 3.5.1 Meteorological time series data ......................................................................... 17 3.5.2 Inflows and outflows .......................................................................................... 18 3.5.3 Inflow water temperature ................................................................................... 18 3.5.4 Inflow water quality ............................................................................................ 19 3.5.5 Light extinction ................................................................................................... 26
3.6 INITIAL CONDITIONS ................................................................................................. 27
3.7 PREPARATION OF MODEL CALIBRATION DATA ................................................... 27
PRE-FEASIBILITY AND FEASIBILITY STUDIES: ii WESTERN CAPE WATER SUPPLY SYSTEM
Calibration of the CE-QUAL-W2 model on Voëlvlei Dam June 2010
3.8 MODEL CALIBRATION (2005-2007) .......................................................................... 28 3.8.1 Water balance.................................................................................................... 28 3.8.2 Water temperature ............................................................................................. 28 3.8.3 Total dissolved solids (TDS) concentrations ..................................................... 29 3.8.4 Dissolved Si concentrations .............................................................................. 30 3.8.5 Phosphate concentrations ................................................................................. 31 3.8.6 Nitrate/nitrite and ammonia concentrations ....................................................... 31 3.8.7 Chlorophyll a concentrations ............................................................................. 33
3.9 MODEL PARAMETERS .............................................................................................. 34 4. MODEL APPLICATION TO ASSESS THE IMPACT OF THE BERG RIVER TRANSFER
OPTIONS .................................................................................................................................. 37
4.1 INTRODUCTION ......................................................................................................... 37
4.2 RESULTS .................................................................................................................... 37 4.2.1 Total dissolved solids (TDS) .............................................................................. 37 4.2.2 Ortho-phosphate (PO4-P) .................................................................................. 38 4.2.3 Nitrate nitrogen (NO3-N) .................................................................................... 38 4.2.4 Chlorophyll a ...................................................................................................... 39
4.3 DISCUSSION ............................................................................................................... 39 5. CONCLUDING REMARKS ...................................................................................................... 40 6. REFERENCES ......................................................................................................................... 41
PRE-FEASIBILITY AND FEASIBILITY STUDIES: iii WESTERN CAPE WATER SUPPLY SYSTEM
Calibration of the CE-QUAL-W2 model on Voëlvlei Dam June 2010
TABLES Table 1: Gauging stations recording inflows and outflows at Voëlvlei Dam ..................................... 18 Table 2: Average constituent concentrations used to characterise the quality of the inflow from
the Twenty-four River/Leeu River canal at G1H067Q01 .................................................. 20 Table 3 Initial constituent values for 1 October 2005 as specified in the vertical profile file. .......... 27 Table 4: List of time series data prepared for model calibration and the data sources. .................. 27 Table 5: Parameters used in model ................................................................................................. 35 FIGURES Figure 1: Schematic representation of Voëlvlei Dam and the water transfers into the dam. ............. 2 Figure 2: Water levels in Voëlvlei Dam (October 1999 - May 2009) .................................................. 4 Figure 3: Time series plot of turbidity measurements in Voëlvlei Dam showing the change in
turbidity state after the drought of 2004/5......................................................................... 5 Figure 4: Time series plot of Secchi Disk measurements in Voëlvlei Dam showing the high water
clarity prior to the drought of 2004/5. ................................................................................ 6 Figure 5: Time series plot of total suspended sediment concentrations in Voëlvlei Dam showing
the lower concentrations before the 2004/5 drought and the elevated concentrations afterwards. ........................................................................................................................ 7
Figure 6: Time series plot of water temperatures recorded in Voëlvlei Dam. .................................... 8 Figure 7: Time series plot of total dissolved solids concentrations in Voëlvlei Dam. ......................... 9 Figure 8: Time series plot of total phosphate and dissolved phosphate concentrations in Voëlvlei
Dam. ................................................................................................................................. 9 Figure 9: Time series plot of nitrate and nitrite nitrogen concentrations in Voëlvlei Dam. ............... 10 Figure 10: Time series plot of ammonia nitrogen concentrations recorded in Voëlvlei Dam. .......... 11 Figure 11: Time series of chlorophyll a concentrations recorded in Voëlvlei Dam by the CMC
and DWA. ....................................................................................................................... 12 Figure 12: Diagram of Voëlvlei Dam showing the conceptual segmentation of the reservoirs and
the location of in- and outflows from the reservoir. ........................................................ 15 Figure 13: Sediment survey cross-section that were used to develop the bathymetry file for
Voelvloe Dam. ................................................................................................................ 16 Figure 14: Diagram showing the original and modified segment orientation used in the current
application of the CE-QUAL-W2 model. ......................................................................... 16 Figure 15: Diagram showing the segmentation of Voëlvlei Dam. The top left diagram shows the
segment orientation, the bottom diagram shows a cross section along the length the dam illustrating the columns and layers in the dam, and the top right diagram shows a cross section across the width of the dam at Segment 10. ......................................... 17
Figure 16: Average daily water temperatures recorded by the DWA on the Berg River at G1H036. ......................................................................................................................... 19
Figure 17: Relationship between average daily water temperature and air temperature at G1H036 (Berg River). ..................................................................................................... 19
Figure 18: Graphs showing the concentration/flow relationship that was fitted to the TDS data at G1H008Q01 and the TDS loads that was calculated using the concentration/flow relationship. .................................................................................................................... 21

PRE-FEASIBILITY AND FEASIBILITY STUDIES: iv WESTERN CAPE WATER SUPPLY SYSTEM
Calibration of the CE-QUAL-W2 model on Voëlvlei Dam June 2010
Figure 19: Graphs showing the concentration/flow relationship that was fitted to the chloride data at G1H008Q01 and the chloride loads that was calculated using the concentration/flow relationship. ...................................................................................... 22
Figure 20: Graphs showing the concentration/flow relationship that was fitted to the ortho-phosphate data at G1H008Q01 and the phosphate loads that was calculated using the concentration/flow relationship. ................................................................................ 23
Figure 21: Graphs showing the concentration/flow relationship that was fitted to the ammonia data at G1H008Q01 and the ammonia loads that was calculated using the concentration/flow relationship. ...................................................................................... 24
Figure 22: Graphs showing the concentration/flow relationship that was fitted to the nitrate/nitrite data at G1H008Q01 and the nitrate/nitrite loads that was calculated using the concentration/flow relationship. ...................................................................................... 25
Figure 23: Graphs showing the concentration/flow relationship that was fitted to the dissolved silica data at G1H008Q01 and the dissolved silica loads that was calculated using the concentration/flow relationship. ................................................................................ 26
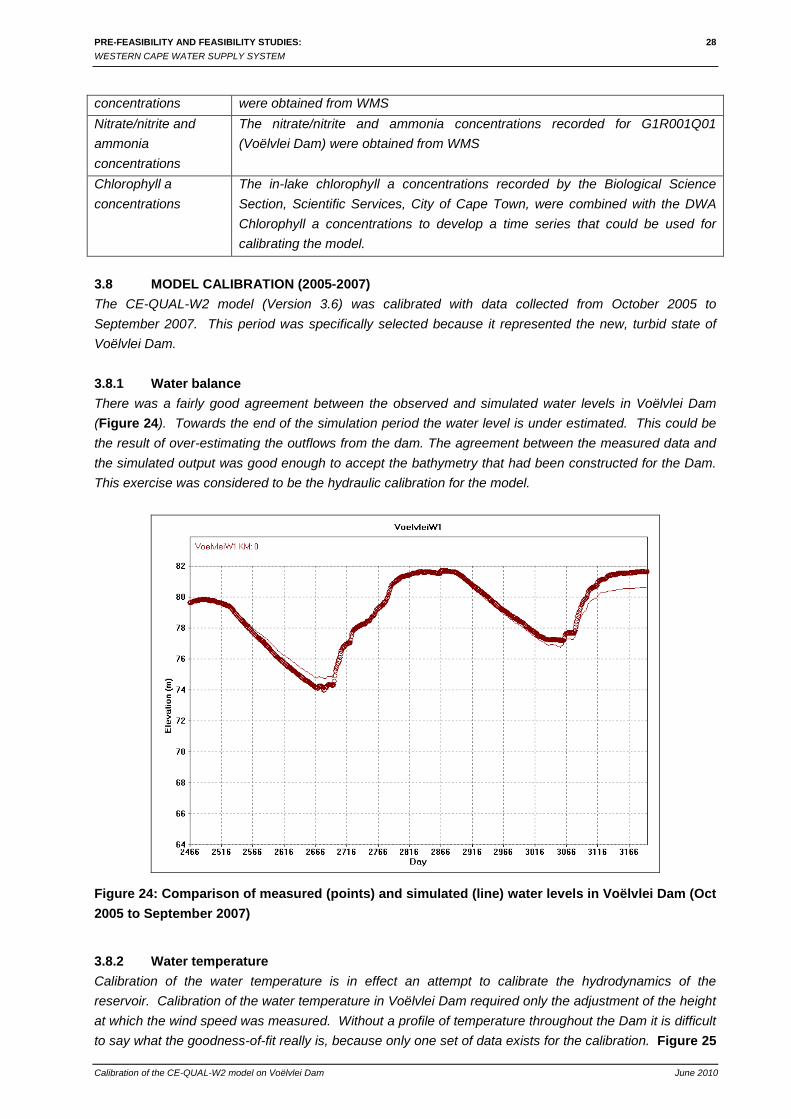
Figure 24: Comparison of measured (points) and simulated (line) water levels in Voëlvlei Dam (Oct 2005 to September 2007) ....................................................................................... 28
Figure 25: Comparison of measured and simulated water temperatures near the dam wall in Voëlvlei Dam (Oct 2005 to September 2007)................................................................. 29
Figure 26: Comparison of measured and simulated TDS concentrations in Voëlvlei Dam near the dam wall (Oct 2005 to September 2007).................................................................. 30
Figure 27: Comparison of measured and simulated dissolved silica concentrations levels in Voëlvlei Dam near the dam wall (Oct 2005 to September 2007) ................................... 30
Figure 28: Comparison of measured and simulated ortho-phosphate concentrations in Voëlvlei Dam near the dam wall (Oct 2005 to September 2007) ................................................. 31
Figure 29: Comparison of measured and simulated nitrate/nitrite nitrogen concentrations in Voëlvlei Dam near the dam wall (Oct 2005 to September 2007) ................................... 32
Figure 30: Comparison of measured and simulated ammonium nitrogen concentrations in Voëlvlei Dam near the dam wall (Oct 2005 to September 2007) ................................... 32
Figure 31: Comparison of measured and simulated Chlorophyll a concentrations in Voëlvlei Dam near the dam wall (Oct 2005 to September 2007) ................................................. 34
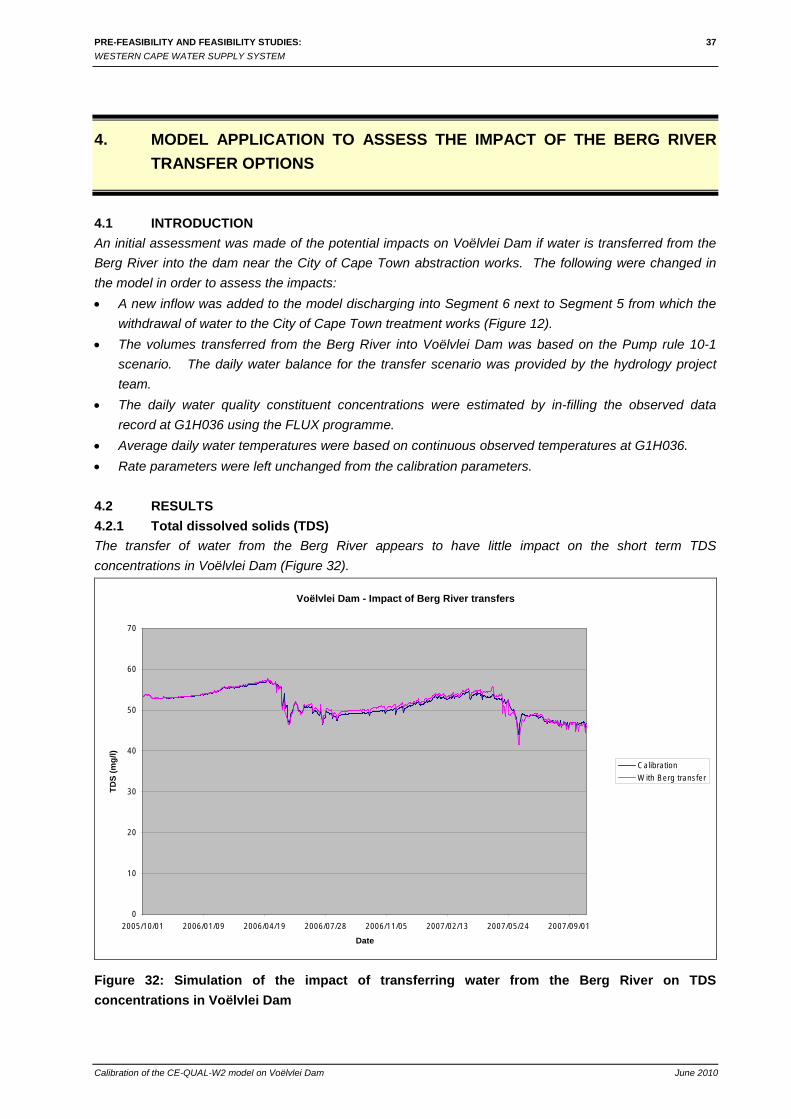
Figure 32: Simulation of the impact of transferring water from the Berg River on TDS concentrations in Voëlvlei Dam ......................................................................................... 37
Figure 33: Simulation of the impact of transferring water from the Berg River on PO4-P concentrations in Voëlvlei Dam ...................................................................................... 38
Figure 34: Simulation of the impact of transferring water from the Berg River on NO3-N concentrations in Voëlvlei Dam ...................................................................................... 38
Figure 35: Simulation of the impact of transferring water from the Berg River on chlorophyll a concentrations in Voëlvlei Dam ...................................................................................... 39
I:\HYDRO\402812 WC Feasibility Studies\R30 1st Phase Voelvlei\WaterQuality\Report\VOELVLEI_WQ_ REPORT_May10 (GE).doc

PRE-FEASIBILITY AND FEASIBILITY STUDIES: v WESTERN CAPE WATER SUPPLY SYSTEM
Calibration of the CE-QUAL-W2 model on Voëlvlei Dam June 2010
ABBREVIATIONS
CaCO3 Calcium Carbonate CCT City of Cape Town Cl Chloride CMC Cape Metropolitan Council DO Dissolved Oxygen HIS Hydrological Information System NCMP National Chemical Monitoring Programme NEMP National Eutrophication Monitoring Programme NO3 Nitrate NO2 Nitrite NH4-N Ammonia-Nitrogen PO4 Phosphate PO4-P Ortho-phosphate Si Silica TDS Total Dissolved Solids WTW Water Treatment Works

PRE-FEASIBILITY AND FEASIBILITY STUDIES: 1 WESTERN CAPE WATER SUPPLY SYSTEM
Calibration of the CE-QUAL-W2 model on Voëlvlei Dam June 2010
1. INTRODUCTION
1.1 PURPOSE OF THIS REPORT The CE-QUAL-W2 dynamic reservoir water quality model was set up for Voëlvlei Dam as part of a project to develop strategies to address nuisance algal growth problems in Voëlvlei Dam (Kamish et al., 2007). As part of the project, two calibration periods were selected. The first extended from 2 September 1996 to 1 September 1997, and the second from 2 September 2000 to 25 January 2001. Version 3.1 of the CE-QUAL-W2 model was available at that stage and it was calibrated and applied to assess the impacts of possible eutrophication management options. When the present study was formulated, severe concerns were expressed about the potential eutrophication impacts of potential options to augment the water supply to Voëlvlei Dam. It was envisaged that the original model setup would be used but with data collected after 2001 because it appeared that the limnological characteristics of the dam started to change in about 2004. As will be demonstrated later in this report, the dam underwent a significant change after the severe drought of 2004-2005 resulting in a change from a stable clear water system to a stable turbid system. This required the project team to calibrate the model for a period after 2005 to reflect its new stable state. Several enhancements have also been made to the CE-QUAL-W2 model and a further objective was to configure and calibrate the latest version of the model (Version 3.6) on the dam. This report describes (1) the configuration and calibration of the latest version of the CE-QUAL-W2 (Version 3.6) for the period October 2005 to September 2007 (2 years), and (2) an initial evaluation of the potential water quality impacts of a number options to augment the water supply in Voëlvlei Dam.

PRE-FEASIBILITY AND FEASIBILITY STUDIES: 2 WESTERN CAPE WATER SUPPLY SYSTEM
Calibration of the CE-QUAL-W2 model on Voëlvlei Dam June 2010
2. A BRIEF OVERVIEW OF THE LIMNOLOGY OF VOËLVLEI DAM
2.1 INTRODUCTION The Voëlvlei Dam was the first large water supply scheme to be developed in the Berg River. The first Voëlvlei scheme was completed in 1953 when the natural Vogelvlei lake was impounded by building a small wall structure. The natural vlei had a very small catchment of only 40 km2 and additional water was therefore diverted from the Klein Berg River, where a small weir was built, into a canal to the Dam. In 1971, the Dam was raised to its present full supply capacity of 172 million m3 (DWAF, 1994). The Dam is currently supplied by diverted runoff from the Klein Berg River, Twenty-four Rivers and Leeu River catchments, through a system of canals (Figure 1).
Figure 1: Schematic representation of Voëlvlei Dam and the water transfers into the dam.
The Dam supplies water to the Cape Town metropolitan area, to towns in the Swartland, and some irrigation water for downstream users. The water for the Swartland Scheme supplies Riebeekkasteel, Riebeek Wes and Malmesbury, while the Voëlvlei Water Treatment Works (WTW) supplies the City of Cape Town (DWAF, 1992). The irrigation water is released into the Berg River along with water for the Withoogte Scheme which is then abstracted from Misverstand Weir further downstream (DWAF, 1994). In the report, “Development of Strategies to Address Nuisance Algal Growth Problems in Voëlvlei Dam” (DWAF, 2007), the differences in nutrient characteristics of deep and shallow reservoirs were introduced and discussed in detail. It was stated that shallow lakes or reservoirs generally exist in either of two stable states (Hosper, 1998, Moss, 1998, 2003):
• Clear water state dominated by rooted water plants – In shallow lakes or reservoirs water is mixed throughout the water column and nutrients are easily mobilised from the sediments. This is referred to as internal loading. If sufficient macrophytes and submerged water plants are present, sediment re-suspension by wind action or by bottom-feeding fish (benthivores) is limited.

PRE-FEASIBILITY AND FEASIBILITY STUDIES: 3 WESTERN CAPE WATER SUPPLY SYSTEM
Calibration of the CE-QUAL-W2 model on Voëlvlei Dam June 2010
Water plants support an abundant number of piscivores (predator fish species) which in turn control the bottom and algal feeding fish. Zooplankton thrives by keeping the suspended algae low. Water is generally clear and plant and animal diversity is high.
• Turbid state dominated by free floating algae - If enough nutrients or suspended sediment enter a shallow lake, suspended algae or turbidity may increase to a point where the lack of light in the deeper water could eliminate submerged water plants. Under these conditions, piscivores would be limited leaving planktivores (algae and zooplankton feeding fish) and benthivores (bottom feeding fish) to thrive resulting in a mechanism that reinforces high turbidity by high algal growth and by stirring of the sediment. Internal loadings become high and coarse fish (e.g. carp, barbel) and waterfowl lured by the open landscape surrounding a shallow lake, add to the problem. In the absence of rooted water plants, shoreline erosion and erosion of the reservoir bottom by wind or boat action, helps to maintain the turbid state and high internal loadings. This is especially the case for Voëlvlei Dam that has a large exposed water surface, little protection from the wind, and is situated in an area where high winds occur during the summer months.
A change from a plant-dominated system to an algal-dominated system requires a switch such as the removal of water plants or the introduction of highly turbid inflow. The switch works better if it coincides with an increase in nutrient enrichment. The switch back to a clear water plant-dominated system is usually accomplished through bio-manipulation and works well if it coincides with a reduction in nutrient concentrations. There are also buffer mechanisms that maintain the stable state (Hosper, 1998). For example, a stable turbid state is often maintained by wind-induced re-suspension of sediment in plant-free lakes or reservoirs and by fish induced re-suspension of sediments by bottom feeding fish (benthivores), unhindered by plants. A forward switch to a clear-water stable state can be maintaining a deeper depth to reduce wind exposure of sediments or complete drawdown and drying of sediments or a reduction of bottom feeding fish. Hosper (1998) lists in greater detail the stable states, the buffer mechanisms and switches between the two states. It will be demonstrates in this chapter that the low water levels that occurred in Voëlvlei Dam during the drought of 2004/2005 triggered a switch from a stable clear water state, to a stable turbid state. The physical and chemical characteristics of Voëlvlei Dam for the period October 1999 to September 2007 is reviewed briefly in this chapter. Water level data and water quality data were supplied by the DWA’s Directorates of Hydrology and of Resource Quality Services, and City of Cape Town’s Scientific Services. The DWA collects water samples on about a two weekly frequency from the Swartland abstraction tower for the National Chemical Monitoring Programme (NCMP) and for the National Eutrophication Monitoring Programme (NEMP). The Biological Section of the Scientific Services at the City of Cape Town collected in-lake data at six monitoring points on Voëlvlei Dam up to the first quarter of 2006 when the programme was reduced to a single monitoring point, and the Voëlvlei WTW collects a weekly integrated water sample of their raw water intake which is analysed at the water laboratory of Scientific Services. The objective of this chapter is to briefly introduce the long-term limnological trends in the dam rather than serve as a rigorous assessment of water quality patterns and individual events. The focus is on the state of the dam prior to, and after the drought of 2004/2005.

PRE-FEASIBILITY AND FEASIBILITY STUDIES: 4 WESTERN CAPE WATER SUPPLY SYSTEM
Calibration of the CE-QUAL-W2 model on Voëlvlei Dam June 2010
2.2 WATER LEVELS (1999-2009) The water levels in Voëlvlei Dam (Figure 2) shows an annual pattern of filling during the winter months and draw down during the summer months. It shows the declining water levels as a result of below average rainfalls in 2003 and 2004 resulting in dam being drawn down to below 20% of its full supply capacity in the summer of 2004/5. Good rainfall since then filled the dam to 100% full over a two year period and since then it’s only been drawn down to about 60% of its full supply volume.
Voëlvlei Dam Water Levels
68
70
72
74
76
78
80
82
1999/10/01 2001/02/12 2002/06/27 2003/11/09 2005/03/23 2006/08/05 2007/12/18 2009/05/01Date
Wat
er le
vel (
m) (
amsl
)
0.0%
20.0%
40.0%
60.0%
80.0%
100.0%
120.0%
Perc
enta
ge o
f Ful
l Sup
ply
Volu
me
Figure 2: Water levels in Voëlvlei Dam (October 1999 - May 2009)
2.3 PHYSICAL CHARACTERISTICS 2.3.1 Turbidity and Secchi Disk Depth A time series plot of turbidity at the raw water intake to the Voëlvlei WTW (Figure 3) shows a general increase in turbidity as the dam is drawn down during the summer months and decrease in turbidity during the winter filling phase. Note the increase in turbidity during the draw down in 2003/4 and especially in 2004/5 summer period. The very low water levels in the summer of 2004/5 resulted in a sharp increase in turbidity. Since then, the turbidity in the dam has remained high and the minimum turbidity has not returned to pre-2004 conditions. It appears that the dam switched from a stable clear water system to a stable turbid system. Refer to Section 2.6 for a possible explanation for this switch in state.

PRE-FEASIBILITY AND FEASIBILITY STUDIES: 5 WESTERN CAPE WATER SUPPLY SYSTEM
Calibration of the CE-QUAL-W2 model on Voëlvlei Dam June 2010
Voelvlei WTW Raw Water Intake
0
20
40
60
80
100
120
140
160
180
200
99/10/05 00/07/31 01/05/27 02/03/23 03/01/17 03/11/13 04/09/08 05/07/05 06/05/01 07/02/25 07/12/22 08/10/17 09/08/13Date
Turb
idity
(NTU
)
Figure 3: Time series plot of turbidity measurements in Voëlvlei Dam showing the change in turbidity state after the drought of 2004/5.
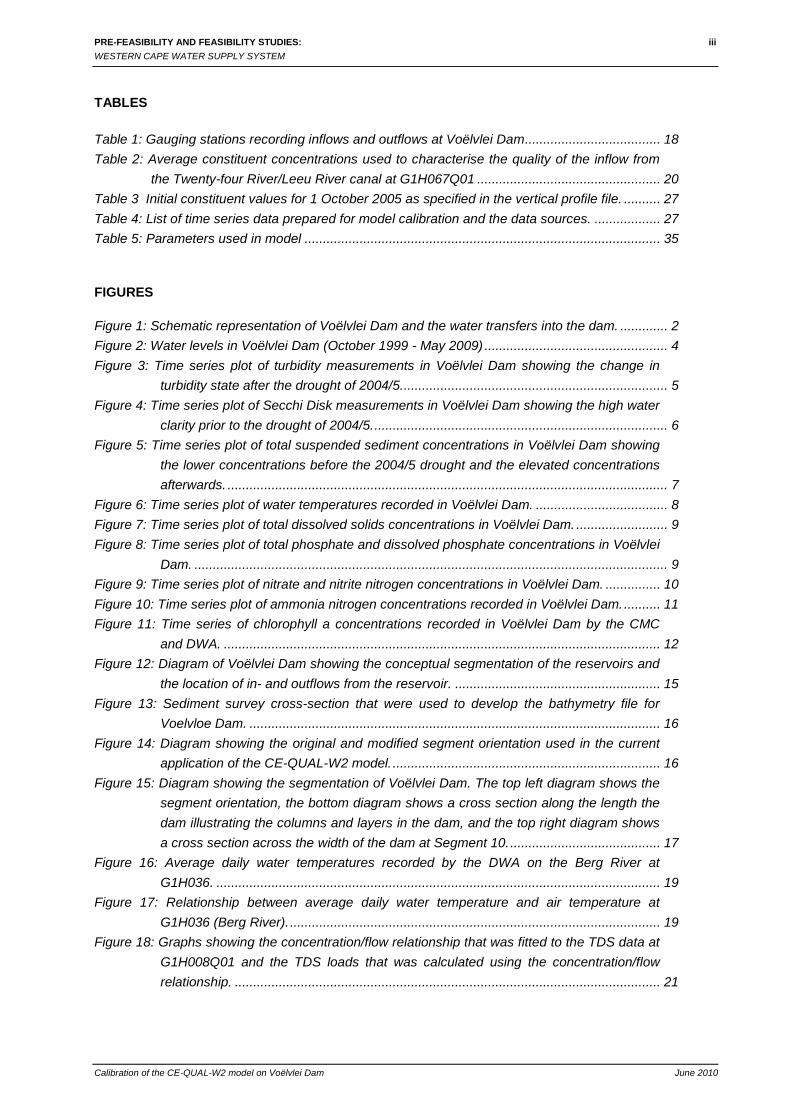
Water clarity is measured with a Secchi Disk that is lowered into the water until it disappears from sight. That depth is then recorded. The bigger the Secchi disk depth, the clearer the water. The Biological Sciences Section of the CMC measured the Secchi Disk depth at six points in the dam until about mid-2006 when a decision was made to stop sampling from a boat at Voëlvlei Dam. The Secchi Disk depth measurements is a mirror image of the turbidity patterns in the dam with the water being very clear during the summer of 2002/3 and gradually decreasing to very low (about 10 cm) at the end of summer 2005 (Figure 4). There was a slight improvement during the winter of 2005 but in the summer of 2005/6 it decreased again. The in-lake monitoring programme was terminated in the first quarter of 2006 after which sampling was only done from the abstraction tower.
PRE-FEASIBILITY AND FEASIBILITY STUDIES: 6 WESTERN CAPE WATER SUPPLY SYSTEM
Calibration of the CE-QUAL-W2 model on Voëlvlei Dam June 2010
Voëlvlei Dam Secchi Disk Depth
0
20
40
60
80
100
120
140
160
180
200
2001/01/09 2001/11/05 2002/09/01 2003/06/28 2004/04/23 2005/02/17 2005/12/14 2006/10/10 2007/08/06 2008/06/01 2009/03/28Date
Secc
hi D
isk
Dep
th (c
m)
Figure 4: Time series plot of Secchi Disk measurements in Voëlvlei Dam showing the high water clarity prior to the drought of 2004/5.
2.3.2 Suspended Sediment Concentrations The peaks and valleys in the observed total suspended sediment concentrations (Figure 5) appears to mirror those observed in the turbidity measurements (Figure 3).

PRE-FEASIBILITY AND FEASIBILITY STUDIES: 7 WESTERN CAPE WATER SUPPLY SYSTEM
Calibration of the CE-QUAL-W2 model on Voëlvlei Dam June 2010
Voëlvlei Dam Total Suspended Sediments
0
10
20
30
40
50
60
70
80
90
100
2001/01/09 2001/11/05 2002/09/01 2003/06/28 2004/04/23 2005/02/17 2005/12/14 2006/10/10 2007/08/06 2008/06/01 2009/03/28Date
Tota
l Sus
pend
ed S
edim
ents
(mg/
l)
Figure 5: Time series plot of total suspended sediment concentrations in Voëlvlei Dam showing the lower concentrations before the 2004/5 drought and the elevated concentrations afterwards.
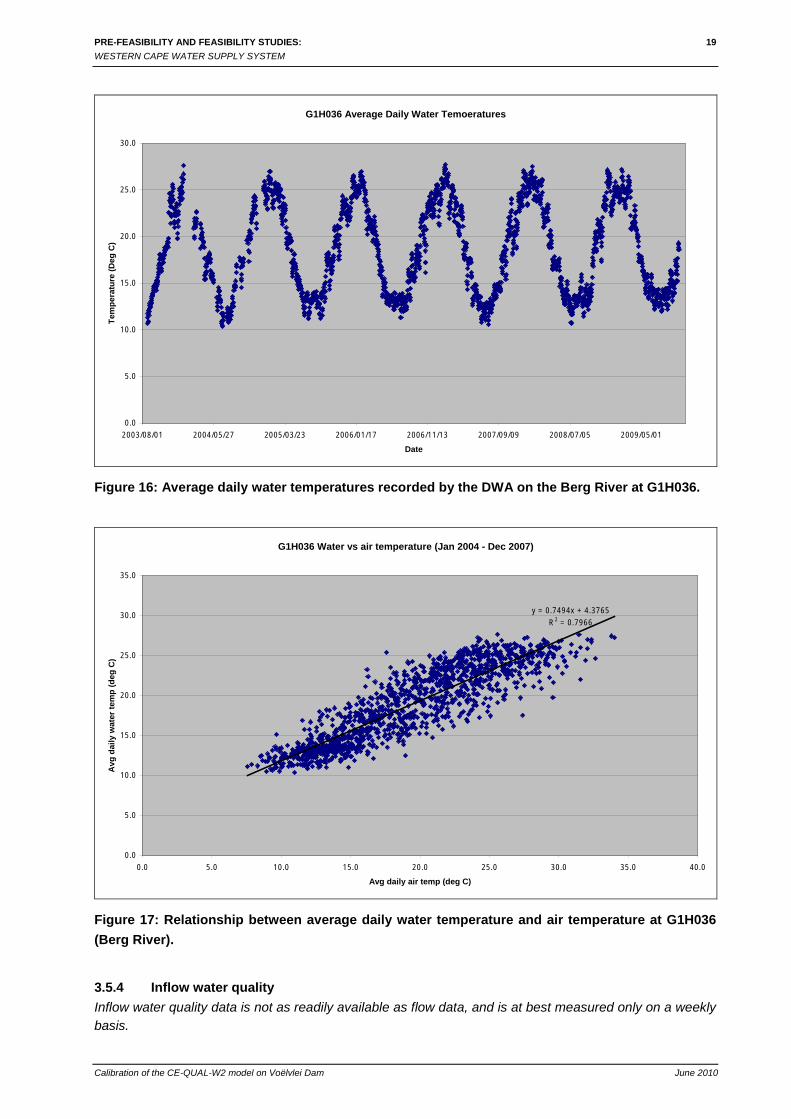
2.3.3 Water temperature Water temperatures in Voëlvlei Dam shows a typical annual cycle of warming and cooling with temperatures in the summer peaking at around 27-28 °C and dropping to a low of 11-13 °C at the end of winter. The summer maximum and winter minimum values are slightly warmer (by 1-2 °C) than the maximum temperatures recorded in the Berg River at G1H036 (Figure 16).

PRE-FEASIBILITY AND FEASIBILITY STUDIES: 8 WESTERN CAPE WATER SUPPLY SYSTEM
Calibration of the CE-QUAL-W2 model on Voëlvlei Dam June 2010
Voëlvlei Dam Water Temperature
0
5
10
15
20
25
30
35
2001/01/09 2001/11/05 2002/09/01 2003/06/28 2004/04/23 2005/02/17 2005/12/14 2006/10/10 2007/08/06 2008/06/01 2009/03/28Date
Wat
er te
mpe
ratu
re (°
C)
Figure 6: Time series plot of water temperatures recorded in Voëlvlei Dam.
2.4 CHEMICAL CHARACTERISTICS 2.4.1 Salinity Salinity in Voëlvlei dam remained more or less constant over the study period and varied between 40 and about 60 mg/l (Figure 7). It is not clear if there was an annual pattern present in the data. Some elevated salinities were recorded during 1999/2000. After that the TDS concentrations in the dam remained about constant with no clear increasing or decreasing long-term trend.

PRE-FEASIBILITY AND FEASIBILITY STUDIES: 9 WESTERN CAPE WATER SUPPLY SYSTEM
Calibration of the CE-QUAL-W2 model on Voëlvlei Dam June 2010
Voëlvlei Dam TDS
0
20
40
60
80
100
120
140
1999/10/07 2000/08/02 2001/05/29 2002/03/25 2003/01/19 2003/11/15 2004/09/10 2005/07/07 2006/05/03 2007/02/27 2007/12/24Date
TDS
(mg/
l)
Figure 7: Time series plot of total dissolved solids concentrations in Voëlvlei Dam.
2.4.2 Phosphate concentrations There is no clear seasonal or long term pattern in the in-dam dissolved or total phosphate concentrations (Figure 8).
Voëlvlei Dam Ortho-phosphate
0
0.05
0.1
0.15
0.2
0.25
0.3
1999/10/07 2000/08/02 2001/05/29 2002/03/25 2003/01/19 2003/11/15 2004/09/10 2005/07/07 2006/05/03 2007/02/27 2007/12/24Date
PO4-
P or
Tot
-P (m
g/l)
P O 4-PT ota l P
Figure 8: Time series plot of total phosphate and dissolved phosphate concentrations in Voëlvlei Dam.
PRE-FEASIBILITY AND FEASIBILITY STUDIES: 10 WESTERN CAPE WATER SUPPLY SYSTEM
Calibration of the CE-QUAL-W2 model on Voëlvlei Dam June 2010
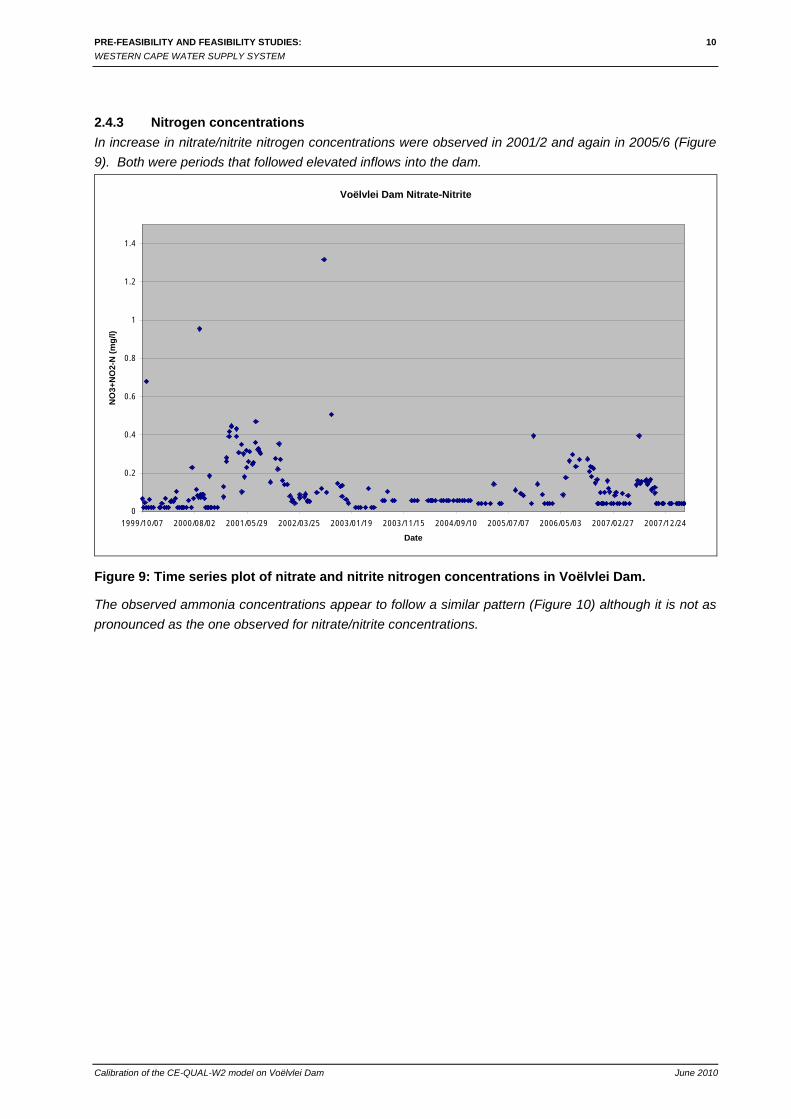
2.4.3 Nitrogen concentrations In increase in nitrate/nitrite nitrogen concentrations were observed in 2001/2 and again in 2005/6 (Figure 9). Both were periods that followed elevated inflows into the dam.
Voëlvlei Dam Nitrate-Nitrite
0
0.2
0.4
0 .6
0 .8
1
1.2
1.4
1999/10/07 2000/08/02 2001/05/29 2002/03/25 2003/01/19 2003/11/15 2004/09/10 2005/07/07 2006/05/03 2007/02/27 2007/12/24Date
NO
3+N
O2-
N (m
g/l)
Figure 9: Time series plot of nitrate and nitrite nitrogen concentrations in Voëlvlei Dam.
The observed ammonia concentrations appear to follow a similar pattern (Figure 10) although it is not as pronounced as the one observed for nitrate/nitrite concentrations.

PRE-FEASIBILITY AND FEASIBILITY STUDIES: 11 WESTERN CAPE WATER SUPPLY SYSTEM
Calibration of the CE-QUAL-W2 model on Voëlvlei Dam June 2010
Voëlvlei Dam Ammonia
0
0.05
0.1
0.15
0.2
0.25
0.3
0.35
0.4
0.45
0.5
1999/10/07 2000/08/02 2001/05/29 2002/03/25 2003/01/19 2003/11/15 2004/09/10 2005/07/07 2006/05/03 2007/02/27 2007/12/24Date
NH
4-N
(mg/
l)
Figure 10: Time series plot of ammonia nitrogen concentrations recorded in Voëlvlei Dam.
2.5 BIOLOGICAL CHARACTERISTICS 2.5.1 Chlorophyll a The chlorophyll a monitoring results of the CMC (diamond) and DWA (squares) were plotted in the same graph. Chlorophyll a concentrations from 2001 to the first quarter of 2004 was low. From about April 2004 elevated chlorophyll a concentrations were observed, indicating the presence of algal blooms. The blooms in 2004/5 corresponded with the period of low water levels in Voëlvlei Dam and increasing phosphate concentrations due to the high inflows that followed the drought. Since then elevated chlorophyll a concentrations have consistently been observed.

PRE-FEASIBILITY AND FEASIBILITY STUDIES: 12 WESTERN CAPE WATER SUPPLY SYSTEM
Calibration of the CE-QUAL-W2 model on Voëlvlei Dam June 2010
Voëlvlei Dam Chlorophyll a
0
0.05
0.1
0.15
0.2
0.25
0.3
0.35
0.4
0.45
0.5
2001/01/09 2001/11/05 2002/09/01 2003/06/28 2004/04/23 2005/02/17 2005/12/14 2006/10/10 2007/08/06 2008/06/01 2009/03/28Date
Chl
orop
hyll
a (m
g/l)
C M C dataD W A data
Figure 11: Time series of chlorophyll a concentrations recorded in Voëlvlei Dam by the CMC and DWA.
2.5.2 Algal species composition The DWA records algal species composition. In 2000 the algal species sampling frequency was about monthly, in 2001 only two samples were collected, a few samples were collected in 2002 an 2003, none in 2004 and some in May 2005. However, since November 2005 weekly samples were collected for algal species identification. An examination of the algal species composition indicates that blue-green algae (Microsystis and Anabaena) and diatoms (Melosira and Navicula) appeared to dominate since 2005. 2.6 HYPOTHESIS ABOUT THE CHANGE IN THE WATER QUALITY STATE OF VOELVLEI DAM It appears that the low water levels during the drought of 2004/2005 and high wind mixing and re-suspension of bottom sediments resulted in a substantial increased in turbidity in the dam. The increase in turbidity created an unfavourable underwater light climate for rooted water plants and their numbers started to decrease. The turbid conditions also created unfavourable conditions for predatory bass fish in the dam because they depend on sight to see their pray. This lead to an increase in the number of bottom feeding fish such as carp and barbel. Bottom feeders churn up the bottom sediment when the forage. Wind mixing during the summer months is sufficient to transport the re-suspended sediment back into the water column and to reduce the rate at which sediments settle out. Re-suspended sediment also provides a mechanism to return nutrients that have settled out back into the water column. In the surface layers of the dam phytoplankton rather than rooted water plants now utilise the nutrients leading to elevated algal concentrations in the surface waters. A return to water levels that were common prior to the 2004/5 drought has not resulted in a return to turbidity levels that were experienced prior to the drought. The major change that took place after the drought was the shirt in fish species to bottom feeders and the reduction in rooted water plants.

PRE-FEASIBILITY AND FEASIBILITY STUDIES: 13 WESTERN CAPE WATER SUPPLY SYSTEM
Calibration of the CE-QUAL-W2 model on Voëlvlei Dam June 2010
2.7 COMMENTS ON MONITORING AT VOËLVLEI DAM The water quality monitoring done by the DWA and CMC complement each other and provides valuable information about the changing water quality status of the dam. Both organisations are encouraged to continue their monitoring especially in the light of concerns about water quality impacts of different augmentation options. Water temperature is one of the key factors controlling algal growth but it is not monitored or recorded in the dam in a systematic manner. It is recommended that consideration be given to establishing a water temperature monitoring system at the dam. It is further recommended that the Department of Agriculture be requested to maintain their weather monitoring station at De Tuin near Gouda but that a solar radiation probe be added to record solar radiation along with the other variables such as wind speed and direction.

PRE-FEASIBILITY AND FEASIBILITY STUDIES: 14 WESTERN CAPE WATER SUPPLY SYSTEM
Calibration of the CE-QUAL-W2 model on Voëlvlei Dam June 2010
3. MODELLING THE PHYSICAL AND CHEMICAL PROCESSES IN VOËLVLEI DAM
3.1 INTRODUCTION TO THE CE-QUAL-W2 RESERVOIR WATER QUALITY MODEL CE-QUAL-W2 is a water quality and hydrodynamic model in 2D (longitudinal-vertical) for rivers, estuaries, lakes, reservoirs and river basin systems. W2 models basic eutrophication processes such as temperature-nutrient-algae-dissolved oxygen-organic matter and sediment relationships. The current model release is Version 3.6 which is capable of simulating longitudinal-vertical hydrodynamics and water quality in stratified and non-stratified systems, multiple algae, epiphyton/periphyton, zooplankton, macrophyte, CBOD, and generic water quality groups, internal dynamic pipe/culvert model, hydraulic structures (weirs, spillways) algorithms including for submerged and 2-way flow over submerged hydraulic structures, dynamic shading algorithm based on topographic and vegetative cover. 3.2 INTRODUCTION TO CONFIGURATION AND CALIBRATION OF THE MODEL TO VOËLVLEI
DAM Voëlvlei Dam is subject to the occurrence of algal blooms on account of the high nutrient loads from external as well as internal sources. The situation might be aggravated by diversions from Michell’s Pass via the Klein Berg River and by pumping from the Berg River. It was therefore proposed that the available water quality data together with information on the existing Klein Berg Diversion and potential abstractions from the Berg River will be used to assess the present and future nutrient impacts into Voëlvlei Dam. It was decided to use the CE-QUAL-W2 model that was previously configured and calibrated on Voëlvlei Dam to assess the impacts of these nutrients on the reservoir and particularly the likely development of algae. This information can then be utilised to assess whether it would be necessary to modify the wastewater treatment processes (e.g. such as providing dissolved air flotation) and/or to provide activated carbon dosing at the Voëlvlei and Swartland Water Treatment Works. However, during the updating of the model with more recent data, it became apparent that previous calibration of the model with data from 1998 to 2003, would be unsuitable for future predictions due to the changed water quality status of the dam (refer to the discussions in Section 2). It was therefore decided to calibrate the mode with data collected after 2005 in order to better reflect the current status of the dam. This is described in this section of the report. 3.3 MODEL CONFIGURATION In the CE-QUAL-W2 model Voëlvlei Dam was conceptualised as an almost rectangular reservoir oriented in a north-north-westerly direction. The reservoir was sub-divided into fourteen segments, each about 500m in length (Figure 12) (the model counts Segment 1 as the upstream boundary). The conventional inflow at the headwaters outflow at the dam wall was set to zero. The withdrawals to the Voëlvlei and Swartland water treatment works were located at segments 5 and 14 (Figure 12) and the canal inflows from the Klein Berg River and the Twenty-Four Rivers and Leeu River were located at Segment 15 (Figure 12). The releases from the dam to the Berg River were also located at Segment 14.

PRE-FEASIBILITY AND FEASIBILITY STUDIES: 15 WESTERN CAPE WATER SUPPLY SYSTEM
Calibration of the CE-QUAL-W2 model on Voëlvlei Dam June 2010
2
43
56
98
7
1110
15141312
W ithdraw a l: V oë lve i W TW
W ithdraw a l: S w artland W TW
Inflow : Tw enty-four-rive rs & Leeu R iver d ivers ion
Inflow : K le in B erg d ivers ion
D ow nstream outflow (se t to zero)
U pstream in flow (se t to zero)
Figure 12: Diagram of Voëlvlei Dam showing the conceptual segmentation of the reservoirs and the location of in- and outflows from the reservoir.
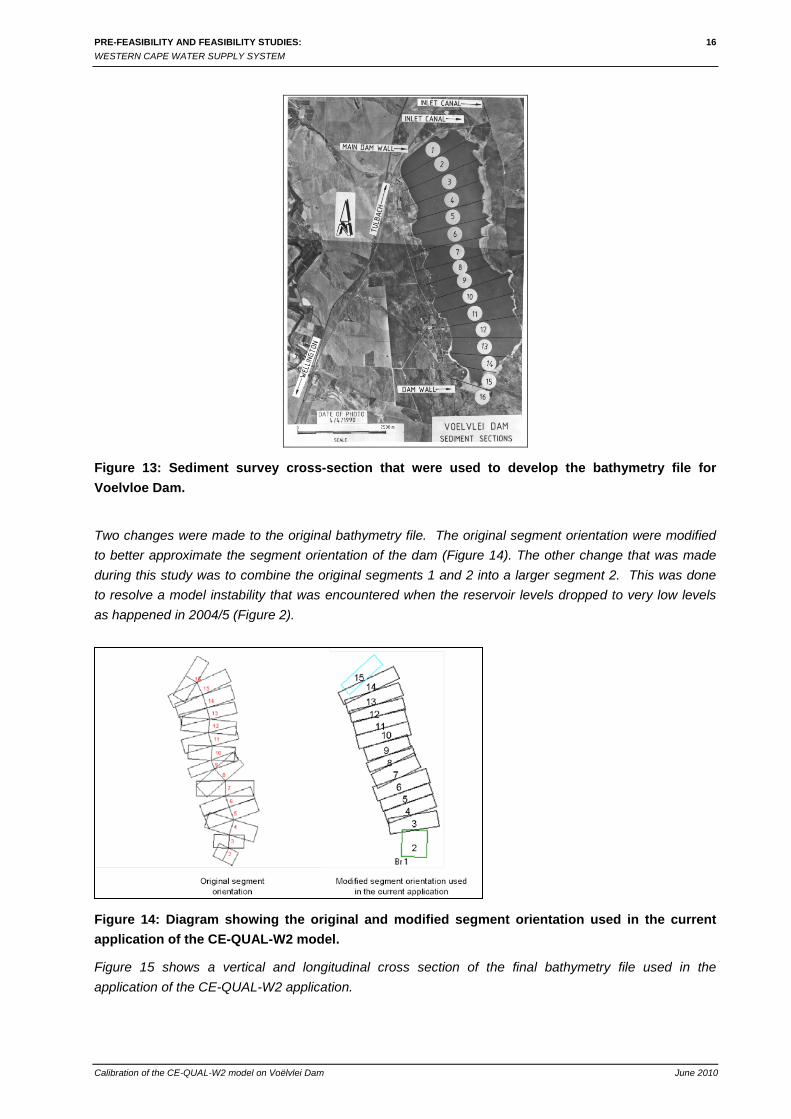
The conceptualisation of the reservoir for the model is described in more detail in Kamish et al. (2007). 3.4 BATHYMETRY FOR VOËLVLEI DAM The development of the bathymetry for Voëlvlei Dam is described in detail in Kamish et al. (2007). Data for construction of the bathymetry file was obtained from the DWA in the form of a sedimentation survey conducted in 1998 (Figure 13). Sixteen cross-sections, approximately 500 m apart were surveyed. Each segment was then divided into a number of layers, 1 m in thickness, extending from above the full supply level (FSL) to the bottom of the Dam.
PRE-FEASIBILITY AND FEASIBILITY STUDIES: 16 WESTERN CAPE WATER SUPPLY SYSTEM
Calibration of the CE-QUAL-W2 model on Voëlvlei Dam June 2010
Figure 13: Sediment survey cross-section that were used to develop the bathymetry file for Voelvloe Dam.
Two changes were made to the original bathymetry file. The original segment orientation were modified to better approximate the segment orientation of the dam (Figure 14). The other change that was made during this study was to combine the original segments 1 and 2 into a larger segment 2. This was done to resolve a model instability that was encountered when the reservoir levels dropped to very low levels as happened in 2004/5 (Figure 2).
Figure 14: Diagram showing the original and modified segment orientation used in the current application of the CE-QUAL-W2 model.
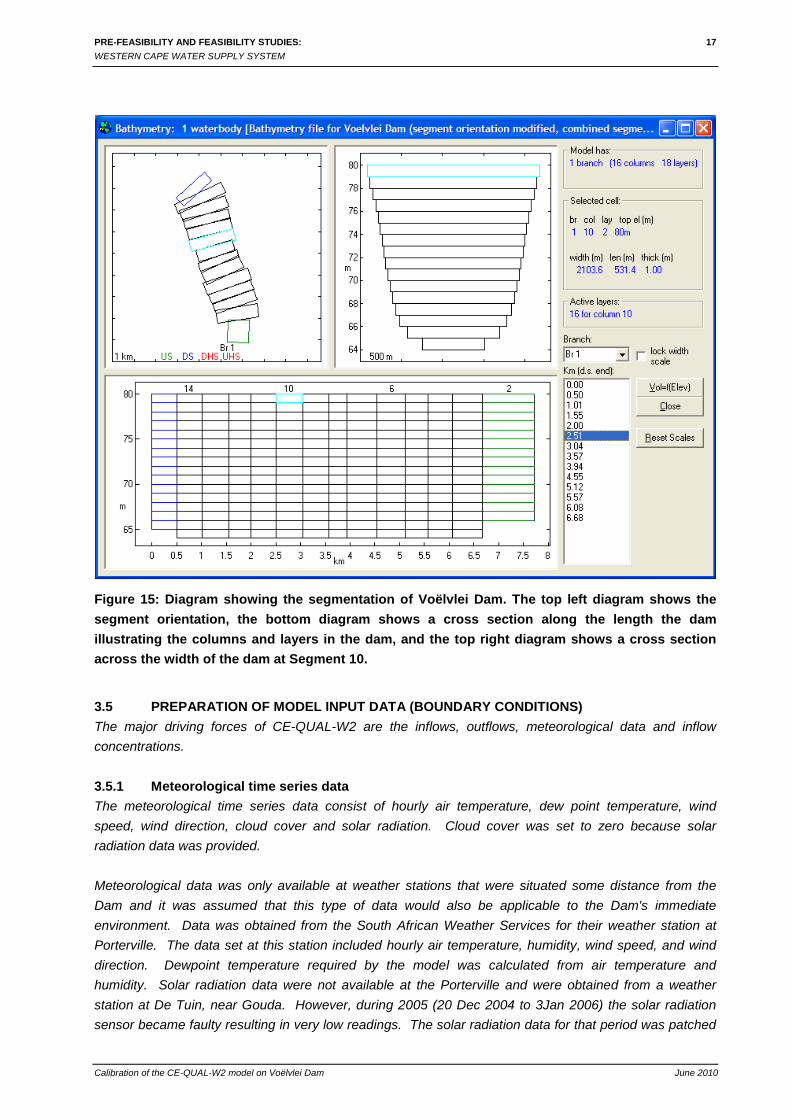
Figure 15 shows a vertical and longitudinal cross section of the final bathymetry file used in the application of the CE-QUAL-W2 application.
PRE-FEASIBILITY AND FEASIBILITY STUDIES: 17 WESTERN CAPE WATER SUPPLY SYSTEM
Calibration of the CE-QUAL-W2 model on Voëlvlei Dam June 2010
Figure 15: Diagram showing the segmentation of Voëlvlei Dam. The top left diagram shows the segment orientation, the bottom diagram shows a cross section along the length the dam illustrating the columns and layers in the dam, and the top right diagram shows a cross section across the width of the dam at Segment 10.
3.5 PREPARATION OF MODEL INPUT DATA (BOUNDARY CONDITIONS) The major driving forces of CE-QUAL-W2 are the inflows, outflows, meteorological data and inflow concentrations. 3.5.1 Meteorological time series data The meteorological time series data consist of hourly air temperature, dew point temperature, wind speed, wind direction, cloud cover and solar radiation. Cloud cover was set to zero because solar radiation data was provided. Meteorological data was only available at weather stations that were situated some distance from the Dam and it was assumed that this type of data would also be applicable to the Dam's immediate environment. Data was obtained from the South African Weather Services for their weather station at Porterville. The data set at this station included hourly air temperature, humidity, wind speed, and wind direction. Dewpoint temperature required by the model was calculated from air temperature and humidity. Solar radiation data were not available at the Porterville and were obtained from a weather station at De Tuin, near Gouda. However, during 2005 (20 Dec 2004 to 3Jan 2006) the solar radiation sensor became faulty resulting in very low readings. The solar radiation data for that period was patched
PRE-FEASIBILITY AND FEASIBILITY STUDIES: 18 WESTERN CAPE WATER SUPPLY SYSTEM
Calibration of the CE-QUAL-W2 model on Voëlvlei Dam June 2010
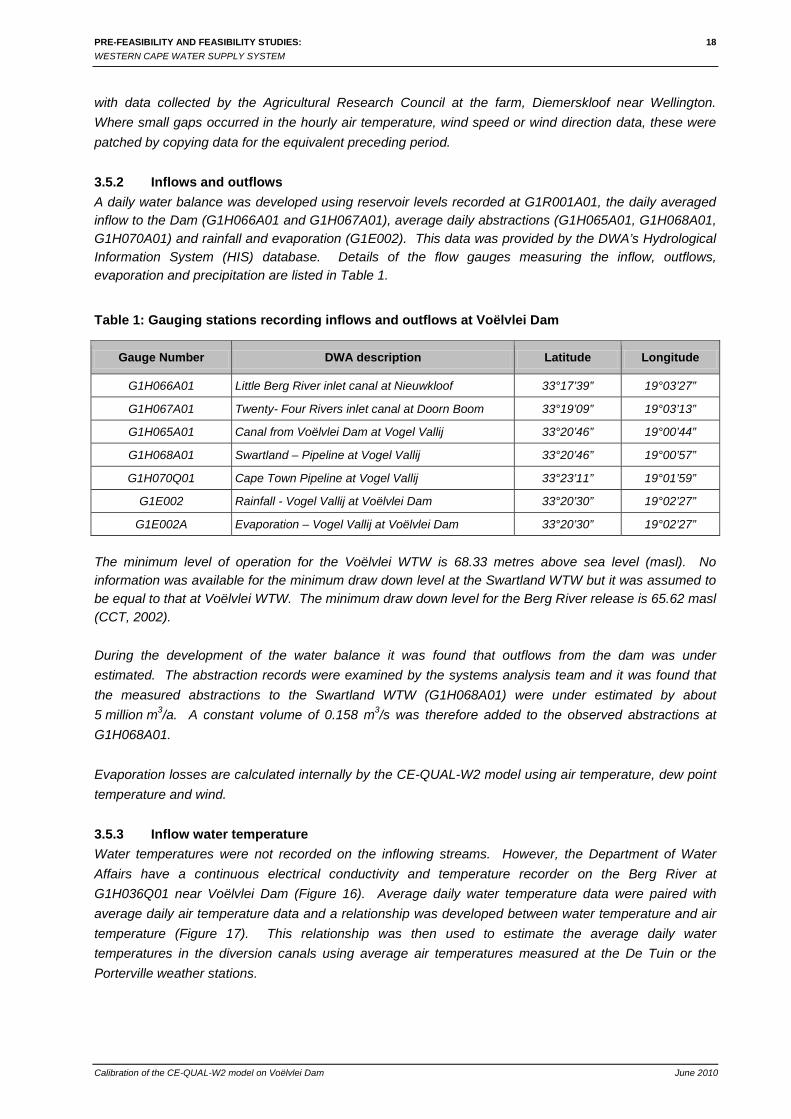
with data collected by the Agricultural Research Council at the farm, Diemerskloof near Wellington. Where small gaps occurred in the hourly air temperature, wind speed or wind direction data, these were patched by copying data for the equivalent preceding period. 3.5.2 Inflows and outflows A daily water balance was developed using reservoir levels recorded at G1R001A01, the daily averaged inflow to the Dam (G1H066A01 and G1H067A01), average daily abstractions (G1H065A01, G1H068A01, G1H070A01) and rainfall and evaporation (G1E002). This data was provided by the DWA’s Hydrological Information System (HIS) database. Details of the flow gauges measuring the inflow, outflows, evaporation and precipitation are listed in Table 1.
Table 1: Gauging stations recording inflows and outflows at Voëlvlei Dam
Gauge Number DWA description Latitude Longitude
G1H066A01 Little Berg River inlet canal at Nieuwkloof 33°17’39” 19°03’27”
G1H067A01 Twenty- Four Rivers inlet canal at Doorn Boom 33°19’09” 19°03’13”
G1H065A01 Canal from Voëlvlei Dam at Vogel Vallij 33°20’46” 19°00’44”
G1H068A01 Swartland – Pipeline at Vogel Vallij 33°20’46” 19°00’57”
G1H070Q01 Cape Town Pipeline at Vogel Vallij 33°23’11” 19°01’59”
G1E002 Rainfall - Vogel Vallij at Voëlvlei Dam 33°20’30” 19°02’27”
G1E002A Evaporation – Vogel Vallij at Voëlvlei Dam 33°20’30” 19°02’27”
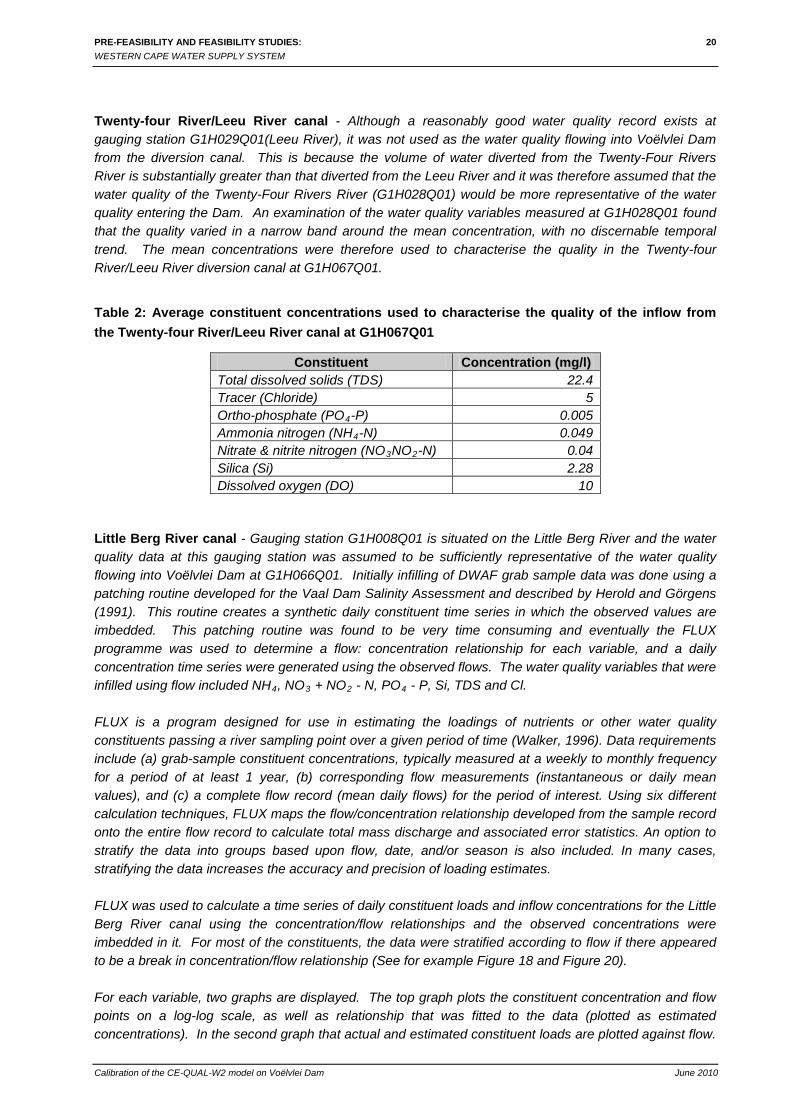
The minimum level of operation for the Voëlvlei WTW is 68.33 metres above sea level (masl). No information was available for the minimum draw down level at the Swartland WTW but it was assumed to be equal to that at Voëlvlei WTW. The minimum draw down level for the Berg River release is 65.62 masl (CCT, 2002). During the development of the water balance it was found that outflows from the dam was under estimated. The abstraction records were examined by the systems analysis team and it was found that the measured abstractions to the Swartland WTW (G1H068A01) were under estimated by about 5 million m3/a. A constant volume of 0.158 m3/s was therefore added to the observed abstractions at G1H068A01. Evaporation losses are calculated internally by the CE-QUAL-W2 model using air temperature, dew point temperature and wind. 3.5.3 Inflow water temperature Water temperatures were not recorded on the inflowing streams. However, the Department of Water Affairs have a continuous electrical conductivity and temperature recorder on the Berg River at G1H036Q01 near Voëlvlei Dam (Figure 16). Average daily water temperature data were paired with average daily air temperature data and a relationship was developed between water temperature and air temperature (Figure 17). This relationship was then used to estimate the average daily water temperatures in the diversion canals using average air temperatures measured at the De Tuin or the Porterville weather stations.
PRE-FEASIBILITY AND FEASIBILITY STUDIES: 19 WESTERN CAPE WATER SUPPLY SYSTEM
Calibration of the CE-QUAL-W2 model on Voëlvlei Dam June 2010
G1H036 Average Daily Water Temoeratures
0.0
5.0
10.0
15.0
20.0
25.0
30.0
2003/08/01 2004/05/27 2005/03/23 2006/01/17 2006/11/13 2007/09/09 2008/07/05 2009/05/01Date
Tem
pera
ture
(Deg
C)
Figure 16: Average daily water temperatures recorded by the DWA on the Berg River at G1H036.
G1H036 Water vs air temperature (Jan 2004 - Dec 2007)
y = 0 .7494x + 4 .3765R 2 = 0 .7966
0.0
5.0
10.0
15.0
20.0
25.0
30.0
35.0
0.0 5.0 10.0 15.0 20.0 25.0 30.0 35.0 40.0Avg daily air temp (deg C)
Avg
dai
ly w
ater
tem
p (d
eg C
)
Figure 17: Relationship between average daily water temperature and air temperature at G1H036 (Berg River).
3.5.4 Inflow water quality Inflow water quality data is not as readily available as flow data, and is at best measured only on a weekly basis.
PRE-FEASIBILITY AND FEASIBILITY STUDIES: 20 WESTERN CAPE WATER SUPPLY SYSTEM
Calibration of the CE-QUAL-W2 model on Voëlvlei Dam June 2010
Twenty-four River/Leeu River canal - Although a reasonably good water quality record exists at gauging station G1H029Q01(Leeu River), it was not used as the water quality flowing into Voëlvlei Dam from the diversion canal. This is because the volume of water diverted from the Twenty-Four Rivers River is substantially greater than that diverted from the Leeu River and it was therefore assumed that the water quality of the Twenty-Four Rivers River (G1H028Q01) would be more representative of the water quality entering the Dam. An examination of the water quality variables measured at G1H028Q01 found that the quality varied in a narrow band around the mean concentration, with no discernable temporal trend. The mean concentrations were therefore used to characterise the quality in the Twenty-four River/Leeu River diversion canal at G1H067Q01.
Table 2: Average constituent concentrations used to characterise the quality of the inflow from the Twenty-four River/Leeu River canal at G1H067Q01
Constituent Concentration (mg/l) Total dissolved solids (TDS) 22.4 Tracer (Chloride) 5 Ortho-phosphate (PO4-P) 0.005 Ammonia nitrogen (NH4-N) 0.049 Nitrate & nitrite nitrogen (NO3NO2-N) 0.04 Silica (Si) 2.28 Dissolved oxygen (DO) 10
Little Berg River canal - Gauging station G1H008Q01 is situated on the Little Berg River and the water quality data at this gauging station was assumed to be sufficiently representative of the water quality flowing into Voëlvlei Dam at G1H066Q01. Initially infilling of DWAF grab sample data was done using a patching routine developed for the Vaal Dam Salinity Assessment and described by Herold and Görgens (1991). This routine creates a synthetic daily constituent time series in which the observed values are imbedded. This patching routine was found to be very time consuming and eventually the FLUX programme was used to determine a flow: concentration relationship for each variable, and a daily concentration time series were generated using the observed flows. The water quality variables that were infilled using flow included NH4, NO3 + NO2 - N, PO4 - P, Si, TDS and Cl. FLUX is a program designed for use in estimating the loadings of nutrients or other water quality constituents passing a river sampling point over a given period of time (Walker, 1996). Data requirements include (a) grab-sample constituent concentrations, typically measured at a weekly to monthly frequency for a period of at least 1 year, (b) corresponding flow measurements (instantaneous or daily mean values), and (c) a complete flow record (mean daily flows) for the period of interest. Using six different calculation techniques, FLUX maps the flow/concentration relationship developed from the sample record onto the entire flow record to calculate total mass discharge and associated error statistics. An option to stratify the data into groups based upon flow, date, and/or season is also included. In many cases, stratifying the data increases the accuracy and precision of loading estimates. FLUX was used to calculate a time series of daily constituent loads and inflow concentrations for the Little Berg River canal using the concentration/flow relationships and the observed concentrations were imbedded in it. For most of the constituents, the data were stratified according to flow if there appeared to be a break in concentration/flow relationship (See for example Figure 18 and Figure 20). For each variable, two graphs are displayed. The top graph plots the constituent concentration and flow points on a log-log scale, as well as relationship that was fitted to the data (plotted as estimated concentrations). In the second graph that actual and estimated constituent loads are plotted against flow.

PRE-FEASIBILITY AND FEASIBILITY STUDIES: 21 WESTERN CAPE WATER SUPPLY SYSTEM
Calibration of the CE-QUAL-W2 model on Voëlvlei Dam June 2010
The load represents the mass of a constituent entering Voëlvlei Dam on a specific day.
TDS (m g/L)E s t (s tratum 1)E s t (s tratum 2)
TDS Concentration Vs. Daily Discharge From: G1H008
Daily Discharge (hm³/yr)0.001 0.0050.01 0.05 0.1 0.5 1 5 10 50 100 5001,000
TDS
(mg/
L)
10.0
50.0
100.0
O bs (m etric tons /y )E s t (s tratum 1)E s t (s tratum 2)
TDS Load Vs. Daily Discharge From: G1H008
Daily Discharge (hm³/yr)0.001 0.0050.01 0.050.1 0.5 1 5 10 50 100 5001,000
TDS
(met
ric to
ns/y
)
0.10
0.501.00
5.0010.00
50.00100.00
500.001000.00
5000.0010000.00
50000.00100000.00
Figure 18: Graphs showing the concentration/flow relationship that was fitted to the TDS data at G1H008Q01 and the TDS loads that was calculated using the concentration/flow relationship.

PRE-FEASIBILITY AND FEASIBILITY STUDIES: 22 WESTERN CAPE WATER SUPPLY SYSTEM
Calibration of the CE-QUAL-W2 model on Voëlvlei Dam June 2010
O bs (m etric tons /y )E s t.
Cl Load Vs. Daily Discharge From: G1H008
Daily Discharge (hm³/yr)0.001 0.0050.01 0.050.1 0.5 1 5 10 50 100 5001,000
Cl (m
etric
tons
/y)
0.05
0.501.00
5.0010.00
50.00100.00
500.001000.00
5000.0010000.00
50000.00100000.00
Cl (m g/L)E s t.
Cl Concentration Vs. Daily Discharge From: G1H008
Daily Discharge (hm³/yr)0.001 0.0050.01 0.05 0.1 0.5 1 5 10 50 100 500 1,000
Cl (m
g/L)
10.0
20.0
40.0
80.0
Figure 19: Graphs showing the concentration/flow relationship that was fitted to the chloride data at G1H008Q01 and the chloride loads that was calculated using the concentration/flow
relationship.

PRE-FEASIBILITY AND FEASIBILITY STUDIES: 23 WESTERN CAPE WATER SUPPLY SYSTEM
Calibration of the CE-QUAL-W2 model on Voëlvlei Dam June 2010
O bs (m etric tons /y )E s t (s tratum 1)E s t (s tratum 2)E s t (s tratum 3)
PO4 Load Vs. Daily Discharge From: G1H008
Daily Discharge (hm³/yr)0.001 0.0050.01 0.050.1 0.5 1 5 10 50 100 5001,000
PO4
(met
ric to
ns/y
)
0.00010
0.000500.00100
0.005000.01000
0.050000.10000
0.500001.00000
5.0000010.00000
50.00000100.00000
500.000001000.00000
P O 4 (m g/L)E s t (s tratum 1)E s t (s tratum 2)E s t (s tratum 3)
PO4 Concentration Vs. Daily Discharge From: G1H008
Daily Discharge (hm³/yr)0.001 0.0050.01 0.050.1 0.5 1 5 10 50 100 5001,000
PO4
(mg/
L)
0.0010
0.0050
0.0100
0.0500
0.1000
0.5000
1.0000
Figure 20: Graphs showing the concentration/flow relationship that was fitted to the ortho-phosphate data at G1H008Q01 and the phosphate loads that was calculated using the concentration/flow relationship.

PRE-FEASIBILITY AND FEASIBILITY STUDIES: 24 WESTERN CAPE WATER SUPPLY SYSTEM
Calibration of the CE-QUAL-W2 model on Voëlvlei Dam June 2010
O bs (m etric tons /y )E s t.
NH4 Load Vs. Daily Discharge From: G1H008
Daily Discharge (hm³/yr)0.001 0.0050.01 0.050.1 0.5 1 5 10 50 100 5001,000
NH4
(met
ric to
ns/y
)
0.000010
0.0000500.000100
0.0005000.001000
0.0050000.010000
0.0500000.100000
0.5000001.000000
5.00000010.000000
50.000000100.000000
NH4 (m g/L)E s t.
NH4 Concentration Vs. Daily Discharge From: G1H008
Daily Discharge (hm³/yr)0.001 0.0050.01 0.05 0.1 0.5 1 5 10 50 100 5001,000
NH4
(mg/
L)
0.010
0.050
0.100
0.500
1.000
Figure 21: Graphs showing the concentration/flow relationship that was fitted to the ammonia data at G1H008Q01 and the ammonia loads that was calculated using the concentration/flow relationship.
PRE-FEASIBILITY AND FEASIBILITY STUDIES: 25 WESTERN CAPE WATER SUPPLY SYSTEM
Calibration of the CE-QUAL-W2 model on Voëlvlei Dam June 2010
O bs (m etric tons /y )E s t (s tratum 1)E s t (s tratum 2)
Nitrate Load Vs. Daily Discharge From: G1H008
Daily Discharge (hm³/yr)0.001 0.0050.01 0.050.1 0.5 1 5 10 50 100 5001,000
Nitra
te (m
etric
tons
/y)
0.00010
0.000500.00100
0.005000.01000
0.050000.10000
0.500001.00000
5.0000010.00000
50.00000100.00000
500.000001000.00000
5000.0000010000.00000
Nitrate (m g/L)E s t (s tratum 1)E s t (s tratum 2)
Nitrate Concentration Vs. Daily Discharge From: G1H008
Daily Discharge (hm³/yr)0.001 0.0050.01 0.05 0.1 0.5 1 5 10 50 100 5001,000
Nitra
te (m
g/L)
0.010
0.050
0.100
0.500
1.000
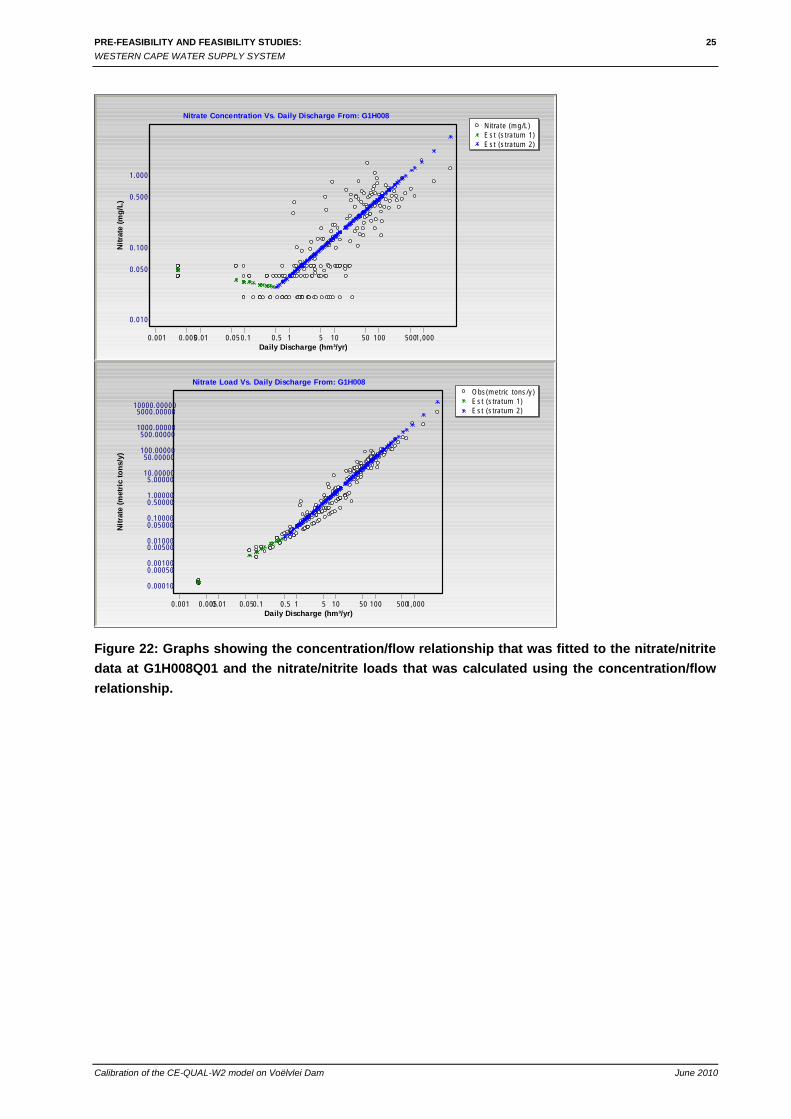
Figure 22: Graphs showing the concentration/flow relationship that was fitted to the nitrate/nitrite data at G1H008Q01 and the nitrate/nitrite loads that was calculated using the concentration/flow relationship.
PRE-FEASIBILITY AND FEASIBILITY STUDIES: 26 WESTERN CAPE WATER SUPPLY SYSTEM
Calibration of the CE-QUAL-W2 model on Voëlvlei Dam June 2010
O bs (m etric tons /y )E s t (s tratum 1)E s t (s tratum 2)
DSI Load Vs. Daily Discharge From: G1H008
Daily Discharge (hm³/yr)0.001 0.0050.01 0.050.1 0.5 1 5 10 50 100 5001,000
DSI (
met
ric to
ns/y
)
0.0010
0.00500.0100
0.05000.1000
0.50001.0000
5.000010.0000
50.0000100.0000
500.00001000.0000
5000.0000
DS I (m g/L)E s t (s tratum 1)E s t (s tratum 2)
DSI Concentration Vs. Daily Discharge From: G1H008
Daily Discharge (hm³/yr)0.001 0.0050.01 0.05 0.1 0.5 1 5 10 50 100 5001,000
DSI (
mg/
L)
0.10
0.50
1.00
5.00
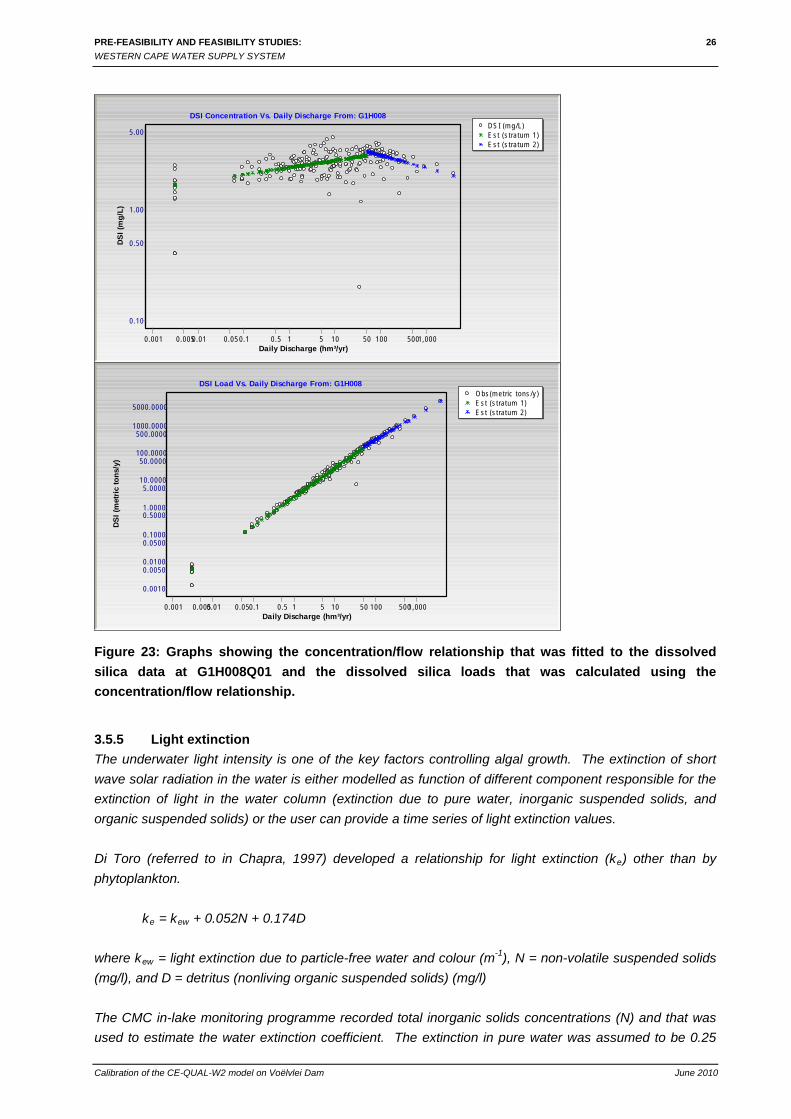
Figure 23: Graphs showing the concentration/flow relationship that was fitted to the dissolved silica data at G1H008Q01 and the dissolved silica loads that was calculated using the concentration/flow relationship.
3.5.5 Light extinction The underwater light intensity is one of the key factors controlling algal growth. The extinction of short wave solar radiation in the water is either modelled as function of different component responsible for the extinction of light in the water column (extinction due to pure water, inorganic suspended solids, and organic suspended solids) or the user can provide a time series of light extinction values. Di Toro (referred to in Chapra, 1997) developed a relationship for light extinction (ke) other than by phytoplankton.
ke = kew + 0.052N + 0.174D where kew = light extinction due to particle-free water and colour (m-1), N = non-volatile suspended solids (mg/l), and D = detritus (nonliving organic suspended solids) (mg/l) The CMC in-lake monitoring programme recorded total inorganic solids concentrations (N) and that was used to estimate the water extinction coefficient. The extinction in pure water was assumed to be 0.25

PRE-FEASIBILITY AND FEASIBILITY STUDIES: 27 WESTERN CAPE WATER SUPPLY SYSTEM
Calibration of the CE-QUAL-W2 model on Voëlvlei Dam June 2010
(Cole & Wells, 2008) and detritus was assumed to be zero since no data was available on the detritus concentrations in Voëlvlei Dam. A time series of about weekly extinction coefficients were provided as input to the model and interpolation between extinction coefficients was activated in the model. The model estimates the light extinction due to the simulated algal biomass in the water column. 3.6 INITIAL CONDITIONS The in-lake conditions were obtained from the DWA WMS database and CMC in-lake data on the date closest to the start date of the simulation period (1 October 2005) and entered into the ‘control’ and the 'vertical profile' input files of the model (Table 3). Initial simulations revealed that high wind speeds in summer cause enough mixing in the Dam to prevent strong stratification. From this information, we concluded that the reservoir was probably completely mixed at the start of the simulation (1 October) and that a single value initial condition for concentration would be a good initial estimate.
Table 3 Initial constituent values for 1 October 2005 as specified in the vertical profile file.
Constituent Initial Value Layers
Total dissolved solids (TDS) 53 mg/l all layers and segments
Phosphates (PO4-P) 0.027 mg P/l all layers and segments
Ammonium (NH4-N) 0.04 mg N/l all layers and segments
Nitrates and nitrites (NO2/3-N) 0.088 mg N/l all layers and segments
Dissolved Silica (DSI) 2.50 mg/l all layers and segments
Chlorophyll a 0.040 µg/l all layers and segments
Dissolved oxygen (DO) 10.3 mg/l all layers and segments
Alkalinity (CaCO3) 8.26 (mg/l) all layers and segments
Temperature 23 °C all layers and segments 3.7 PREPARATION OF MODEL CALIBRATION DATA Time series of observed in-lake temperature and concentrations were prepared for calibration the model (Table 4). The observed data was plotted on the calibration plots (Figure 24 to Figure 31):
Table 4: List of time series data prepared for model calibration and the data sources.
Data set Description Water levels
Daily water level data were obtained from the Department of Water Affairs. The gaugeplate data was converted to height above mean sea level by adding the relayed height of the gauge plate zero (61.68 masl).
TDS concentrations The DWA TDS concentrations recorded for G1R001Q01 (Voëlvlei Dam) were obtained from WMS
Total suspended solids concentrations
The TSS concentrations recorded at Voëlvlei Dam were obtained from the Biological Science Section, Scientific Services, City of Cape Town.
Dissolved silica concentrations
The dissolved Si concentrations recorded for G1R001Q01 (Voëlvlei Dam) were obtained from WMS
Phosphate The ortho-phosphate concentrations recorded for G1R001Q01 (Voëlvlei Dam)
PRE-FEASIBILITY AND FEASIBILITY STUDIES: 28 WESTERN CAPE WATER SUPPLY SYSTEM
Calibration of the CE-QUAL-W2 model on Voëlvlei Dam June 2010
concentrations were obtained from WMS Nitrate/nitrite and ammonia concentrations
The nitrate/nitrite and ammonia concentrations recorded for G1R001Q01 (Voëlvlei Dam) were obtained from WMS
Chlorophyll a concentrations
The in-lake chlorophyll a concentrations recorded by the Biological Science Section, Scientific Services, City of Cape Town, were combined with the DWA Chlorophyll a concentrations to develop a time series that could be used for calibrating the model.
3.8 MODEL CALIBRATION (2005-2007) The CE-QUAL-W2 model (Version 3.6) was calibrated with data collected from October 2005 to September 2007. This period was specifically selected because it represented the new, turbid state of Voëlvlei Dam. 3.8.1 Water balance There was a fairly good agreement between the observed and simulated water levels in Voëlvlei Dam (Figure 24). Towards the end of the simulation period the water level is under estimated. This could be the result of over-estimating the outflows from the dam. The agreement between the measured data and the simulated output was good enough to accept the bathymetry that had been constructed for the Dam. This exercise was considered to be the hydraulic calibration for the model.
Figure 24: Comparison of measured (points) and simulated (line) water levels in Voëlvlei Dam (Oct 2005 to September 2007)
3.8.2 Water temperature Calibration of the water temperature is in effect an attempt to calibrate the hydrodynamics of the reservoir. Calibration of the water temperature in Voëlvlei Dam required only the adjustment of the height at which the wind speed was measured. Without a profile of temperature throughout the Dam it is difficult to say what the goodness-of-fit really is, because only one set of data exists for the calibration. Figure 25

PRE-FEASIBILITY AND FEASIBILITY STUDIES: 29 WESTERN CAPE WATER SUPPLY SYSTEM
Calibration of the CE-QUAL-W2 model on Voëlvlei Dam June 2010
below depicts the agreement between the simulated temperatures and the observed data. The model replicates the seasonal pattern and the maxima and minima in the observed data set.
Figure 25: Comparison of measured and simulated water temperatures near the dam wall in Voëlvlei Dam (Oct 2005 to September 2007)
3.8.3 Total dissolved solids (TDS) concentrations TDS is considered a conservative constituent and was used in the calibration process because it provides some insight into the internal mixing processes. TDS concentrations at the Dam wall were available from the DWAF and these were used to calibrate the model at this point. The calibration is depicted in Figure 26. From the comparisons it can see that no consistent over-estimation or under-estimation was apparent, indicating that no significant source or sink were left out of the simulations. A reasonable simulation of conservative substances would indicate that the advective and dispersive transport processes were well represented by the model. This is important since it provides the building blocks for simulating constituents that are influenced by transport processes as well as chemical and biochemical reactions.

PRE-FEASIBILITY AND FEASIBILITY STUDIES: 30 WESTERN CAPE WATER SUPPLY SYSTEM
Calibration of the CE-QUAL-W2 model on Voëlvlei Dam June 2010
Figure 26: Comparison of measured and simulated TDS concentrations in Voëlvlei Dam near the dam wall (Oct 2005 to September 2007)
3.8.4 Dissolved Si concentrations There was a fair comparison between the observed and simulated dissolved silica concentrations in Voëlvlei Dam (Figure 27).
Figure 27: Comparison of measured and simulated dissolved silica concentrations levels in Voëlvlei Dam near the dam wall (Oct 2005 to September 2007)

PRE-FEASIBILITY AND FEASIBILITY STUDIES: 31 WESTERN CAPE WATER SUPPLY SYSTEM
Calibration of the CE-QUAL-W2 model on Voëlvlei Dam June 2010
3.8.5 Phosphate concentrations When modelling algae, the phosphate concentration is probably the most affected water quality constituent because it is constantly being recycled from one form to another. In this model setup, the sinks for phosphate included the outflows and photosynthetic process while the sources included the inflows, respiration and the decay of organic material including dead algae (organic sediments). From Figure 28 it appeared that the high variability in the phosphate concentration was not simulated although it appears that the model was able to replicate the general pattern in phosphate concentrations.
Figure 28: Comparison of measured and simulated ortho-phosphate concentrations in Voëlvlei Dam near the dam wall (Oct 2005 to September 2007)
3.8.6 Nitrate/nitrite and ammonia concentrations In the configured model of the Dam, the sinks to the in-lake nitrogen concentration were represented by the outflows, photosynthetic process, de-nitrification and diffusion into the sediments while sources were represented as the inflows, algal respiration and nitrification. Figure 29 shows that the model is able to replicate the average concentrations and general pattern in the observed nitrate concentration adequately.

PRE-FEASIBILITY AND FEASIBILITY STUDIES: 32 WESTERN CAPE WATER SUPPLY SYSTEM
Calibration of the CE-QUAL-W2 model on Voëlvlei Dam June 2010
Figure 29: Comparison of measured and simulated nitrate/nitrite nitrogen concentrations in Voëlvlei Dam near the dam wall (Oct 2005 to September 2007)
Figure 30 shows that the model is able to replicate the average concentrations and general pattern in the observed ammonium concentration adequately.
Figure 30: Comparison of measured and simulated ammonium nitrogen concentrations in Voëlvlei Dam near the dam wall (Oct 2005 to September 2007)

PRE-FEASIBILITY AND FEASIBILITY STUDIES: 33 WESTERN CAPE WATER SUPPLY SYSTEM
Calibration of the CE-QUAL-W2 model on Voëlvlei Dam June 2010
3.8.7 Chlorophyll a concentrations The simulation of algal biomass is challenging and Bales et al (2001) suggested possible reasons for this: • Algae are not uniformly distributed throughout the reservoir and a single point may not be
representative of the actual mean algal concentration in a reservoir segment. For this reason the chlorophyll a concentrations of the DWA and CMC were combined to give an indication of the overall algal status of the dam rather that the status at a specific point in the dam.
• When algae are modelled as a single assemblage having one growth rate function, a single mortality rate (as in our case) does not allow for distinction between different algal types and algal blooms. Observations in Voëlvlei Dam indicate that the algal assemblage changes through the course of a year.
• Simulated algal concentrations are dependent on simulated constituents such as solids concentration, light penetration, nutrient concentrations and mixing. Errors in the simulation of any of these constituents will result in an error of the simulated algae concentration.
From Figure 31 it appears that algae concentration over the first summer season is somewhat over-simulated suggesting that an adjustment in algal growth rate could possibly be required. It should be noted that if more data and information were available on the algal species present, then the calibration of the algae-related parameters would have been limited to a minimum.
During the summer months there was little to no inflow to the Dam and nutrients required for algal growth had to be sourced from within the Dam. Simulated outputs indicated that very low algae concentrations were present even during the winter months and these algae would definitely consume some of the nutrients available during the early summer. When the water temperature increased, however, a favourable environment was created and a possible elevation in algal concentration or even a bloom might occur.

PRE-FEASIBILITY AND FEASIBILITY STUDIES: 34 WESTERN CAPE WATER SUPPLY SYSTEM
Calibration of the CE-QUAL-W2 model on Voëlvlei Dam June 2010
Figure 31: Comparison of measured and simulated Chlorophyll a concentrations in Voëlvlei Dam near the dam wall (Oct 2005 to September 2007)
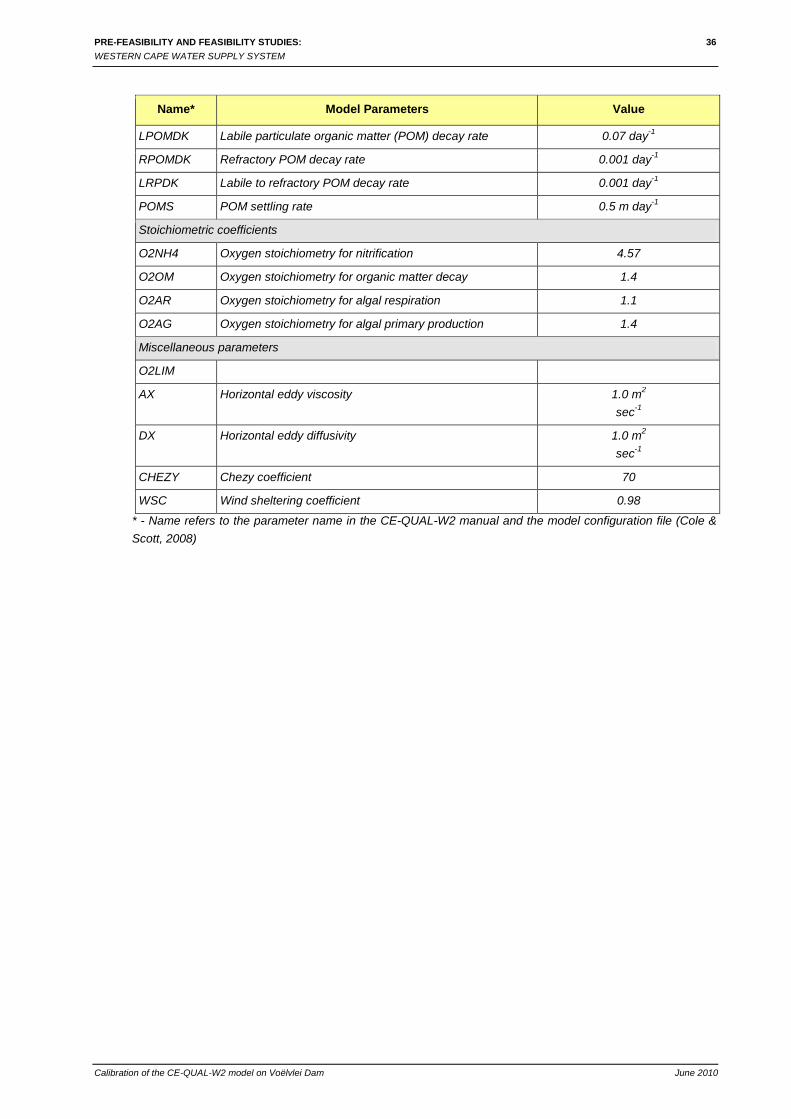
3.9 MODEL PARAMETERS The model requires a set of input parameters or rate coefficients to simulate the in-lake water quality. Parameters can be measured, taken from the literature, or treated as a calibration parameter. All the model parameters used in this study are listed in Table 5. As is evident from the list below, many parameters need to be defined and it was not practical to assume that all or even most of the parameters could be calibrated. Where possible, parameter values were obtained from literature but in most cases a range of possible parameter values were obtained from the literature, and calibration of these parameters was restricted to the values within the reported range. Earlier reports on Voëlvlei Dam (Southern Waters, 1999) reported that prior to 1995 the algae problems were limited to seasonal blooms of filamentous diatoms, Aulacoseira and was also related to low impoundment levels and wind-mixing in autumn. In more recent years, however, blooms of Anabaena solitaria and Microcystis aeruginosa have been detected and have been associated with taste and odour (geosmin-A.solitaria) and hepatotoxins. Based on this information it was decided that the initial setup of the model should consist of only one algae compartment modelling the behaviour of a culture consisting mostly of diatoms. Parameter values were obtained from a comprehensive list of rate constants prepared by Bowie et al (1985) and the user’s manual for CE-QUAL-W2 v3.6 (Cole & Scott, 2008). The maximum algal growth rate constant was calibrated at 2.0 day-1, which is well within the 0.55 to 5.0 day-1 quoted for diatoms.

PRE-FEASIBILITY AND FEASIBILITY STUDIES: 35 WESTERN CAPE WATER SUPPLY SYSTEM
Calibration of the CE-QUAL-W2 model on Voëlvlei Dam June 2010
Table 5: Parameters used in model
Name* Model Parameters Value
Parameters affecting algal growth
AG Maximum algal growth rate 1.4 day-1
AM Maximum algal mortality rate 0.05 day-1
AE Maximum algal excretion rate 0.04 day-1
AR Maximum algal respiration rate 0.04 day-1
AHSN Michaelis-Menten algal half-saturation constant for nitrogen limited growth
0.1 mg/l
AHSP Michaelis-Menten algal half-saturation for phosphorus limited growth
0.0025 mg/l
AHSSI Michaelis-Menten algal half-saturation for silica limited growth
0.014 mg/l
ASAT Light saturation intensity at maximum photosynthetic rate 75 Wm-2
EXH20 Extinction of pure water 0.25 m-1 (Not modelled)
EXSS Extinction due to inorganic suspended solids 0.1 m-1 (Not modelled)
EXOM Extinction due to organic suspended solids 0.1 m-1 (Not modelled)
BETA Fraction of incident solar radiation absorbed at water surface
0.45
AS Algal settling velocity 0.05 m day-1
ALGP Stoichiometric equivalent between algal biomass and phosphorus
0.005
ALGN Stoichiometric equivalent between algal biomass and nitrogen
0.08
ALGC Stoichiometric equivalent between algal biomass and carbon
0.45
ALSI Stoichiometric equivalent between algal biomass and silica 0.08
ACHLA Ratio between algal biomass and chlorophyll-a 0.8
Parameters affecting ammonia nitrification and sedimentary phosphorus
NH4DK Maximum ammonia nitrification rate 0.12 day-1
NH4REL Sediment release rate under anaerobic conditions (as a fraction of the sediment oxygen demand (SOD))
0.08
PARTP Phosphorus partitioning coefficient for suspended solids 0.5
PO4R Sediment release rate of phosphorus under anaerobic conditions (as a fraction of the sediment oxygen demand (SOD))
0.05
SEDDK First order sediment decay rate 0.08 day-1
Parameters affecting dissolved and particulate organic matter
LDOMDK Labile Dissolved Organic Matter (DOM) decay rate 0.12 day-1
RDOMDK Refractory DOM decay rate 0.001 day-1
LRDDK Labile DOM to refractory DOM decay rate 0.001 day-1
PRE-FEASIBILITY AND FEASIBILITY STUDIES: 36 WESTERN CAPE WATER SUPPLY SYSTEM
Calibration of the CE-QUAL-W2 model on Voëlvlei Dam June 2010
Name* Model Parameters Value
LPOMDK Labile particulate organic matter (POM) decay rate 0.07 day-1
RPOMDK Refractory POM decay rate 0.001 day-1
LRPDK Labile to refractory POM decay rate 0.001 day-1
POMS POM settling rate 0.5 m day-1
Stoichiometric coefficients
O2NH4 Oxygen stoichiometry for nitrification 4.57
O2OM Oxygen stoichiometry for organic matter decay 1.4
O2AR Oxygen stoichiometry for algal respiration 1.1
O2AG Oxygen stoichiometry for algal primary production 1.4
Miscellaneous parameters
O2LIM
AX Horizontal eddy viscosity 1.0 m2
sec-1
DX Horizontal eddy diffusivity 1.0 m2
sec-1
CHEZY Chezy coefficient 70
WSC Wind sheltering coefficient 0.98
* - Name refers to the parameter name in the CE-QUAL-W2 manual and the model configuration file (Cole & Scott, 2008)
PRE-FEASIBILITY AND FEASIBILITY STUDIES: 37 WESTERN CAPE WATER SUPPLY SYSTEM
Calibration of the CE-QUAL-W2 model on Voëlvlei Dam June 2010
4. MODEL APPLICATION TO ASSESS THE IMPACT OF THE BERG RIVER TRANSFER OPTIONS
4.1 INTRODUCTION An initial assessment was made of the potential impacts on Voëlvlei Dam if water is transferred from the Berg River into the dam near the City of Cape Town abstraction works. The following were changed in the model in order to assess the impacts: • A new inflow was added to the model discharging into Segment 6 next to Segment 5 from which the
withdrawal of water to the City of Cape Town treatment works (Figure 12). • The volumes transferred from the Berg River into Voëlvlei Dam was based on the Pump rule 10-1
scenario. The daily water balance for the transfer scenario was provided by the hydrology project team.
• The daily water quality constituent concentrations were estimated by in-filling the observed data record at G1H036 using the FLUX programme.
• Average daily water temperatures were based on continuous observed temperatures at G1H036. • Rate parameters were left unchanged from the calibration parameters. 4.2 RESULTS 4.2.1 Total dissolved solids (TDS) The transfer of water from the Berg River appears to have little impact on the short term TDS concentrations in Voëlvlei Dam (Figure 32).
Voëlvlei Dam - Impact of Berg River transfers
0
10
20
30
40
50
60
70
2005/10/01 2006/01/09 2006/04/19 2006/07/28 2006/11/05 2007/02/13 2007/05/24 2007/09/01Date
TDS
(mg/
l)
C alib ra tionW ith B erg trans fer
Figure 32: Simulation of the impact of transferring water from the Berg River on TDS concentrations in Voëlvlei Dam

PRE-FEASIBILITY AND FEASIBILITY STUDIES: 38 WESTERN CAPE WATER SUPPLY SYSTEM
Calibration of the CE-QUAL-W2 model on Voëlvlei Dam June 2010
4.2.2 Ortho-phosphate (PO4-P) Comparing the simulated ortho-phosphate concentrations show that, on average, very little change in phosphate concentrations may occur as a result of transferring water from the Berg River into Voëlvlei Dam (Figure 33).
Voëlvlei Dam - Impact of Berg River transfers
0
0.005
0.01
0.015
0.02
0.025
0.03
0.035
0.04
0.045
0.05
2005/10/01 2006/01/09 2006/04/19 2006/07/28 2006/11/05 2007/02/13 2007/05/24 2007/09/01
Date
PO
4-P
(mg/
l)
Calibrat ionW ith B erg trans fer
Figure 33: Simulation of the impact of transferring water from the Berg River on PO4-P concentrations in Voëlvlei Dam
4.2.3 Nitrate nitrogen (NO3-N) Transferring water from the Berg River would probably increase the nitrate nitrogen concentrations in Voëlvlei Dam because the N concentrations in the Berg River are higher than in the other rivers feeding into the dam (Figure 34).
Voelvlei Dam -Impacts of Berg River transfers
0
0.05
0.1
0.15
0.2
0.25
0.3
2005/10/01 2006/01/09 2006/04/19 2006/07/28 2006/11/05 2007/02/13 2007/05/24 2007/09/01
Date
NO3-
N (m
g/l)
Calibrat ionW ith B erg trans fer
Figure 34: Simulation of the impact of transferring water from the Berg River on NO3-N concentrations in Voëlvlei Dam

PRE-FEASIBILITY AND FEASIBILITY STUDIES: 39 WESTERN CAPE WATER SUPPLY SYSTEM
Calibration of the CE-QUAL-W2 model on Voëlvlei Dam June 2010
4.2.4 Chlorophyll a A comparison of the simulated chlorophyll a concentrations show that elevated chlorophyll concentrations could be experienced with water transferred from the Berg River (Figure 35). This was probably due to elevated nitrate concentrations in the transfer water. The simulated chlorophyll concentrations under the calibration scenario and the transfer scenario were well above the 0.03 mg/l boundary value for hyper-trophic systems.
0
0.2
0.4
0.6
0.8
1
1.2
2005/10/01 2006/01/09 2006/04/19 2006/07/28 2006/11/05 2007/02/13 2007/05/24 2007/09/01
Chl a
(mg/
l)
Date
VoëlVlei Dam - Impacts of Berg River transfers
C a lib ra tio n
W ith B e rg Tra n sfe r
Figure 35: Simulation of the impact of transferring water from the Berg River on chlorophyll a concentrations in Voëlvlei Dam
4.3 DISCUSSION The option to transfer water from the Berg River would, in the short term, probably not have a significant impact on salinity in Voëlvlei Dam. However, such a transfer would probably have a detrimental impact on the in-lake nitrogen and chlorophyll a concentrations, leading to increased problems with nuisance algae and the associated cost of treating the water to potable water standards.

PRE-FEASIBILITY AND FEASIBILITY STUDIES: 40 WESTERN CAPE WATER SUPPLY SYSTEM
Calibration of the CE-QUAL-W2 model on Voëlvlei Dam June 2010
5. CONCLUDING REMARKS
• Voëlvlei Dan has been experiencing more frequent algal blooms since the drought of 2004/5 changed
the character of the dam from a stable clear water dam dominated by rooted water plants and predatory fish to a stable turbid dominated by free-floating algae (phytoplankton) and bottom feeding fish.
• The Cape Town water treatment works confirm that their cost of water treatment has increased to deal with the increase in tastes and odours problems in their treated water, and an increase in filter blocking algae (Melosira).
• From an initial assessment of the possible impacts of transferring water from the Berg River into Voëlvlei Dam could maintain this situation and may even increase the duration of high algal concentrations.

PRE-FEASIBILITY AND FEASIBILITY STUDIES: 41 WESTERN CAPE WATER SUPPLY SYSTEM
Calibration of the CE-QUAL-W2 model on Voëlvlei Dam June 2010
6. REFERENCES
Bales, J.D, Sarver, K.M and Giorgino, M.J. (2001). Mountain Island Lake, North Carolina: Analysis of ambient conditions and simulation of hydrodynamics, constituent transport, and water-quality characteristics, 1996-97. U.S. Geological Survey. Water-Resources Investigations Report 01-4138. Bowie, G.L., Mills, W.B.,Porcella, D.B., Campbell, C.L., Pagenkopf, J.R., Rupp, G.L., Johnson, K.M., Chan, P.W.H., Gherini, S.A., and Chamberlin, C.E. (1985). Rates, constants,and kinetics formulations in surface water quality modeling : U.S. Environmental Protection Agency, EPA/600/3-85/040. Chapra, S.C. (1997). Surface water-quality modelling. McGraw-Hill, New York. City of Cape Town, CMC Administration. (2002). Voëlvlei Augmentation Scheme Phase 1. Prepared by Ninham Shand (Pty) Ltd as part of the CMA Bulk Water Supply Study. Cole, T.M, and Wells, S.A. (2008). CE-QUAL-W2: A two-dimensional, laterally averaged, hydrodynamic and water quality model, Version 3.6. Report EL-080-1. US Army Corps of Engineers. Department of Water Affairs and Forestry, South Africa. (1992). Description of existing urban water supply infrastructure. Prepared by R Blackhurst and P R Little of Ninham Shand Inc. in association with BKS Inc. as part of the Western Cape System Analysis. DWAF Report no. P G000/00/1490. NSI Report No. 1752/5131. Department of Water Affairs and Forestry, South Africa. (1994). Berg River Sub-system Analysis. Prepared by RR Berg and M Thompson of Ninham Shand Inc. in association with BKS Inc. as part of the Western Cape System Analysis. DWAF Report no. P G000/00/4493. NSI Report No. 2030/5131. Hosper, S.H. (1998). Stables states, buffers and switches: an ecosystem approach to the restoration and management of shallow lakes in the Netherlands. Water Science and Technology, 37(3): 151-164 Kamish, W., Rossouw, J.N, and Petersen, A.M. (2007). Development of strategies to address nuisance algal growth problems in Voëlvlei Dam. Department of Water Affairs and Forestry (Western Cape Region). Pretoria. Moss, B. (1998). Shallow lakes biomanipulation and eutrophication. Scope Newsletter No 29. Moss, B. (2003). Cinderella goes to the ball. A story of shallow lakes. Lakeline, 23(1): 11-16. Southern Waters. 1999. Voëlvlei Augmentation Scheme (VAS): Impact of Berg River transfer on in-lake phosphorus concentrations and the trophic state of the Voëlvlei impoundment. Prepared for Gibb Africa by W.R Harding. Walker, W.W. (1996). Simplified procedures for eutrophication assessment and prediction: user manual. Prepared for US Army Corps of Engineers. Instruction Report W-96-2. Waterways Experiment Station, US Army Corps of Engineers.


![· 178 w2~uz− 179 w2~− 182 w2¶a 183 w2,v0 185 w2fl 186 w2,´‡ 187 w2,^M 188 w2,â 190 w2,˛− 195 w2,ðg− 196 w2,ðg! 198 w2,ð¾ 200 w2,ð−a 201 w2,ðgG Ž ]* Z˜ ß9ü](https://static.fdocuments.in/doc/165x107/5ec4169f9cf111271f3cdc4b/178-w2uza-179-w2a-182-w2a-183-w2v0-185-w2i-186-w2a-187-w2m-188.jpg)