CONFIDENTIAL October 29, 2004 Annual EcoSystem Meeting Technology IPO Perspectives PRESENTATION TO:
22
CONFIDENTIAL October 29, 2004 Annual EcoSystem Meeting Technology IPO Perspectives PRESENTATION TO:
-
Upload
elinor-carson -
Category
Documents
-
view
214 -
download
1
Transcript of CONFIDENTIAL October 29, 2004 Annual EcoSystem Meeting Technology IPO Perspectives PRESENTATION TO:

CONFIDENTIAL
October 29, 2004
Annual EcoSystem MeetingTechnology IPO Perspectives
PRESENTATION TO:

Table of Contents
1 Technology IPO Perspectives
2 2005 IPO Market Outlook
Software Overview
Semiconductor Overview
Communications Overview
3 Google Case Study

Annual EcoSystem Meeting - Technology IPO Perspectives / October 29, 2004 3
1 Technology IPO Perspectives
Annual EcoSystem Meeting - Technology IPO Perspectives / October 29, 2004 4
Technology IPO Perspectives
2004 Technology IPO Observations
> 39 Technology IPOs priced YTD; up from 16 in 2003
> Technology is 25% of IPO market dollar volume; healthcare leads with 27%
> Year-to-date returns up 24.2%; better than all other equity indices
> Since Q2, it has been a buyer’s market
> Window has opened a crack for smaller transactions (versus 2003)
> Internet-related IPOs returned (with profits!)
> First year that China has had a material impact; more to come
> It was a nice media event, but Google did not impact investors’ technology IPO
perceptions
> High public company costs create barriers to IPO supply
> IPOs occur in brief windows of opportunity

Annual EcoSystem Meeting - Technology IPO Perspectives / October 29, 2004 5
Technology IPO Perspectives
Number of IPOs From All Industries (January 1, 1980 – October 22, 2004)
Source: Securities Data Corporation
348 356
728
554
290
254
214
402
817
630
392
540
127 129
685
578
384
173 181
874
607
353
149
122
642
0
100
200
300
400
500
600
700
800
900
1000
1980 1981 1982 1983 1984 1985 1986 1987 1988 1989 1990 1991 1992 1993 1994 1995 1996 1997 1998 1999 2000 2001 2002 2003 2004
348 356
728
554
290
254
214
402
817
630
392
540
127 129
685
578
384
173 161
874
607
353
149
122
642
0
100
200
300
400
500
600
700
800
900
1000
1980 1981 1982 1983 1984 1985 1986 1987 1988 1989 1990 1991 1992 1993 1994 1995 1996 1997 1998 1999 2000 2001 2002 2003 2004
348 356
728
554
290
254
214
402
817
630
392
540
127 129
685
578
384
173 181
874
607
353
149
122
642
0
100
200
300
400
500
600
700
800
900
1000
1980 1981 1982 1983 1984 1985 1986 1987 1988 1989 1990 1991 1992 1993 1994 1995 1996 1997 1998 1999 2000 2001 2002 2003 2004
348 356
728
554
290
254
214
402
817
630
392
540
127 129
685
578
384
173 170
874
607
353
149
122
642
0
100
200
300
400
500
600
700
800
900
1000
1980 1981 1982 1983 1984 1985 1986 1987 1988 1989 1990 1991 1992 1993 1994 1995 1996 1997 1998 1999 2000 2001 2002 2003 2004
348 356
728
554
290
254
214
402
817
630
392
540
127 129
685
578
384
173 181
874
607
353
149
122
642
0
100
200
300
400
500
600
700
800
900
1000
1980 1981 1982 1983 1984 1985 1986 1987 1988 1989 1990 1991 1992 1993 1994 1995 1996 1997 1998 1999 2000 2001 2002 2003 2004
348 356
728
554
290
254
214
402
817
630
392
540
127 129
685
578
384
173 161
874
607
353
149
122
642
0
100
200
300
400
500
600
700
800
900
1000
1980 1981 1982 1983 1984 1985 1986 1987 1988 1989 1990 1991 1992 1993 1994 1995 1996 1997 1998 1999 2000 2001 2002 2003 2004
348 356
728
554
290
254
214
402
817
630
392
540
127 129
685
578
384
173 181
874
607
353
149
122
642
0
100
200
300
400
500
600
700
800
900
1000
1980 1981 1982 1983 1984 1985 1986 1987 1988 1989 1990 1991 1992 1993 1994 1995 1996 1997 1998 1999 2000 2001 2002 2003 2004
348 356
728
554
290
254
214
402
817
630
392
540
127 129
685
578
384
173 170
874
607
353
149
122
642
0
100
200
300
400
500
600
700
800
900
1000
1980 1981 1982 1983 1984 1985 1986 1987 1988 1989 1990 1991 1992 1993 1994 1995 1996 1997 1998 1999 2000 2001 2002 2003 2004

Annual EcoSystem Meeting - Technology IPO Perspectives / October 29, 2004 6
Technology IPO Perspectives
Number of Technology IPOs (January 1, 1980 – October 28, 2004)
Source: Securities Data Corporation
PC Revolution Retrenchment Networking Internet Revolution Retrenchment
13
33
12
82
2413
36 34
1727 23
4656
95
80
148
203
129
85
308
19 16 1627
221
0
50
100
150
200
250
300
350
19
80
19
81
19
82
19
83
19
84
19
85
19
86
19
87
19
88
19
89
19
90
19
91
19
92
19
93
19
94
19
95
19
96
19
97
19
98
19
99
20
00
20
01
20
02
20
03
20
04
13
33
12
82
2413
36 34
1727 23
4656
95
80
148
203
129
85
308
19 16 1627
0
50
100
150
200
250
300
350
19
80
19
81
19
82
19
83
19
84
19
85
19
86
19
87
19
88
19
89
19
90
19
91
19
92
19
93
19
94
19
95
19
96
19
97
19
98
19
99
20
00
20
01
20
02
20
03
20
04
PC Revolution Retrenchment Networking Internet Revolution Retrenchment
13
33
12
82
2413
36 34
1727 23
4656
95
80
148
203
129
85
308
19 16 1629
221
0
50
100
150
200
250
300
350
19
80
19
81
19
82
19
83
19
84
19
85
19
86
19
87
19
88
19
89
19
90
19
91
19
92
19
93
19
94
19
95
19
96
19
97
19
98
19
99
20
00
20
01
20
02
20
03
20
04
13
33
12
82
2413
36 34
1727 23
4656
95
80
148
203
129
85
308
19 16 16
0
50
100
150
200
250
300
350
19
80
19
81
19
82
19
83
19
84
19
85
19
86
19
87
19
88
19
89
19
90
19
91
19
92
19
93
19
94
19
95
19
96
19
97
19
98
19
99
20
00
20
01
20
02
20
03
20
04
PC Revolution Retrenchment Networking Internet Revolution Retrenchment
13
33
12
82
2413
36 34
1727 23
4656
95
80
148
203
129
85
308
19 16 1627
221
0
50
100
150
200
250
300
350
19
80
19
81
19
82
19
83
19
84
19
85
19
86
19
87
19
88
19
89
19
90
19
91
19
92
19
93
19
94
19
95
19
96
19
97
19
98
19
99
20
00
20
01
20
02
20
03
20
04
13
33
12
82
2413
36 34
1727 23
4656
95
80
148
203
129
85
308
19 16 1627
0
50
100
150
200
250
300
350
19
80
19
81
19
82
19
83
19
84
19
85
19
86
19
87
19
88
19
89
19
90
19
91
19
92
19
93
19
94
19
95
19
96
19
97
19
98
19
99
20
00
20
01
20
02
20
03
20
04
PC Revolution Retrenchment Networking Internet Revolution Retrenchment
13
33
12
82
2413
36 34
1727 23
4656
95
80
148
203
129
85
308
19 16 16
39
221
0
50
100
150
200
250
300
350
19
80
19
81
19
82
19
83
19
84
19
85
19
86
19
87
19
88
19
89
19
90
19
91
19
92
19
93
19
94
19
95
19
96
19
97
19
98
19
99
20
00
20
01
20
02
20
03
20
04
13
33
12
82
2413
36 34
1727 23
4656
95
80
148
203
129
85
308
19 16 16
0
50
100
150
200
250
300
350
19
80
19
81
19
82
19
83
19
84
19
85
19
86
19
87
19
88
19
89
19
90
19
91
19
92
19
93
19
94
19
95
19
96
19
97
19
98
19
99
20
00
20
01
20
02
20
03
20
04
PC Revolution Retrenchment Networking Internet Revolution Retrenchment
13
33
12
82
2413
36 34
1727 23
4656
95
80
148
203
129
85
308
19 16 1627
221
0
50
100
150
200
250
300
350
19
80
19
81
19
82
19
83
19
84
19
85
19
86
19
87
19
88
19
89
19
90
19
91
19
92
19
93
19
94
19
95
19
96
19
97
19
98
19
99
20
00
20
01
20
02
20
03
20
04
13
33
12
82
2413
36 34
1727 23
4656
95
80
148
203
129
85
308
19 16 1627
0
50
100
150
200
250
300
350
19
80
19
81
19
82
19
83
19
84
19
85
19
86
19
87
19
88
19
89
19
90
19
91
19
92
19
93
19
94
19
95
19
96
19
97
19
98
19
99
20
00
20
01
20
02
20
03
20
04
PC Revolution Retrenchment Networking Internet Revolution Retrenchment
13
33
12
82
2413
36 34
1727 23
4656
95
80
148
203
129
85
308
19 16 1629
221
0
50
100
150
200
250
300
350
19
80
19
81
19
82
19
83
19
84
19
85
19
86
19
87
19
88
19
89
19
90
19
91
19
92
19
93
19
94
19
95
19
96
19
97
19
98
19
99
20
00
20
01
20
02
20
03
20
04
13
33
12
82
2413
36 34
1727 23
4656
95
80
148
203
129
85
308
19 16 16
0
50
100
150
200
250
300
350
19
80
19
81
19
82
19
83
19
84
19
85
19
86
19
87
19
88
19
89
19
90
19
91
19
92
19
93
19
94
19
95
19
96
19
97
19
98
19
99
20
00
20
01
20
02
20
03
20
04
PC Revolution Retrenchment Networking Internet Revolution Retrenchment
13
33
12
82
2413
36 34
1727 23
4656
95
80
148
203
129
85
308
19 16 1627
221
0
50
100
150
200
250
300
350
19
80
19
81
19
82
19
83
19
84
19
85
19
86
19
87
19
88
19
89
19
90
19
91
19
92
19
93
19
94
19
95
19
96
19
97
19
98
19
99
20
00
20
01
20
02
20
03
20
04
13
33
12
82
2413
36 34
1727 23
4656
95
80
148
203
129
85
308
19 16 1627
0
50
100
150
200
250
300
350
19
80
19
81
19
82
19
83
19
84
19
85
19
86
19
87
19
88
19
89
19
90
19
91
19
92
19
93
19
94
19
95
19
96
19
97
19
98
19
99
20
00
20
01
20
02
20
03
20
04
PC Revolution Retrenchment Networking Internet Revolution Retrenchment
13
33
12
82
2413
36 34
1727 23
4656
95
80
148
203
129
85
308
19 16 16
39
221
0
50
100
150
200
250
300
350
19
80
19
81
19
82
19
83
19
84
19
85
19
86
19
87
19
88
19
89
19
90
19
91
19
92
19
93
19
94
19
95
19
96
19
97
19
98
19
99
20
00
20
01
20
02
20
03
20
04
13
33
12
82
2413
36 34
1727 23
4656
95
80
148
203
129
85
308
19 16 16
0
50
100
150
200
250
300
350
19
80
19
81
19
82
19
83
19
84
19
85
19
86
19
87
19
88
19
89
19
90
19
91
19
92
19
93
19
94
19
95
19
96
19
97
19
98
19
99
20
00
20
01
20
02
20
03
20
04
Cyclicality of IPOs follows the
evolution of new industries and broader
economic themes

Annual EcoSystem Meeting - Technology IPO Perspectives / October 29, 2004 7
Technology IPO Perspectives
Average Technology IPO Market Value and IPO Size(January 1, 1980 – October 28, 2004)
Source: Securities Data CorporationExcludes Accenture and Agere IPOs in 2001; median data for 2004
Average IPO market value and size have
steadily increased as
investors demand greater
liquidity and companies with greater critical
mass
PC Revolution Retrenchment Networking Internet Revolution RetrenchmentPC Revolution Retrenchment Networking Internet Revolution Retrenchment
$0
$100
$200
$300
$400
$500
$600
$700
$800
$900
$1,000
19
80
19
81
19
82
19
83
19
84
19
85
19
86
19
87
19
88
19
89
19
90
19
91
19
92
19
93
19
94
19
95
19
96
19
97
19
98
19
99
20
00
20
01
20
02
20
03
20
04
(in
mil
lio
ns)
Average IPO Market Value Average IPO Size

Annual EcoSystem Meeting - Technology IPO Perspectives / October 29, 2004 8
Miscellaneous8%
Semi Capital Equipment
3%
Telecom Equipment
10%
Softw are21%
Semiconductor28%
Services & I nternet Related
30%
Technology IPO Perspectives
Technology IPOs by Sector Breakdown 2001– 2004 YTD (By # of Deals)
Source: Equidesk
20012002
20032004 YTD
Software and Semiconductors
consistently account for the
largest IPO sectors
Excludes deals under $30M
Annual EcoSystem Meeting - Technology IPO Perspectives / October 29, 2004 9
Technology IPO Perspectives
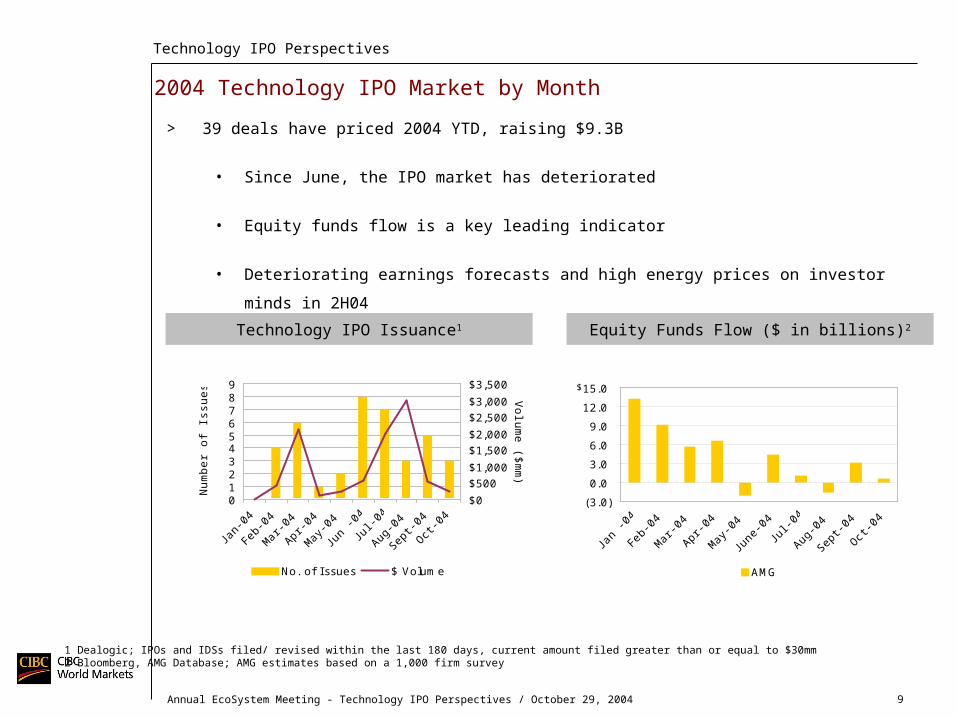
2004 Technology IPO Market by Month
1 Dealogic; IPOs and IDSs filed/ revised within the last 180 days, current amount filed greater than or equal to $30mm2 Bloomberg, AMG Database; AMG estimates based on a 1,000 firm survey
> 39 deals have priced 2004 YTD, raising $9.3B
• Since June, the IPO market has deteriorated
• Equity funds flow is a key leading indicator
• Deteriorating earnings forecasts and high energy prices on investor minds in 2H04
(3.0)
0.0
3.0
6.0
9.0
12.0
15.0
Jan
-04
Feb-
04
Mar-0
4
Apr-0
4
May-0
4
June
-04
Jul-0
4
Aug-0
4
Sept
-04
Oct-0
4
AMG
$
Equity Funds Flow ($ in billions)2Technology IPO Issuance1
0123456789
Jan-
04
Feb-
04
Mar-0
4
Apr-0
4
May-0
4
Jun
-04Ju
l-04
Aug-0
4
Sept
-04
Oct-0
4
Num
ber
of Is
sues
$0
$500$1,000
$1,500$2,000
$2,500$3,000
$3,500
Volu
me ($
mm
)
No. of I ssues $ Volume
Annual EcoSystem Meeting - Technology IPO Perspectives / October 29, 2004 10
Technology IPO Perspectives
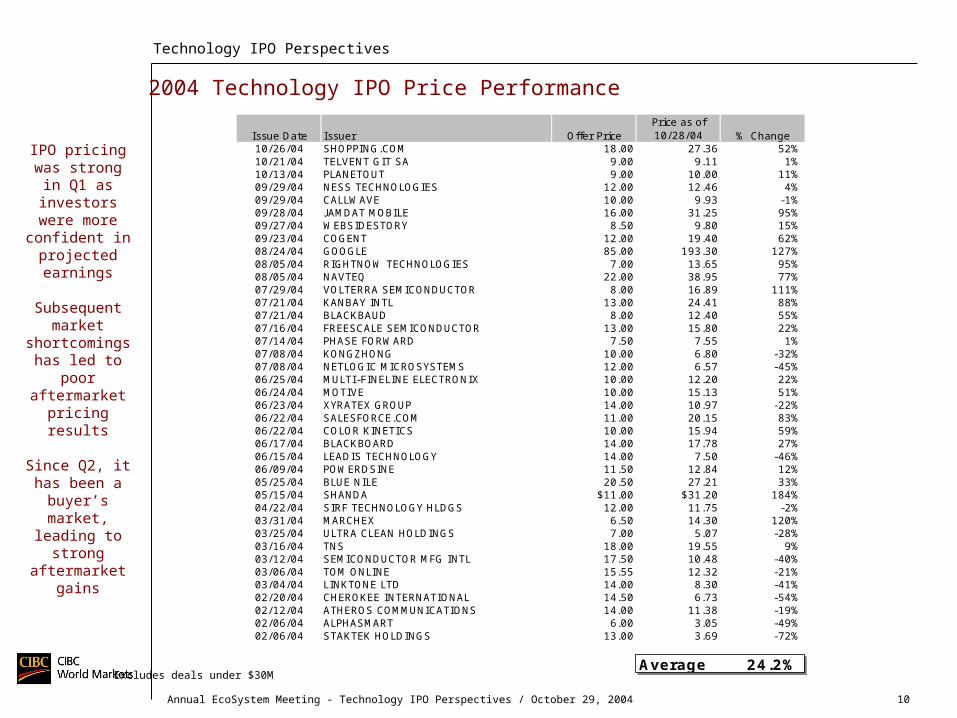
2004 Technology IPO Price Performance
IPO pricing was strong in
Q1 as investors
were more confident in projected earnings
Subsequent market
shortcomings has led to
poor aftermarket
pricing results
Since Q2, it has been a
buyer’s market,
leading to strong
aftermarket gains
Issue Date Issuer Offer PricePrice as of 10/28/04 % Change
10/26/04 SHOPPING.COM 18.00 27.36 52%10/21/04 TELVENT GIT SA 9.00 9.11 1%10/13/04 PLANETOUT 9.00 10.00 11%09/29/04 NESS TECHNOLOGIES 12.00 12.46 4%09/29/04 CALLWAVE 10.00 9.93 -1%09/28/04 J AMDAT MOBILE 16.00 31.25 95%09/27/04 WEBSIDESTORY 8.50 9.80 15%09/23/04 COGENT 12.00 19.40 62%08/24/04 GOOGLE 85.00 193.30 127%08/05/04 RIGHTNOW TECHNOLOGIES 7.00 13.65 95%08/05/04 NAVTEQ 22.00 38.95 77%07/29/04 VOLTERRA SEMICONDUCTOR 8.00 16.89 111%07/21/04 KANBAY INTL 13.00 24.41 88%07/21/04 BLACKBAUD 8.00 12.40 55%07/16/04 FREESCALE SEMICONDUCTOR 13.00 15.80 22%07/14/04 PHASE FORWARD 7.50 7.55 1%07/08/04 KONGZHONG 10.00 6.80 -32%07/08/04 NETLOGIC MICROSYSTEMS 12.00 6.57 -45%06/25/04 MULTI-FINELINE ELECTRONIX 10.00 12.20 22%06/24/04 MOTIVE 10.00 15.13 51%06/23/04 XYRATEX GROUP 14.00 10.97 -22%06/22/04 SALESFORCE.COM 11.00 20.15 83%06/22/04 COLOR KINETICS 10.00 15.94 59%06/17/04 BLACKBOARD 14.00 17.78 27%06/15/04 LEADIS TECHNOLOGY 14.00 7.50 -46%06/09/04 POWERDSINE 11.50 12.84 12%05/25/04 BLUE NILE 20.50 27.21 33%05/15/04 SHANDA $11.00 $31.20 184%04/22/04 SIRF TECHNOLOGY HLDGS 12.00 11.75 -2%03/31/04 MARCHEX 6.50 14.30 120%03/25/04 ULTRA CLEAN HOLDINGS 7.00 5.07 -28%03/16/04 TNS 18.00 19.55 9%03/12/04 SEMICONDUCTOR MFG INTL 17.50 10.48 -40%03/06/04 TOM ONLINE 15.55 12.32 -21%03/04/04 LINKTONE LTD 14.00 8.30 -41%02/20/04 CHEROKEE INTERNATIONAL 14.50 6.73 -54%02/12/04 ATHEROS COMMUNICATIONS 14.00 11.38 -19%02/06/04 ALPHASMART 6.00 3.05 -49%02/06/04 STAKTEK HOLDINGS 13.00 3.69 -72%
Average 24.2%Excludes deals under $30M

Annual EcoSystem Meeting - Technology IPO Perspectives / October 29, 2004 11
Technology IPO Perspectives
2004 Technology IPO Multiples
Demonstrated earnings are an investor
focus
Gross %Company Proceeds @ IPO 10/ 28/ 04 +/ - @ IPO Current 2004 2005 @ IPO Current @ IPO Current
Shopping.com 123.7$ 18.00$ 27.36$ 52.0% 500.6$ 761.0$ NA NA NA NA NA NA
Telvent GIT SA 78.3 9.00 9.11 1.2% 258.3 261.5 NA NA NA NA NA NA
PlanetOut 48.1 9.00 10.00 11.1% 145.3 161.4 NA NA NA NA NA NA
CallWave 40.0 10.00 9.93 - 0.7% 189.0 187.7 NA NA NA NA NA NA
Ness Technologies 161.1 12.00 12.46 3.8% 372.3 386.5 NA NA NA NA NA NA
J amdat Mobile 88.8 16.00 31.25 95.3% 316.0 617.2 NA NA NA NA NA NA
WebSideStory 42.5 8.50 9.80 15.3% 132.2 152.4 NA NA NA NA NA NA
Cogent Systems 200.9 12.00 19.40 61.7% 216.0 349.2 NA NA NA NA NA NA
Google 1,916.4 85.00 193.30 127.4% 23,053.7 52,426.8 1.38$ 2.18$ 61.6x 140.1x 39.0x 88.7x
Navteq 1,012.0 22.00 38.95 77.0% 1,927.7 3,412.9 0.63 0.90 34.9x 61.8x 24.4x 43.3x
RightNow Technologies 44.1 7.00 13.65 95.0% 199.4 388.8 0.08 0.15 87.5x 170.6x 46.7x 91.0x
Volterra 36.0 8.00 16.89 111.1% 185.5 391.6 0.16 0.37 50.0x 105.6x 21.6x 45.6x
Blackbaud 64.8 8.00 12.40 55.0% 340.3 527.4 0.51 0.58 15.7x 24.3x 13.8x 21.4x
Kanbay Intl 106.9 13.00 24.41 87.8% 420.7 789.9 0.78 0.88 16.7x 31.3x 14.8x 27.7x
Freescale Semiconductor 1,581.1 13.00 15.80 21.5% 5,239.0 6,367.4 0.90 1.15 14.4x 17.6x 11.3x 13.7x
Phase Forward 39.4 7.50 7.55 0.7% 237.8 239.4 0.13 0.26 57.7x 58.1x 28.8x 29.0x
KongZhong 100.0 10.00 6.80 - 32.0% 342.5 232.9 0.55 0.65 18.2x 12.4x 15.4x 10.5x
NetLogic Microsystems 69.3 12.00 6.57 - 45.2% 226.5 124.0 (0.25) 0.44 NM NM 27.3x 14.9x
Multi- Fineline Electronix 55.7 10.00 12.20 22.0% 232.6 283.7 1.30 1.25 7.7x 9.4x 8.0x 9.8x
Motive 50.0 10.00 15.13 51.3% 251.6 380.6 0.18 0.30 55.6x 84.1x 33.3x 50.4x
Xyratex Group 97.4 14.00 10.97 - 21.6% 394.3 309.0 1.06 1.10 13.2x 10.3x 12.7x 10.0x
Color Kinetics 40.0 10.00 15.94 59.4% 178.8 285.0 NM 0.20 NM NM 50.0x 79.7x
Salesforce.com 110.0 11.00 20.15 83.2% 1,113.8 2,040.3 0.08 0.22 137.5x 251.9x 50.0x 91.6x
Blackboard 77.0 14.00 17.78 27.0% 352.4 447.5 0.25 0.68 56.0x 71.1x 20.6x 26.1x
Leadis Technology 84.0 14.00 7.50 - 46.4% 383.8 205.6 0.68 0.72 20.6x 11.0x 19.4x 10.4x
PowerDsine 69.0 11.50 12.84 11.7% 214.1 239.1 0.15 0.63 76.7x 85.6x 18.3x 20.4x
Blue Nile 76.7 20.50 27.21 32.7% 355.5 471.9 0.46 0.62 44.6x 59.2x 33.1x 43.9x
Shanda 169.0 11.00 31.20 183.6% 767.8 2,177.8 0.59 0.79 18.6x 52.9x 13.9x 39.5x
SiRF Technology 132.0 12.00 11.75 - 2.1% 526.1 515.2 0.49 0.50 24.5x 24.0x 24.0x 23.5x
Marchex 26.0 6.50 14.30 120.0% 157.8 347.2 (0.11) 0.07 NM NM NM NM
Ultra Clean Holdings 42.0 7.00 5.07 - 27.6% 113.7 82.4 0.67 0.90 10.4x 7.6x 7.8x 5.6x
TNS 79.6 18.00 19.55 8.6% 482.0 523.5 0.81 0.93 22.2x 24.1x 19.4x 21.0x
Semiconductor Manufacturing 1,712.9 17.50 10.48 - 40.1% 6,375.3 3,817.9 0.32 0.65 54.7x 32.8x 26.9x 16.1x
TOM Online 175.0 15.55 12.32 - 20.8% 757.3 600.0 1.08 1.43 14.4x 11.4x 10.9x 8.6x
Linktone Ltd. 86.0 14.00 8.30 - 40.7% 366.8 217.5 0.41 0.57 34.1x 20.2x 24.6x 14.6x
Cherokee Intl 95.7 14.50 6.73 - 53.6% 278.1 129.1 0.70 1.15 20.7x 9.6x 12.6x 5.9x
Atheros Communications 144.9 14.00 11.38 - 18.7% 636.3 517.2 0.27 0.43 51.9x 42.1x 32.6x 26.5x
AlphaSmart 26.4 6.00 3.05 - 49.2% 87.8 44.6 0.38 0.46 15.8x 8.0x 13.0x 6.6x
Staktek Holdings 169.0 13.00 3.69 - 71.6% 654.9 185.9 0.49 0.63 26.5x 7.5x 20.6x 5.9x
Average 237.7$ 24.2% 1,256.0$ 2,092.3$ 37.9x 51.6x 23.2x 30.1xMedian 84.0$ 11.7% 342.5$ 380.6$ 25.5x 27.8x 20.6x 21.2x
2005E P/ EStock Price Market Cap Estimated EPS 2004E P/ E
Excludes deals under $30M

Annual EcoSystem Meeting - Technology IPO Perspectives / October 29, 2004 12
Technology IPO Perspectives
2004 Technology IPO Multiples
%Date Company Proceeds @ IPO Current +/ - @ IPO Current 2004 2005 @ IPO Current @ IPO Current
10/26 Shopping.com 18.00 27.36 389.3$ 649.7$ NA NA NA NA NA NA10/21 Telvent GIT SA 9.00 9.11 200.6 203.7 NA NA NA NA NA NA
10/13 PlanetOut 9.00 10.00 106.2 122.4 NA NA NA NA NA NA
9/29 CallWave 10.00 9.93 139.8 138.5 NA NA NA NA NA NA
9/29 Ness Technologies 12.00 12.46 344.8 359.1 NA NA NA NA NA NA
9/28 J amdat Mobile 16.00 31.25 257.2 556.5 NA NA NA NA NA NA
9/27 WebSideStory 8.50 9.80 103.7 123.9 NA NA NA NA NA NA
9/23 Cogent Systems 12.00 19.40 59.9 193.1 NA NA NA NA NA NA
8/24 Google 85.00 193.30 21,400.2 50,773.3 1,747.0 2,257.0 12.2x 29.1x 9.5x 22.5x
8/5 Navteq 22.00 38.95 1,925.3 3,410.5 474.0 572.0 4.1x 7.2x 3.4x 6.0x
8/5 RightNow Technologies 7.00 13.65 154.2 343.6 59.6 80.2 2.6x 5.8x 1.9x 4.3x
7/29 Volterra 8.00 16.89 145.3 351.4 40.0 58.0 3.6x 8.8x 2.5x 6.1x
7/21 Blackbaud 8.00 12.40 334.2 421.9 135.1 150.2 2.5x 3.1x 2.2x 2.8x
7/21 Kanbay Intl 13.00 24.41 357.0 726.3 178.0 222.0 2.0x 4.1x 1.6x 3.3x
7/16 Freescale Semiconductor 13.00 15.80 4,984.1 6,112.5 5,850.0 6,300.0 0.9x 1.0x 0.8x 1.0x
7/14 Phase Forward 7.50 7.55 179.0 180.6 71.9 87.6 2.5x 2.5x 2.0x 2.1x
7/8 KongZhong 10.00 6.80 264.8 155.2 46.0 63.1 5.8x 3.4x 4.2x 2.5x
7/8 NetLogic Microsystems 12.00 6.57 179.6 77.1 47.0 68.0 3.8x 1.6x 2.6x 1.1x
6/25 Multi- Fineline Electronix 10.00 12.20 202.0 253.2 274.7 317.0 0.7x 0.9x 0.6x 0.8x
6/24 Motive 10.00 15.13 174.1 303.1 97.3 110.1 1.8x 3.1x 1.6x 2.8x
6/23 Xyratex Group 14.00 10.97 362.5 277.1 450.6 518.1 0.8x 0.6x 0.7x 0.5x
6/22 Color Kinetics 10.00 15.94 125.0 231.2 37.5 50.0 3.3x 6.2x 2.5x 4.6x
6/22 Salesforce.com 11.00 20.15 971.8 1,898.3 175.8 285.0 5.5x 10.8x 3.4x 6.7x
6/17 Blackboard 14.00 17.78 291.1 386.2 109.8 132.8 2.7x 3.5x 2.2x 2.9x
6/15 Leadis Technology 14.00 7.50 234.4 76.6 154.8 200.0 1.5x 0.5x 1.2x 0.4x
6/9 PowerDsine 11.50 12.84 145.6 170.6 37.0 55.5 3.9x 4.6x 2.6x 3.1x
5/25 Blue Nile 20.50 27.21 299.7 416.1 161.1 201.4 1.9x 2.6x 1.5x 2.1x
5/15 Shanda Interactive Entertainment 11.00 31.20 598.5 2,008.5 120.4 176.9 5.0x 16.7x 3.4x 11.4x
4/22 SiRF Technology 12.00 11.75 436.4 425.5 119.8 150.0 3.6x 3.6x 2.9x 2.8x
3/31 Marchex 6.50 14.30 128.5 317.8 40.8 60.3 3.2x 7.8x 2.1x 5.3x
3/25 Ultra Clean Holdings 7.00 5.07 104.0 72.6 195.8 244.0 0.5x 0.4x 0.4x 0.3x
3/16 TNS 18.00 19.55 552.4 594.0 251.0 272.0 2.2x 2.4x 2.0x 2.2x
3/12 Semiconductor Manufacturing 17.50 10.48 5,445.8 2,888.4 1,023.9 1,631.5 5.3x 2.8x 3.3x 1.8x
3/6 TOM Online 15.55 12.32 591.9 434.6 105.3 138.8 5.6x 4.1x 4.3x 3.1x
3/4 Linktone Ltd. 14.00 8.30 294.2 144.9 47.9 81.7 6.1x 3.0x 3.6x 1.8x
2/20 Cherokee Intl 14.50 6.73 307.6 158.6 140.5 163.0 2.2x 1.1x 1.9x 1.0x
2/12 Atheros Communications 14.00 11.38 498.3 379.2 192.0 253.1 2.6x 2.0x 2.0x 1.5x
2/6 AlphaSmart 6.00 3.05 80.1 36.9 43.2 48.9 1.9x 0.9x 1.6x 0.8x
2/6 Staktek Holdings 13.00 3.69 614.9 145.9 84.3 109.7 7.3x 1.7x 5.6x 1.3x
Average 3.5x 4.7x 2.6x 3.5xMedian 2.7x 3.1x 2.2x 2.5x
Stock Price Enterprise Value Estimated Rev. 2004E EV / Rev 2005E EV / Rev
Excludes deals under $30M

Annual EcoSystem Meeting - Technology IPO Perspectives / October 29, 2004 13
Technology IPO Perspectives
Impact of Election on New Issue Receptivity
2000 Election Equity Issuance Activity1996 Election Equity Issuance Activity
> New issue activity has historically continued through the US election period (including IPOs)
> During the last two election years, November activity levels have been lower than October due to the election and (more importantly) U.S. Thanksgiving Holiday
> Who wins may not be as important as how it is won… divisiveness is not good
0
10
20
30
40
50
60
Sep-30
Oct-0
7
Oct-1
4
Oct-2
1
Oct-2
8
Nov-0
4
Nov-1
1
Nov-1
8
Nov-2
5
Dec-02
Dec-09
Dec-16
Num
ber
of Is
sues
0.0
1.0
2.0
3.0
4.0
5.0
6.0
$ Volu
me ($
B)
I PO Follow-on Total $ Volume
Election Date:November 5, 1996
0
2
4
6
8
10
12
14
16
18
20
Oct-0
2
Oct-0
9
Oct-1
6
Oct-2
3
Oct-3
0
Nov-0
6
Nov-1
3
Nov-2
0
Nov-2
7
Dec-04
Dec-11
Dec-18
Num
ber
of Is
sues
0.0
1.0
2.0
3.0
4.0
5.0
6.0
$ Volu
me ($
B)
I PO Follow-on Total $ Volume
Election Date:November 7, 2000
Source: Dealogic, Equidesk

Annual EcoSystem Meeting - Technology IPO Perspectives / October 29, 2004 14
Technology IPO Perspectives
Asia’s Billion Boomers: The Case for Asia
> Domestic consumption and infrastructure spending is driving Asian economic growth
> All Asian economies will continue to report good economic growth. Intra-regional
trade will continue to grow faster than the region’s trade with Europe and America
> The economic growth center of gravity has shifted from U.S./Europe to China/India.
India and China dominate the region and impact the world
> Asia’s Billion Boomers will underpin regional economic growth just as America’s baby
boomers shaped the U.S. economy from 1963-1999
> Asian natives with Silicon Valley executive experience are populating decision-making
roles at companies, leading to greater comfort for U.S. investors
> Increased presence by U.S. VCs adding to diligence comfort level
> 5 IPOs in 2004; several in the shadow pipeline

Annual EcoSystem Meeting - Technology IPO Perspectives / October 29, 2004 15
Technology IPO Perspectives
What are Company Metrics for a Technology IPO?
Sizable end-market opportunity with leading market position
Product and customer diversification
Good visibility one year forward (the period valuation will be based upon)
Critical mass – at least annual revenue rate of $60 mm
Demonstrated momentum through quarterly sequential revenue and earnings growth
Profitability in year of issuance
Post-money market capitalization of at least $200 million
Experienced management

Annual EcoSystem Meeting - Technology IPO Perspectives / October 29, 2004 16
2 2005 IPO Market Outlook

Annual EcoSystem Meeting - Technology IPO Perspectives / October 29, 2004 17
Semiconductors26%
Software31%
Semi C ap Equipment
21%
Miscellaneous11%
Services & I nternet Related
11%
2005 IPO Market Outlook
Technology IPOs Currently in Registration
> 19 Technology IPOs in registration versus 10 at same time last year
> Semiconductors and Software are largest sector components, consistent with history
> Demands of marketplace are being heard… creating better supply/demand
equilibrium
Distribution by # of IPOs

Annual EcoSystem Meeting - Technology IPO Perspectives / October 29, 2004 18
2005 IPO Market Outlook
Software IPO Market Outlook
> Overall sentiment for the software IPO market is “fair”
> Salesforce.com and RightNow Technologies were both fairly well received
• Up 83% and 95% respectively since IPO
> Market will demand double digit revenue growth and profitability
> Companies will need to project $80 – 100M of revenue within 18 months of an IPO
> Uncertainty whether there is a “hot” area in the application sector
> Security remains very strong within infrastructure software
Annual EcoSystem Meeting - Technology IPO Perspectives / October 29, 2004 19
2005 IPO Market Outlook
Semiconductor IPO Market Outlook
> Only 4 of the 11 IPOs have outperformed Nasdaq since going public
> Famously cyclical market
> Inventory movements exacerbate cycle
> Ever present threat of disruptive technologies
> September pre-announcements spooked market
• Temporary inventory correction? or beginning of cyclical downturn?
> Wall Street has bi-polar view
• Pollyanna or chicken little?
• All eyes on a few marquee names

Annual EcoSystem Meeting - Technology IPO Perspectives / October 29, 2004 20
2005 IPO Market Outlook
> 2004 CapEx by carriers was a catch-up year; 2005 looks to be modestly up for
wireless and more robust for wireline
• FTTx trials hope to convert to revenue
> Enterprise IT spending expected to grow slightly faster than economic growth (5%+)
• Key areas of focus are security, storage, IP everywhere
> Combination of factors make public markets difficult
• Concentrated customer base
• Accounting (revenue recognition)
• Quarterly volatility / lumpiness of orders
> Some segments will be more attractive
• Security
• Broadband/Triple play
Communications IPO Market Outlook

Annual EcoSystem Meeting - Technology IPO Perspectives / October 29, 2004 21
3 Google Case Study

Annual EcoSystem Meeting - Technology IPO Perspectives / October 29, 2004 22
Google Case Study
Google: A Dutch-Auction Experiment
Filing Data Pricing DataTotal Shares: 25,697,529 shares 19,605,052 shares By Google: 14,142,135 shares 14,142,135 shares By selling shareholders: 11,555,394 shares 5,462,917 Price: $108 - $135 range $85
> Despite feverish anticipation, Google failed to price within its range
> After choosing an auction methodology designed to leave no “money-on-the-table”, Google priced below its range (43% below mid-point), and then saw its stock rise immediately after the IPO
• Google’s shares traded up 18% after the first day of trading, and 25% after the first week
> The auction process spooked institutional investors who feared involvement in an offering where terms could be significantly affected by retail investors
• 60% of Google’s publicly traded shares are held by retail investors, which leads to the potential for excessive volatility
> In addition to the lessons learned regarding auctions, Google’s IPO reinforced common wisdom regarding the IPO process
• Avoid silly gun-jumping mistakes
• Take care to adhere to all federal and blue sky requirements relating to options and private company stock
• Avoid conducting a roadshow in August