CONFIDENCE STATEMENT MARGIN OF ERROR CONFIDENCE INTERVAL 1.
23
CONFIDENCE STATEMENT MARGIN OF ERROR CONFIDENCE INTERVAL 1
-
Upload
phillip-summers -
Category
Documents
-
view
246 -
download
4
Transcript of CONFIDENCE STATEMENT MARGIN OF ERROR CONFIDENCE INTERVAL 1.

CONFIDENCE STATEMENTMARGIN OF ERROR
CONFIDENCE INTERVAL1

Class Objective
After this class, you will be able to-Determine and interpret a Confidence Statement
2

Terminologies and symbol• Sample proportion: p (p-hat) – one type of statistic
Example: n (sample size) = 70
15 out of n say “No”
p = 25%
• Population proportion: P – one type of parameter
• We use p-hat to infer P

Class Activity: Draw Samples of different sample size
• Assume there are only 50 residents in CT. • You want to find out the average number of how many times CT residents go to movie per month.
• Use the first two rows of number of your random number table to simulate the response of the 50 residents.
• Use the sample size n=1, n=5, n= 25 to find the range of the sample means for different sample sizes.

Class Work
What can you conclude from the class activity –Draw Samples of different sizes
5

Conclusion
•Larger the sample size – smaller the error made in inference
•Always use a larger sample size whenever it is possible

Confidence Statements
• Definition: a fact about what happens in all possible samples
• Say how much we can trust the result of one sample
• Has 2 parts:• Margin of error: how close the (sample) statistic lies to the (population) parameter
• Level of confidence: what percentage of all possible samples satisfy the margin of error
7
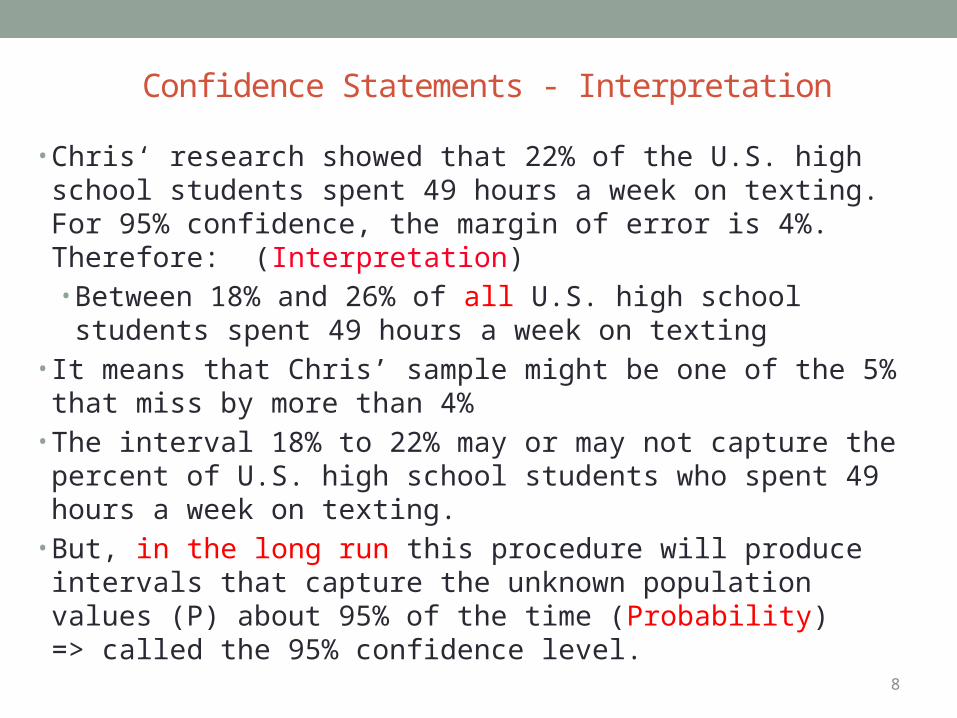
Confidence Statements - Interpretation
• Chris‘ research showed that 22% of the U.S. high school students spent 49 hours a week on texting. For 95% confidence, the margin of error is 4%. Therefore: (Interpretation)• Between 18% and 26% of all U.S. high school students
spent 49 hours a week on texting• It means that Chris’ sample might be one of the 5% that miss
by more than 4%• The interval 18% to 22% may or may not capture the percent
of U.S. high school students who spent 49 hours a week on texting.
• But, in the long run this procedure will produce intervals that capture the unknown population values (P) about 95% of the time (Probability)=> called the 95% confidence level. 8

9
The Importance of Religion for Adult Americans
Poll of n = 1025 adult Americans: “How important would you say religion is in your own life?”
Very important 56%Fairly important 25%Not very important 19%
Margin of error is 3%:
NOW, you try to interpret the findings of subject survey.

10
The Importance of Religion for Adult Americans
Approx. 95% confidence interval for the percent of all adult Americans who say religion is very important:
56% - 3% or 53% to 59%
The interval 53% to 59% may or may not capture the percent of adult Americans who considered religion to be very important in their lives.
But, in the long run this procedure will produce intervals that capture the unknown population values about 95% of the time => called the 95% confidence level.

Class Work
So we know how to interpret a confidence statement. What will be the next question regarding a confidence
statement?
11

12
Margin of Error: The Accuracy of Sample Surveys
The sample proportion and the population proportion with a certain trait or opinion differ by less than the margin of error in at least 95% of all random samples.
Conservative margin of error =
Add and subtract the margin of error to create an approximate 95% confidence interval.
%1001
n

13
Confidence Intervals
95% Confidence Interval for a Population Proportion:
For about 95% of properly conducted sample surveys,
the interval
sample proportion to sample proportion
will contain the actual population proportion.
Another way to write it: sample proportion
n
1
n
1
n
1

A “Quick” method for Margin of Error
• Use the sample proportion p from a simple random sample of size n to estimate an unknown population parameter P. The margin of error for 95% confidence is roughly equal to 1 /
• Example:• The researcher Amanda interviewed 9500 students
about whether they owned an iphone. 550 (58%) students said yes. The margin error for 95% confidence will be about 1/ 950 = 0.03 = 3%
• The margin of error for the interview is plus and minus 3 % = 55 % to 61%
14

Now you try it
• In December 2012, the Callup Poll asked a random sample of 1007 adults, “Thinking of your own situation, do you personally own a cat, a dog, both, or neither?” It is found that 59% said they owned a cat, a dog, or both. Write a confidence statement and interpret it!
15

Class Work
For the same sample, a 99% confidence statement would have a larger or smaller
(which one is the answer) margin of error than a 95% confidence statement. Explain why.
16

Confidence Statements
• For the same sample, a 99% confidence statement will have a larger margin of error than a 95% confidence statement
17

Class Work
What would be the relationship between sample size and margin of
error?
18

19
Choosing a Sample Size for a Survey
If m.e. is the desired margin of error for a 95% confidence interval for a population proportion, the required sample size is:
2..
1
emn

Confidence Statements
• To have a smaller margin of error (means smaller variability) a larger sample size is needed ( 1/ square root of n)
20

Confidence Statements
• The conclusion of a confidence statement applies to the population, not to the sample.
• The conclusion about the population is never completely certain
21

22
The Effect of Population Size
The m.e. for a sample of 1000 is about 3% whether the population size is 30,000 or 200 million. (inferential statistics – we use sample to infer the population)
In practice, as long as the population size is ≥ 10 times as large as the sample size, the population size has almost no influence on the accuracy of sample estimates.

Homework• Assignment: • Chapter 5 Exercise 5.25 and 5.30 • • Reading:• Chapter 5 – p. 152-156