Confidence Interval for p Reasonable Range of Values for True Population Proportion p.
53
Confidence Confidence Interval for p Interval for p Reasonable Range of Reasonable Range of Values for True Values for True Population Proportion p Population Proportion p
-
date post
21-Dec-2015 -
Category
Documents
-
view
221 -
download
0
Transcript of Confidence Interval for p Reasonable Range of Values for True Population Proportion p.
Confidence Confidence Interval for pInterval for pReasonable Range of Values Reasonable Range of Values
for True Population for True Population Proportion pProportion p
Confidence Interval for pConfidence Interval for p
The goal is to take a sample and be The goal is to take a sample and be able to make intelligent guesses able to make intelligent guesses about the true value of the about the true value of the proportion p in the population.proportion p in the population.
A valuable tool is the confidence A valuable tool is the confidence interval: the range of values for p in interval: the range of values for p in the population that could reasonably the population that could reasonably have produced the sample p-hat we have produced the sample p-hat we observed.observed.
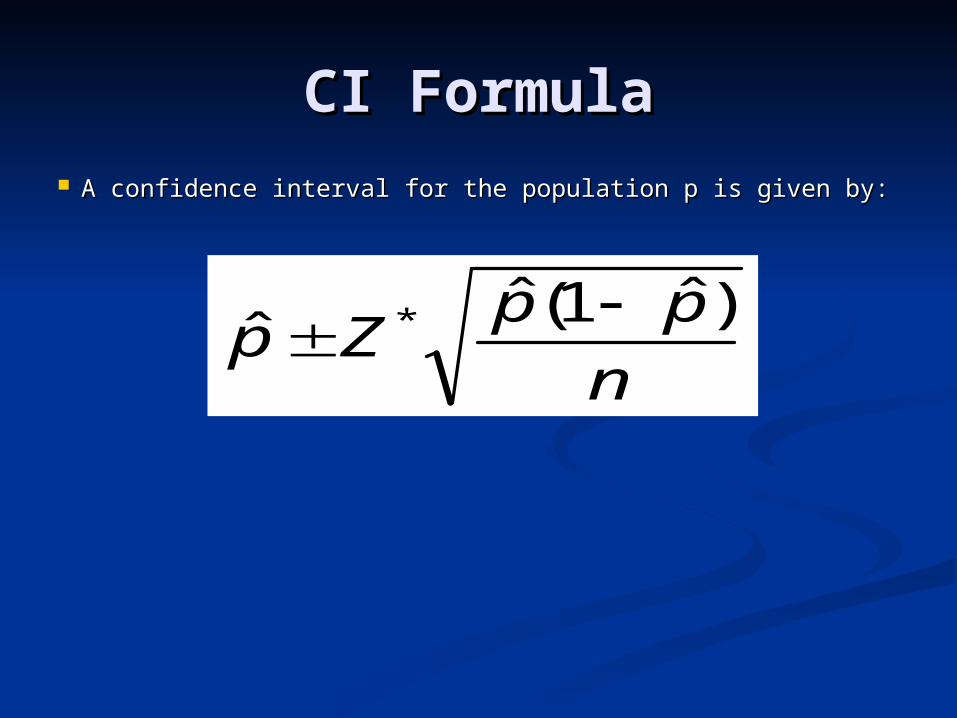
CI FormulaCI Formula A confidence interval for the population p is given by:A confidence interval for the population p is given by:
n
ppZp
)ˆ1(ˆˆ *
CI FormulaCI Formula
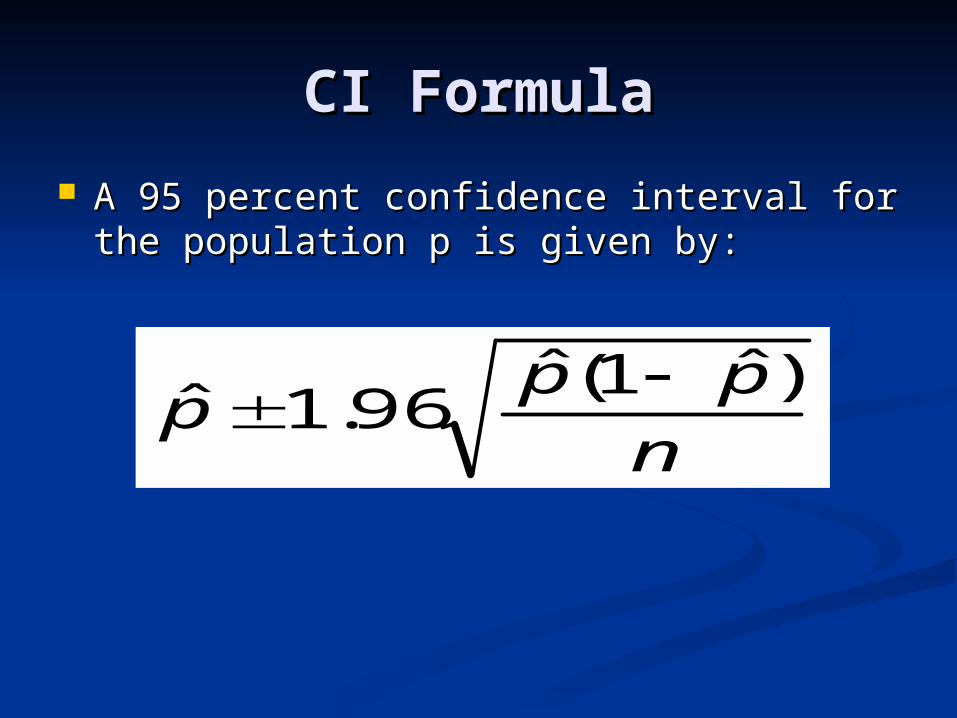
A 95 percent confidence interval for the A 95 percent confidence interval for the population p is given by:population p is given by:
n
ppp
)ˆ1(ˆ96.1ˆ
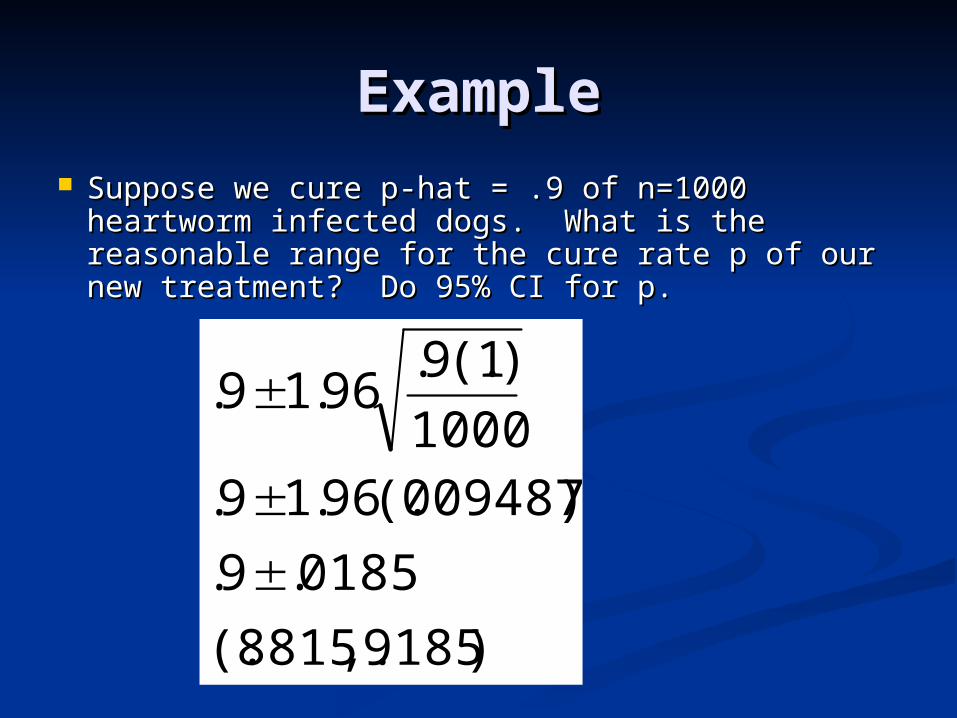
ExampleExample Suppose we cure p-hat = .9 of n=1000 Suppose we cure p-hat = .9 of n=1000
heartworm infected dogs. What is the heartworm infected dogs. What is the reasonable range for the cure rate p of our new reasonable range for the cure rate p of our new treatment? Do 95% CI for p.treatment? Do 95% CI for p.
)9185,.8815(.
0185.9.
)009487(.96.19.1000
)1(.9.96.19.
ExampleExample
Reasonable range for p (.88, .92) is Reasonable range for p (.88, .92) is same range argued in previous same range argued in previous section on sampling distributions for section on sampling distributions for p-hat.p-hat.
The only reasonable values for p are The only reasonable values for p are those that could produce p-hats only those that could produce p-hats only a couple of standard deviations a couple of standard deviations removed from the truth.removed from the truth.
Reeses Pieces ExampleReeses Pieces Example
What is the proportion of orange candies, What is the proportion of orange candies, p?p?
To study this unknown, but very important To study this unknown, but very important value p, we will construct confidence value p, we will construct confidence intervals for p from samples of candies.intervals for p from samples of candies.
Each bag represents a random sample of Each bag represents a random sample of size n from the population of these candies.size n from the population of these candies.
From each bag your group should: find n, From each bag your group should: find n, p-hat, and 95% confidence bounds for p.p-hat, and 95% confidence bounds for p.
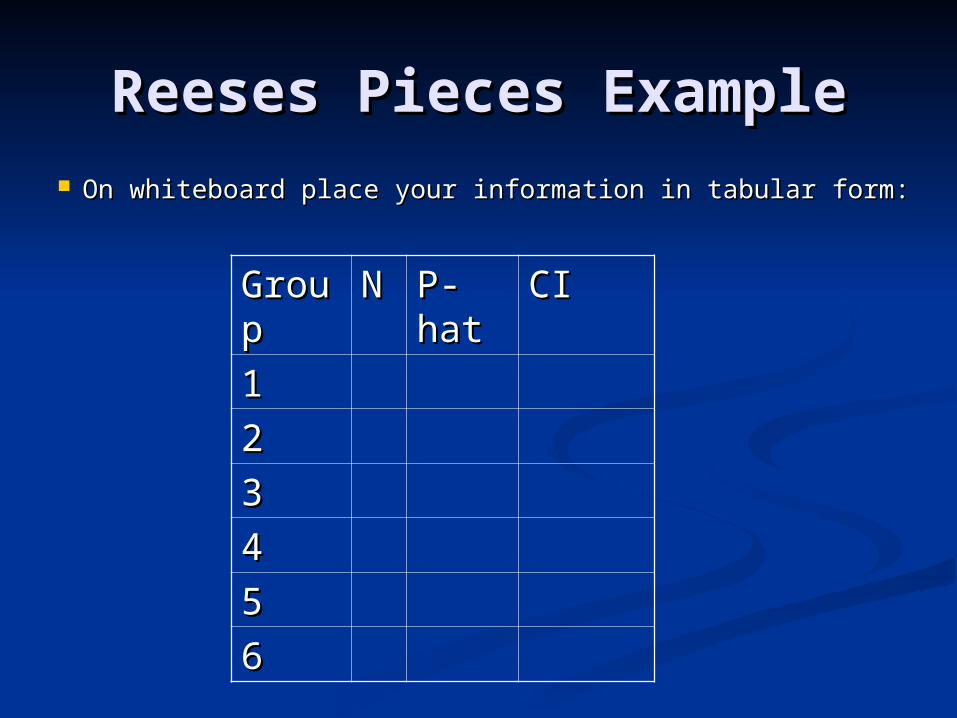
Reeses Pieces ExampleReeses Pieces Example On whiteboard place your information in tabular form:On whiteboard place your information in tabular form:
GrouGroupp
NN P-P-hathat
CICI
11
22
33
44
55
66
Reeses Pieces ExampleReeses Pieces Example
A histogram of p-hat values should A histogram of p-hat values should result in a representation of the result in a representation of the sampling distribution of p-hat.sampling distribution of p-hat.
The center of this histogram should The center of this histogram should be p. What do you think p is?be p. What do you think p is?
Reeses Pieces ExampleReeses Pieces Example
From the CI’s, what do you think the From the CI’s, what do you think the true p is?true p is?
Is an evenly distributed color Is an evenly distributed color distribution p=1/3, a reasonable distribution p=1/3, a reasonable hypothesis based on our data? Why hypothesis based on our data? Why or why not?or why not?
Pay attention to the written Pay attention to the written conclusion I provide on the board !conclusion I provide on the board !
Vietnam Veterans Vietnam Veterans Divorce RateDivorce Rate
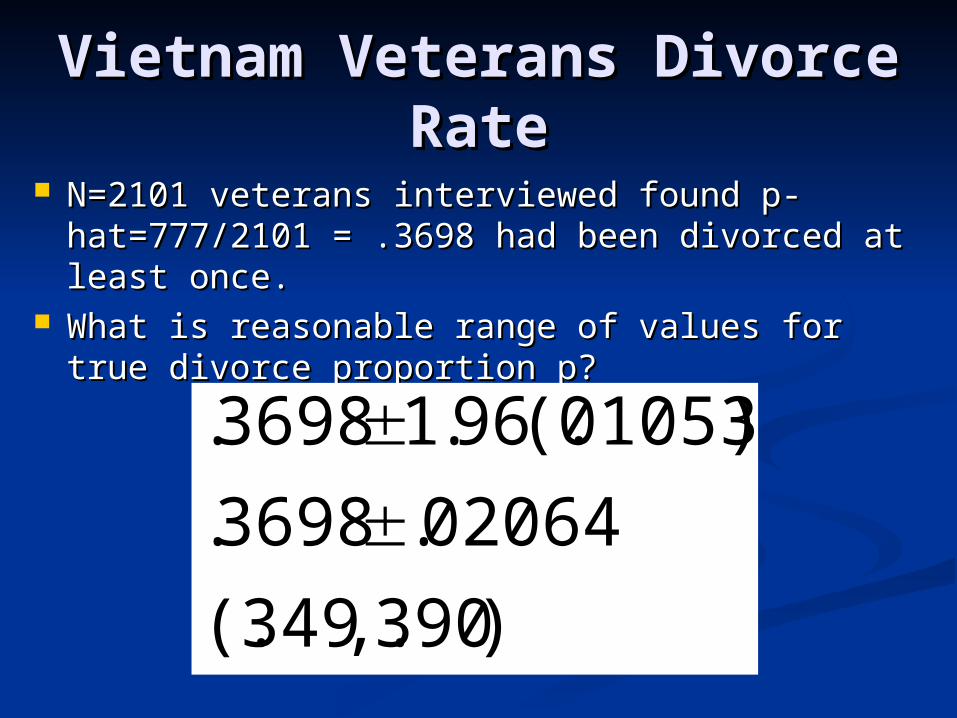
N=2101 veterans interviewed found p-N=2101 veterans interviewed found p-hat=777/2101 = .3698 had been divorced at hat=777/2101 = .3698 had been divorced at least once.least once.
What is reasonable range of values for true What is reasonable range of values for true divorce proportion p?divorce proportion p?
)390,.349(.
02064.3698.
)01053(.96.13698.
Vietnam Vets DivorcesVietnam Vets Divorces
Do you think true divorce proportion Do you think true divorce proportion is greater than .5?is greater than .5?
Ans: No. The reasonable range of Ans: No. The reasonable range of values for the true p is (.349, .390). values for the true p is (.349, .390). This range is entirely below p=.5, so This range is entirely below p=.5, so we have strong evidence that the we have strong evidence that the true divorce proportion is BELOW .5 true divorce proportion is BELOW .5 not above it.not above it.
Vietnam Vets DivorcesVietnam Vets Divorces
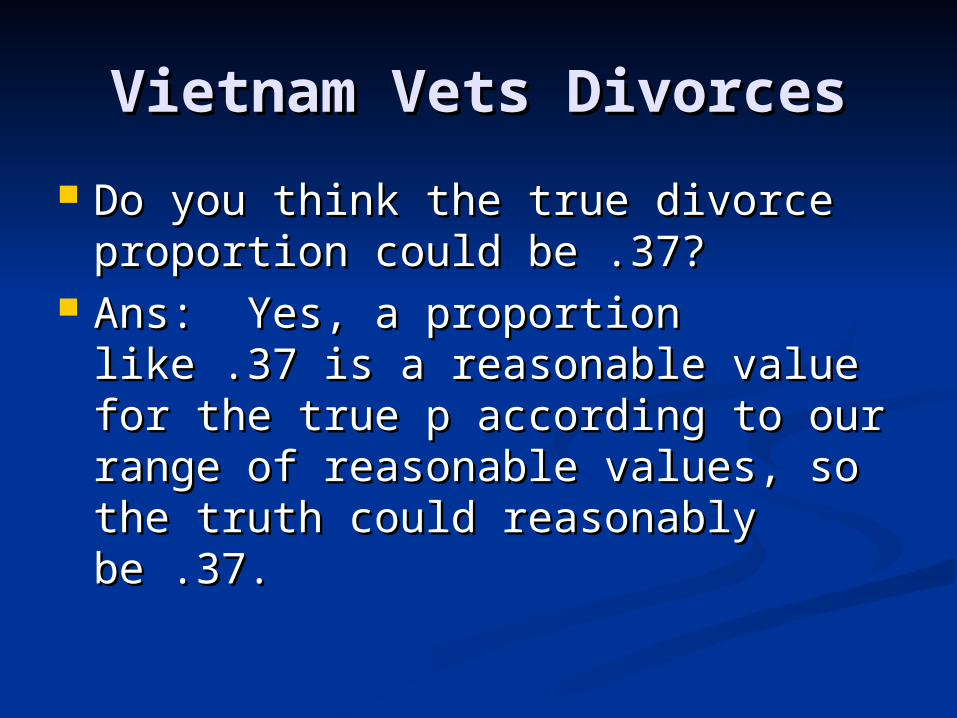
Do you think the true divorce Do you think the true divorce proportion could be .37?proportion could be .37?
Ans: Yes, a proportion like .37 is a Ans: Yes, a proportion like .37 is a reasonable value for the true p reasonable value for the true p according to our range of reasonable according to our range of reasonable values, so the truth could reasonably values, so the truth could reasonably be .37.be .37.
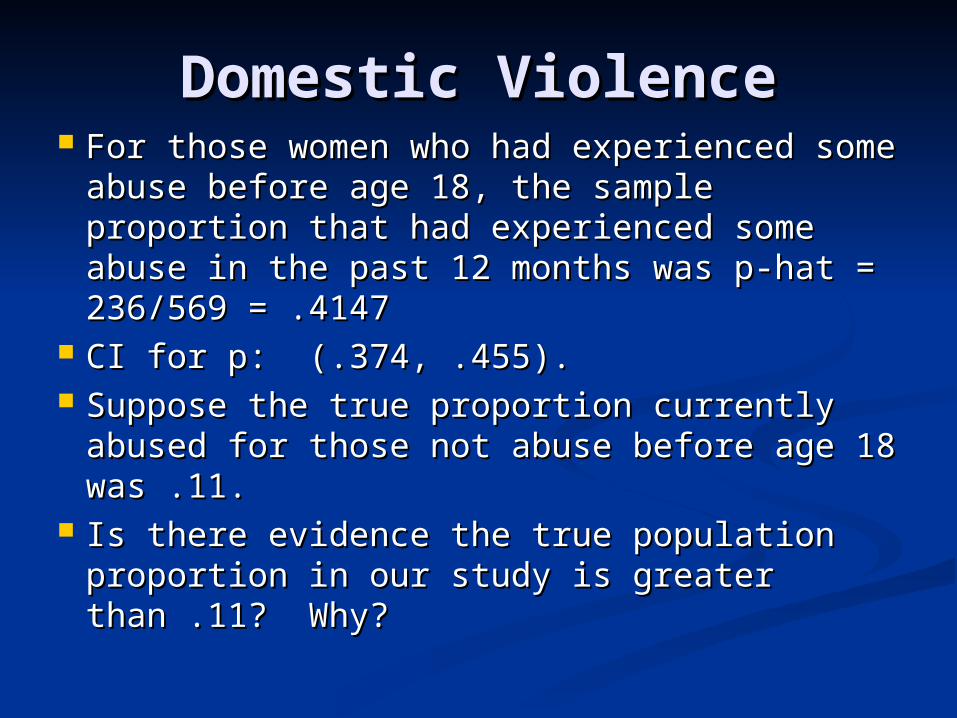
Domestic ViolenceDomestic Violence For those women who had experienced some For those women who had experienced some
abuse before age 18, the sample proportion abuse before age 18, the sample proportion that had experienced some abuse in the past that had experienced some abuse in the past 12 months was p-hat = 236/569 = .414712 months was p-hat = 236/569 = .4147
CI for p: (.374, .455).CI for p: (.374, .455). Suppose the true proportion currently Suppose the true proportion currently
abused for those not abuse before age 18 abused for those not abuse before age 18 was .11.was .11.
Is there evidence the true population Is there evidence the true population proportion in our study is greater than .11? proportion in our study is greater than .11? Why?Why?
Ask Marilyn – Let’s Make Ask Marilyn – Let’s Make a Deala Deal
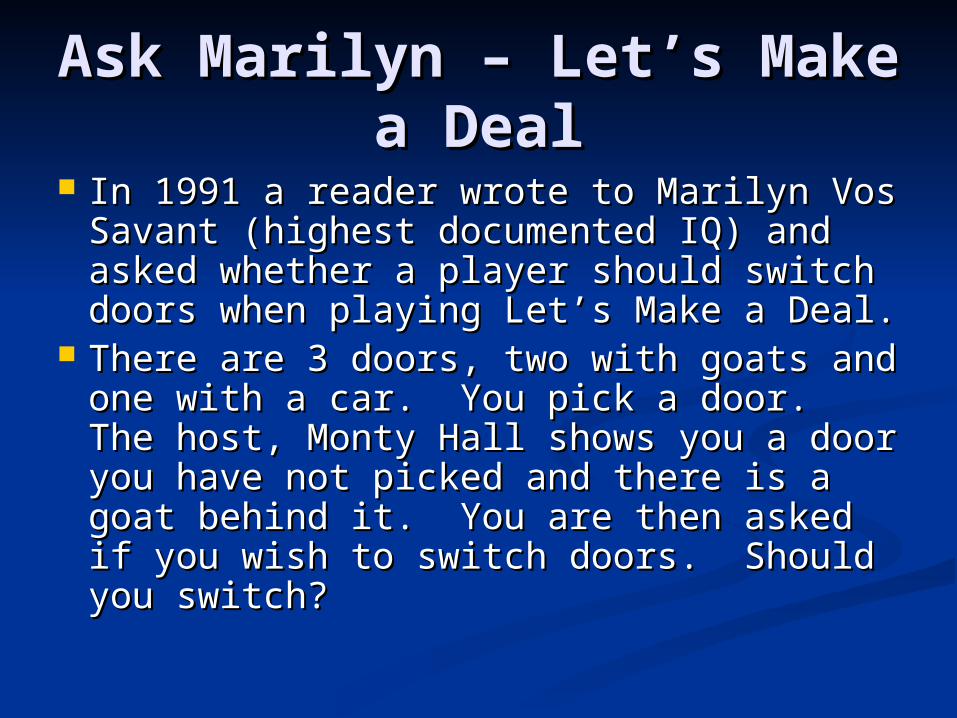
In 1991 a reader wrote to Marilyn Vos In 1991 a reader wrote to Marilyn Vos Savant (highest documented IQ) and Savant (highest documented IQ) and asked whether a player should switch asked whether a player should switch doors when playing Let’s Make a Deal.doors when playing Let’s Make a Deal.
There are 3 doors, two with goats and There are 3 doors, two with goats and one with a car. You pick a door. The one with a car. You pick a door. The host, Monty Hall shows you a door you host, Monty Hall shows you a door you have not picked and there is a goat have not picked and there is a goat behind it. You are then asked if you behind it. You are then asked if you wish to switch doors. Should you wish to switch doors. Should you switch?switch?
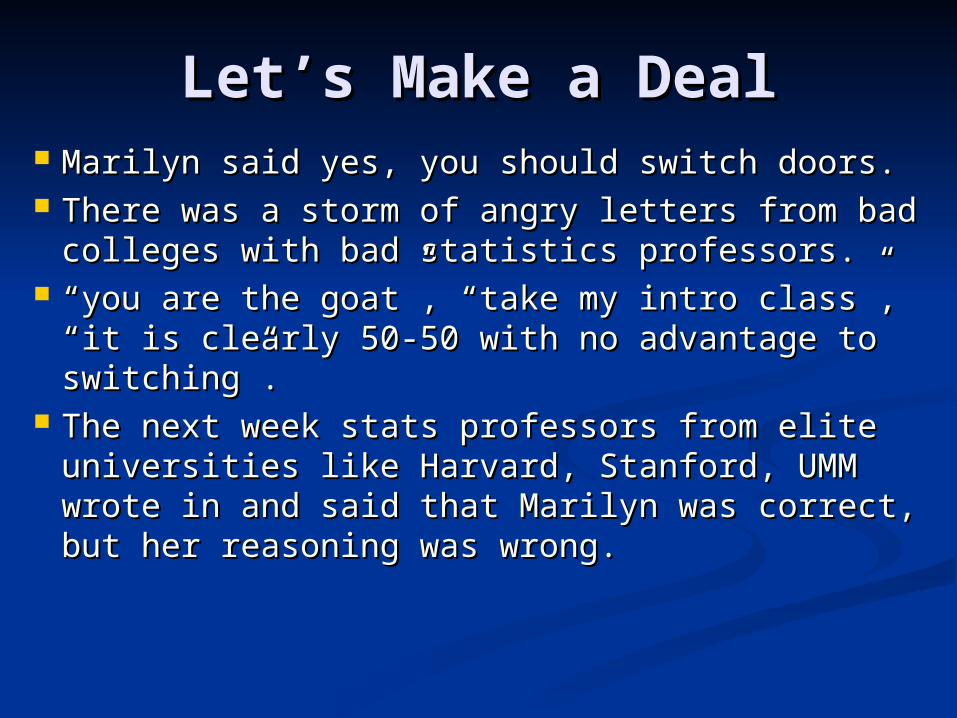
Let’s Make a DealLet’s Make a Deal Marilyn said yes, you should switch doors.Marilyn said yes, you should switch doors. There was a storm of angry letters from There was a storm of angry letters from
bad colleges with bad statistics professors.bad colleges with bad statistics professors. ““you are the goat”, “take my intro class”, you are the goat”, “take my intro class”,
“it is clearly 50-50 with no advantage to “it is clearly 50-50 with no advantage to switching”.switching”.
The next week stats professors from elite The next week stats professors from elite universities like Harvard, Stanford, UMM universities like Harvard, Stanford, UMM wrote in and said that Marilyn was correct, wrote in and said that Marilyn was correct, but her reasoning was wrong.but her reasoning was wrong.
Let’s Make a DealLet’s Make a Deal
Let’s play the game on the computer Let’s play the game on the computer simulation, be sure to play the strategy of simulation, be sure to play the strategy of switching doors after a goat is shown to switching doors after a goat is shown to you. Keep track of how many times you you. Keep track of how many times you win divided by the number of plays. win divided by the number of plays. Compute p-hat.Compute p-hat.
Who is right? Marilyn or the bad Who is right? Marilyn or the bad professors?professors?
Do a 95% CI for p, the proportion of Do a 95% CI for p, the proportion of switches that result in winning the car. switches that result in winning the car.
Level of ConfidenceLevel of Confidence
A CI for p includes a statement of a A CI for p includes a statement of a confidence level, usually 95%. confidence level, usually 95%.
You should know how to compute You should know how to compute confidence intervals for any level of confidence intervals for any level of confidence, but particularly for 80%, confidence, but particularly for 80%, 90%, 95%, 98%, 99%.90%, 95%, 98%, 99%.
The formula is the same for each, The formula is the same for each, but the Z multiplier changes.but the Z multiplier changes.
Z MultiplierZ Multiplier
For any confidence level, the Z For any confidence level, the Z multiplier is obtained by drawing a multiplier is obtained by drawing a standard normal curve and then placing standard normal curve and then placing symmetric boundaries around the mean symmetric boundaries around the mean zero. zero.
For a 95% interval these boundaries For a 95% interval these boundaries should contain 95% of the observations should contain 95% of the observations within these bounds. That means there within these bounds. That means there is 2.5% of the observations outside is 2.5% of the observations outside these bounds in each tail to add to the these bounds in each tail to add to the remaining 5%.remaining 5%.
Finding Z*Finding Z*
Z-MultiplierZ-Multiplier
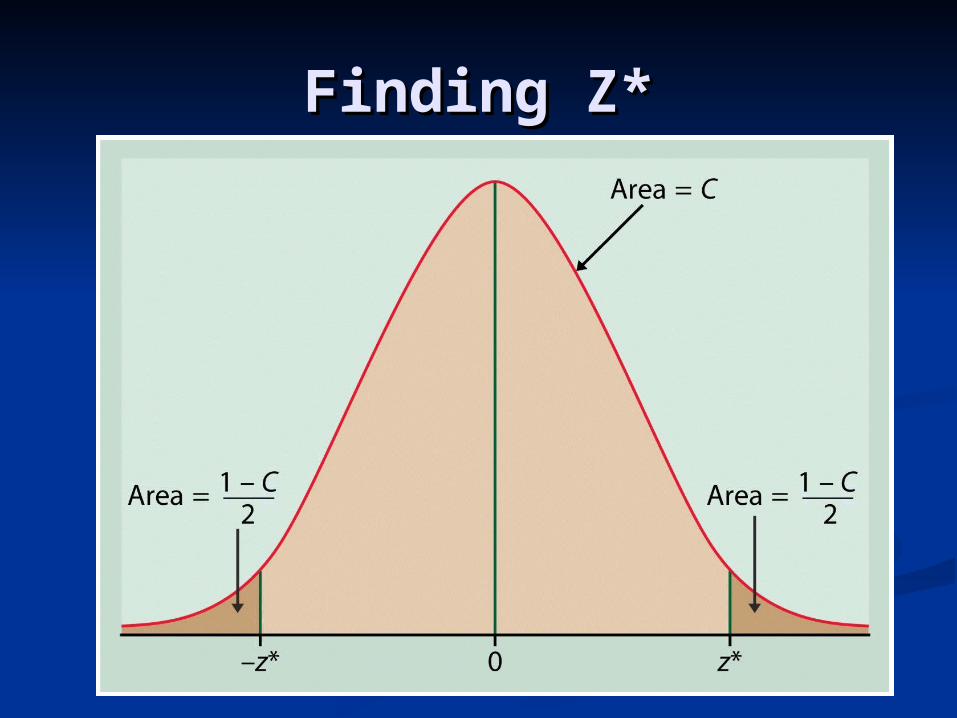
This means that the upper boundary is This means that the upper boundary is at the 97.5 percentile, and the lower at the 97.5 percentile, and the lower boundary is at the 2.5 percentile.boundary is at the 2.5 percentile.
Use your normal table and look up in Use your normal table and look up in the middle for .975 (97.5%), go to the the middle for .975 (97.5%), go to the edges to observe that the z-value edges to observe that the z-value corresponding to this point is 1.96. corresponding to this point is 1.96. That is why we have used 1.96 for the That is why we have used 1.96 for the 95% CI multiplier.95% CI multiplier.
Other Z-MultipliersOther Z-Multipliers
You should be able to verify that the You should be able to verify that the correct multipliers for other correct multipliers for other confidence levels are: 1.28, 1.64, confidence levels are: 1.28, 1.64, 2.33, 2.57. 2.33, 2.57.
Do you know how these were Do you know how these were obtained?obtained?
What Does 95% Confidence What Does 95% Confidence Mean Anyway?Mean Anyway?
A 95% CI means that the method used A 95% CI means that the method used to construct the interval will produce to construct the interval will produce intervals containing the true p in about intervals containing the true p in about 95% of the intervals constructed.95% of the intervals constructed.
This means that if the 95% CI method This means that if the 95% CI method was used in 100 samples, we should was used in 100 samples, we should expect that about 95 of the intervals expect that about 95 of the intervals will contain the true p, and about 5 will contain the true p, and about 5 intervals should miss the true p.intervals should miss the true p.
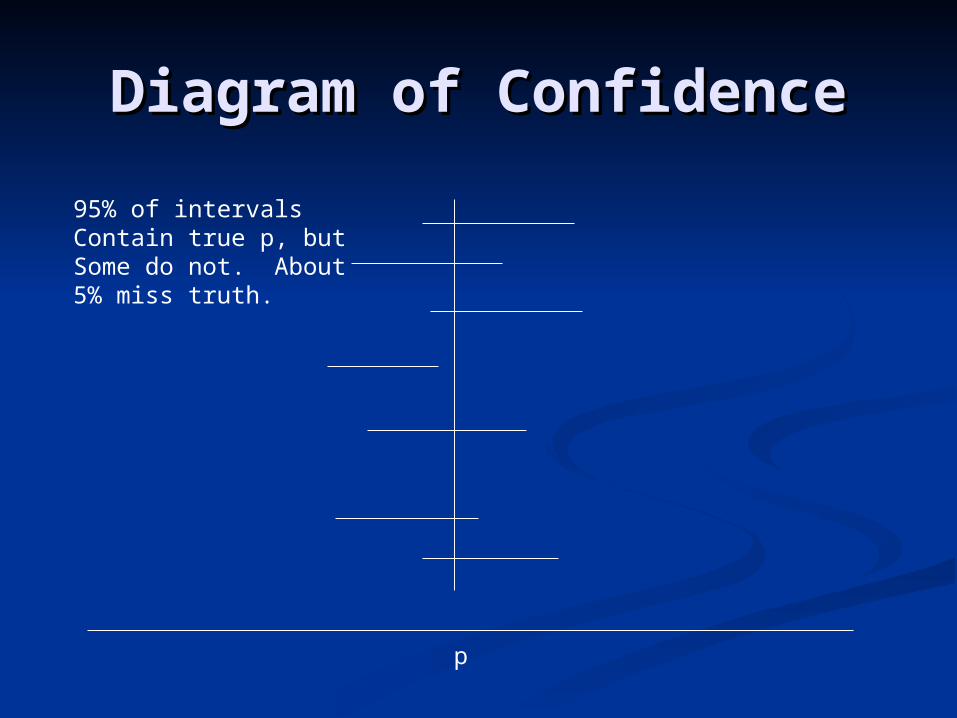
Diagram of ConfidenceDiagram of Confidence
p
95% of intervalsContain true p, butSome do not. About5% miss truth.
CI MeaningCI Meaning
We never know if our CI has We never know if our CI has contained the true p or not, but we contained the true p or not, but we know the method we used has the know the method we used has the property that it catches the truth property that it catches the truth 90% of the time (for a 90% CI), so it 90% of the time (for a 90% CI), so it probably has done well in our study, probably has done well in our study, or at least is not far from the truth.or at least is not far from the truth.
Butterfly NetButterfly Net
A confidence interval is like a butterfly A confidence interval is like a butterfly net for catching the true p within its net for catching the true p within its boundaries. boundaries.
Take a swing at the butterfly (p) with Take a swing at the butterfly (p) with your net (CI), you have a known your net (CI), you have a known reliability of catching the butterfly (p), reliability of catching the butterfly (p), say 90%, but you will never know if say 90%, but you will never know if your net caught the butterfly or not, just your net caught the butterfly or not, just that it is typically a good method for that it is typically a good method for catching butterflies, and so it was catching butterflies, and so it was probably good for you too!probably good for you too!
Percent ConfidencePercent Confidence
The percent confidence refers to the The percent confidence refers to the reliability of the CI method to reliability of the CI method to produce intervals that contain the produce intervals that contain the true p. true p.
Why not do a 100% confidence Why not do a 100% confidence interval? Then we would be interval? Then we would be completely sure that the interval has completely sure that the interval has contained the true p.contained the true p.
100 % CI for p100 % CI for p
A 100% CI for p is (0, 1), this A 100% CI for p is (0, 1), this interval is sure to contain the true p. interval is sure to contain the true p.
However this is not very useful. This However this is not very useful. This illustrates the trade-off between illustrates the trade-off between %confidence and the usefulness of %confidence and the usefulness of the interval to simplify the world.the interval to simplify the world.
We usually choose 90, 95, or 99 We usually choose 90, 95, or 99 percent confidence levels.percent confidence levels.
CI Cautions !CI Cautions ! Don’t suggest that the parameter varies: There Don’t suggest that the parameter varies: There
is a 95% chance the true proportion is is a 95% chance the true proportion is between .37 and .42. YUCK!! It sounds like the between .37 and .42. YUCK!! It sounds like the true proportion is wandering around like an true proportion is wandering around like an intoxicated (blank) fan. (Fill in your most hated intoxicated (blank) fan. (Fill in your most hated sports team in the blank). The true p is fixed, sports team in the blank). The true p is fixed, not random.not random.
Don’t claim that other samples will agree with Don’t claim that other samples will agree with yours: 95% of samples will have proportions yours: 95% of samples will have proportions supporting proposal X between .37 and .42. supporting proposal X between .37 and .42. NOPE!! This range is not about sample NOPE!! This range is not about sample proportions as this statement implies.proportions as this statement implies.
CI Cautions ! CI Cautions ! (Continued)(Continued)
Don’t be certain about the parameter: The Don’t be certain about the parameter: The cure rate is between 37 and 42 percent. cure rate is between 37 and 42 percent. UGG !! This makes it seem like the true p UGG !! This makes it seem like the true p could never be outside this range. We are not could never be outside this range. We are not sure of this, just sorta-kinda-sure.sure of this, just sorta-kinda-sure.
Don’t forget: It’s the parameter (not the Don’t forget: It’s the parameter (not the statistic): Never, ever say that we are 95% statistic): Never, ever say that we are 95% sure the sample proportion is between .37 and sure the sample proportion is between .37 and .42. DUH ! There is NO uncertainty in this, it .42. DUH ! There is NO uncertainty in this, it HAS to be true.HAS to be true.
Don’t claim to know too much.Don’t claim to know too much. Do take responsibility (for the uncertainty).Do take responsibility (for the uncertainty).
CI Cautions ! CI Cautions ! (Continued)(Continued)
Don’t claim to know too much: “I’m 95% Don’t claim to know too much: “I’m 95% confident that between 37 and 42 percent confident that between 37 and 42 percent of people in the universe are lunkheads.” of people in the universe are lunkheads.” Well your population really wasn’t the Well your population really wasn’t the whole universe, just Podunk State U. whole universe, just Podunk State U.
Do take responsibility (for the Do take responsibility (for the uncertainty): You are the one who is uncertainty): You are the one who is uncertain, not the parameter p. You must uncertain, not the parameter p. You must accept that only 95% of CI’s will contain accept that only 95% of CI’s will contain the true value of p.the true value of p.
Usefulness of CI’sUsefulness of CI’s
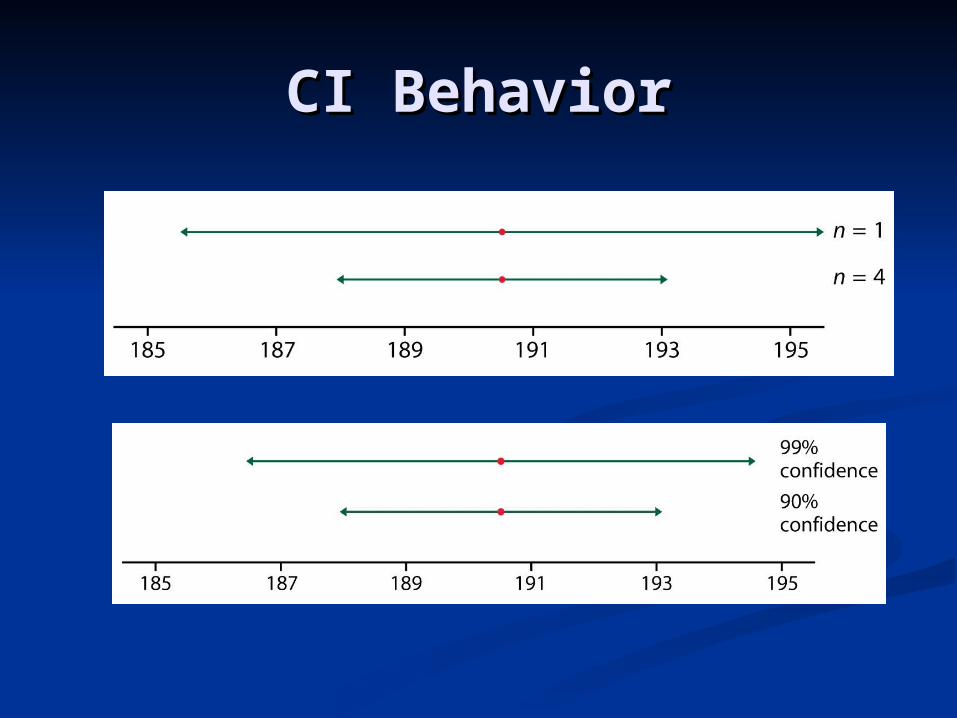
There is a trade-off between reliability There is a trade-off between reliability (confidence) and the width of the (confidence) and the width of the interval.interval.
Increasing confidence means the interval Increasing confidence means the interval width becomes greater (wider). By width becomes greater (wider). By increasing the sample size, n, the increasing the sample size, n, the interval becomes narrower.interval becomes narrower.
How big should the sample size be to get How big should the sample size be to get useful, precise information about the useful, precise information about the population p?population p?
CI BehaviorCI Behavior
Margin of ErrorMargin of Error
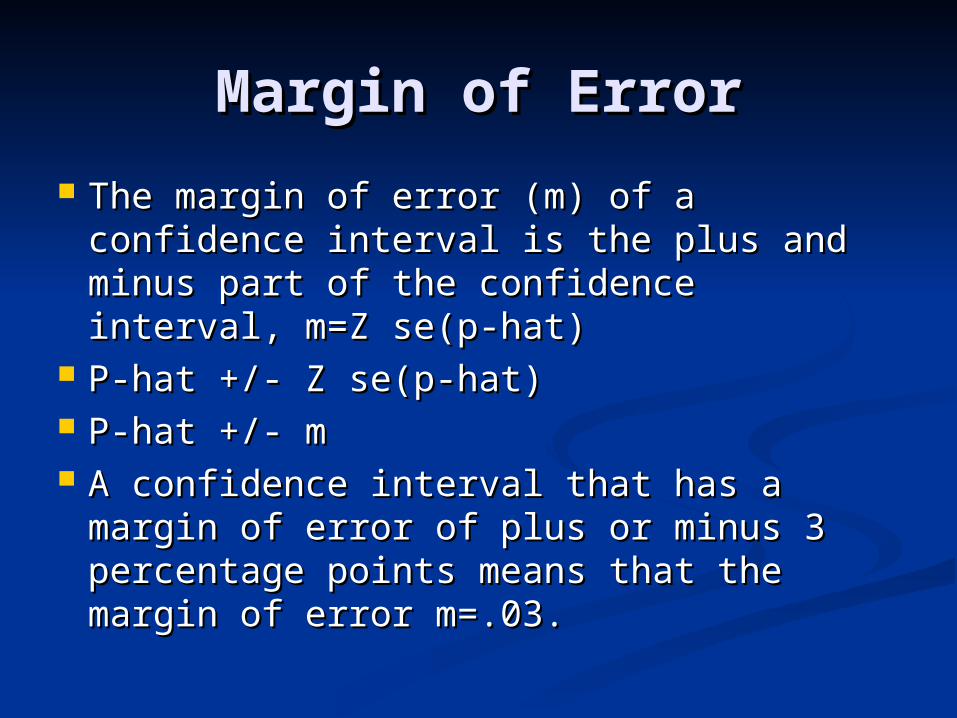
The margin of error (m) of a confidence The margin of error (m) of a confidence interval is the plus and minus part of interval is the plus and minus part of the confidence interval, m=Z se(p-hat)the confidence interval, m=Z se(p-hat)
P-hat +/- Z se(p-hat)P-hat +/- Z se(p-hat) P-hat +/- mP-hat +/- m A confidence interval that has a margin A confidence interval that has a margin
of error of plus or minus 3 percentage of error of plus or minus 3 percentage points means that the margin of error points means that the margin of error m=.03.m=.03.
Margin of ErrorMargin of Error
From the formula m=Z se (p-hat), you From the formula m=Z se (p-hat), you can see that the margin of error can see that the margin of error depends on the confidence level (Z depends on the confidence level (Z multiplier) and through the sample size multiplier) and through the sample size n inside the expression for se(p-hat).n inside the expression for se(p-hat).
A common problem in statistics is to A common problem in statistics is to figure out what sample size will be figure out what sample size will be needed to obtain the desired accuracy needed to obtain the desired accuracy (margin of error m).(margin of error m).
Sample Size FormulaSample Size Formula
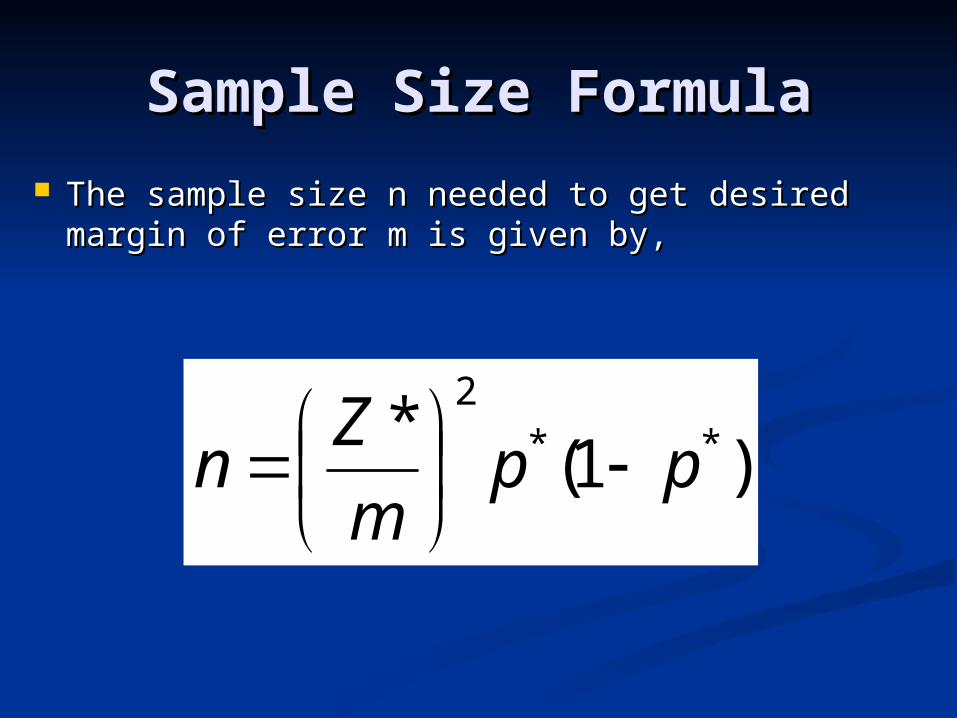
The sample size n needed to get desired The sample size n needed to get desired margin of error m is given by,margin of error m is given by,
)1(* **
2
ppm
Zn
Sample SizeSample Size
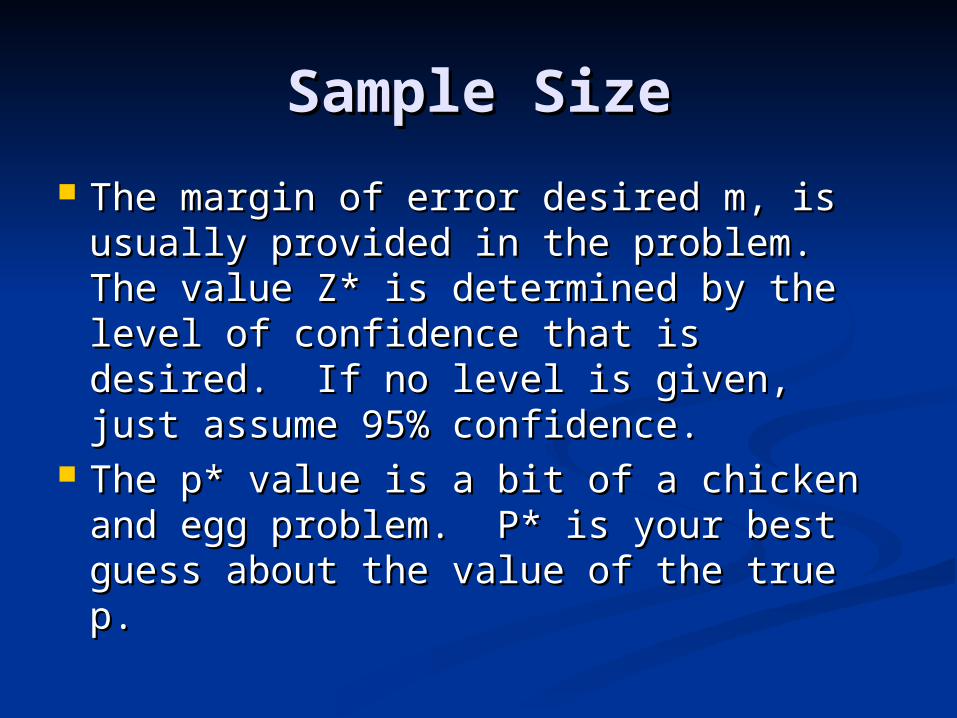
The margin of error desired m, is The margin of error desired m, is usually provided in the problem. usually provided in the problem. The value Z* is determined by the The value Z* is determined by the level of confidence that is desired. If level of confidence that is desired. If no level is given, just assume 95% no level is given, just assume 95% confidence.confidence.
The p* value is a bit of a chicken and The p* value is a bit of a chicken and egg problem. P* is your best guess egg problem. P* is your best guess about the value of the true p.about the value of the true p.
Sample SizeSample Size
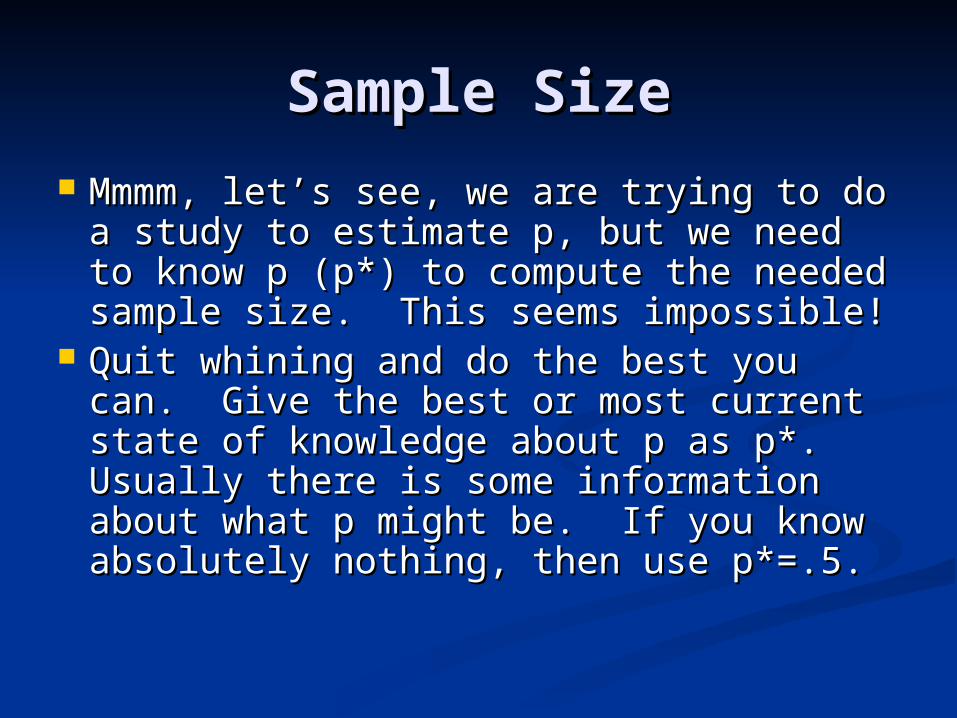
Mmmm, let’s see, we are trying to do Mmmm, let’s see, we are trying to do a study to estimate p, but we need to a study to estimate p, but we need to know p (p*) to compute the needed know p (p*) to compute the needed sample size. This seems impossible!sample size. This seems impossible!
Quit whining and do the best you Quit whining and do the best you can. Give the best or most current can. Give the best or most current state of knowledge about p as p*. state of knowledge about p as p*. Usually there is some information Usually there is some information about what p might be. If you know about what p might be. If you know absolutely nothing, then use p*=.5.absolutely nothing, then use p*=.5.
Why use p*=.5?Why use p*=.5?
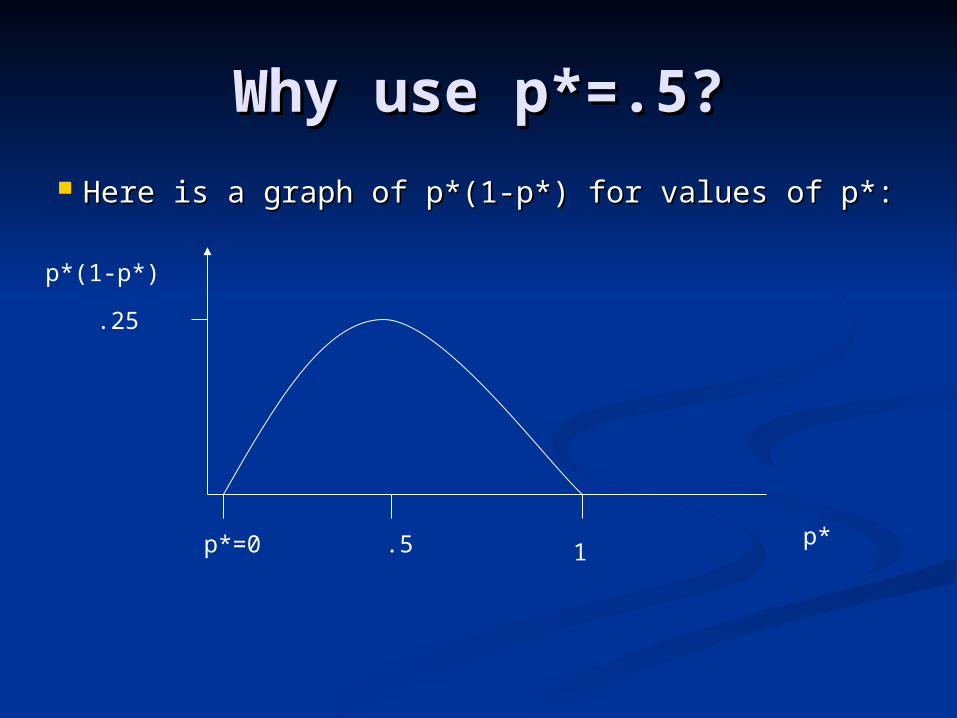
Here is a graph of p*(1-p*) for values of p*:Here is a graph of p*(1-p*) for values of p*:
p*p*=0 .5 1
p*(1-p*)
.25
Why use p*=.5Why use p*=.5
The graph shows that p*(1-p*) will be The graph shows that p*(1-p*) will be largest when p*=.5. This means the largest when p*=.5. This means the sample size will be largest when p*=.5. sample size will be largest when p*=.5. This means that the sample size will This means that the sample size will be at least as big as actually needed. be at least as big as actually needed.
This is called being conservative This is called being conservative because you are using more data than because you are using more data than would actually be needed to achieve would actually be needed to achieve the margin of error desired.the margin of error desired.
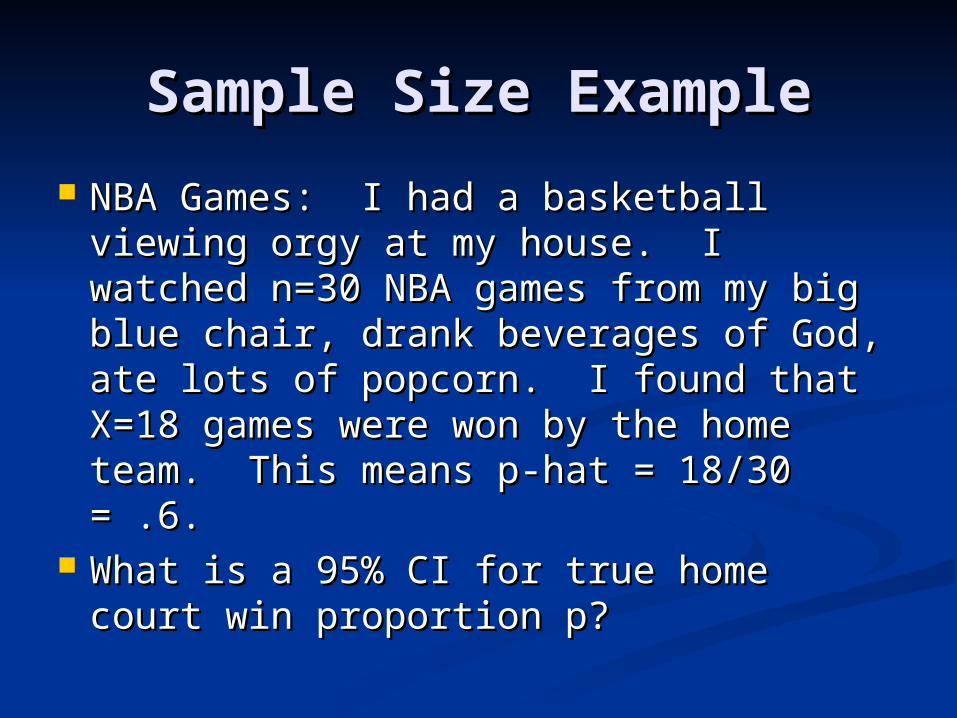
Sample Size ExampleSample Size Example
NBA Games: I had a basketball NBA Games: I had a basketball viewing orgy at my house. I watched viewing orgy at my house. I watched n=30 NBA games from my big blue n=30 NBA games from my big blue chair, drank beverages of God, ate chair, drank beverages of God, ate lots of popcorn. I found that X=18 lots of popcorn. I found that X=18 games were won by the home team. games were won by the home team. This means p-hat = 18/30 = .6.This means p-hat = 18/30 = .6.
What is a 95% CI for true home court What is a 95% CI for true home court win proportion p?win proportion p?
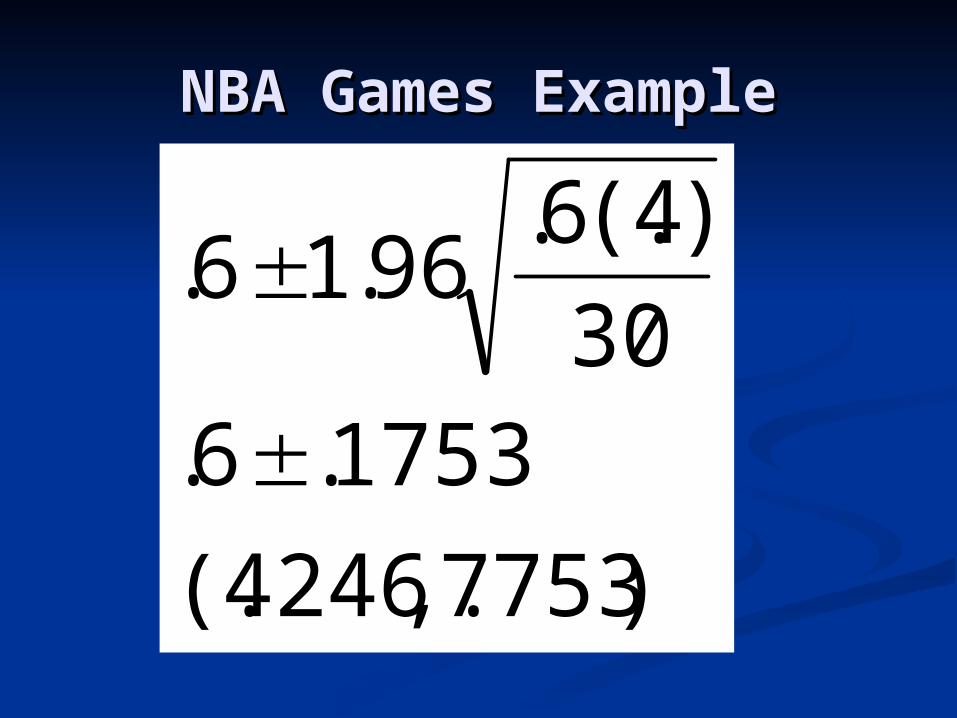
NBA Games ExampleNBA Games Example
)7753,.4246(.
1753.6.30
)4(.6.96.16.
NBA Games ExampleNBA Games Example Plausible range of values for true home Plausible range of values for true home
court winning proportion was (.42, .78). court winning proportion was (.42, .78). This is not very helpful, I knew this even This is not very helpful, I knew this even before the first popcorn kernel popped. before the first popcorn kernel popped.
Why was the procedure not more Why was the procedure not more helpful?helpful?
Problem was the margin of error. It was Problem was the margin of error. It was huge ! It was about m=.17, .18. The huge ! It was about m=.17, .18. The sample size was too small to make our sample size was too small to make our inference more precise. We need a inference more precise. We need a bigger sample size. How big?bigger sample size. How big?
NBA Sample SizeNBA Sample Size
Suppose we wish to obtain a margin Suppose we wish to obtain a margin of error of m=.02 in a 95% CI for p. of error of m=.02 in a 95% CI for p. What sample size is needed?What sample size is needed?
n=(1.96/.02)^2 .6(1-.6) = 2304.96n=(1.96/.02)^2 .6(1-.6) = 2304.96 Round up to n=2305 games. Oh Joy! Round up to n=2305 games. Oh Joy!
What a fiesta !What a fiesta ! Note that our best knowledge was the Note that our best knowledge was the
small study done at my house, there small study done at my house, there p-hat =.6 so it is our best knowledge p-hat =.6 so it is our best knowledge of the true p, so p*=.6.of the true p, so p*=.6.
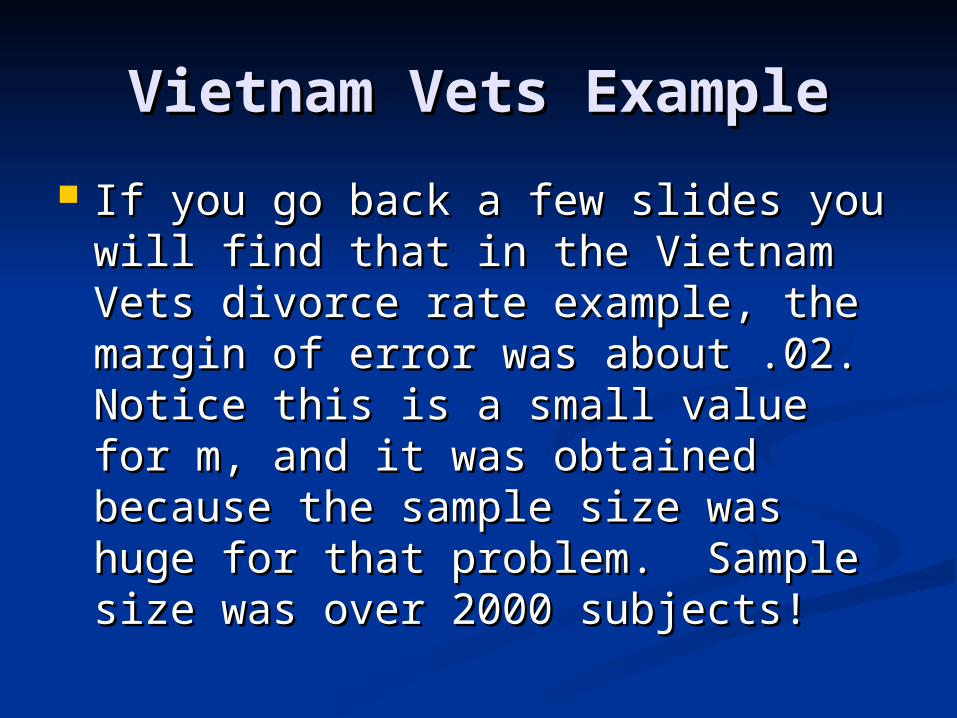
Vietnam Vets ExampleVietnam Vets Example
If you go back a few slides you will If you go back a few slides you will find that in the Vietnam Vets divorce find that in the Vietnam Vets divorce rate example, the margin of error rate example, the margin of error was about .02. Notice this is a small was about .02. Notice this is a small value for m, and it was obtained value for m, and it was obtained because the sample size was huge because the sample size was huge for that problem. Sample size was for that problem. Sample size was over 2000 subjects!over 2000 subjects!
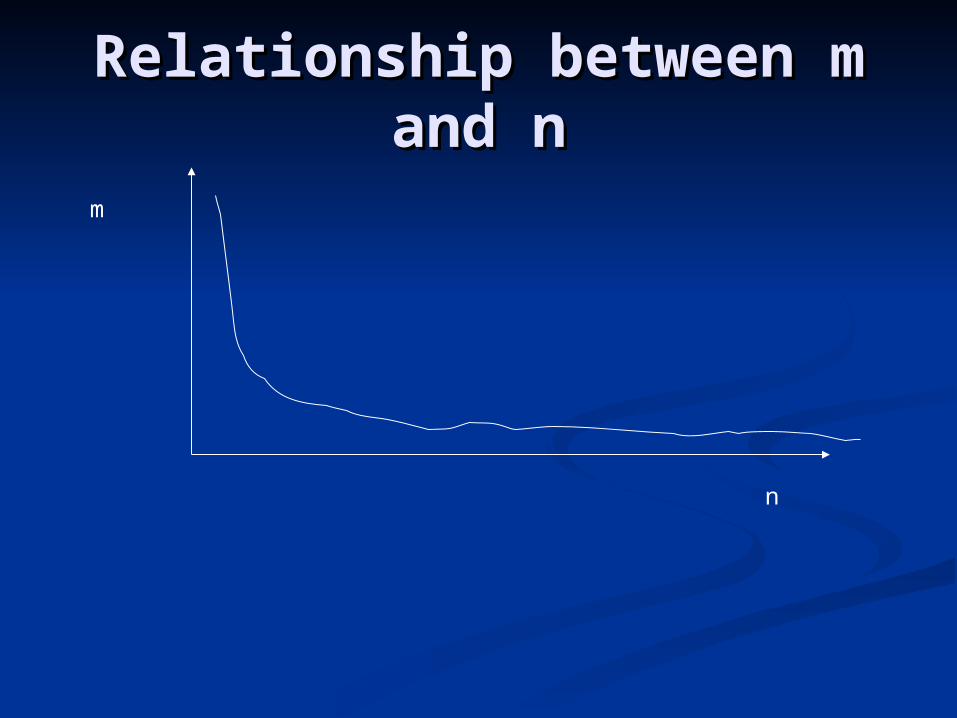
Relationship between m Relationship between m and nand n
n
m
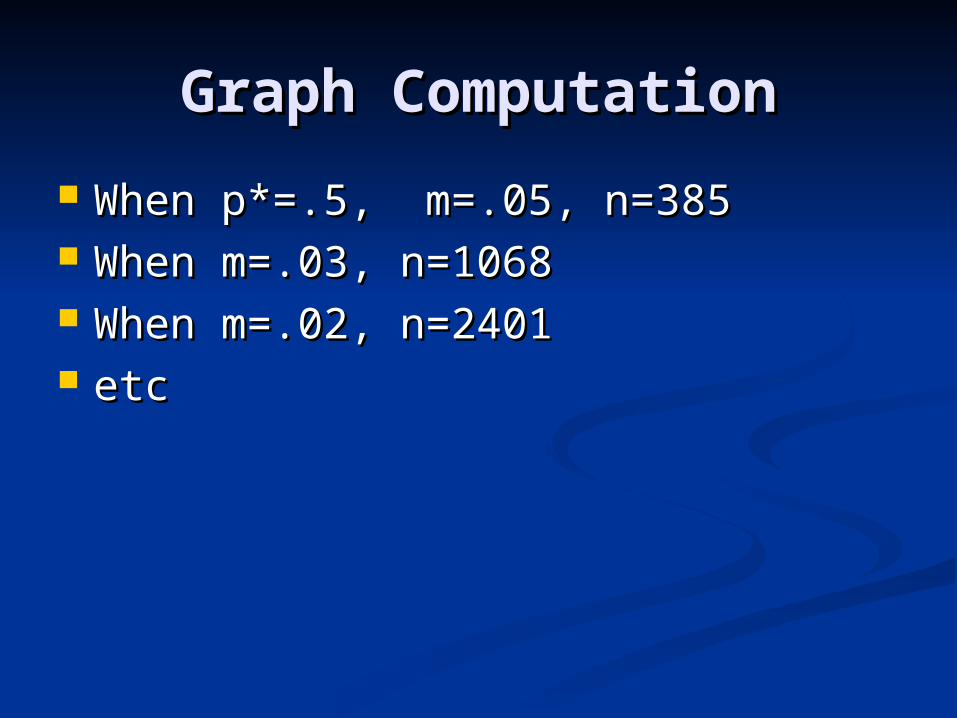
Graph ComputationGraph Computation
When p*=.5, m=.05, n=385When p*=.5, m=.05, n=385 When m=.03, n=1068When m=.03, n=1068 When m=.02, n=2401When m=.02, n=2401 etcetc
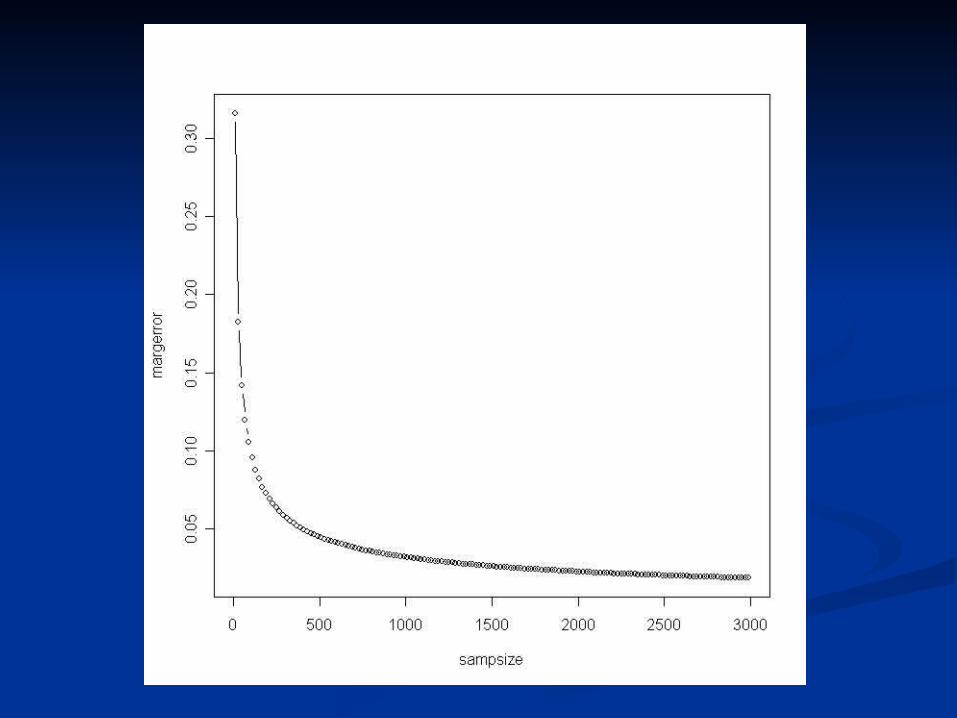
Relationship between m Relationship between m and nand n
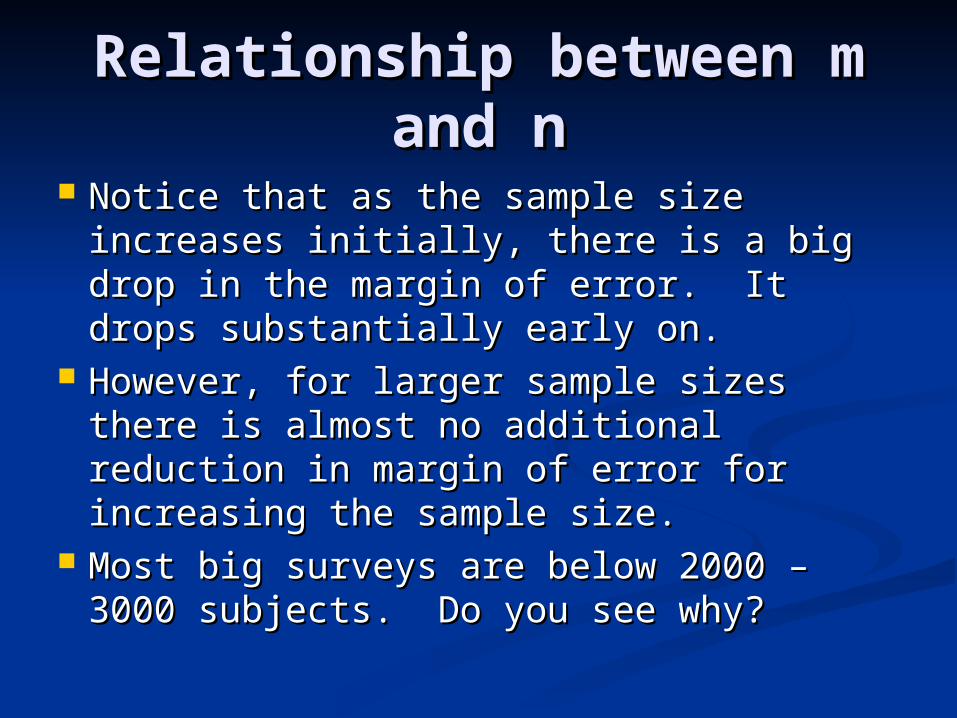
Notice that as the sample size increases Notice that as the sample size increases initially, there is a big drop in the margin initially, there is a big drop in the margin of error. It drops substantially early on.of error. It drops substantially early on.
However, for larger sample sizes there is However, for larger sample sizes there is almost no additional reduction in margin almost no additional reduction in margin of error for increasing the sample size.of error for increasing the sample size.
Most big surveys are below 2000 – 3000 Most big surveys are below 2000 – 3000 subjects. Do you see why?subjects. Do you see why?
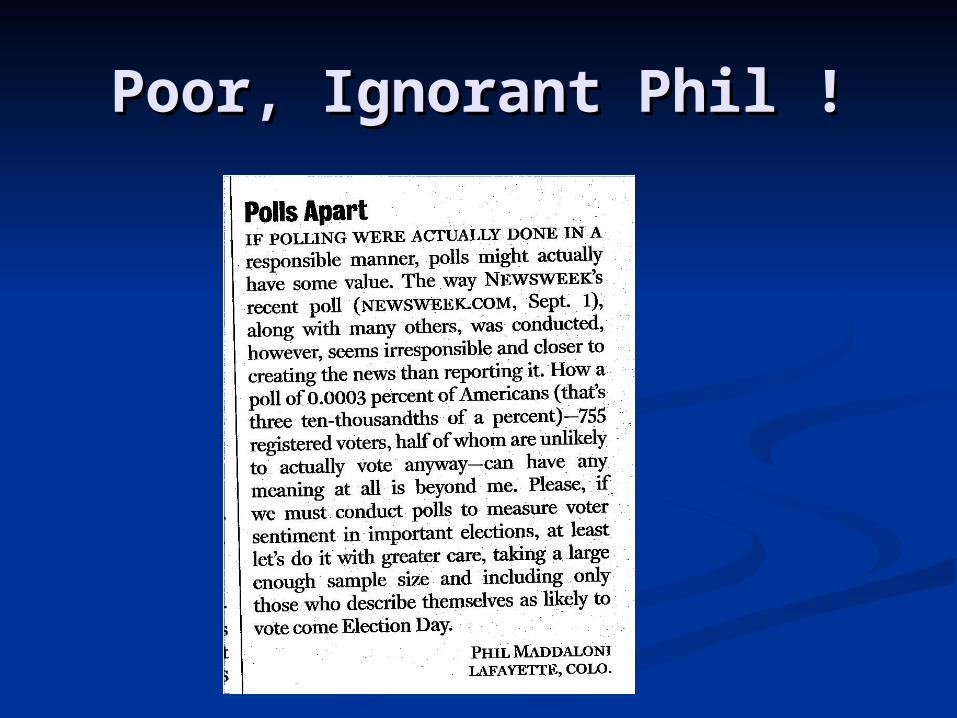
Poor, Ignorant Phil !Poor, Ignorant Phil !
Right Eye DominanceRight Eye Dominance
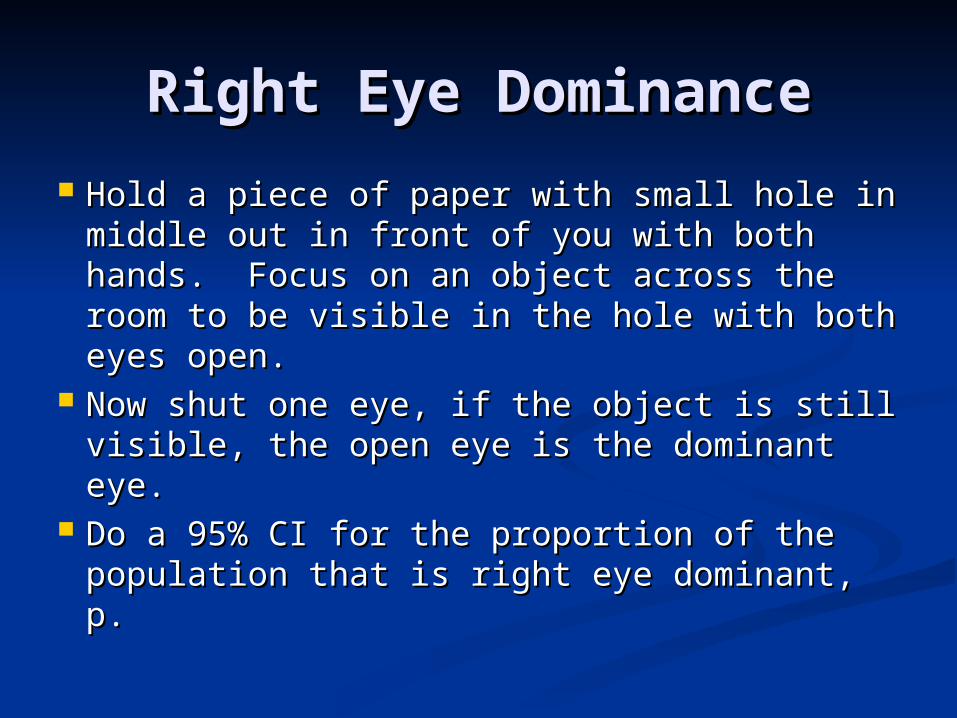
Hold a piece of paper with small hole in Hold a piece of paper with small hole in middle out in front of you with both middle out in front of you with both hands. Focus on an object across the hands. Focus on an object across the room to be visible in the hole with both room to be visible in the hole with both eyes open. eyes open.
Now shut one eye, if the object is still Now shut one eye, if the object is still visible, the open eye is the dominant eye. visible, the open eye is the dominant eye.
Do a 95% CI for the proportion of the Do a 95% CI for the proportion of the population that is right eye dominant, p.population that is right eye dominant, p.
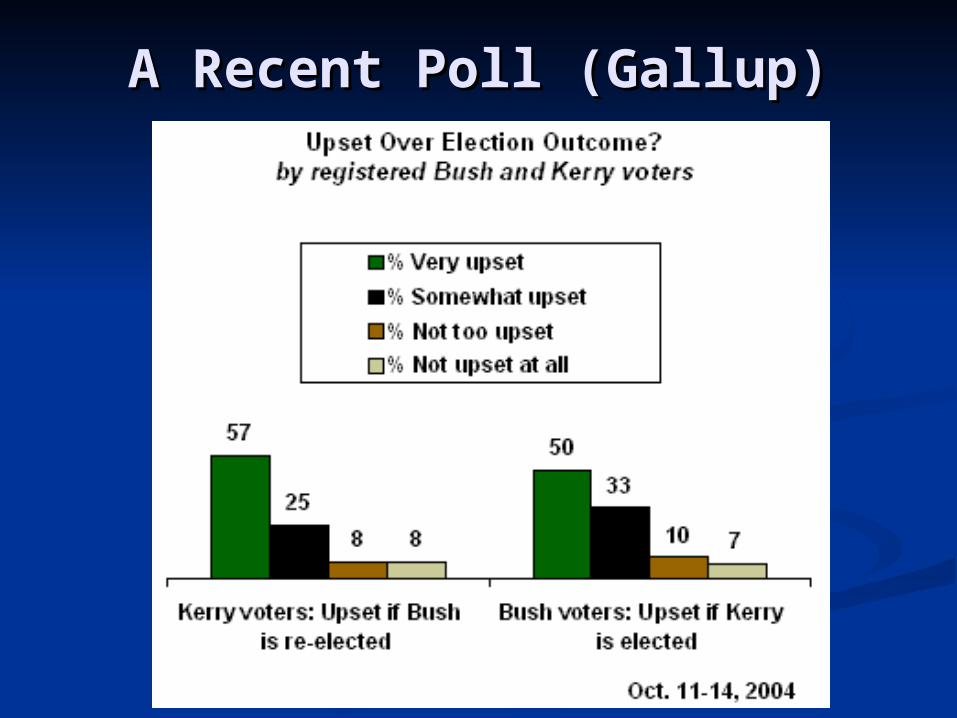
A Recent Poll (Gallup)A Recent Poll (Gallup)
Poll DetailsPoll Details Certainly, one of the challenges for the winner Certainly, one of the challenges for the winner
of this year's election will be to bring a divided of this year's election will be to bring a divided nation together again. nation together again.
Survey MethodsSurvey Methods These results are based on telephone interviews These results are based on telephone interviews
with a randomly selected national sample of with a randomly selected national sample of 1,013 adults, aged 18 and older, conducted Oct. 1,013 adults, aged 18 and older, conducted Oct. 14-16. For results based on this sample, one can 14-16. For results based on this sample, one can say with 95% confidence that the maximum say with 95% confidence that the maximum error attributable to sampling and other random error attributable to sampling and other random effects is ±3 percentage points. In addition to effects is ±3 percentage points. In addition to sampling error, question wording and practical sampling error, question wording and practical difficulties in conducting surveys can introduce difficulties in conducting surveys can introduce error or bias into the findings of public opinion error or bias into the findings of public opinion polls.polls.