Conference on missing values and matrix...
50
Conference on missing values and matrix completion June, 17-19, 2015 AGROCAMPUS OUEST, 65 rue de Saint Brieuc, Rennes, France
Transcript of Conference on missing values and matrix...

Conference onmissing values and matrix completion
June, 17-19, 2015AGROCAMPUS OUEST, 65 rue de Saint Brieuc, Rennes, France

Introduction
First of all, we would like to welcome you to the 1st MissData conference.
The objective of this conference is to spotlight the latest research in missing values and matrixcompletion. Our aim, is to bring together theoretical and applied researchers from different fieldsof application such as social-science, genetics, medical analysis, survey, collaborative filtering, imagereconstruction, etc.
We do believe that the different communities with their different background, vocabulary will gaina lot by discussing and hope that you can confront your practice, bring complementary skills anddifferent views on the same subject.
We hope that you will have a terrific time at the conference with fruitful and stimulating exchangesand that you will enjoy your stay in Rennes.
Vincent Audigier, Remi Gribonval and Julie Josse, principal investigators.
Organization
MissData is organized by the statistic department of Agrocampus and is supported by the groupData Mining and Learning group of the French Statistical Society.
The organising committee for missData 2015 consists of the following members:
• The applied mathematics department of Agrocampus Ouest head by David Causeur, with thesecretaries Karine Bagory and Elisabeth Lenaud
• Agrocampus Ouest with Stephane Crespel and Anne Bourdeau (Logistic), Valerie Le Sabazecand Vinciane Marchais (Communication)
• The French Statistical Society SfdS with Nathalie Villa-Vialaneix, Dominique Moccatti andthe Data Mining group
The scientific committee consists of:
• Vincent Audigier - Agrocampus Ouest, France
• Guillaume Chauvet - Ensai, France
• Remi Gribonval - INRIA, France
• Julie Josse (President) - Agrocampus Ouest, France
• Ken Kleinman - Harvard Medical School, US
• Rahul Mazunder - Columbia University, US
• Cattram Nguyen - Murdoch Children Research, AUS
• Angelina Wood - Cambridge Public Health, UK
Posters - Reception
The posters will be exposed at Masure (where the coffee breaks will be held) during the meeting.
The Reception will be held on Thursday 18 June 7pm at Masure. It will be an “Aperitif-dinatoire”with many finger foods, cheese (and wine) and some desserts... It is a social event with the oppor-tunity to discuss one-on-one with the presenters of the talks and the posters! Please don’t forget tovote for the best posters!!! Awards will be given for the three best.

SponsorsThe organizers would like to thank the following organisms which sponsored the event and contributeto the success hopefully of this first conference on missing values and matrix completion!
• Among the academic partners:
– Agrocampus-Ouest: the ‘elite public university-level college’, for life and environmentalsciences and technologies where the conference takes place.
– Sfds: the French Statistical Society is an association that aims to promote the use andunderstanding of statistics, and to foster its methodological development
– IRMAR: the Mathematics research institute of Rennes
– CHL: the Lebesgue Center of Mathematics is a research center for mathematics in thewestern part of France
– Rennes metropole: the city of Rennes
– UEB: the European University of Brittany
– Crest-Ensai: the center for research in economics and statistics
– Inria: A public science and technology institution dedicated to computational sciences
• Among the sponsoring companies:
– DIANA Pet Food, the world’s leading partner committed to improving pet food perfor-mance, develops innovative solutions to increase the well-being of cats and dogs, and petowner satisfaction. Member of the Symrise Group, the Pet Food Business unit relies ona strong establishment in 5 continents with 670 employees, 17 industrial sites, 17 salesoffices, 1 research center, 4 local development and technical support centers and 3 catsand dogs expert panels.
– Mediametrie is the French industry leader in media research, which observes, measuresand analyses audience behaviour and market trends. Created in 1985, Mediametrie isexpanding its activities in television, radio, the internet, film, telecom and the cross-media sector in France and abroad. Mediametrie generated a turnover of €82,4 million in2014. Website: www.mediametrie.fr Twitter : www.twitter.com/ Mediametrie Facebook:www.facebook.com/Mediametrie
– Kuzulia is a company that provides expertise in applied mathematics to several fields: bi-ology, genetics, ecology, agriculture, sensory studies. The company offers both consultingand adult professional training using R software.
– XLSTAT is the richest tool for the data analysis and the statistical treatment with MSExcel. This is available in 7 languages, through 100 countries and has been chosen by morethan 50000 users. The Addinsoft company, that develops and distributes the product, islocated in Bordeaux (France). This company is growing significantly, especially in USAwhere the product has been chosen in a lot of universities for teaching.
– L’Oreal is the French cosmetics and beauty company the most famous in the world.
– Rte is the electricity transmission system operator of France.
– Ritme brings scientific softwares’ ease-of-use to companies, laboratories and universitiesin France, Benelux, Switzerland and Italy. Ritme brings solutions in answer to your needsfor greater performance : from guidance in softwares’ selection to products’ & cross-functional trainings or tailored consultancy needs. Our mission is to facilitate yours.
– Rstudio is an integrated development environment for R. It includes a console, syntax-highlighting editor that supports direct code execution, as well as tools for plotting, his-tory, debugging and workspace management. RStudio is available in open source andcommercial editions.
– Revolution R software and services suite, is the innovative leader in Big Data, enterpriseanalytics. Powered by the R language, Revolution R is used by enterprises with massivedata, performance and multi-platform requirements who need to drive down the cost ofBig Data

• Among the book publishers:
– Wiley is a publisher of books, journals, books, databases, reference works and laboratoryprotocols in every major academic, scientific and professional field. The range of statisticsand mathematics books can be viewed online at www.wiley.com/statistics. The websitewww.StatisticsViews.com can be visited for the latest news, features, books and researcharticles in Statistics.
– Chapman & Hall/CRC is a premier publisher of science books, with a world-leadingprogram in statistics. The core areas of our program are statistical theory and methods,biostatistics, and computational statistics. Visit https://www.crcpress.com/statistics tobrowse our catalog, and use the promotion code provided in the wallet for a 20% discount.

Conference Program
Wednesday June 17 (Pre-conference tutorials)
• 14h00 - 16h00: Handling missing data in R with MICE. Gerko Vink and Stefan van Buuren
• 16h00 - 16h30: Coffee break
• 16h30 - 18h30: Model-based clustering/imputation with missing/binned/mixed data using thenew software MixComp. Christophe Biernacki
Thursday June 18
• 10h00 - 10h10: Welcome
• 10h10 - 11h00: Multiple imputation
(Chairman: Francois Husson)
Stef van Buuren, Fully conditional specification, past, present and beyond
• 11h00 - 11h30: Coffee break - posters
• 11h30 - 13h10: Low-rank matrix completion
(Chairman: Remi Gribonval)
Olga Klopp, Robust matrix completionPierre Vandergheynst, Matrix completion on graphs
• 13h10 - 13h30: Lightening talks: dimension reduction, matrix completion, and inpainting
(Chairman: Mathieu Emily)
Lunch
• 14h45 - 16h25: Multiple imputation in biostatistics
(Chairman: Gilbert MacKenzie)
Mouna Akacha, Missing Data in Clinical Trials: Challenges and Recent DevelopmentsJohn Graham, Advances in Research on Participants Attrition in Prevention Intervention Stud-ies.
• 16h25 - 16h45: Lightning talks: inference with missing values
(Chairman: Francois Husson)
• 16h45 - 17h15: Coffee break - posters
• 17h15 - 18h05: Inference and mechanism of missing values
(Chairman: Gilbert Saporta)
Roderick Little, Partially missing at random and ignorable inferences for parameter subsetswith missing data
• 18h05 - 18h25: Lightening talks: inference and imputation
(Chairman: Benjamin Guedj)
• 18h25 - 18h45: Lightening talks: multiple imputation
(Chairman: Benjamin Guedj)
• 18h45: Posters Session - Reception

Friday June 19
• 9h30 - 11h10: Multiple imputation in biostatistics
(Chairman: Matthias Templ)
Shaun Seaman, Handling missing values in Matched Case-Control Studies using Multiple Im-putation.Recai Yucel, Gaussian-based routines for imputing categorical variables in complex data
• 11h10 - 11h40: Coffee break - posters
• 11h40 - 13h20: Survey
(Chairman: Guillaume Chauvet)
Joseph Schafer, Multiple Imputation for Complex Surveys: An Overview of the State of theArt.David Haziza, Triply robust inference in the presence of missing survey data
Lunch
• 14h45 - 16h25: Images
(Chairman: Teddy Furon)
Patrick Perez, From Image to Video Inpainting, with PatchesSandrine Pires, Missing values in Astrophysics
• 16h25 - 16h45: Closing session poster awards

Pre-conference tutorials, Wednesday, 17th 14h00 – 16h00
Handling missing data in R with MICE
Gerko Vink and Stefan van BuurenDept of Methodology and Statistics, FSS, University of UtrechtNetherlands Organisation for Applied Scientific Research TNO
Multiple imputation (Rubin 1987, 1996) is a recommended method for complex incomplete dataproblems. Two general approaches for imputing multivariate data have emerged: joint modeling(JM) and fully conditional specification (FCS) (van Buuren 2007). Multivariate Imputation byChained Equations (MICE) is the name of software for imputing incomplete multivariate data byFCS which will be presented in this tutorial.
Topics will include: concise theory on multiple imputation - a description of how the algorithm inMICE works - specification of the imputation model - sensitivity analysis under MNAR - interactingwith other software.
Prerequisites: elementary knowledge of general statistical concepts and (linear) statistical models isassumed. Moreover, basic programming in R is useful.

Pre-conference tutorials, Wednesday, 17th 16h30 – 18h30
Model-based clustering/imputation with
missing/binned/mixed data using the new software
MixComp
Christophe BiernackiLille 1 University, France, INRIA
The “Big Data” paradigm involves large and complex data sets. Complexity includes both variety(mixed data: continuous and/or categorical and/or ordinal and/or functional...) and missing, orpartially missing (binned), items. Clustering is a suitable response for volume but it needs also todeal with complexity, especially as volume promotes complexity emergence.
Model-based clustering has demonstrated many theoretical and practical successes (McLachlan 2000),including multivariate mixed data with conditional (Biernacki 2013) or without conditional indepen-dence (Marbac et al. 2014). In addition, this full generative design allows to straightforwardly handlemissing or binned data (McLachlan 2000; Biernacki 2007). Model estimation can also be performedby simple EM-like algorithms, as the SEM one (Celeux and Diebolt 1985).
MixComp is a new R software, written in C++, implementing model-based clustering for multivari-ate missing/binned/mixed data under the conditional independence assumption (Goodman 1974).Current implemented mixed data are continuous (Gaussian), categorical (multinomial) and integer(Poisson) ones. However, architecture of MixComp is designed for incremental insertion of new kindsof data (ordinal, ranks, functional...) and related models.
Currently, MixComp is not freely available as an R package but will be soon freely available througha specific web interface. Beyond its clustering task, it allows also to perform imputation of miss-ing/binned data (with associated confidence intervals) by using the mixture model ability for densityestimation as well.
Topics will include: mixture models - conditional independence - SEM algorithm - model selectioncriteria.
Prerequisites: elementary knowledge of general statistical concepts, of mixture models, of EM al-gorithm and of standard model selection criteria is assumed. Moreover, basic programming in R isuseful.

Conferences, Thursday, 18th 10h10 – 11h00
Fully Conditional Specification: Past, present and
beyond
Stef van BuurenDept of Methodology and Statistics, FSS, University of UtrechtNetherlands Organisation for Applied Scientific Research TNO
Two traditions have emerged for drawing multiple imputations in multivariate missing data. Thejoint modeling approach specifies a multivariate distribution of the missing data, whereas fully con-ditional specification (FCS, or chained equations, sequential regression) requires a specification ofeach conditional distribution. The lecture highlights how FCS combines algorithmic elements of theNORM method with the philosophy of the French tradition of L’analyse de Donnees. The resultis a highly flexible methodology for creating imputations that stay close to the data, but that alsolead to valid statistical inferences for a wide variety of complete - data estimates. I will discussstrong and weak points of the approach, open problems in current FCS, and future applications,such as estimating the individual causal effect (ICE), i.e., the answer to the question “What willthis intervention do for this person at this time?”

Conferences, Thursday, 18th 11h30 – 12h20
Robust Matrix Completion
Olga KloppParis Ouest University, CNRS
We consider the problem of recovery of a low-rank matrix in the situation when most of its entriesare not observed and a fraction of observed entries are corrupted. The observations are noisy real-izations of the sum of a low rank matrix, which we wish to recover, with a second matrix having acomplementary sparse structure such as element-wise or column-wise sparsity. We analyse a class ofestimators obtained by solving a constrained convex optimization problem that combines the nuclearnorm and a convex relaxation for a sparse constraint. Our results are obtained for the simultaneouspresence of random and deterministic patterns in the sampling scheme. We provide guarantees forrecovery of low-rank and sparse components from partial and corrupted observations in the presenceof noise and show that the obtained rates of convergence are minimax optimal.
This is a joint work with K. Lounici and A. Tsybakov.

Conferences, Thursday, 18th 12h20 – 13h10
Matrix Completion on Graphs
Pierre VandergheynstEPFL, Lausanne, Switzerland
The problem of finding the missing values of a matrix given a few of its entries, called matrix comple-tion, has gathered a lot of attention in the recent years. Although the problem is NP-hard, Candesand Recht showed that it can be exactly relaxed if the matrix is low-rank and the number of observedentries is sufficiently large. In this work, we introduce a novel matrix completion model that makesuse of proximity information about rows and columns by assuming they form communities. Thisassumption makes sense in several real-world problems like in recommender systems, where thereare communities of people sharing preferences, while products form clusters that receive similar rat-ings. Our main goal is thus to find a low-rank solution that is structured by the proximities of rowsand columns encoded by graphs. We borrow ideas from manifold learning and signal processing toconstrain our solution to be smooth on these graphs, in order to implicitly force row and columnproximities. Our matrix recovery model is formulated as a convex non-smooth optimization problem,for which a well-posed iterative scheme is provided. We study and evaluate the proposed matrix com-pletion on synthetic and real data, showing that the proposed structured low-rank recovery modeloutperforms the standard matrix completion model in many situations.
This is joint work with Vassilis Kalofolias, Michael Bronstein and Xavier Bresson.

Lightning talks Thursday, 18th 13h10 – 13h30
Dimension reduction, matrix completion, and
inpainting
• Low Rank Matrix Completion with Exponential Family Noise, Jean Lafond [Talk and poster]
• Non-parametric methods for the interpolation of noisy space-time dynamics, Redouane Lguen-sat, Pierre Tandeo, Pierre Aillot, Ronan Fablet [Talk and poster]
• Audio Inpainting, Source Separation, Audio Compression All with a Unified Framework Basedon NTF Model, Cagdas Bilen, Alexey Ozerov and Patrick Perez [Talk and poster]
• A general low complexity recovery framework and its application to structured sparsity, YannTraonmilin, Remi Gribonval [Talk and poster]
• Sketching techniques for very large matrix factorization, Raghavendran Balu, Teddy Furon,Laurent Amsaleg [Poster]
• Linear embeddings of low-dimensional subsets of a Hilbert space to Rm, Gilles Puy, Mike Davies,Remi Gribonval [Poster]

Low Rank Matrix Completion with Exponential Family NoiseJean Lafond1
1.Institut Mines-Telecom, Telecom ParisTech, CNRS LTCI
Keywords: low rank matrix estimation, matrix completion, exponential family model, nuclear norm
The matrix completion problem consists in reconstructing a matrix from a sample of entries, possibly ob-served with noise. A popular class of estimator, known as nuclear norm penalized estimators, are based onminimizing the sum of a data fitting term and a nuclear norm penalization. Here, we investigate the casewhere the noise distribution belongs to the exponential family and is sub-exponential. Our framework al-lows for a general sampling scheme. We first consider an estimator defined as the minimizer of the sum of alog-likelihood term and a nuclear norm penalization and prove an upper bound on the Frobenius predictionrisk. The rate obtained improves on previous works on matrix completion for exponential family. Whenthe sampling distribution is known, we propose another estimator and prove an oracle inequality w.r.t. theKullback-Leibler prediction risk, which translates immediately into an upper bound on the Frobenius pre-diction risk. Finally, we show that all the rates obtained are minimax optimal up to a logarithmic factor.
References
[1] Gunasekar, S., P. Ravikumar, and J. Ghosh (2014). Exponential family matrix completion under struc-tural constraints. ICML.
[2] Klopp, O., J. Lafond, E. Moulines, and J. Salmon (2014, August). Adaptive Multinomial Matrix Com-pletion.
[3] Koltchinskii, V., A. B. Tsybakov, and K. Lounici (2011). Nuclear-norm penalization and optimal ratesfor noisy low-rank matrix completion. Ann. Statist. 39(5).
[4] Lafond, J. (2015). Low rank matrix completion with exponential family noise. COLT .

Non-parametric methods for the interpolation of noisyspace-time dynamics
Redouane Lguensat1,? , Pierre Tandeo1, Pierre Ailliot1,2, Ronan Fablet1
1. Institut TELECOM ; TELECOM Bretagne ; UMR 6258 LabSTICC ; Technopole Brest Iroise CS 83818 29238 Brest Cedex 32. University of Western Brittany Brest ; UMR 6205 LMBA ; 6 Avenue Le Gorgeu CS 93837 29238 Brest Cedex 3
?Contact author: [email protected]
Keywords: Stochastic filtering, Inpainting, Analog method, Hidden Markov Model, Data mining.
In this work we present a non parametric method to interpolate noisy multivariate time series and imageseries with missing data using a data-driven stochastic filtering scheme.
Let x(tk)k=1···τ be the dynamic time serie to infer and suppose we have y(tk)k=1···τ non-complete noisymeasurements of x(tk) at each time k. This inverse problem can be formulated by the following equation:
y(tk) = Hx(tk) + ε(tk) (1)
where H is an observation operator representing a mask (0 for missing data, 1 for presence) and ε a ran-dom perturbation which takes into consideration observation modeling error, noising and other sources ofuncertainty. This can be the case where we have missing pixels in an image sequence, or occulted parts ina time serie, depending on the considered application setting (e.g., missing data due to clouds for satelliteobservations). These measurements are one source of information about the sequence x(t).
A second source of information about this sequence is provided by the dynamical model that controls theevolution of the dynamic system in time:
x(tk+1) = M(x(tk)) + η(tk) (2)
where M denotes the dynamical model and η a random noise representing the uncertainty about the modelbetween two consecutive times. The mathematical resolution of the state-space model (1)-(2) refers to dataassimilation in the geoscience community or stochastic filtering more commonly.To address this issue classical stochastic filtering techniques, such as ensemble Kalman [1] [6] or particlefilters and smoothers are used [7]. They proceed by an online evaluation of the physical model in orderto provide a forecast for the state. And so it is crucial to have a well defined physical model which is notalways the case, thus, the lack of consistency of the model with respect to the observed data and modelinguncertainties are severe limitations of this classical framework.
In our work, we investigate a data-driven methodology as introduced in [2]. The core idea consists incombining machine learning and stochastic filtering methods by using historical datasets which containsexamples of the time evolution of the state as such, it exploits an implicit data-driven model. We investi-gate different stochastic filters, including a discrete reformulation of the proposed framework using HiddenMarkov Models. To deal with high-dimensional data (including images), we exploit a PCA-based repre-sentation of the data to implement the proposed non-parametric stochastic filtering in a lower-dimensionalspace. This approach can then be regarded as a dynamic matrix completion setting, which constrains thetime consistency of the matrix completion from a database of previously observed data series. Fig.1 showsa time step of the filtering algorithm. We report numerical experiments for the classical Lorenz-63 chaoticdynamics as well as image time series to demonstrate the relevance of our data-driven approach for theinterpolation of missing data in multidimensional time series.
For a lightning talk submission and a poster submission

Audio Inpainting, Source Separation, Audio CompressionAll with a Unified Framework Based on NTF Model
Cagdas Bilen∗ , Alexey Ozerov∗ and Patrick PerezTechnicolor
cagdas.bilen, alexey.ozerov, [email protected]
Keywords: Audio Inpainting, Source Separation, Informed Source Separation (ISS), Compressive Sam-pling, Nonnegative Tensor Factorization (NTF)
We propose a general signal recovery algorithm, thatcan recover J audio source signals in time, sτjt, j ∈J1, JK, t ∈ J1, T K, given the quantized source sam-ples, yτjt, each observed on the support Ωτ
j and thequantized mixture samples, xτt =
∑Jj=1 s
τjt + aτt ,
observed on Ξτ with quantization noise aτt . Thesources are modelled in the short time Fourier trans-form (STFT) domain with a normal distribution(sjfn ∼ Nc(0, vjfn)) where the variance tensor V =[vjfn]j,f,n has the following low-rank non-negativetensor factorization (NTF) structure [7], vjfn =∑K
k=1 qjk wfkhnk. This model is parametrized byθ = Q,W,H, with Q = [qjk]j,k ∈ RJ×K+ , W =
[wfk]f,k ∈ RF×K+ and H = [hnk]n,k ∈ RN×K
+ .
We propose to recover the source signals with ageneralized expectation-maximization (GEM) algo-rithm [4] based on multiplicative update (MU) rules[5]. The Algorithm is briefly described in Algo-rithm 1. Using the proposed approach, it is possibleto solve a number of existing and new problems inaudio signal processing:
• Audio inpainting: It is possible to recover ar-bitrary time domain losses in audio signals forapplications such as signal declipping. NTF
model is used for the first time for the recov-ery of arbitrary time domain losses [3].
• Joint audio inpainting and source separa-tion: It is possible to jointly perform audio in-painting and source separation to improve theperformance of both tasks. Audio inpaintingand source separation are performed jointly forthe first time [1].
• Compressed sampling-based informedsource separation: It is possible to recoverthe sources from their random samples andthe mixture via compressive sampling-basedinformed source separation. This new ISSscheme uses a simple encoder that has prop-erties of distributed coding [8, 6] and it com-petes with traditional ISS. The concept of dis-tributed coding and of compressive samplingbased scheme is introduced for the first timein the informed source separation problem [2].
The presentation and the poster will include variousnew results for the proposed algorihtm with compar-isons to state of the art methods in the different prob-lems discussed above.
* The first and second authors have contributed equally for this work.This work was partially supported by ANR JCJC program MAD (ANR-14-CE27-0002).This work is submitted for a lightning talk and a poster.
Algorithm 1 GEM algorithm for NTF model estimation. Details can be found in [1, 2, 3]
1: procedure ESTIMATESOURCES-NTF(Ξτ , xτ , yτjtJj=1, Ωτj Jj=1)
2: Initialize non-negative Q,W,H randomly and apply any known prior on Q,W,H3: repeat4: Estimate sources (sjfn), given Q,W,H, xτ ,Ξτ , yτjtJj=1, Ωτ
j Jj=1 with Wiener filtering5: Apply constraints in the time domain, and estimate posterior power spectra of the sources (P)6: Update Q,W,H given P using MU rules7: until convergence criteria met8: end procedure

A general low complexity recovery framework and itsapplication to structured sparsity
Yann Traonmilin1;
? , Remi Gribonval1
1. INRIA, Rennes?Contact author: [email protected]
Keywords: sparse recovery, compressed sensing, restricted isometry, structured sparsity
To estimate data from underdetermined observations, a regularity assumption is needed. Sparse recoverytheory gives a powerful framework to perform this estimation. Recent advances in this domain show thatthis estimation is possible with general low complexity regularity models which are suitable to model manykinds of data. Consider underdetermined observations of a signal x 2 H (H is a Hilbert space) by a linearoperator M . The regularity of x is defined by the fact that x 2 , where is the regularity model set.Usually, enforces low complexity on the signal x: few non-zero coefficients for sparse vectors, few non-zero singular values for low rank matrices, etc. Let f be a regularization function. It was proven that theprogram
argmin
y2E
f(y) s:t: My = Mx (1)
is able to recover x for a selection of M , and convex norms f [6]. We consider the following question:Given a regularity model set , what regularizer f permits the recovery of low complexity signals in ?
To tackle this question, we look for a (preferably convex) regularizer f for which recovery can be guaranteedfor a large set of operators M . It is known that operators M with a Restricted Isometry Property (RIP) allowfor a stable uniform recovery of all x 2 when f is the `1 norm and is the set of K-sparse vectors [5].Many RIP results are available for different pairs of model set and norm f . Each of these aiming at eithergeneralizing the area of application or the sharpness of hypotheses. For example, Cai and Zhang [4] gavea sharp RIP result valid for sparse vector and low rank matrix recovery. In fact, Bourrier et al. [3] showedthat a lower RIP is a necessary condition for the robust recovery of signals with arbitrary model set . Thissuggests that the RIP is a good tool to study low complexity recovery.
In this contribution, we show that under some generic geometric conditions on the regularizer f and themodel set , we can provide a uniform recovery theorem on under RIP conditions for M . This resultgives a framework to check if a given regularizer is a good candidate to perform low complexity recovery,and get a compressed sensing result when combining with the work of Puy et al. [7], where it was shown thatthe RIP holds on very generic model sets, even in infinite dimension. Given a model set and a functionf , we can get a uniform recovery result for random observations of signals in by checking the RIP ofrandom observations on the secant set and verifying our geometric conditions.
Application : structured sparsity in an infinite dimensional space. We use this general framework togive sharp and uniform recovery results in an infinite dimensional context with structured sparsity inducingnorms without overlap (or group norms). Ayaz et al. [2] gave an uniform recovery result for structuredcompressed sensing under RIP hypothesis in a finite dimensional setting. In this case, the regularizer is amixed `
1
`
2 norm (group norm) and a RIP constant ofp
2 1 for vectors in guarantees recoveryof vectors from . In [1], Adcock and Hansen propose a generalized sampling strategy to recover sparsesignals in an infinite dimensional setting. With our new general framework, we show that the RIP constanton group sparse vectors of Ayaz et al. can be improved to the sharp 1
p
2
. We generalize these results tonon-overlapping group norms in an infinite dimensional context which encompass the generalized samplingof [1]. This setting is important for problems were the data lives in an infinite dimensional space. Forexample, in magnetic resonance imaging (MRI), Fourier coefficients of the image are observed, this imagebeing an element of the function of finite energy L
2 which has infinite dimension.
For a lightning talk submission and a poster submission

Sketching techniques for very large matrix factorizationRaghavendran Balu? , Teddy Furon, Laurent Amsaleg
Inria, Rennes?Contact author: [email protected]
Keywords: Count sketch, online algorithms, matrix factorization, recommender system, collaborative fil-tering
Matrix factorization is a prominent technique for approximate matrix reconstruction and noise reduction. Itsappeal is attributed to its space efficiency and its ability to generalize with missing information. Our focus ismatrix factorization technique applied to collaborative filtering [2], where the given data is a sparse matrixR with non zero entries ru,i representing the rating provided by the user u for a given item i.
Factorization of the matrix R maps both users u ∈ U and items i ∈ I in a joint vector space (pu ∈ Rd,qi ∈Rd) in such a way that their inner product p>
u qi approximates the observed value ru,i [2]. The learned latentfactors are thus used to predict (by inner product) the missing entries and thereby to fill the incomplete user-item matrix. The objective is to minimize the error function
∑observed: u,i(ru,i−p>
u qi)2+λ(‖pu‖2+‖qi‖2).
In collaborative filtering systems, the sparse matrix R is too huge to be stored with the number of users anditems growing to millions. The observed elements in R are not available as a static data beforehand, but asa stream of tuples < u, i, ru,i >. One has to learn online and store the latent factors alone.
In regular matrix factorization, latent vectors puu∈U and qii∈I are stored as contiguous dense arraysin memory. Yet, the number of latent factors is linear with the number of users and items. This also raisesproblem in a dynamic environment when new users and items are added every now and then. We proposereplacing this matrix representation with count sketch to improve and control the storage efficiency. Countsketch is a probabilistic data structure to maintain frequency information of items approximately but withsub linear space complexity [1]. More surprisingly, although user and item vectors carry different semantic,their underlying representations are the same and we store both of them in the same count sketch structuredesigned for d(|U|+ |I|) elements.
The sketch based online factorization is not much different from regular online factorization [2] other thanthe latent factor retrieval and gradient updates merging. When a new tuple < u, i, ru,i > arrives, the countsketch is queried to reconstruct user and item vectors pu and qi . The rating estimation p>
u qi is comparedwith the actual rating ru,i to get the error and gradient updates for all the 2d values of the user and itemvectors. Then for each component of pu as well as qi, the count sketch structure C is updated with theircorresponding sign corrected gradients.
We show that this simple approach is indeed equivalent to the online minimization of a functional combiningthe prediction error and the estimation noise. This estimation noise inherent to count sketch has someregularization properties exhibited by experiments on large scale systems (up to 100 M of ratings).
References
[1] Charikar, M., K. Chen, and M. Farach-Colton (2002). Finding frequent items in data streams. In ICALP.
[2] Koren, Y., R. Bell, and C. Volinsky (2009). Matrix factorization techniques for recommender systems.Computer (8), 30–37.
For poster submission

Linear embeddings of low-dimensional subsetsof a Hilbert space to Rm
Gilles Puy 1,? , Mike Davies 2, Remi Gribonval 1
1. INRIA Rennes - Bretagne Atlantique, 35042 Rennes Cedex, France.2. The University of Edinburgh, Edinburgh EH9 3JL, UK.
?Contact author: [email protected]
Keywords: Compressed sensing, Restricted isometry property, Box-counting dimension.
A particular case of problems with missing data are inverse problems that appear in compressed sensing(CS). In this field, the restricted isometry property (RIP) characterises the possibility to reconstruct sparsesignals from their measurements. In this work, we are interested in extending known CS results in finitedimensional ambient space to infinite dimensional ambient space. These developments are important, e.g.,in CS to extend the theory to an analog setting [1] and explore connections with the sampling of signalswith finite rate of innovation [7], and also in machine learning to develop efficient methods to computeinformation-preserving sketches of probability distributions [6, 2].
We consider the problem of embedding a low-dimensional set, M, from an infinite-dimensional Hilbertspace, H, to Rm. Defining appropriate random linear projections, we construct a linear map which has theRIP on the secant set ofM, with high probability for a number of projections essentially proportional to theintrinsic dimension ofM. In this abstract, 〈·, ·〉 denotes the scalar product in H and ‖·‖ is the associatednorm. Our goal is to construct a linear map L : H → Rm that satisfies
(1− δ) ‖x1 − x2‖ 6 ‖L(x1 − x2)‖2 6 (1 + δ) ‖x1 − x2‖ (1)
for all pairs of vectors x1,x2 ∈ M. This is equivalent to showing that supy∈S(M) |‖L(y)‖2 − 1| 6 δ
where S(M) is the normalized secant set ofM: S(M) :=y = x1 − x2/‖x1 − x2‖
∣∣∣ x1 6= x2 ∈M
.In this work, we assume that this normalized secant set has upper box-counting dimension strictly boundedby s > 0. Therefore, there exists ε0 > 0 such that, for all ξ ∈ (0, ε0), S(M) can be covered by at most ξ−s
balls of radius ξ. We now fix a value ε in (0, ε0), choose a cover of S(M) by balls of radius ε, and denoteby T (ε) the set of centers of these balls. We construct our linear map as follows.
Let V ⊂ H be the finite-dimensional linear subspace spanned by T (ε) and (a1, . . . ,ad) be an orthonormalbasis for V . We draw m independent centered isotropic random gaussian vectors α1, . . . ,αd ∈ Rd, setli :=
∑dk=1 α
ik ak/
√m, for all ∀i ∈ 1, . . . ,m, where αik is the kth entry of αi, and define
Lε : H → Rm
x 7→ Lε(x) = (〈l1,x〉 , . . . , 〈lm,x〉)ᵀ.
Theorem 1. There exist absolute constants D1, D2, D3 > 0 with D1 < 1 such that if S(M) has upperbox-counting dimension strictly bounded by s, then for any 0 < δ < min(D1, ε0) and ρ ∈ (0, 1), if ε 6 δ/2and
m > D2δ−2 max s log (D3/δ) , log (6/ρ) , (2)
then Lε : H → Rm satisfies the RIP (1) with constant at most δ and probability at least 1− ρ.
The proof is based on a chaining argument which is a powerful technique to obtain sharp bounds for thesupremum of random processes [5, 3]. A detailed proof can be found in [4].
For a poster submission. This work was partly funded by the ERC, PLEASE project (ERC-StG-2011-277906).

Conferences, Thursday, 18th 14h45 – 15h35
Missing Data in Clinical Trials: Challenges and
Recent Developments
Mouna AkachaNOVARTIS, Basel, Switzerland
Health authorities are increasingly concerned about the impact of missing data on clinical trial results.In 2010, both US and European regulators released or commissioned documents that emphasize theprevention of missing data, request continued data collection after study treatment discontinuationand discuss the need for a clearly defined primary objective (‘estimand’) of the trial.
Indeed, defining the primary objective of a clinical trial in the presence of non-compliance or non-adherence to the assigned treatment is crucial for the choice of design, the statistical analyses -including the handling of missing data - and the interpretation of the results.
At first glance this seems obvious, however, primary objectives stated in clinical trial protocols oftenfail to give a precise definition of the measure of intervention effect. In particular, the impact ofmissing data is frequently not taken into account when defining the intervention effect of interest.However, different ways of dealing with missing data may well imply different measures of effect.
We will review these aspects and discuss why “missing at random” based analyses may be unsuitablein certain clinical trial settings. We illustrate our ideas based on a case study and share recent healthauthority interactions on this topic.

Conferences, Thursday, 18th 15h35 – 16h25
Advances in Research on Participant Attrition in
Prevention Intervention Studies
John W. Graham, Lauren E. Connell, and Michael L. HechtPenn State University
This paper describes a promising approach to dealing with participant attrition, a methodologicalchallenge common in prevention intervention research. Attrition undermines the internal validityof studies evaluating the efficacy/effectiveness of preventive interventions. Reducing the impact ofattrition is key to these essential evaluations.
Graham (2012) suggested several strategies for studying attrition, and outlined a taxonomy of eightcases of attrition that consider all possible combinations of the treatment (vs. control: T), the de-pendent variable (Y), and the interaction between them (TY) as causes of missingness. Attrition isnot a problem in two cases (case 1 = not T, not Y, not TY as causes; case 2 = T only as cause),because missingness is either MCAR or MAR. Previous research (Collins, Schafer, & Kam, 2001;Graham et al., 2008; Graham, 2012) has shown minimal attrition bias in a third case for the regres-sion coefficient for T predicting Y (βY T ) (Case 3: Y only as cause). The remaining five cases havenot been studied.
This paper describes results of a Monte Carlo simulation that extends the work of Collins, Schafer,& Kam (2001) to cover the five cases of the taxonomy that have not been studied previously indepth. Our simulation focuses on case 8, in which T, Y, and the TY interaction are all responsible,to varying degrees, for the observed missingness on Y. Our work focused on what Collins et al.(2001) referred to as MNAR-Linear missingness, and we created missingness using the same strategythey used. We studied several key factors relating to missingness: overall % missing; the T effect(difference in % missing between T and C groups); the overall Y effect (using a quantity we call“range”: the difference in the probability of Y missing between the 4th and 1st quartiles of Z); andthe TY effect (difference in “range” between T and C groups). We also examined two values for thequantity ρZY , the correlation between the cause of missingness, Z, and the main dependent variable,Y. Our work makes use the definition suggested by Collins, Schafer, & Kam (2001) for missing databias that is not significant in a practical sense; we judged bias not to be of practical significance aslong as the absolute value of the standardized bias was less than 40. Results of our simulation showclear patterns of demarcation between combinations of factors that do and do not show bias that issignificant in a practical sense. My presentation will present these results.
Estimating the various quantities (% missing; T effect; Y effect, TY effect; ρZY ) in empirical data iskey to estimating the impact of bias due to attrition. The % missing, T effect, and ρZY quantitiesare all easily estimated in empirical studies with longitudinal follow-up data. The Y and TY effectsare more difficult to estimate, but with longitudinal follow-up data, plausible estimates of thesequantities are possible. Making judicious use of the estimates of all these quantities in empiricaldata, in conjunction with careful sensitivity analyses, one can make judgements in a particularempirical study about the likelihood that attrition has caused bias that is significant in a practicalsense.Graham (2012) also suggested data collection methods for reducing the impact of attrition. Onestrategy involves asking attrition relevant questions (e.g., whether the participant will be availablefor the next wave of measurement). The benefits of this strategy have not been studied previouslyin empirical research. Using our simulation results, and our strategies for estimating the variousquantities in empirical data, we demonstrate the benefits of using the attrition-relevant measures toreduce attrition bias.

Lightning talks, Thursday, 18th 16h25 – 16h45
Inference
• Longitudinal data analysis with auxiliary item information to deal with missing questionnairedata, Iris Eekhout, Craig K. Enders, Jos W.R. Twisk, Michiel R. de Boer, Henrica C.W. deVet, Martijn W. Heymans [Talk and poster]
• Variable selection using the integrated complete-data likelihood to cluster dataset with missingvalues, Matthieu Marbac, Mohammed Sedki [Talk and poster]
• Estimation of the AIDS incidence rate in Portugal via the backcalculation method, Julio Silva,Joaquim Costa, A. Rita Gaie [Talk and poster]
• Conditional moments and data missing at random, Marian Hristache, Valentin Patilea [Talkand poster]
• Systematically missing data in meta-analysis: a graphical model approach, Jelena Kovacic, VedaMarija Varnai [Poster]

Longitudinal data analysis with auxiliary item information to deal with missing questionnaire data.
Iris Eekhout1,2,*, Craig K. Enders3, Jos W.R. Twisk2, Michiel R. de Boer4, Henrica C.W. de Vet2, Martijn W. Heymans2, 4
1. Research center – Military Mental Health, Ministry of Defense, Utrecht, the Netherlands; Brain Center Rudolf Magnus, Department of Psychiatry, University Medical Center Utrecht, Utrecht, the Netherlands.
2. VU University medical center, Amsterdam, the Netherlands and EMGO Institute for Health and Care Research, Amsterdam, the Netherlands.
3. Arizona State University, Tempe, AZ. 4. VU University, Amsterdam, the Netherlands.
*Contact author: [email protected]
Keywords: structural equation modeling, questionnaires, longitudinal data, full information maximum likelihood, auxiliary variables
Study outcomes are often measured by multi-item questionnaires. Missing item scores can impair total score calculation and result in incomplete scale scores. Even though scale scores are of interest, it is most desirable to handle missing items at the item-level because that improves power [1,2]. Many questionnaire manuals advice to average the available items or impute the person mean score, however these methods can introduce bias. A valid way to handle missing data without imputation is by using a structural equation model with maximum likelihood estimation. For longitudinal data this could be a linear growth model. However, these kinds of models do not necessarily include the item scores. The aim of this study was to propose two novel methods for dealing with incomplete scale scores that result from missing item responses by including the item information in the model as auxiliary variables [3]. These methods are advantageous because they incorporate the observed item-level data while maintaining the sum scores as the outcome of the analysis. The auxiliary variables improve missing data handling by using the item information to improve the precision of model estimates.
The two methods that were evaluated included either the item scores themselves or a summary of a parcel of item scores (e.g., the average of the available item scores) as auxiliary variables, while treating the scale scores missing in a latent growth model. The performance of the novel methods was examined in a simulation study in several longitudinal data conditions and analyzed through bias, mean square error, and coverage.
Results showed that including the item information as auxiliary variables results in rather dramatic power gains compared to not including the item information under varying conditions. Including the observed item information as auxiliary variables is the most optimal way to regain power, refine parameter estimates and decrease bias when scale scores are incomplete.
In general, we recommend including a summary of the items in the auxiliary part of the latent growth model when incomplete scale scores result from missing item scores. This study shows that the summary of the items improved the precision of the estimates over not including auxiliary information. Furthermore, the inclusion of a summary is an efficient method that does not over-complicate model estimations.
References______________________
For a lightning talk submission and a poster submission

Variable Selection in Cluster Analysis of Datasets with MissingValues based on the Integrated Complete-Data Likelihood
Matthieu Marbac1,? , Mohammmed Sedki1,2
1. UMR 1181 B2PHI INSERM, Institut-Pasteur and Univ. Versailles St Quentin2. Univ. Paris-Sud
?Contact author: [email protected]
Keywords: Information criterion, integrated complete-data likelihood, mixed-type data, model-based clus-tering, values missing at random and variable selection.
Variable selection in cluster analysis is important yet challenging. Indeed, in many cases, the partitionamong the individuals may be best explained by only a subset of the observed variables. So, by performingthe variable selection in the cluster analysis, both model fitting and result interpretation are facilitated. Thisobjective can be achieved by regularization methods like the sparse K-means algorithm. This approach hasbeen proposed by Witten and Tibshirani [4] to cluster continuous data sets. It realizes a trade-off betweenthe clustering accuracy and the number of selected variables by adding a lasso-type penalty to the classicalK-means method. Unfortunately, the calibration of the penalty term can suffer from criticisms. Moreover,the management of missing values by regularization methods stays a difficult task.
In this context, model selection methods are an efficient alternative. When the variables are continuous,clustering can be achieved by variable selection in a Gaussian mixture model. However, it needs a difficultoptimization of an information criterion which involves combinatorial problems. Raftery and Dean [3] alsopropose to find the set of relevant variables maximizing the BIC criterion by using a greedy search algorithm.However, their algorithm is based on a suboptimal procedure (e.g. stepwise method) and needs multiple callsof EM algorithms for each model comparison that involve a long-time procedure for the model estimation.
Recently, The MICL criterion (Maximum Integrated Compete-data Likelihood) has been introduced byMarbac, M. and Sedki, M. [2] to facilitate the variable selection in a Gaussian mixture model. The authorsassume conditional independence between variables to implement a simple procedure for assessing themodel maximizing the MICL criterion. The main advantage of this procedure is to avoid the maximumlikelihood inference for each competing model. Thus, parameter inference is performed only for the uniqueselected model. This talk presents an extension of [2] for dealing data sets with values missing at random.The poster presents the management of data sets with continuous, counting, categorical and mixed-typedata. A real data set of life science is used to illustrate the twofold benefit of the variable selection: easierinterpretation of the components and better partitioning accuracy. The proposed method is implemented inthe R package VarSelLCM [1].
References
[1] Marbac, M. and Sedki, M. (2015a). R package VarSelLCM: Variable Selection for Model-Based Clus-tering of Continuous, Integer, Categorical or Mixed Data Set with Missing Values. https://r-forge.r-project.org/R/?group id=2011. version 1.9.1.
[2] Marbac, M. and Sedki, M. (2015b). Variable selection for model-based clustering using the integratedcomplete-data likelihood. Preprint, arXiv:1501.06314.
[3] Raftery, A. and N. Dean (2006). Variable Selection for Model-Based Clustering. Journal of the Ameri-can Statistical Association 101(473), 168–178.
[4] Witten, D. and R. Tibshirani (2010). A Framework for Feature Selection in Clustering. Journal of theAmerican Statistical Association 105(490), 713–726.
For a lightning talk submission and a poster submission

Estimation of the AIDS incidence rate in Portugal via thebackcalculation method
Julio Silva1? , Joaquim Costa1,2, A. Rita Gaio1,2
1. Departamento de Matematica, Faculdade de Ciencias da Universidade do Porto2. Centro de Matematica da Universidade do Porto
?Contact author: [email protected]
Keywords: HIV/AIDS, Backcalculation, EM algorithm, Newton-Raphson method, Poisson distribution
The Human Immunodeficiency Virus (HIV) can evolve to severe illness with the late symptoms referred to asAcquire Immune Deficiency Syndrome (AIDS). This infection can have a major impact on socio–demographicand economic features of the affected countries. In Portugal, as in most countries, the epidemic is moni-tored by a surveillance system based on cases notification by physicians. It can take several months untilthe diagnosed cases are notified. Because HIV infection is usually not immediately detected, good data onincubation times are only available for specific cohorts, in principle not representative of the general pop-ulation. The purpose of this work is to estimate the 2000-2012 Portuguese incidence rate of AIDS, fromnotification data and taking into account the problems mentioned above. Public Health policies tell us thatall efforts should focus primarily on the improvement of HIV prevention. The knowledge of the incidencerate will be crucial to evaluate current and previous prevention campaigns and, if necessary, can lead to newprograms of action.
The estimation of the incidence rate was addressed by the backcalculation method. For a fixed month, thenumber of newly infected individuals in the previous months is unknown. It was estimated from the numberof individuals diagnosed at that month and from the distribution of the incubation time (taken to be thedifference between the diagnosis date and the infection date). The latter was assumed to follow a Weibullor a Gamma distribution, see [1]. The number of new diagnoses and new infected cases in any given monthwas assumed to follow a Poisson distribution. The method was based on a convolution equation adaptedfor the discrete case, see [2]. The likelihood function was considered for the complete data, including themean number of new infections per month as unknown parameters, which are to be estimated given thenumber of new diagnoses per month. Maximization of the complete likelihood used a combination of theexpectation-maximization algorithm [3] and linear regression, in order to ensure smoothing. Results fromthe methodology were tested on simulated and real data.
Correction for the reporting delays was obtained by conditional likelihood estimation for count data assum-ing a Poisson distribution, as previous work in [4] and [5].
References
[1] Amaral, J. A., E. P. Pereira, and M. T. Paixao (2005). Data and projections of HIV/AIDS cases inPortugal: an unstoppable epidemic? Journal of Applied Statistics 32(2), 127–140.
[2] Bacchetti, P., M. R. Segal, and N. P. Jewell (1993). Backcalculation of HIV infection rates. Journal ofApplied Statistics 8(2), pp. 82–101.
[3] Green, P. J. (1990). On use of the EM for penalized likelihood estimation. Journal of the RoyalStatistical Society. Series B (Methodological) 52(3), pp. 443–452.
[4] Harris, J. E. (1990). Reporting delays and the incidence of AIDS. Journal of the American StatisticalAssociation 85(412), pp. 915–924.
For a lightning talk submission and a poster submission

Conditional moments and data missing at randomMarian Hristache1,? , Valentin Patilea1
1. CREST (ENSAI-UEB)?Contact author: [email protected]
Keywords: Double-robustness, Inverse probability weighting, MAR assumption, Moment restrictionsmodels, Semiparametric regression.
We consider a general statistical model defined by moment restrictions when data are missing at random.Using the inverse probability weighting, we show that such a model is equivalent with a model for theobserved variables only, augmented by a moment condition defined by the missing mechanism. We thereforeextend a result stated by Graham (2011) for the equivalence of the corresponding efficiency bounds. Inparticular, our framework covers parametric and semiparametric mean regressions and quantile regressions.We allow for missing responses, missing covariates and any combination of them. The equivalence result isobtained under minimal technical conditions and sheds new light on various aspects of interest in the missingdata literature, as for instance the double-robustness, imputation, the restricted estimators and the puzzlingefficiency of the procedures based on the estimated, rather than known, selection probabilities. It alsoprovides a general framework for building (efficient) estimators. Moreover, as an immediate consequenceof our general theory, we derive the efficiency of the complete cases analysis in a general semiparametricregression model with responses missing at random. One can see Hristache and Patilea (2014) for moredetails.
References
[1] GRAHAM, B. S. (2011). Efficiency bounds for missing data models with semiparametric restrictions.Econometrica 79, 437–452.
[2] HRISTACHE M. & PATILEA V. (2014). Conditional Moment Restriction Models with Data Missing atRandom. Working paper, available at http://www.ensai.fr/crest-ensai/publications.html.
For a lightning talk and a poster submission

Systematically missing data in meta-analysis: a graphicalmodel approach
Jelena Kovacic1,? , Veda Marija Varnai1
1. Institute for Medical Research and Occupational Health, Zagreb?Contact author: [email protected]
Keywords: meta-analysis, systematically missing data, graphical models
Systematically missing data in meta-analysis arise when studies measure different sets of adjusting vari-ables. Common approaches to this problem can cause bias (using only variables measured in all studies) orloss of precision (using only studies with all variables; complete-case approach). A previous study showedthat exploiting correlation between partially and fully adjusted regression coefficient estimates in a bivariatemeta-analysis increases precision [5]. We propose a graphical model that uses these correlations and, ad-ditionally, hypothesized conditional independence between differently adjusted estimates to calculate fullyadjusted estimate. Unlike previously proposed approaches [5, 3, 2], full data is not required; only estimatedcoefficients with standard errors. Moreover, even studies with only one reported coefficient can be includedin the analysis.
The proposed graphical model is illustrated in Fig.1. Node Xi in a graph corresponds to regression coeffi-cient adjusted for the set of variables Si, and edge from Xi to Xj indicates that Sj ⊂ Si. Joint density isderived from graph structure (Fig.1) and nodes’ distributions, which we specify as Xi ∼ N(βi, σ
2i + τ2i ) if
Xi has no parents in the graph, orXi|Xj ∼ N(βi+ρij√(σ2i + τ2i )/(σ
2j + τ2j )(Xj−βj), (σ2i +τ2i )(1−ρ2ij))
if its parent is Xj . Here σ2i and τ2i are within- and between-study variances, and ρij correlation coefficientbetween Xi and Xj . Parameters are then estimated either by Markov Chain Monte Carlo sampling ormaximum likelihood, both in a standard way.
The method was tested using data for 11 countries from the Survey of Health, Ageing and Retirement inEurope [1]. As our goal was solely to develop methodology, we repeat the analysis by Siegriest et al. [4].The analysis aimed to estimate the effect of effort-reward imbalance on intended early retirement, adjustedfor 9 covariates representing sex, age, socio-economic status, physical and mental health parameters, andwork conditions (3 binary, 3 3-level, and 3 continuous variables; Fig.1). We considered two missing datapatterns, one monotone (Fig.1 a) and the other non-monotone (Fig.1 b). For each pattern, countries wererandomly assigned to missing data categories for 3 times. The proposed graphical model (G-MA) was com-pared to meta-analysis of all 11 fully-adjusted estimates (”gold standard”) and complete-case meta-analysiswith normal distribution-based confidence intervals (CC-MA; conventional approach). Graphical modelestimates were based on 50 000 iterations from Markov Chain Monte Carlo analysis, with uninformativepriors for coefficients’ means (βi) and between-study variances.
Meta-analysis of all 11 fully-adjusted estimates yielded an odds ratio estimate of 1.87, indicating that highereffort-reward imbalance increases odds of retiring early. In both missing pattern settings (Fig 1.a), G-MA showed less bias than CC-MA (Table 1). In one example with simple missing pattern 95% G-MAcredible interval had the same width as the 95% CC-MA confidence interval, while in all other cases CC-MA intervals were wider, by 16% to 55%. None of the G-MA models indicated any lack of convergence.
To conclude, the proposed approach showed less bias and more precision than the conventional approach inour examples, while at the same time requiring less data than alternative approaches. It is easily extendedto more complex, non-monotone missing data settings, all types of regression models with any kind ofvariables, and fixed-effects meta-analysis, while also allowing for incorporation of prior knowledge. All ofthis makes it suitable for a variety of applications.
For a poster submission

Conferences, Thursday, 18th 17h15 – 18h05
Partially Missing At Random and Ignorable
Inferences for Parameter Subsets with Missing
Data
Roderick LittleUniversity of Michigan
For likelihood-based inferences from data with missing values, models are generally needed for boththe data and the missing-data mechanism. Modeling the mechanism can be difficult, because itsparameters are often poorly identified and results are often sensitive to model misspecification.Rubin (1976) showed that sufficient conditions for ignoring the missing data mechanism are that(a) the missing data are missing at random (MAR), and (b) the parameter of the data modeland the missing-data mechanism are distinct. These conditions are not always necessary, and theyrelate to the complete set of parameters in the model. We propose definitions of partial MARand ignorability for a subvector of parameters of particular substantive interest. We apply thesedefinitions to regression with missing covariates, where an ignorable likelihood method is appliedto a subsample of observations that are complete on a set of variables, but possibly incomplete onothers. This method gives valid estimates for mechanisms where both complete-case analysis andfull ignorable likelihood methods are biased.

Lightning talks, Thursday, 18th 18h05 – 18h25
Imputation – inferences
• A case study of completion of cats’ consumption missing data on preference mapping, JulienRogues [Talk and poster]
• Linear regression with missing data and unknown colored noise: Application to a space missionin fundamental physics, Quentin Baghi [Talk and poster]
• The Effect of Missing Visits on GEE, A Simulation Study, Julia Geronimi, Gilbert Saporta[Talk and poster]
• Recovering missing individual block information in a multiblock Multiple Factor Analysis, ValentinVoillet, Ignacio Gonzalez, Laurence Liaubet, Phillipe Besse, Magali Sancristobal [Talk andposter]
• QRILC: a quantile regression approach to left-censored missing data imputation in quantitativehigh- throughput proteomics, Cosmin Lazar, Myriam Ferro, Christophe Bruley, Thomas Burger[Poster]
• Integrating Data Deficient species in evolutionary history loss analyses, Simon Veron, SandrinePavoine, Philippe Clergeau [Poster]
• Analyzing multi-group multivariate data with non-ignorable missingness, Myrsini Katsikatsou,Jouni Kuha, Irini Moustaki [Poster]

Dealing with missing data in palatability measurement: a case study with external preference mapping
Julien Rogues1
1. DIANA Pet Food, ZA du Gohélis, 56250 Elven, FranceContact author: [email protected]
Key words: missing data, palatability, preference mapping, pet food, cats
Ensuring that pet foods are attractive to companion animals and their owners is essential. Clas-sical methods to assess palatability performance include preference trials conducted with dogs and cats expert, semi-expert or in-home panels. A huge amount of information such as animal daily consump-tion data can be collected from these tests, nevertheless it recurrently happens that some data are not available and/or reliable due to veterinary cares or unusual animal behaviors. A simple way to solve this issue is to calculate the overall mean of the database and replace the missing values with the cal-culated mean. However several alternative and more precise methods exist. The goal here was to find out which completion method in the literature fitted the best to these consumption data.
A database was set up in order to compare the performance of 60 cat foods representative of the market. Products palatability was assessed using Liking tests conducted on a forty adult cat panel at Panelis, DIANA Pet food expert center in palatability measurement. In addition, all the diets were characterized according to their physical and chemical specificities. A multivariate analysis was performed with the physico chemical data in order to create a bi-dimensional map of products. Palatability data, illustrated by the cat consumption levels, were then used to create an external preference mapping. On the total number of 2400 cat’s consumption values expected, 7 values from 4 out of the 40 cats of the panel were missing in the database (0,3% of missing values). Since preference mapping method requires removing from the global analysis every cat having at least one missing value, only 36 cats could thus be represented in the map (10% “missing cats”).In order to evaluate different completion methods, a new database with no missing values was created from the original one by taking into account the cats with no missing values: 60 x 36 = 2160 data available. 17 levels of missing values, from 0,2% to 60% of the total number of recorded values, were simulated on this complete database using 7 completion methods selected from the literature: the mean of the global database, the last observation carried forward (LOCF), the nearest neighbors (kNN) [1], the local regression (LOESS) [2], the singular value decomposition (SVD) [2], the random forests (missforest)[3] and the impute PCA [4]. The mean of absolute differences between real data and reconstituted data - the absolute error of imputation - was the criterion considered to compare the efficiency of the methods. 1000 different missing values simulations were performed with each method and for each level of missing values, in order to obtain a reliable value for this criterion.
ImputePCA, missforest and kNN were the most relevant methods to replace missing data in the database considered (Figure 1). The 7 missing values of the original database were successfullyreplaced using ImputePCA and allowed performing the external preference mapping on the forty initial cats, thus recovering the most of all the information gathered.
These completion methods could be interestingly tested to recover various type of palatability missing data obtained from classical two-bowls palatability test, during a Bradley-Terry model or even with some specific measurement methods developed at Panelis (specific behavioral recording, kinetics of consumption, treats trials…). They could possibly be used when using incomplete block design.
Poster and lightning talk

Linear regression with missing data and unknown colorednoise: Application to a space mission in fundamental physics
Quentin Baghi1,? , Gilles Metris2, Joel Berge1, Bruno Christophe1, Manuel Rodrigues1
1. ONERA - The French Aerospace Lab, 29 avenue de la Division Leclerc, 92320 Chatillon, France2. Observatoire de la Cote d’Azur, Bt 4, 250 rue Albert Einstein, Les Lucioles 1, Sophia Antipolis, 06560 Valbonne, France
?Contact author: [email protected]
Keywords: Linear regression, Colored noise, Data imputation, Spaceborne instruments, Experimentaltests of gravitational theories.
The analysis of measurements in experimental physics is often subject to interruptions in the acquired data,especially for spaceborne experiments where long integration time may be needed. We show that the un-certainty of a regression analysis on incomplete stationary time series can be increased by several orders ofmagnitude compared to the complete data case, when the residuals are highly correlated and unmodeled. Wepresent a linear regression method that constructs an approximate general least squares estimator by first fit-ting an autoregressive (AR) model to the noise [1]. The use of an AR model is efficient to estimate arbitrarynoise spectra in spite of the missing data, in particular when using Burg’s algorithm [3]. The state-spacerepresentation of the noise provided by the AR model allows us to orthogonalize the data with a Kalmanfilter. We then estimate the parameters of interest using the data decorrelated in this way, ensuring that theprecision is close to the minimal variance bound. While the direct maximization of the likelihood [4] oreven Expectation-Maximization procedures [6] can be computationally expensive for long time series, theproposed approach requires very few iterations. In addition, the outputs of the developed algorithm can beused to estimate the missing values using Gaussian conditional expectations. The reconstruction is precisecompared to methods based on sparse decomposition [2] but relies on a more restrictive model for the de-terministic part of the signal. We demonstrate the performance of the method with simulated time series ofthe MICROSCOPE space mission [5], an in-orbit experiment scheduled for launch in 2016 that aims to testthe equivalence principle. We show that the precision of the fit is 60 times better than ordinary least squaresmethods.
References
[1] Baghi, Q., G. Metris, J. Berge, B. Christophe, P. Touboul, and M. Rodrigues (2015). Regression analysiswith missing data and unknown colored noise: Application to the MICROSCOPE space mission. Phys.Rev. D 91, 062003.
[2] Berge, J., S. Pires, Q. Baghi, et al. Correcting for missing data in colored noise: An inpainting applica-tion to the MICROSCOPE space mission, in prep.
[3] De Waele, S. and P. M. Broersen (2000). The burg algorithm for segments. Signal Processing, IEEETransactions on 48(10), 2876–2880.
[4] Jones, R. H. (1980). Maximum likelihood fitting of arma models to time series with missing observa-tions. Technometrics 22(3), 389–395.
[5] Touboul, P., G. Metris, V. Lebat, and A. Robert (2012). The MICROSCOPE experiment, ready for thein-orbit test of the equivalence principle. Classical and Quantum Gravity 29(18), 184010.
[6] Wang, Y., P. Stoica, J. Li, and T. L. Marzetta (2005). Nonparametric spectral analysis with missing datavia the em algorithm. Digital Signal Processing 15(2), 191–206.
For a lightning talk submission and a poster submission

The Effect of Missing Visits on GEE,A Simulation Study
Julia Geronimi1,2,? , Gilbert Saporta1
1. Cedric-Cnam, 292 rue Saint Martin 75141 Paris Cedex 032. Institut de de Recherches Internationales SERVIER, 50 rue Carnot 92150 Suresnes
?Contact author: [email protected]
Keywords: Longitudinal data, repeated correlated data, correlation, missing data, simulations, General-ized Estimating Equation
Clinical research is often interested in longitudinal follow-up over several visits. All scheduled visits are notcarried out and it is not unusual to have a different number of visits by patient. The Generalized EstimatingEquations can handle continuous or discrete autocorrelated response. The method allows a different numberof visits by patients. The GEE are robust to missing completely at random data, but when the last visits arefewer, the estimator may be biased. We propose a simulation study to investigate the impact of missing visitson the estimators of the model parameters under different missing data patterns. Different types of responsesare studied with an exchangeable or autoregressive of order one structure. The number of subjects affectedby the missing data and the number of visits removed, vary in order to assess the impact of the missing data.Our simulations show that the estimators obtained by GEE are resistant to a certain rate of missing data.The results are homogeneous regardless to the imposed missing data structure.
References
[1] Hin, L.-Y. and Y.-G. Wang (2009). Working-correlation-structure identification in generalized estimat-ing equations. Statistics in Medicine 28(4), 642–658.
[2] Liang, K.-Y. and S. Zeger (1986). Longitudinal data analysis using generalized linear models.Biometrika 38, 13–22.
[3] Park, T. (1993). A comparison of the generalized estimating equation approach with the maximumlikelihood approach for repeated measurements. Statistics in Medicine 12(18), 1723–1732.
[4] Qaqish, F. B. (2003). A family of multivariate binary distributions for simulating correlated binaryvariables with specified marginal means and correlations. Biometrika 90(2), 455–463.
[5] R Development Core Team (2008). R: A Language and Environment for Statistical Computing. Vienna,Austria: R Foundation for Statistical Computing. ISBN 3-900051-07-0.
[6] Robins, J. M. and A. Rotnitzky (1995). Semiparametric efficiency in multivariate regression modelswith missing data. Journal of the American Statistical Association 90(429), 122–129.
[7] Rubin, D. B. (1976). Inference and missing data. Biometrika 63(3), 581–592.
[8] U. Halekoh, S. H., , and J. Yan (2006). The r package geepack for generalized estimating equations.Journal of Statistical Software 15(2), 1–11.
For a lightning talk submission and a poster submission, the poster is already submitted

Recovering missing individual block information in amultiblock Multiple Factor Analysis
Valentin Voillet1,? , Magali SanCristobal1,2, Laurence Liaubet1, Phillipe Besse2, Ignacio Gonzalez3
1. INRA, UMR1388, Genetique, Physiologie et Systemes d’Elevage (GenPhySE), F-31326 Castanet-Tolosan, France2. Universite de Toulouse INSA, UMR5219, Institut de Mathematiques, F-31077 Toulouse, France A
3. INRA, UMR875, Mathematiques et Informatiques Appliquees (MIAT), F-31326 Castanet-Tolosan, France?Contact author: [email protected]
Keywords: Missing Individual, Multiblock, Imputation, Multiple Factor Analysis
Omics technologies enable the researcher to extract thousand of thousands of measures at the cellular scale:genomics, transcriptomics, proteomics, metabolomics, etc... Multiple tissues are also being analysed at thesame time on a common set of individuals. As a matter of example, Omics studies have been performed tocompare different conditions: different stages of fetal muscle development in the pig [7]. After an analysisof each omics table, the aim is to integrate the information on the multiple omics tables. In the presenceof two tables, the partial least square (PLS) method [5] can be applied. With multiple tables, multivariateexploratory data analysis methods such as multiple factor analysis (MFA) have been used in the context ofOmics data tables analysis [2]. MFA [3, 6] deals with datasets in which the same group of individuals isdescribed by several tables of variables. These approaches are usable with no missing values. When fewvalues are missing at random, a regularised iterative MFA approach [4] have been proposed. However insome datasets, some individuals may not be present in all sets of variables for lots of reasons (e.g. dueto technical issues during the sampling). These individuals are thus often removed before applying MFA,resulting sometimes in the inability to perform this analysis. To avoid loosing useful information, we devel-oped a method to handle these individuals.First, let us briefly remind the basis of MFA. MFA is composed of two steps. Firstly, J separate principalcomponents analyses (PCA) are executed on each set of variables Kj , where Kj(j = 1, . . . , J) is the jth
omic table. A global analysis is then performed weighting each set of variables Kj by the first eigenvalue(1/λj1).In the merged dataset K = K1, . . . ,KJ, it happens that one individual has missing values in an entireomics dataset Kj . Our method randomly chooses and duplicates an individual in Kj to replace individ-uals not systematically present in all omic tables before performing MFA. The substitute has to belongto the same condition and the same omic table as the missing individual. The same approach is thenperformed several times and all MFAs are then summarized following the principle of the double PCA[1]. We consider T = K1, . . . ,KM where M is the number of MFA and Km is the mth merged setKm = Km
1 , . . . ,KmJ . Each dataset Km is weighted by the square root of the sum of the relevant eigen-
values q of its MFA (1). A final MFA is then performed on the center of gravity G of these weighteddatasets.
G =1
M·
M∑
m=1
Km
√q∑
l=1
λml
(1)
Repeating the replacement of the missing individuals and aggregating the obtained datasets allows us toobtain a more robust estimation of the missing individuals.We compared our method with the regularised iterative MFA approach [4] on a simulated dataset (3 mergedomic data tables of 64 individuals and 20 variables) by measuring the correlation between the first com-ponents of the MFA with the complete dataset and of the MFA with the depleted then completed dataset.Our method was closer to the consensus configuration than the regularised iterative MFA even when a lot ofindividuals were missing, showing thus promising results (Figure 1).
For a lightning talk submission and a poster submission

QRILC: a quantile regression approach to left-censored missingdata imputation in quantitative high-throughput proteomics
Cosmin Lazar1,3,4, Myriam Ferro1,3,4, Christophe Bruley1,3,4, Thomas Burger1,2,3,4?
1. Univ. Grenoble Alpes, iRTSV-BGE, F-38000 Grenoble, France.2. CNRS, iRTSV-BGE, F-38000 Grenoble, France.3. CEA, iRTSV-BGE, F-38000 Grenoble, France.
4. INSERM, BGE, F-38000 Grenoble, France.?Contact author: [email protected]
Keywords: quantitative proteomics; left-censored data; quantile regression.
Background: Missing data is a major concern fordata scientists in many disciplines and in particular inmass spectrometry-based proteomics where high ratesof non-responses are recorded during experiments. Itis generally acknowledged that the major proportionof missing data is due to the detection limits of thespectrometers leading to left-censored measurements(see Fig. 1). Solutions to cope with this problem relyon the imputation of missing data and a number ofstrategies have been proposed for proteomics exper-iments. Despite the large amount of literature dedi-cated to the missing data imputation in statistics, theproblem is still challenging in proteomics due to thespecificity of the missingness mechanism.
Figure 1: Observed and theoretical distributions.
Results: We present QRILC, a new approach to infer left-censored missing data from a truncated distribu-tion with parameters estimated using quantile regression. We show that under the assumption of Gaussianity,the quantile regression provides with good estimates of the complete-data distribution parameters assumingthat the missing data is left-censored; the new missing data imputation method was evaluated in a rigorousframework to test both for its goodness of fit performances as well as its influence on downstream analysis,and it was also compared with six other state-of-the-art methods for missing data imputation.
Conclusions: We performed simulated experiments both on artificial data as well as on three selected realdatasets in a scenario where the percentage of missing data is controlled. The results obtained show that theproposed solution provides the best goodness of fit performances compared to the original data, and in thesame time performs best in the context of differentially abundance analysis, among a number of six otherdifferent methods used for comparison.
R package: The QRILC imputation method is freely available in the imputeLCMD R pacakge [1].
References
[1] http://cran.r-project.org/web/packages/imputeLCMD/.
Poster submission.
Integrating Data Deficient species in evolutionary history lossanalyses
S.Veron1,? , P. Clergeau1,? and S. Pavoine1,2,?
1.Centre d’Ecologie et des Sciences de la Conservation (CESCO UMR7204), Sorbonne Universits, MNHN, CNRS, UPMC,CP51, 55-61 rue Buffon, 75005, Paris, France
2. Mathematical Ecology Research Group, Department of Zoology, University of Oxford, South Parks Road, Oxford OX1 3PS,UK
?Contact author: [email protected]; [email protected];[email protected]
Keywords: Conservation status, data deficient species, simple imputation methods, evolutionary
A major objective for biologists is to identify the most threatened species in order to define and prioritizeconservation actions. In this aim, the Red List developed by the International Union for the Conservationof Nature (IUCN) enables to identify species at risk of extinction and has supported a large number ofconservation programs (IUCN, 2015). Yet, among the species evaluated in the IUCN Red List, availableinformation is not always sufficient to quantify threat status. Those species are classified as Data-Deficient(DD). Assessing the conservation status of DD species is a great challenge in conservation biology (Bland etal., 2014). Indeed, DD species brings high uncertainties in the proportion of threatened species in a group,and, as it was argued for amphibians, DD species could be more threatened than already assessed species(Howard & Bickford, 2014). DD species may then strongly impact the prioritization of conservation actions.
DD species are also a crucial issue to assess the loss of Phylogenetic Diversity (PD) and EvolutionaryDistinctiveness (ED) (Isaac et al., 2007; Collen et al., 2011). PD and ED are highly valuable componentsof biodiversity which depict the evolutionary history of conservation interest (May, 1990; Faith, 1992).Several studies found that DD species greatly influenced the amount of evolutionary history predicted tobe lost following species extinctions (Collen et al., 2011; Isaac et al., 2012, Jono & Pavoine, 2012). Forexample, if some clustered DD species are in high danger of extinction it may lead to the loss of deepbranches and dramatically increase the loss of evolutionary history. So far, in a phylogenetic framework,none study tried to minimize the bias due to DD species which are generally excluded from the analysis.
Our first objective was to explore the bias brought by DD species on 4 widely used indices which measureED and PD at risk: HEDGE, EDGE, PDloss and ExpectedPD loss indices (Faith, 1992; Isaac et al., 2007;Steel et al., 2007; Faith, 2008). Second we looked for an easy-to-use and multi-taxa imputation method thatminimized the bias for those 4 indices. To do so we simulated DD species in three vertebrate groups: carni-vores, amphibians and reptiles. DD species were simulated according to three parameters: the proportion ofDD species, the time extinction scenario and the degree of clustering of DD species in the most evolutionarydistinct and in the most range restricted species.
We then imputed the simulated DD species with four methods: first, DD species were all considered tobe in critical danger of extinction (CR status), second they were all considered to be non-threatened (LCstatus), third DD species were assigned a threat status with a probability calculated from the proportionof each threat status in already assessed species, finally we imputed threat status according to the size ofthe geographic range of DD species. We then measured the difference between the real values of PD andED indices with the values obtained from simulation and imputation of DD species. We found that DDspecies brought important bias in the assessment of all four indices in the three groups. The method whichperformed the best to minimize those bias independently of the parameters considered was the one based ongeographic range size. CR and LC status imputation method enabled to assess the worst case and best casescenario of extinctions and PD and ED loss, respectively, but they brought large gaps with the real valuesof PD and ED loss. As for the probabilistic method, it performed second to minimize those biases in PDand ED loss. We thus showed that in a phylogenetic framework, an easy to use method based on geographic
For a poster submission

Analyzing multi-group multivariate data with non-ignorablemissingness
Myrsini Katsikatsou1,? , Jouni Kuha1,2, Irini Moustaki1
1. Department of Statistics, London School of Economics, UK2. Department of Methodology, London School of Economics, UK
?Contact author: [email protected]
Keywords: item non-response, latent trait model, latent class model
The standard multigroup latent variable modeling framework is extended to the modeling of missing datamechanism.
Let YC = (Y1, . . . , Yp)> denote a vector of p observable variables for a single observational unit which
measures a latent variable η. Let YO and Ymis denote the items in YC which are observed and missing,respectively. A non-empty YO provides information about η. The information about the pattern of missingdata for a respondent is incorporated in a vector R = (R1, . . . , Rp)
>, where Ri = 1 if Yi is observed,and 0 otherwise. The proposed modeling framework may be viewed in the general framework of maximumlikelihood models for handling missing data. In particular:
p(R,YC |X) =
∫p(R|YC , η,X) p(YC |η,X) p(η|X)dη ,
where X is a vector of covariates, including the group variable, p(R|YC , η,X) is the non-response model,p(YC |η,X) is the measurement model, and p(η|X) is the structural model. Distinct parameters are assumedfor the non-response model and the rest of the model (measurement and structural models).
We make the assumption that p(R|YC , η,X) = p(R|η,X), since η is measured by YC . Adjusting thedefinitions provided in Rubin (1976) and Little and Rubin (2002) to our framework the data are consideredmissing at random (MAR) if p(R|η,X) = p(R|X). Note that conditioning on all X that affect both η and Ris essential to avoid a confounding correlation between η and R. In the case of non-ignorable missingness,a model is needed for R. Unlike general non-ignorable models, p(R|η,X) is identifiable without furtherassumptions, because the multiple indicators in YC identify η and the non-response is ignorable given η.
We propose a latent class model for R; the associations among the Rj’s are explained by a discrete latentvariable denoted by ξ with C latent classes, where C << 2p. The advantages of using a latent class modelare firstly, that it will approximate the observed multinomial distribution of R as the number of latent classesincreases. Thus, it provides a flexible way of modelling the associations among the Rj’s and avoids the riskof a confounding correlation between η and R. Secondly, we can achieve a well specified and parsimoniousmodel for the missingness mechanism. The proposed model is as follows:
p (R | η,X) = Pr (R = r | η,X) =
C∑
c=1
Pr (R = r|X, η, ξ = c)P (ξ = c | X, η) ,
where Pr (R = r|X, η, ξ = c) is allowed to depend on X with the aim of specifying a well-fitting model forthe missingness indicators within each group indicated by X. The parameter that represents the associationbetween ξ and η summarizes the type of missingness.
The proposed modeling framework is demonstrated by analyzing data from the European Social Survey(ESS) Round 4 (2008) that was conducted in 29 countries.
For a poster submission

Lightning talks, Thursday, 18th 18h25 – 18h45
Multiple Imputation
• Analysis of incomplete data and imputation of missing values: the R package VIM, MatthiasTempl, Alexander Kowark [Talk]
• Multiple imputation using multiple correspondence analysis, Vincent Audigier, Francois Husson,Julie Josse [Talk]
• PLS regression and Multiple Imputation, Phillippe Bastien [Talk]
• Using multiple imputation for a zero-inflated contingent valuation with potentially biased sam-pling, Marouenne Mbarek, Damien Rousseliere, Julien Salanie [Talk and poster]
• Multiple Imputation using Mahalanobis Distance, Elaine M. Berkery, Kevin Hayes [Poster]
• Latent Class Analysis for Multiple Imputation of Missing Categorical data: an overview, DavideVidotto, Jeroen K. Vermunt [Poster]
• Proposition of a Multiple Imputation approach for MNAR mechanism using Heckman’s model,Jacques-Emmanuel Galimard, Sylvie Chevret, Matthieu Resche-Rigon [Poster]

Analysis of incomplete data and imputation of missing values:the R package VIM
Matthias Templ1,2,? , Alexander Kowarik2
1. Vienna University of Technology2. Statistics Austria
?Contact author: [email protected]
Keywords: Missing Values, Visualization, Imputation, Robust Methods
The package VIM [3, 2] is developed to explore and analyze the structure of missing values in data usingvisualization methods, to impute these missing values with the built-in imputation methods and to verify theimputation process using visualization tools, as well as to produce high-quality graphics for publications.Univariate, bivariate, multiple and multivariate plot methods are implemented to analyse the structure ofmissing values, but they can also be used to evaluate imputed data. The most common imputation methodssuch as hotdeck, kNN and regression imputation are implemented in an efficient manner to also work forlarge data sets. Moreover, also more advanced methods based on robust statistics are implemented [4]. Mostof the implemented method can deal with a mixture of continuous, semi-continuous, count, categorical andbinary variables and allow also for multiple imputation.
A point- and click graphical user interface has been developed to give access to these methods and toolsto users with limited R skills. It is available in the package VIMGUI [1] that is also prepared to work forobjects produced by R’s survey package. All important methods are supported by the flexible point- andclick-interface. The presentation describes the application of the methods available in the package VIM.
References
[1] Schopfhauser, S., M. Templ, A. Alfons, A. Kowarik, and B. Prantner (2013). VIMGUI: Visualizationand Imputation of Missing Values. R package version 0.9.0.
[2] Templ, M., A. Alfons, and P. Filzmoser (2012). Exploring incomplete data using visualization tech-niques. Advances in Data Analysis and Classification 6, 29–47.
[3] Templ, M., A. Alfons, A. Kowarik, and B. Prantner (2013). VIM: Visualization and Imputation ofMissing Values. R package version 4.0.0.
[4] Templ, M., A. Kowarik, and P. Filzmoser (2011). Iterative stepwise regression imputation using standardand robust methods. Comput Stat Data Anal 55(10), 2793–2806.
For a talk/presentation submission

Multiple imputation for categorical variables with multiplecorrespondence analysis
Vincent Audigier1,?, Francois Husson1, Julie Josse1
1. Agrocampus Ouest?Contact author: [email protected]
Keywords: missing values, categorical data, multiple imputation, multiple correspondence analysis, boot-strap
Missing values are a key problem in statistical practice. Indeed most statistical methods cannot be applieddirectly on an incomplete data set. To handle this issue, one of the common approaches is to perform singleimputation. This consists in imputing missing values by plausible values. It leads to a complete data setthat can be analyzed by any standard statistical method. However, one drawback of single imputation isthat it does not take into account the uncertainty associated with the prediction of missing values based onobserved values. Thus, if we apply a statistical method on the completed data table, the variability of theestimators will be underestimated. To avoid this problem, a solution is to use multiple imputation [5, 4]which consists in predicting different plausible values for each missing entry leading to multiple imputeddata set. The variability amongst the imputed values reflects the variability of prediction.
This presentation proposes a new method of multiple imputation dedicated for categorical variables based onmultiple correspondence analysis (MCA) [2, 3]. This method imputes the missing entries using the principalcomponents method dedicated to categorical data: multiple correspondence analysis. MCA is a principalcomponents method to describe, summarise and visualise multidimensional matrices with categorical data.This powerful method allows us to understand the two-way associations between variables as well as thesimilarities between individuals. Imputation using MCA benefits of the relationships between variablesand similarities between individuals. To reflect the uncertainty of the MCA parameters (i.e. the principalscomponents and the loading) from one imputation to the next, we use a non-parametric bootstrap approach.Multiple imputation using MCA (MIMCA) requires estimating a small number of parameters due to thedimensionality reduction property of MCA. It allows the user to impute a large range of data sets. Inparticular, a high number of categories per variable, a high number of variables or a small the number ofindividuals are not an issue for MIMCA. Through a simulation study based on real data sets, the method isassessed and compared to the reference methods (multiple imputation using the loglinear model [6], multipleimputation by logistic regressions [9]) as well to the latest works on the topic (multiple imputation by randomforests [1, 7] or by the Dirichlet process mixture of products of multinomial distributions model [8]). Theproposed method shows good performances in terms of bias and coverage for an analysis model such as amain effects logistic regression model. In addition, MIMCA has the great advantage that it is substantiallyless time consuming on data sets of high dimensions than the other multiple imputation methods.
References
[1] L. L. Doove, S. Van Buuren, and E. Dusseldorp. Recursive partitioning for missing data imputation inthe presence of interaction effects. Computational Statistics & Data Analysis, 72:92–104, 2014.
[2] M. J. Greenacre and J. Blasius. Multiple Correspondence Analysis and Related Methods. Chapman &Hall/CRC, 2006.
[3] L. Lebart, A. Morineau, and K. M. Werwick. Multivariate Descriptive Statistical Analysis. Wiley,New-York, 1984.
For a lightning talk submission

PLS Regression and Multiple Imputation
Philippe Bastien1,*
1. L'Oreal Research & Innovaion, 1 avenue Eugène Schueller, 93601 Aulnay-sous-Bois*Contact author: [email protected]
Keywords: PLS regression, Nipals, EM, Multiple Imputation
There are various ways to deal with missing values. Among conventional methods for handling missing data "listewise deletion" could be considered as a safer or less biaised approach. However if the amount of data that must be discarded under listwise deletion is dramatic other alternatives must be considered. A first strategy is the simple imputation which will substitute a value for each missing value. For example each missing value can be imputed by the average of the complete cases, the nearest neighbour [1], or by the predicted value of a regression model. These ad hoc methods are not without disadvantages, drawing in the first both cases variance-covariances towards zero and in the second case by increasing the observed correlations. Other strategy consist in using the EM algorithm [2] for the estimation of maximum likelihood with incomplete data or the direct Maximum likelihood estimation used in program for structural equation modelling [3]. Although ML represents a major advance over conventional approaches to missing data, it has its limitation. In particular the estimation of the Cox proportional hazard model or the ordered logistic regression model will not be obvious.
The PLS Regression in its standard form with the use of the NIPALS algorithm [4, 5] can deal with missing values. Treatment of missing values with PLS-NIPALS can be implicitly associated as a simple imputation method. The coefficients wh,j of PLS components th are calculated as the slope of the least squares straight line passing through the origin of the set (yi,xh
i,j), with xjh the residual of the regression
of xj on t1,…,th-1. That implicitly amounts replacing the missing points by points located on the slope.
Simple imputation which treats the missing values in a deterministic way does not reflect uncertainty associated with their prediction. If the data are missing at random, and if the parameters of the model do not depend on the process generating the missing values, Rubin in the 1970's [6] proposed to replace each missing value with a set a plausible values that represent the uncertainty about the right value to impute. This process leads to valid statistical inferences that properly reflect the uncertainty due to missing values.
Multiple imputation inference involves three distinct phases:- The missing data are filled in m times to generate m complete data sets.- The m complete data sets are analyses by using standard procedures.The results from the m complete data sets are combined for the inference.As for Bayesian inference, imputations are generated by simulation of the joint posterior distribution of (θ,ymis/yobs). These quantities being unknown, their distribution can be simulated iteratively [7] by using Data Augmentation, a Monte Carlo Markov Chain method which is close in its formulation to the EM algorithm. The posterior distribution is simulated by alternatively drawing the missing values and the parameters.
We will present an application of Multiple Imputation in the framework of PLS logistic regression [8, 9] to predict quality of Bordeaux wine. Results from PLS-NIPALS and PLS MI will be compared.
For a lightning talk submission

Using multiple imputation for a zero-inflatedcontingent valuation with potentially biased sampling
Marouene Mbarek1,2, Damien Rousseliere1,2,?, Julien Salanie3,4
1. AGROCAMPUS OUEST, Department of Economics, Management and Society, Angers, France2. GRANEM; AGROCAMPUS OUEST, Universite d’Angers, Angers, France
3. Universite Jean Monnet, Saint-Etienne, France4. GATE Lyon-Saint-Etienne; Universite de Lyon, France?Contact author: [email protected]
Keywords: Contingent valuation, Multiple Imputation, Sample and Non-response biases
There is a growing interest from social science researchers in multiple imputation (MI). Beyond theclassical application to missing data, MI can also deal with measurement errors [2], comparabilityof international surveys [16], selective drop-out [4] or causal inference using the potential outcomesframework [15]. Building on an argument developed by S. Van Buuren [16], we generate syntheticrecords by MI in order to address a potentially biased sampling.
A biased-sample is a subject of matter in all observational studies [3]. This problem is specially im-portant in contingent valuation analysis [17] as it distorts aggregate economic estimates. Thereforeit has strong implications for public policies. Based on the access to auxiliary data, this approachassumes that the bias depends on known covariates which are fully observable. Therefore it meetsthe MAR (Missing At Random) assumption. We also assume that the distributions of some covari-ates are known. These assumptions are not different from those which are usually necessary for theclassical method (post-stratification or weighting to known population totals)[7]. But as proposedby S. Van Buuren, “Imputation provides fine-grained control over the correction process”. MI canhelp us therefore to introduce sensitivity analysis [11]. This thought experiment approach can alsobe of interest to any pragmatist, institutionalist or reflexive economic methodology [5].
The sample is augmented by new artificial records using various hypotheses and priors. In spite ofits known limits, our MI benchmark algorithm will be AMELIA [10] because informative Bayesianpriors about individual missing data cells can be included. AMELIA has also an advantage in itsflexibility and its efficiency. The incorporation of priors follows basic Bayesian analysis where theimputation turns out to be a weighted average of the model-based imputation and the prior mean,with weights depending of the relative strength of the data and prior [9]. These informative priorcan come from the elicitation of expert belief or from the analysis of previous studies [6]. There arehelpful for handling sparse data [12], which can appear if the sample is strongly biased, as moreadditional artifical records are needed.
Our case study is a contingent valuation of the WTP (Willingness to Pay) for accessing a MPA(Marine Protected Area) in a developing country (Tunisia). To our knowledge, previous studiesdid not correct for biased sampling [14]. In July and August 2012, 315 tourists were surveyedrandomly during their visit to Kuriat islands. Thanks to an access to official statistics on thetourism in Tunisia, we generate 185 additional artificial records (with 100 replications) in orderto correct for missrepresentation of gender and nationality. Additional variables were included inorder to keep the imputation model and the substantive (or econometric) model congenial [13].Our econometric models are the ZiOP (Zero-inflated ordered probit) which is a double-hurdlecombination of a split probit model and an ordered probit model [8] and its extension the ZiOPCwhich assumes that the two errors terms are correlated [1]. These models address the problem oftwo distinct data generating processes for the zeros. One type corresponds to individuals who willalways refuse to pay for MPA (because of ideological reasons), whereas the other type refers to acorner solution. Our robutness checks show that age, income and environment perceptions are themain determinants of WTP.
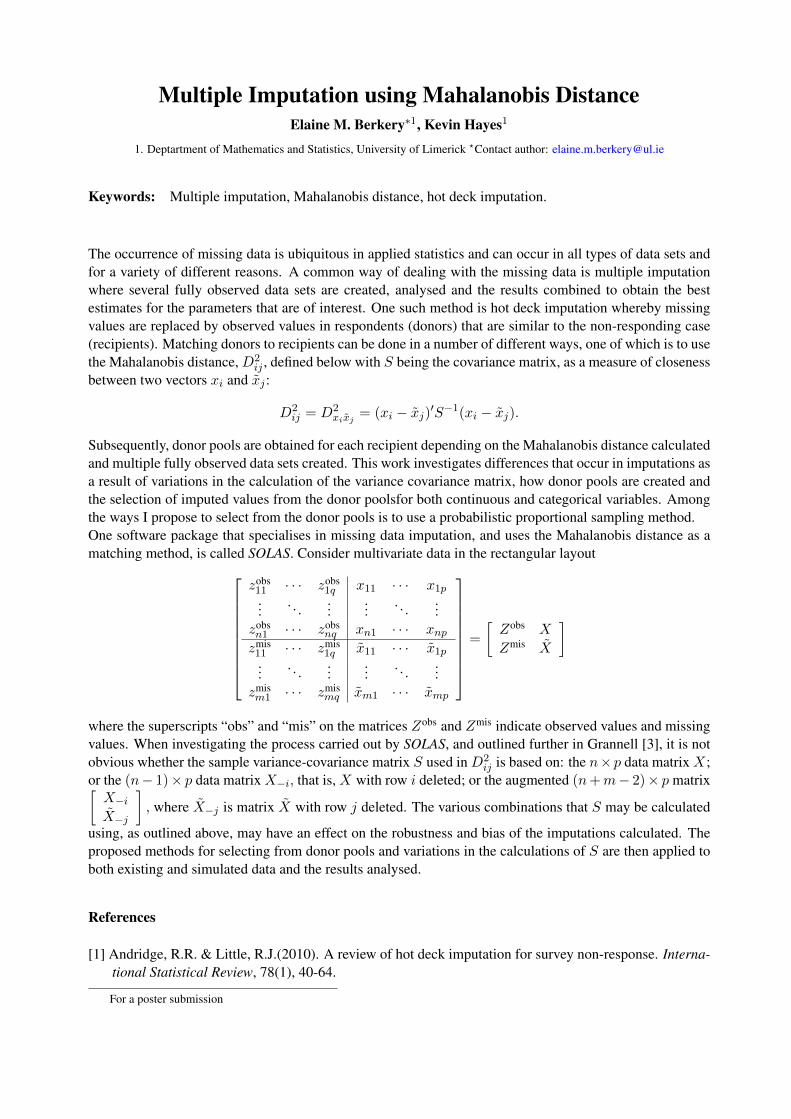
Multiple Imputation using Mahalanobis DistanceElaine M. Berkery∗1, Kevin Hayes1
1. Deptartment of Mathematics and Statistics, University of Limerick ?Contact author: [email protected]
Keywords: Multiple imputation, Mahalanobis distance, hot deck imputation.
The occurrence of missing data is ubiquitous in applied statistics and can occur in all types of data sets andfor a variety of different reasons. A common way of dealing with the missing data is multiple imputationwhere several fully observed data sets are created, analysed and the results combined to obtain the bestestimates for the parameters that are of interest. One such method is hot deck imputation whereby missingvalues are replaced by observed values in respondents (donors) that are similar to the non-responding case(recipients). Matching donors to recipients can be done in a number of different ways, one of which is to usethe Mahalanobis distance, D2
ij , defined below with S being the covariance matrix, as a measure of closenessbetween two vectors xi and xj :
D2ij = D2
xixj= (xi − xj)
′S−1(xi − xj).
Subsequently, donor pools are obtained for each recipient depending on the Mahalanobis distance calculatedand multiple fully observed data sets created. This work investigates differences that occur in imputations asa result of variations in the calculation of the variance covariance matrix, how donor pools are created andthe selection of imputed values from the donor poolsfor both continuous and categorical variables. Amongthe ways I propose to select from the donor pools is to use a probabilistic proportional sampling method.One software package that specialises in missing data imputation, and uses the Mahalanobis distance as amatching method, is called SOLAS. Consider multivariate data in the rectangular layout
zobs11 · · · zobs
1q x11 · · · x1p...
. . ....
.... . .
...zobsn1 · · · zobs
nq xn1 · · · xnpzmis11 · · · zmis
1q x11 · · · x1p...
. . ....
.... . .
...zmism1 · · · zmis
mq xm1 · · · xmp
=
[Zobs X
Zmis X
]
where the superscripts “obs” and “mis” on the matrices Zobs and Zmis indicate observed values and missingvalues. When investigating the process carried out by SOLAS, and outlined further in Grannell [3], it is notobvious whether the sample variance-covariance matrix S used in D2
ij is based on: the n×p data matrix X;or the (n− 1)× p data matrix X−i, that is, X with row i deleted; or the augmented (n+m− 2)× p matrix[
X−iX−j
], where X−j is matrix X with row j deleted. The various combinations that S may be calculated
using, as outlined above, may have an effect on the robustness and bias of the imputations calculated. Theproposed methods for selecting from donor pools and variations in the calculations of S are then applied toboth existing and simulated data and the results analysed.
References
[1] Andridge, R.R. & Little, R.J.(2010). A review of hot deck imputation for survey non-response. Interna-tional Statistical Review, 78(1), 40-64.
For a poster submission

Multiple Imputation of Missing Categorical Data using Latent Class Models: State of Art
Davide Vidotto¹* , Jeroen K. Vermunt¹
1. Department of Methodology and Statistics, Tilburg University*Contact author: [email protected]
Keywords: latent class models, missing data, mixture models, multiple imputation.
This work offers a review of the use of latent class models for multiple imputation of missing categorical data in large-scale analyses. Multiple imputation requires models that are able to describe all the possible associations among the items of a dataset to accurately draw imputing values from the posterior distribution of the missing data. Latent class (or finite mixture) models, besides being a well-known clustering tool, are good density-estimators of nominal variables. Unlike several other imputation models for categorical data that have been proposed in the literature, latent class models can pick up high-order relations in high-dimensional datasets, thus supplying a powerful imputation engine for large-scale studies. In this work an overview of both frequentist and Bayesian implementations, along with analogies and differences of such methods, is provided.
References
[1] Si, Y. & Reiter, J. P. (2013). Nonparametric Bayesian Multiple Imputation for Incomplete Categorical variables in large scale surveys. Journal of Educational and Behavioral Statistics, 38, 499-521.
[2] Van der Palm, D. W., Van der Ark, L. A. & Vermunt, J. K. (2013). A comparison of incomplete-data methods for categorical data. Statistical methods in Medical research.
[3] Vermunt, J. K., Van Ginkel, J. R., Van der Ark, L. A. & Sijtsma, K. (2008). Multiple imputation of incomplete categorical data using latent class analysis. Sociological Methodology, 38, 369 – 397.
For a poster submission

Proposition of a multiple imputation approach for MNARmechanism using Heckman’s model
Jacques-Emmanuel Galimard1,2,? , Sylvie Chevret1,2,3, Matthieu Resche-Rigon1,2,3
1. INSERM U1153 ECSTRA team2. Paris Diderot University
3. AP-HP, Saint-Louis Hospital?Contact author: [email protected]
Keywords: Missing Not At Random (MNAR), Multiple Imputation: chained equation, Heckman model
Standard implementations of multiple imputation (MI) approaches provide unbiased inferences assumingunderlying MAR mechanisms. However, in presence of missing data generated though MNAR mecha-nisms, although the MAR assumptions can be approached by collecting more explanatory variables, MI isnot satisfactory and difficult to validate. Coming from econometric statistics, the Heckmans method, alsocalled the sample selection method, deals with selected sample using two joined linear equations, namelythe selection equation and the outcome equation, respectively [1, 2]. The Heckmans method has been suc-cessfully applied to missing outcomes in presence of MNAR mechanism. Nevertheless, such a method dealswith missing outcomes only, and this is a strong limitation in clinical epidemiology settings where covariatesare also often missing.
We propose to extend the validity of MI to MNAR mechanisms by using the Heckmans model as the im-putation model, using a two-step estimation process. This will provide a solution that can be used in a MIby chained equation framework to impute missing variables (outcomes or covariates) resulting either froma MNAR or a MAR mechanism.
This approach will be validated by a simulation study. It will be evaluated in presence of missing outcomeand missing covariates either under MNAR or MAR mechanisms.
References
[1] Heckman, J. J. (1976). The common structure of statistical models of truncation, sample selection andlimited dependent variables and a simple estimator for such models. In Annals of Economic and SocialMeasurement, Volume 5, number 4, pp. 475 – 492. NBER.
[2] Heckman, J. J. (1979). Sample selection bias as a specification error. Econometrica: Journal of theeconometric society, 153 –161.
For a poster submission

Conferences, Friday, 19th 9h30 – 10h20
Handling Missing Data in Matched Case-Control
Studies using Multiple Imputation
Shaun SeamanMedical Research Council Biostatistics Unit, UK
The analysis of matched case-control studies is often complicated by missing data on covariates.One solution is to restrict the analysis to individuals with complete data, but this is inefficient andmay be biased. We instead propose two multiple imputation methods. The first uses a model forthe data on an individual and includes matching variables; the second uses a model for the dataon a whole matched set and avoids the need to model the matching variables. Both methods allowfor multiple partially-observed covariates, non-monotone missingness patterns and multiple controlsper case. They can be easily applied in standard statistical software and valid variance estimatesobtained using Rubin’s Rules. We demonstrate, in a simulation study, approximate unbiasedness oflog-odds ratio estimators and good coverage of confidence intervals, and compare the efficiency ofthe two methods. Data on colorectal cancer and fibre intake from the EPIC-Norfolk study are usedto illustrate the methods, in particular showing how efficiency is gained relative to restricting theanalysis to individuals with complete data, and the choice of method is discussed.
Conferences, Friday, 19th 10h20 – 11h10
Gaussian-based routines for imputing categorical
variables in complex data
Murat Recai YucelUniversity of Albany, United States
This presentation focuses on computationally feasible ideas on developing imputation models. Ourmain motivation is to employ these ideas in data structures with unique complexities such as largenumber of incompletely-observed categorical variables, multilevel data and/or clustered data withmultiple membership. Our computational routines modify computationally advantageous Gaussian-based methods that use Markov Chain Monte Carlo techniques to sample from posterior predictivedistribution of missing data. Specifically, we propose rounding rules to be used with these existingimputation methods, allowing practitioners to obtain usable imputation with small biases. Theserules are calibrated in the sense that values re-imputed for observed data have distributions similarto those of the observed data. The methodology is demonstrated using a sample data from theNewYork Cancer Registry database.

Conferences, Friday, 19th 11h40 – 12h30
Multiple Imputation for Complex Surveys: An
Overview of the State of the Art
Joseph L. SchaferCensus Bureau, Washington, United States
Multiple imputation (MI) was proposed by Donald Rubin in 1977 as a general paradigm for handlingnonresponse in surveys, censuses and administrative databases. Over the last decade, it has gainedwidespread acceptance in many fields of quantitative research, and nearly every major statisticalsoftware package now performs MI in some fashion. In some cases, MI has been applied to complexsurveys, but in other cases survey practitioners still find MI too daunting to implement. In thispresentation, I review the history of MI, describe the statistical and nonstatistical challenges it posesin the survey world, and look ahead to future developments in this area. Statistical issues include:mismatch between the imputation model and subsequent analyses; the challenges of jointly imputinglarge numbers of survey variables of mixed types; the need to preserve complex interactions; the needto reflect important features of the sample design; hierarchical or multilevel structures with missingvalues at multiple levels; preservation of skip patterns and logical constraints. Nonstatistical issuesinclude: the availability and utility of software; perceived and actual difficulty of carrying out MI ina production environment; perceived and actual difficulty of explaining MI to data users and clients;and organizational culture and priorities

Conferences, Friday, 19th 12h30 – 13h20
Triply robust inference in the presence of missing
survey data
David Haziza1, Valery Dongmo Jiongo2, Pierre Duchesne1
1 Departement de mathematiques et de statistique, Universite de Montreal, Montreal, Quebec,Canada
2 Business Survey Methods Division, Statistics Canada, Ottawa, Ontario, Canada
Item nonresponse is typically treated by some form of single imputation in statistical agencies. Forexample, deterministic regression imputation that includes ratio and mean imputation within classesas special cases, is widely used in surveys. Recently, there has been an interest in doubly robustimputation procedures. An imputation procedure is said to be doubly robust when the resultingimputed estimator is consistent if either the imputation model (also called the outcome regressionmodel) or the nonresponse model is correctly specified. However, in the presence of influential units ,the resulting imputed estimator may be potentially very unstable. We propose a robust version of thedoubly robust imputed estimator based on the concept of conditional bias of a unit. Implementationof the proposed method via a calibrated imputation procedure will be discussed. Finally, the resultsfrom an empirical study will be shown.

Conferences, Friday, 19th 14h45 – 15h35
From Image to Video Inpainting, with Patches
Patrick PerezTechnicolor, France
Visual inpainting, the task of completing an image region, is an important component of imageediting and enhancement, from home photo touch-up to professional movie post-production. After15+ years of research (which we will briefly summarize), the problem remains challenging, especiallyfor videos. As an attempt to progress on that front, we propose a novel automatic video inpaintingalgorithm which relies on the optimization of a global, patch-based functional. Our algorithm is ableto deal with a variety of challenging situations which naturally arise in video inpainting, such asthe correct reconstruction of dynamic textures, multiple moving objects, and moving background.Furthermore, we achieve this in an order of magnitude less execution time with respect to the state-of-the-art. We are also able to achieve good quality results on high-definition videos. The resultingalgorithm requires no segmentation or manual input other than the definition of the inpainting maskand can deal with a wider variety of situations than is handled by previous work.

Conferences, Friday, 19th 15h35 – 16h25
Missing data in astrophysics
Sandrine PirezCEA Saclay
Astrophysics deals with the physics of the universe and covers many different areas including cosmol-ogy, the study of astrophysical objects such as stars, galaxies, cosmic microwave background, ...Theobservation of these astrophysical objects from ground and space produces every day a more andmore important quantity of data. To capitalize on these increasingly large data sets and study theUniverse with ever-greater precision, we have to be able to correct the data from all the observationalbias.
A problem that is frequent during astrophysical observations is the occurence of missing data. Al-though missing data are very common in astrophysics, they can severely bias the data analysis.Various methods are currently used to correct from missing data. They depend both on the analysisto be performed and on the characteristics of the signal.
Recently, we have proposed to replace these methods by a more general method: a sparse inpaintingmethod that I will describe. The introduction of the sparse inpainting to correct from missing datain astrophysics already had some success on several areas. A comparison with the methods currentlyused will be presented, for these applications.