Conference Call - Q1/2017 Results · next decade: Acquisition of Akorn and Merck KGaA’s...
24
Conference Call – Q1/2017 Results Bad Homburg, 3 May 2017 Frankfurt stock exchange: FRE │ US ADR program: FSNUY │ www.fresenius.com/investors
Transcript of Conference Call - Q1/2017 Results · next decade: Acquisition of Akorn and Merck KGaA’s...

Conference Call – Q1/2017 Results
Bad Homburg, 3 May 2017
Frankfurt stock exchange: FRE │ US ADR program: FSNUY │ www.fresenius.com/investors

Safe Harbor Statement
This presentation contains forward-looking statements that are subject to various risks and uncertainties. Future results could differ materially from those described in these forward-looking statements due to certain factors, e.g. changes in business, economic and competitive conditions, regulatory reforms, results of clinical trials, foreign exchange rate fluctuations, uncertainties in litigation or investigative proceedings, and the availability of financing. Fresenius does not undertake any responsibility to update the forward-looking statements contained in this presentation.
Q1/2017 Results, 3 May 2017, © Fresenius SE & Co. KGaA Investor Relations 2

Fresenius Group: Q1/2017 Highlights
Q1/2017 Results, 3 May 2017, © Fresenius SE & Co. KGaA Investor Relations 3
Fresenius Kabi’s U.S. business well positioned for the next decade: Acquisition of Akorn and Merck KGaA’sbiosimilars business
HELIOS internationalization: Successful closing of Quirónsalud acquisition
All business segments contributed to strong organicsales growth
Excellent earnings growth
Group earnings guidance raised on a like-for-like basis1
1 Before transaction costs of ~€50 million for the acquisitions of Akorn, Inc. and Merck KGaA’s biosimilars business; before expected expenditures for the further development of Merck KGaA’s biosimilars business of ~€50 million (expected closing H2/17)
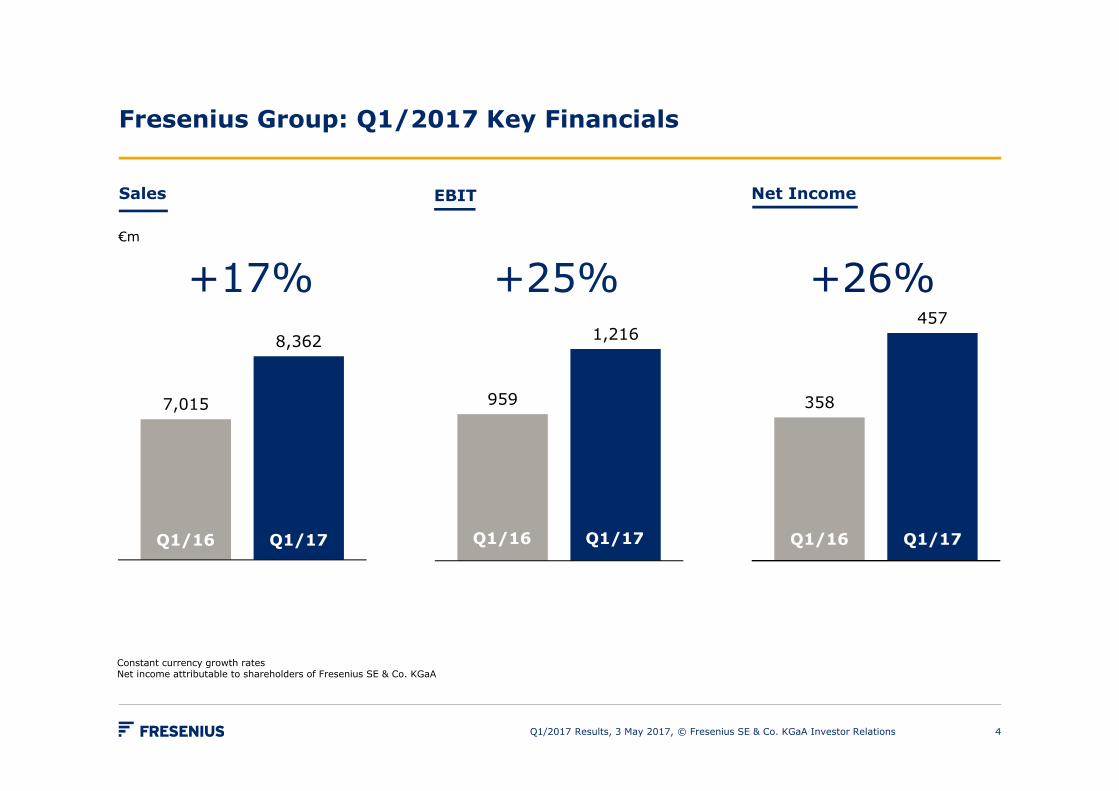
7,015
8,362
Q1/16 Q1/17
Fresenius Group: Q1/2017 Key Financials
4
Sales Net IncomeEBIT
+17% +25% +26%
Constant currency growth ratesNet income attributable to shareholders of Fresenius SE & Co. KGaA
959
1,216
Q1/16 Q1/17
358
457
Q1/16 Q1/17
€m
Q1/2017 Results, 3 May 2017, © Fresenius SE & Co. KGaA Investor Relations

Fresenius Group: Profit and Loss Statement
Q1/2017 Results, 3 May 2017, © Fresenius SE & Co. KGaA Investor Relations 5
€m Q1/2017 ∆ Q1 YoY1
Sales 8,362 17%
EBIT 1,216 25%
Net interest -157 -3%
Income taxes -308 -31%
Net income2 457 26%
1 Constant currency growth rates2 Net income attributable to shareholders of Fresenius SE & Co. KGaA

Fresenius Group: Q1/2017 Business Segment Growth
6
Organic sales growth
Q1/2017 Results, 3 May 2017, © Fresenius SE & Co. KGaA Investor Relations
EBIT growth in constant currency
+8%1
+7%
+5%
+2%
+28%
+2%
+60%
-29%
+7%1 +25%
1 Excluding the agreement with the United States Departments of Veterans Affairs and Justice at Fresenius Medical Care North America

Fresenius Kabi (1/2)
Q1/2017 Results, 3 May 2017, © Fresenius SE & Co. KGaA Investor Relations 7
North America
• 4% organic sales growth despite tough Q1/16 comp
• Gradual easing of IV drug shortages: 15 Kabi-marketed products currently designated in shortage vs. 16 at YE 2016
• New product launches: expected to be back-end loaded in FY/17;confirm 10+ target
• 2016 Pharmaceutical Supplier of the Year
• Confirm FY/17 outlook: mid-single-digit organic sales growth
Europe
• 7% organic sales growth
• Improved contract manufacturing business
• Confirm FY/17 outlook: low to mid-single-digit organic sales growth
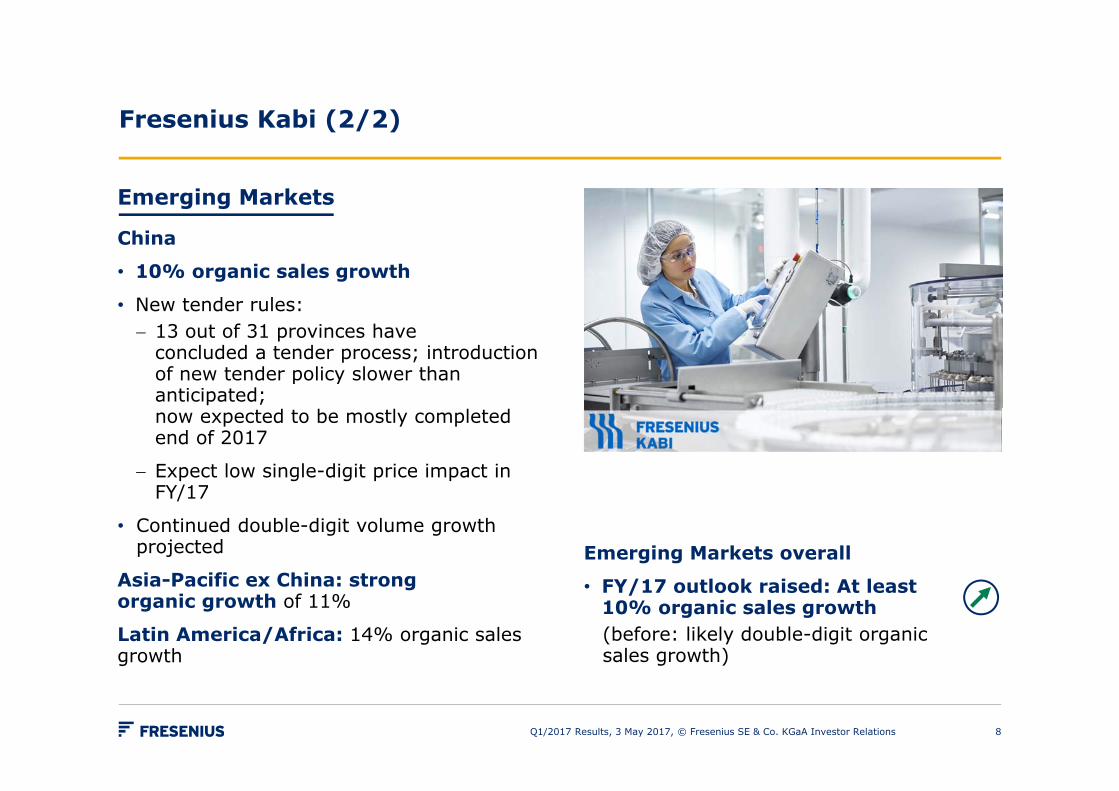
Fresenius Kabi (2/2)
Q1/2017 Results, 3 May 2017, © Fresenius SE & Co. KGaA Investor Relations 8
Emerging Markets
China
• 10% organic sales growth
• New tender rules: 13 out of 31 provinces have
concluded a tender process; introduction of new tender policy slower than anticipated; now expected to be mostly completed end of 2017
Expect low single-digit price impact in FY/17
• Continued double-digit volume growth projected
Asia-Pacific ex China: strong organic growth of 11%
Latin America/Africa: 14% organic sales growth
Emerging Markets overall
• FY/17 outlook raised: At least 10% organic sales growth(before: likely double-digit organicsales growth)

Fresenius Kabi: EBIT
Q1/2017 Results, 3 May 2017, © Fresenius SE & Co. KGaA Investor Relations 9
€m Q1/2017 ∆ Q1 YoY1
EuropeMargin
8014.7%
3%-30 bps
North AmericaMargin
23638.1%
-2%-220 bps
Asia-Pacific/Latin America/AfricaMargin
8619.5%
26%170 bps
Corporate and Corporate R&D -89 -14%
Total EBITMargin
31319.5%
2%-110 bps
1 Constant currency growth rates
Margin growth at actual rates

Fresenius Helios
Q1/2017 Results, 3 May 2017, © Fresenius SE & Co. KGaA Investor Relations 10
1 Organic sales growth
1,435 1,528
-
490
Q1/16 Q1/17
+5%Sales1
€m
HELIOS Kliniken
• Excellent organic sales growth (+5%) driven by solid admissions growth
• Opening of new hospital buildingin Duisburg (Germany)
Quirónsalud
• Consolidated since February 1, 2017
• Off to an excellent start: Strong sales and EBIT development
• First proton beam therapy center in Spain
2,018
1,435
HELIOS Kliniken Quirónsalud

Fresenius Helios: Key Financials
Q1/2017 Results, 3 May 2017, © Fresenius SE & Co. KGaA Investor Relations 11
€m Q1/2017 ∆ Q1 YoY
Total sales 2,018 41%
Thereof HELIOS Kliniken 1,528 6%
Thereof Quirónsalud 490 --
Total EBITMargin
25512.6%
60%150 bps
Thereof HELIOS KlinikenMargin
18111.8%
14%70 bps
Thereof QuirónsaludMargin
7415.1%
----
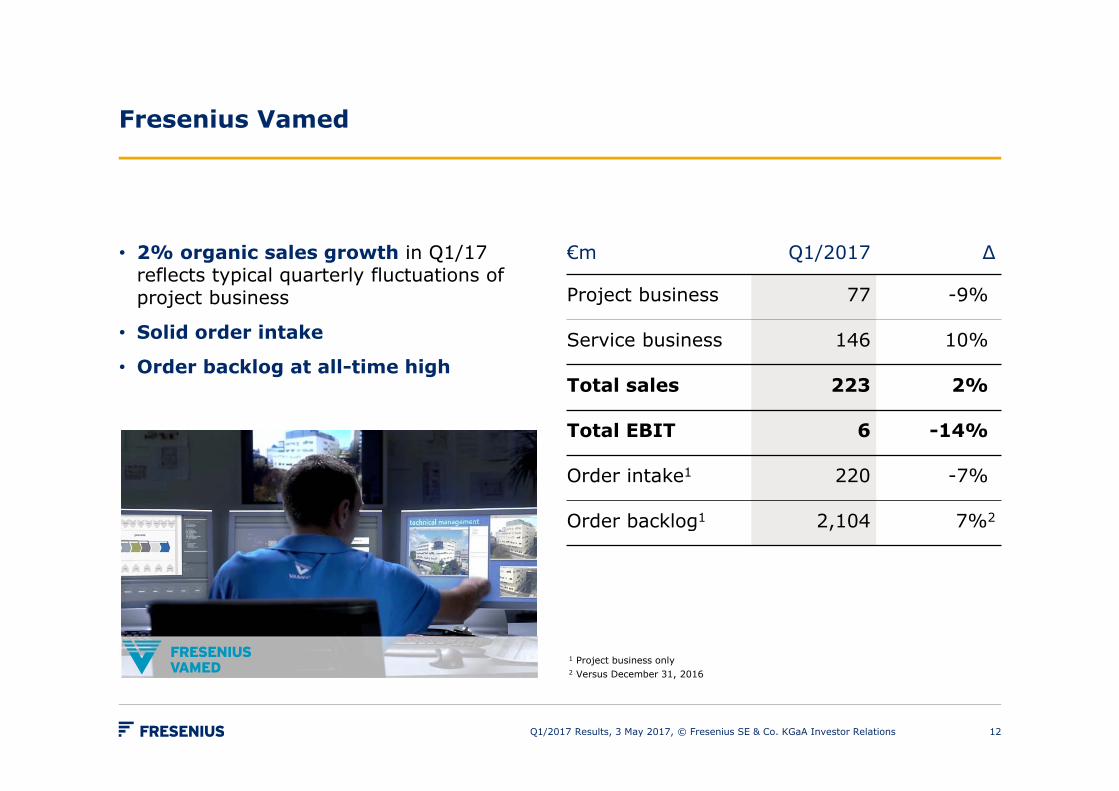
Fresenius Vamed
Q1/2017 Results, 3 May 2017, © Fresenius SE & Co. KGaA Investor Relations 12
€m Q1/2017 ∆
Project business 77 -9%
Service business 146 10%
Total sales 223 2%
Total EBIT 6 -14%
Order intake1 220 -7%
Order backlog1 2,104 7%2
1 Project business only2 Versus December 31, 2016
• 2% organic sales growth in Q1/17 reflects typical quarterly fluctuations of project business
• Solid order intake
• Order backlog at all-time high

Fresenius Group: Cash Flow
Q1/2017 Results, 3 May 2017, © Fresenius SE & Co. KGaA Investor Relations 13
Operating CF Capex (net) Free Cash Flow1
€m Q1/2017 LTM Margin Q1/2017 LTM Margin Q1/2017 LTM Margin
192 17.4% -84 -5.7% 108 11.7%
184 11.5% -45 -5.5% 139 6.0%3
-44 0.1% -1 -0.9% -45 -0.8%
Corporate/Other -26 n.a. -3 n.a. -29 n.a.
306 13.6%2 -133 -5.3% 173 8.3%2
476 12.1% -328 -5.2% 148 6.9%
1 Before acquisitions and dividends2 Margin incl. FMC dividend3 Understated: 6.5% excluding €37 million of capex commitments from acquisitions
Excl. FMC

€m except otherwise stated
20161
Base2017e1
PreviousQ1/20171
Actual2017e1
New
Sales growth (org) 6,007 5% – 7% 7%
EBIT growth (cc) 1,171 5% – 7% 2% 6% – 8%2
Sales growth (org) 5,8433 3% – 5%3 5%
Sales (reported) 5,8433 ~8.6 bn4 2.0 bn
EBIT 6833 1,020–1,0705 255
Sales growth (org) 1,160 5% – 10% 2%
EBIT growth 69 5% – 10% -14%
1 All data according to IFRS2 Before transaction costs of ~€50 million for the acquisitions of Akorn, Inc. and Merck KGaA’s biosimilars business; before expected expenditures for the further
development of Merck KGaA’s biosimilars business of ~€50 million (expected closing H2/17) 3 HELIOS Kliniken Germany, excluding Quirónsalud4 Thereof Quirónsalud (11 months consolidated): ~€2.5bn 5 Thereof Quirónsalud (11 months consolidated): EBIT of €300 to €320m
Fresenius Group: 2017 Financial Outlook by Business Segment
Q1/2017 Results, 3 May 2017, © Fresenius SE & Co. KGaA Investor Relations 14

€m except otherwise stated
20161
Base2017e1
PreviousQ1/20171
Actual2017e1
New
Sales growth (cc)
29,471 15% – 17% 17%
Net income2
growth (cc)1,560 17% – 20% 26% 19% – 21%3
Fresenius Group: 2017 Financial Guidance
Q1/2017 Results, 3 May 2017, © Fresenius SE & Co. KGaA Investor Relations 15
1 All data according to IFRS2 Net income attributable to shareholders of Fresenius SE & Co. KGaA3 Before transaction costs of ~€50 million for the acquisitions of Akorn, Inc. and Merck KGaA’s biosimilars business; before expected expenditures for the further
development of Merck KGaA’s biosimilars business of ~€50 million (expected closing H2/17)

Attachments
Q1/2017 Results, 3 May 2017, © Fresenius SE & Co. KGaA Investor Relations 16

Financial results by business segment
Q1/2017 Results, 3 May 2017, © Fresenius SE & Co. KGaA Investor Relations 17
Q1/2017 ∆ Q1 YoY
Sales €4,548 m 16%
EBIT €651 m 31%
Sales €1,604 m 9%
EBIT €313 m 3%
Sales €2,018 m 41%
EBIT €255 m 60%
Sales €223 m 2%
EBIT €6 m -14%
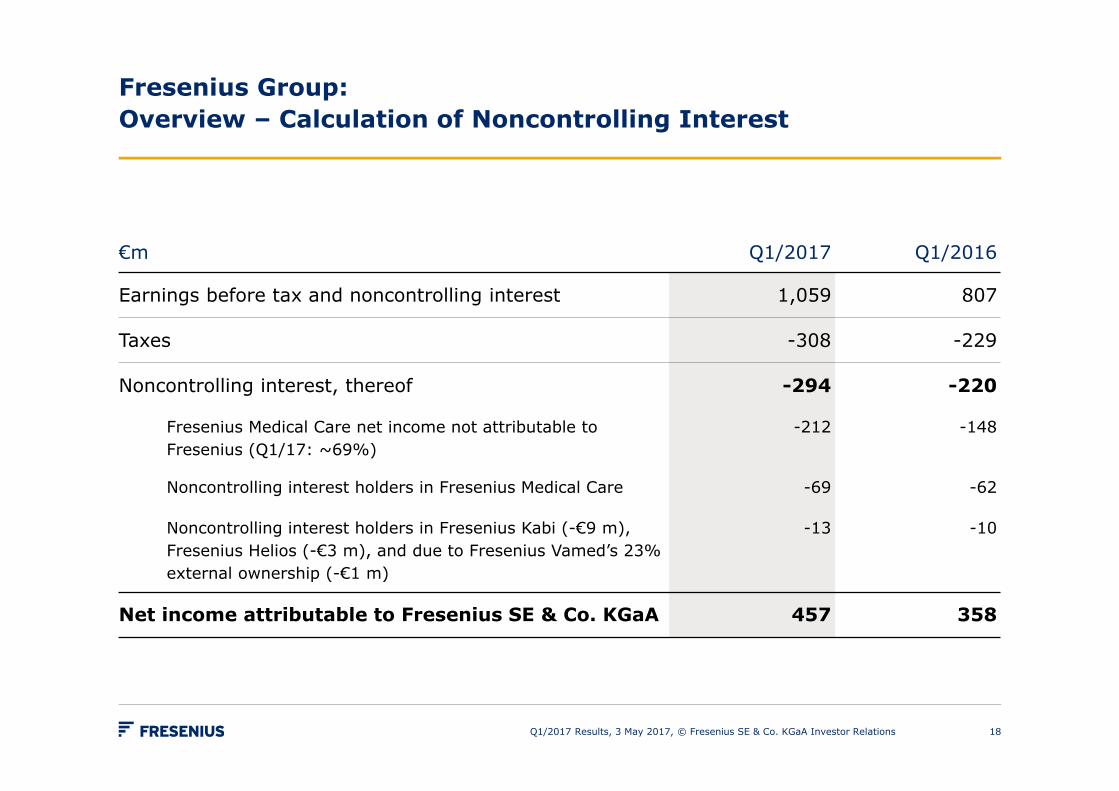
Fresenius Group: Overview – Calculation of Noncontrolling Interest
Q1/2017 Results, 3 May 2017, © Fresenius SE & Co. KGaA Investor Relations 18
€m Q1/2017 Q1/2016
Earnings before tax and noncontrolling interest 1,059 807
Taxes -308 -229
Noncontrolling interest, thereof -294 -220
Fresenius Medical Care net income not attributable to Fresenius (Q1/17: ~69%)
-212 -148
Noncontrolling interest holders in Fresenius Medical Care -69 -62
Noncontrolling interest holders in Fresenius Kabi (-€9 m), Fresenius Helios (-€3 m), and due to Fresenius Vamed’s 23% external ownership (-€1 m)
-13 -10
Net income attributable to Fresenius SE & Co. KGaA 457 358

Fresenius Group: Cash Flow
Q1/2017 Results, 3 May 2017, © Fresenius SE & Co. KGaA Investor Relations 19
€m Q1/2017 LTM Margin ∆ YoY
Operating Cash Flow 476 12.1% 41.7%
Capex (net) -328 -5.2% 1.8%
Free Cash Flow(before acquisitions and dividends)
148 6.9% --
Acquisitions (net) -5,468
Dividends -73
Free Cash Flow(after acquisitions and dividends)
-5,393 -14.3% --
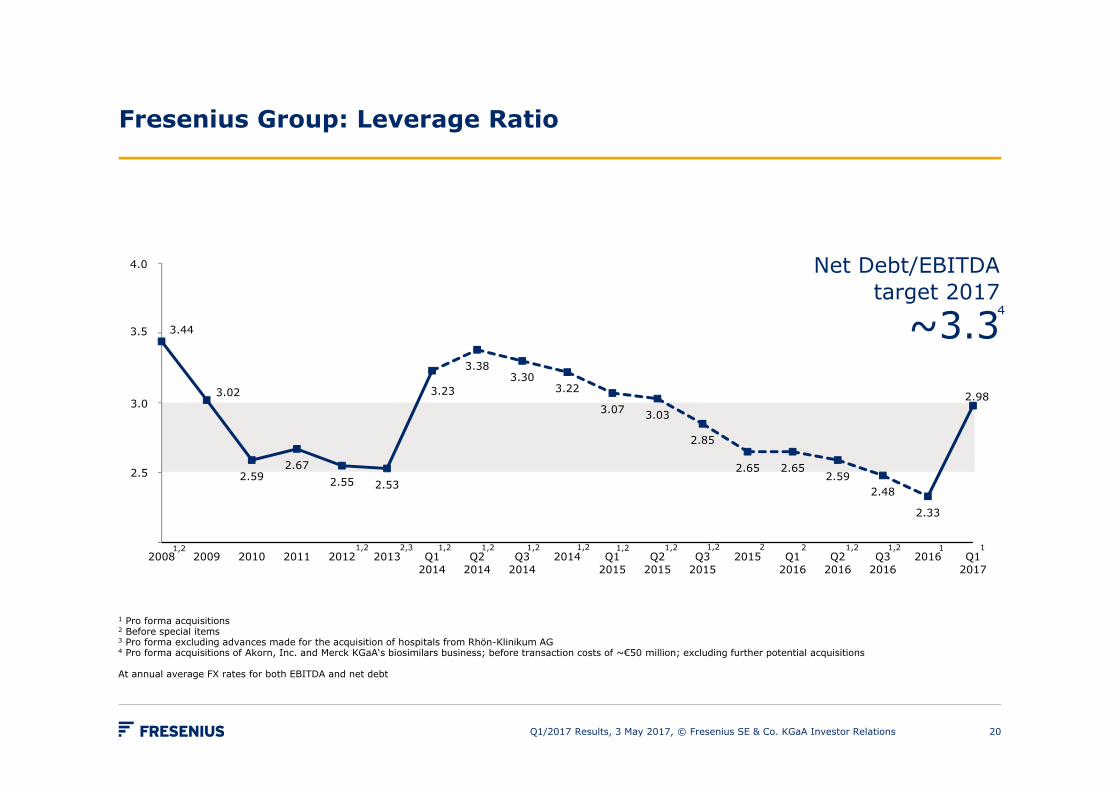
1 Pro forma acquisitions2 Before special items3 Pro forma excluding advances made for the acquisition of hospitals from Rhön-Klinikum AG4 Pro forma acquisitions of Akorn, Inc. and Merck KGaA‘s biosimilars business; before transaction costs of ~€50 million; excluding further potential acquisitions
At annual average FX rates for both EBITDA and net debt
3.44
3.02
2.592.67
2.55 2.53
3.23
3.383.30
3.22
3.07 3.03
2.85
2.65 2.652.59
2.48
2.33
2.98
2.00
2.50
3.00
3.50
4.00
2008 2009 2010 2011 2012 2013 Q12014
Q22014
Q32014
2014 Q12015
Q22015
Q32015
2015 Q12016
Q22016
Q32016
2016 Q12017
Fresenius Group: Leverage Ratio
Q1/2017 Results, 3 May 2017, © Fresenius SE & Co. KGaA Investor Relations 20
Net Debt/EBITDA target 2017
~3.3
1,2 2,3 1,21,2 1,2 1,2 21,2 21,2 1,2 1,21,2
4.0
3.5
3.0
2.5
1 11,2
4

Fresenius Kabi: Organic Sales Growth by Product Segment
Q1/2017 Results, 3 May 2017, © Fresenius SE & Co. KGaA Investor Relations 21
€m Q1/2017OrganicGrowth
IV Drugs 702 6%
Infusion Therapy 227 9%
Clinical Nutrition 407 8%
Medical Devices/Transfusion Technology
268 7%
Total sales 1,604 7%
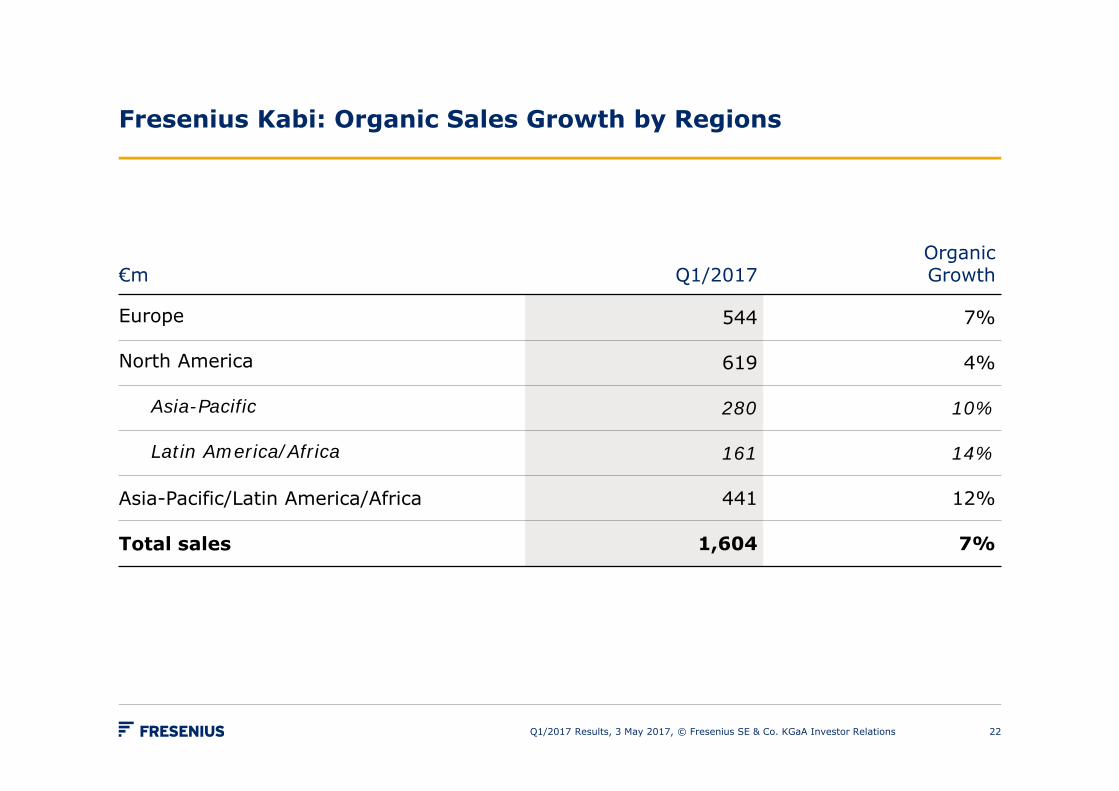
Fresenius Kabi: Organic Sales Growth by Regions
Q1/2017 Results, 3 May 2017, © Fresenius SE & Co. KGaA Investor Relations 22
€m Q1/2017OrganicGrowth
Europe 544 7%
North America 619 4%
Asia-Pacific 280 10%
Latin America/Africa 161 14%
Asia-Pacific/Latin America/Africa 441 12%
Total sales 1,604 7%

HELIOS Kliniken: Performance Indicators
Q1/2017 Results, 3 May 2017, © Fresenius SE & Co. KGaA Investor Relations 23
Q1/2017 Q1/2016 Change
No. of hospitals1
- Acute care clinics- Post-acute care clinics
1128824
1128824
0%0%0%
No. of beds1
- Acute care clinics- Post-acute care clinics
34,53329,3615,172
34,70629,6185,088
0%-1%2%
Admissions - Acute care (inpatient) 325,558 308,586 5%
Occupancy- Post-acute care 79% 76%
Average length of stay (days)- Acute care2
- Post-acute care6.3
25.96.4
25.3
1 December 31, 20162 German average (2015): 7.3
Financial Calendar /Contact
Financial Calendar 2017
12.05.2017 Annual General Meeting, Frankfurt/Main
01.08.2017 Report on 2nd quarter 2017
02.11.2017 Report on 3rd quarter 2017
Please note that these dates could be subject to change.
ContactInvestor RelationsFresenius SE & Co. KGaAphone: +49 6172 608-2485e-mail: [email protected] further information and current news: www.fresenius.com
Follow us on Twitter www.twitter.com/fresenius_irand LinkedIn: www.linkedin.com/company/fresenius-investor-relations
Q1/2017 Results, 3 May 2017, © Fresenius SE & Co. KGaA Investor Relations 24