Conference Call Full Year 2015 Results - indocement.co.id Release/2016/03. Maret... · ASI includes...
20
Conference Call Full Year 2015 Results 29 March 2016 Christian Kartawijaya, CEO Tju Lie Sukanto, CFO Disclaimer: Information presented here is not intended for further publication
Transcript of Conference Call Full Year 2015 Results - indocement.co.id Release/2016/03. Maret... · ASI includes...

Conference Call Full Year 2015 Results 29 March 2016
Christian Kartawijaya, CEO
Tju Lie Sukanto, CFO
Disclaimer: Information presented here is not intended for further publication

Indonesian Cement Industry 2015 Landscape Lafarge Indonesia
1.8 mio ton Semen Bosowa
5.4 mio ton
Semen Baturaja
2.0 mio ton
Semen Indonesia
14.4 mio ton
Semen Puger
0.5 mio ton
Semen Kupang/Merah Putih
0.6 mio ton
Jui Shin
1.6 mio ton
Semen Indonesia
7.8 mio ton
Holcim Indonesia
11.4 mio ton
Semen Indonesia
8.2 mio ton
Merah Putih
0.8 mio ton
Indocement
20.5 mio ton
Total Cement Capacity in 2015:
78.6 mio tons Source: ASI and internal estimation
Anhui Conch
1.3 mio ton
Conference Call Full Year 2015 Results
Slide 2
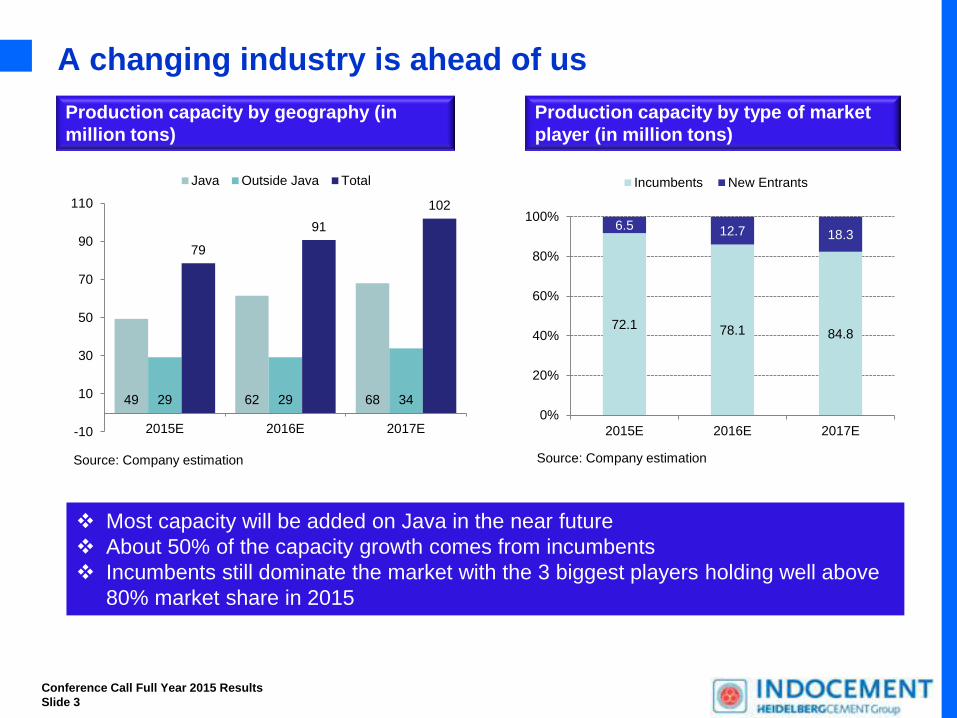
A changing industry is ahead of us
49 62 68 29 29 34
79
91
102
-10
10
30
50
70
90
110
2015E 2016E 2017E
Java Outside Java Total
Conference Call Full Year 2015 Results
Slide 3
72.1 78.1 84.8
6.5 12.7 18.3
0%
20%
40%
60%
80%
100%
2015E 2016E 2017E
Incumbents New Entrants
Most capacity will be added on Java in the near future
About 50% of the capacity growth comes from incumbents
Incumbents still dominate the market with the 3 biggest players holding well above
80% market share in 2015
Source: Company estimation Source: Company estimation
Production capacity by type of market
player (in million tons)
Production capacity by geography (in
million tons)

47.1 47.5 47.5 47.5 46.1 44.9 44.9 44.9 48.7
50.9 54.1
60.2 64.2
72.2
78.0
90.5
103.1
113.3 116.1
122.4 126.0
131.5 133.5
26.0 27.2 27.7 30.2 31.5 31.9
34.2 38.1 38.4
40.8
48.0
55.0 58.0 59.9 61.0
64.1 68.5
75.4
82.9 87.9
93.2
98.8
104.7
111.0
117.7
12.5 4.7 1.7 9.2 4.3 1.3 7.0 11.4 0.9 6.2 17.7 16.6 7.8 4.3 -3.0 5.0 7.0 10.0 10.0 6.0 6.0 6.0 6.0 6.0 6.0
Domestic Supply Domestic Demand Growth
Demand/Supply Outlook: Oversupply Market
Export
Consumption per
capita = 248kg Comparison:
Malaysia: 639 kg
Thailand: 564 kg
Vietnam: 502 kg
Consumption
per capita =
413kg
CAGR 2001-2015: 6.3% CAGR 2016-2025: 7.0%
Source: ASI and internal estimation
Conference Call Full Year 2015 Results
Slide 4

Yearly Volume & % Growth of Cement Consumption in
Indonesia of 15 years
vs GDP movement year by year
Source: Indonesian Cement Association, BPS Statistic
Conference Call Full Year 2015 Results
Slide 5
27.2 27.5 30.2 31.5 32.1
34.2
38.1 39.1 40.8
48.0
54.9 58.0
60.0 60.4
4.4% 4.7% 5.1% 5.6% 5.4%
6.3% 6.1%
4.6%
6.1% 6.5% 6.8% 5.7%
5.1% 4.7%
0.0%
2.0%
4.0%
6.0%
8.0%
10.0%
12.0%
14.0%
16.0%
18.0%
20.0%
-
10.0
20.0
30.0
40.0
50.0
60.0
70.0
2002 2003 2004 2005 2006 2007 2008 2009 2010 2011 2012 2013 2014 2015
Domestic consumption (LHS) Cement growth % (RHS) GDP growth % (RHS)
In million tons

Indonesia’s Infrastructure Budget
114
146 156 153
224
314
27%
7%
-2%
46%
40%
-10%
0%
10%
20%
30%
40%
50%
0
50
100
150
200
250
300
350
Real 2011 Real 2012 Real 2013 Real 2014* Real 2015* 2016 budget
Infrastructure Budget (IDR tr) Growth of Infrastructure Budget (RHS)
Conference Call Full Year 2015 Results
Slide 6
There is a clear commitment to additional infrastructure
development which is urgently needed in Indonesia
Source: Citi

Infrastructure Projects (Java Area) and our Participation
No. ProjectsProject
Started
Project
Finished
Total
KM
Concrete
Used M3
1 Toll road Sorean - Pasir Koja Oct-15 May-17 8.5 80,000
2 Toll road Solo Kertosono Aug-15 Dec-16 7.0 1,500,000
3 Toll road Antasari - Depok - CMNP Mar-15 Mar-17 12.0 180,000
4 Toll road Bogor - Ciawi - Sukabumi section 2 and 3 Oct-15 Oct-17 10.0 210,000
5 Toll Serpong - Balaraja Apr-16 Apr-19 58.0 208,000
6 Cisundawa Mar-16 Mar-16 60.0 980,000
7 High speed railway Apr-16 Apr-19 150.0 230,000
8 Bandara Kertajati Apr-16 Apr-17 40,000
9 Toll Bawen - Solo Mid 2016 Mid 2018 17.6 352,000
10 PLTU Batang Mid 2016 Mid 2019 200,000
11 PLTU Tg Jati II Mid 2016 Mid 2019 250,000
12 Cisongkam Dam Mar-16 Mar-20 1,000,000
5,230,000
Conference Call Full Year 2015 Results
Slide 7
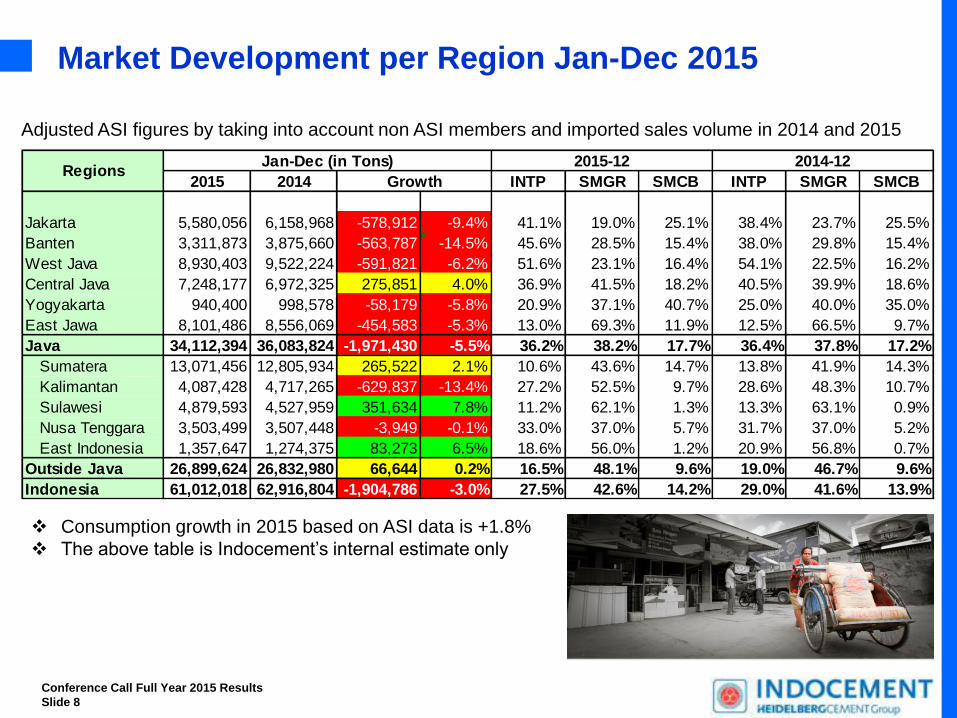
Market Development per Region Jan-Dec 2015
Jan-Dec (in Tons) 2015-12 2014-12
2015 2014 Growth INTP SMGR SMCB INTP SMGR SMCB
Jakarta 5,580,056 6,158,968 -578,912 -9.4% 41.1% 19.0% 25.1% 38.4% 23.7% 25.5%
Banten 3,311,873 3,875,660 -563,787 -14.5% 45.6% 28.5% 15.4% 38.0% 29.8% 15.4%
West Java 8,930,403 9,522,224 -591,821 -6.2% 51.6% 23.1% 16.4% 54.1% 22.5% 16.2%
Central Java 7,248,177 6,972,325 275,851 4.0% 36.9% 41.5% 18.2% 40.5% 39.9% 18.6%
Yogyakarta 940,400 998,578 -58,179 -5.8% 20.9% 37.1% 40.7% 25.0% 40.0% 35.0%
East Jawa 8,101,486 8,556,069 -454,583 -5.3% 13.0% 69.3% 11.9% 12.5% 66.5% 9.7%
Java 34,112,394 36,083,824 -1,971,430 -5.5% 36.2% 38.2% 17.7% 36.4% 37.8% 17.2%
Sumatera 13,071,456 12,805,934 265,522 2.1% 10.6% 43.6% 14.7% 13.8% 41.9% 14.3%
Kalimantan 4,087,428 4,717,265 -629,837 -13.4% 27.2% 52.5% 9.7% 28.6% 48.3% 10.7%
Sulawesi 4,879,593 4,527,959 351,634 7.8% 11.2% 62.1% 1.3% 13.3% 63.1% 0.9%
Nusa Tenggara 3,503,499 3,507,448 -3,949 -0.1% 33.0% 37.0% 5.7% 31.7% 37.0% 5.2%
East Indonesia 1,357,647 1,274,375 83,273 6.5% 18.6% 56.0% 1.2% 20.9% 56.8% 0.7%
Outside Java 26,899,624 26,832,980 66,644 0.2% 16.5% 48.1% 9.6% 19.0% 46.7% 9.6%
Indonesia 61,012,018 62,916,804 -1,904,786 -3.0% 27.5% 42.6% 14.2% 29.0% 41.6% 13.9%
Regions
Adjusted ASI figures by taking into account non ASI members and imported sales volume in 2014 and 2015
Consumption growth in 2015 based on ASI data is +1.8%
The above table is Indocement’s internal estimate only
Conference Call Full Year 2015 Results
Slide 8

13,576 14,259 13,745 16,427 14,076 14,868 14,050 16,916
13,626 14,088
15,411
17,882
10,000
11,000
12,000
13,000
14,000
15,000
16,000
17,000
18,000
19,000
Q1 Q2 Q3 Q4
2013 2014 2015
Market has surpassed the trough
Positive market development in Q3 and Q4
Clear indication that infrastructure spending has picked-up and
trend is expected to continue
Source: ASI, incl. imports
+9%
ASI includes data from new members of Merah Putih and Juishin starting in 2015
In thousand tons
Market sales development
+16%
Conference Call Full Year 2015 Results
Slide 9

Indocement sales development in line with our strategy
Continued trend of lower sales
volume development than
market development
Margin orientation
New market players
Capacity share
Domestic Sales in ‘000 tons FY Domestic Sales
2013: 17,975 m tons +0.5%
2014: 18,499 m tons +2.9%
2015: 17,052 m tons -7.7%
Export Sales in ‘000 tons
Exports still significantly lower
than domestic sales
Potential for more exports in
low demand periods
3,000
3,500
4,000
4,500
5,000
5,500
Jan-Mar Apr-Jun Jul-Sep Oct-Dec
2013 4,219 4,514 4,187 5,054
2014 4,296 4,676 4,226 5,301
2015 3,947 4,300 3,965 4,870
10
67
106
34
17 26
78
35
21
52
74 66
0
20
40
60
80
100
120
Jan-Mar Apr-Jun Jul-Sep Oct-Dec
2013 2014 2015
FY Export Sales
2013: 217 t tons
2014: 156 t tons
2015: 213 t tons
Conference Call Full Year 2015 Results
Slide 10

14,459 14,568 12,943
3,517 3,931
4,109
2,000
4,000
6,000
8,000
10,000
12,000
14,000
16,000
18,000
20,000
2013 2014 2015
Bag Bulk
The importance of bulk sales increases
Strong concrete demand expected due to Government infrastructure spending
Indocement positions itself as a reliable partner for infrastructure projects
providing quality bulk cement and concrete at timely delivery
Stronger focus on increasing bulk sales
High bulk volume in Jakarta
Indocement benefits from proximity to Jakarta
24%
76%
19%
81%
21%
79%
In thousand tons
Bag/bulk sales composition Jan - Dec
Conference Call Full Year 2015 Results
Slide 11
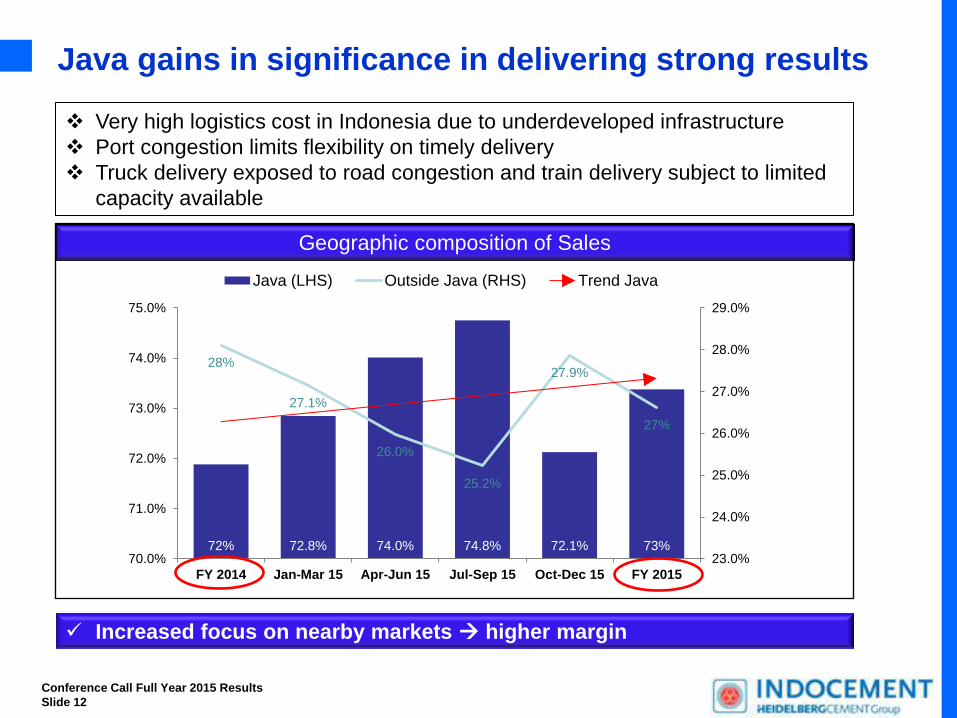
Java gains in significance in delivering strong results
Very high logistics cost in Indonesia due to underdeveloped infrastructure
Port congestion limits flexibility on timely delivery
Truck delivery exposed to road congestion and train delivery subject to limited
capacity available
Increased focus on nearby markets higher margin
Geographic composition of Sales
72% 72.8% 74.0% 74.8% 72.1% 73%
28%
27.1%
26.0%
25.2%
27.9%
27%
23.0%
24.0%
25.0%
26.0%
27.0%
28.0%
29.0%
70.0%
71.0%
72.0%
73.0%
74.0%
75.0%
FY 2014 Jan-Mar 15 Apr-Jun 15 Jul-Sep 15 Oct-Dec 15 FY 2015
Java (LHS) Outside Java (RHS) Trend Java
Conference Call Full Year 2015 Results
Slide 12

Financial Result
Consolidated Statement of Comprehensive Income
January to
December 31, 2015
January to
December 31, 2014
in IDR mio in IDR mio in IDR mio in %
(Restated)
Net Revenues 17,798,055 19,996,264 (2,198,209) -11.0%
Cost of Revenues -9,888,919 -10,890,037 1,001,118 -9.2%
Gross Profit 7,909,136 9,106,227 (1,197,091) -13.1%
% of Net Revenues 44.4% 45.5%
Operating Expenses -2,879,720 -3,226,452 346,732 -10.7%
Other Operating Income 27,514 121,094 (93,580) -77.3%
Operating Income 5,056,930 6,000,869 (943,939) -15.7%
% of Net Revenues 28.4% 30.0%
EBITDA 6,010,646 6,879,092 (868,446) -12.6%
% of Net Revenues 33.8% 34.4%
Finance Income 562,856 790,122 (227,266) -28.8%
Equity in net earnings of
associated companies - net25,325 24,487 838 3.4%
Final Income Tax -535 -842 307 -36.5%
Income before Income Tax 5,644,576 6,814,636 (1,170,060) -17.2%Income Tax Expense - Net -1,287,915 -1,521,220 233,305 -15.3%
Income for the Period 4,356,661 5,293,416 (936,755) -17.7%
% of Net Revenues 24.5% 26.5%
Variance
Conference Call Full Year 2015 Results
Slide 13

Sound margin development in 2015
Despite a competitive environment Management delivered on its margin
guidance by taking respective initiatives early on during the year:
Operational Excellence program
Fix cost reduction program
Managing efficient kiln utilization
INTP EBITDA margin development
New market entrants leading to higher competition and pricing pressure but
Indocement delivers superior margin development compared to peers
INTP Gross margin development
34.8% 34.5% 34.0% 33.8%
25%
27%
29%
31%
33%
35%
37%
39%
Jan-Mar Jan-Jun Jan-Sep Jan-Dec
2013 2014 2015
44.5% 45.0%
44.6% 44.4%
40%
41%
42%
43%
44%
45%
46%
47%
48%
Jan-Mar Jan-Jun Jan-Sep Jan-Dec
2013 2014 2015
Conference Call Full Year 2015 Results
Slide 14

Favorable cost development helped to partly offset
negative development from pricing
Fuel and power positively impacted by lower coal price and by running the most efficient
kilns in 2015 but negatively impacted from weakening Rupiah and higher electricity
price after significant increase starting May 2014
Future operation of new kiln P14 in 2016 will provide a significant potential on improving
manufacturing cost
Fuel and Power composition in % Composition of Manufacturing cost as %
Trend
40.0%
50.0%
60.0%
70.0%
80.0%
90.0%
100.0%
2013 2014 2015
Fuel Power
50/50
Fuel and power composition moved
from 60/40 to 50/50
Conference Call Full Year 2015 Results
Slide 15
25.7 9.9 44.1 20.3 26.1 10.4 43.4 20.2 0
10
20
30
40
50
Raw Materials Direct labor Fuel and Power Man. Overhead
Jan-Dec 2014 Jan-Dec 2015in %

Balance Sheet Consolidated Statement of Financial Position
Conference Call Full Year 2015 Results
Slide 16
December 31, 2015 December 31, 2014
in IDR mio in IDR mio in IDR mio %
(Restated)
Assets
Current Assets 13,133,854 16,087,370 (2,953,516) -18%
Non-current Assets 14,504,506 12,797,265 1,707,241 13%
Total Assets 27,638,360 28,884,635 (1,246,275) -4%
Liabilities and Equity
Current Liabilities 2,687,743 3,260,559 (572,816) -18%
Non-current Liabilites 1,084,667 1,047,063 37,604 4%Total Liabilities 3,772,410 4,307,622 (535,212) -12%
Equity attributable to Owners of
the Partent Entity 23,865,950 24,577,013 (711,063) -3%
Non-controlling interest - - -
Total Equity 23,865,950 24,577,013 (711,063) -3%
Total Liabilites and Equity 27,638,360 28,884,635 (1,246,275) -4%
Variance

1 brownfield project with capacity of 4.4 mio ton and investment cost of Rp5.5 – 6
trillion – first clinker by end of Q1/2016
1 unit an aero derivative gas turbine (ADGT) to supply 73 MW (including power supply
from Steam Turbine to Citeureup factory with electricity cost cheaper than current PLN
cost – GT & Steam turbine will run in full by Q3/2016
1 Cement and packing terminal in Pontianak to strengthen our bagged cement supply
in West Kalimantan area – ready by Q2/2016
2 greenfield or brownfield project with each capacity of 2.5 mio ton one in Central Java
(under appeal process for Environmental permit issues) and one in outside Java
16.6 30-33 17.1 18.6 20.6 25
2005 2007 2010 2014 2016 2020/2025
Million Tons
+ 0.6 mt + 1.5 mt + 1.9 mt
+ 4.4 mt
+ 5-8 mt
Strategically well positioned to capitalize on further demand
Capacity Expansion & Future Investment to participate
in Industry Growth
Conference Call Full Year 2015 Results
Slide 17

Outlook for 2016
National market 2016 estimated to grow about 3%-5%
Strong concrete and bulk cement demand anticipated due to Government's infra
projects
− Secured our concrete market by having good andesite quarry and sand supply from
Ketapang and Belitung by signing exclusive LT supply contract with local partners
Several new market players expected to enter the market
Possible price pressure in weak quarters but stabilizing trend in stronger months
Commodity prices expected to stay at current level but further weakening of
Rupiah anticipated
P14 will be ramped up quickly to capitalize on cost savings
Clinker exports will be done in low demand periods
Lower Capex spending due to finalization of our brownfield project P14
Strong balance sheet with no gearing provides sufficient headroom for leading
the market well especially in our home market
Conference Call Full Year 2015 Results
Slide 18

Challenges in Year 2016 onward How to win in a very tight Competitive Cement Market?
Cost Management
In Land: Traffic & Truck Availability
Train & Vessels: Double-handling cost; limited deep water Port
Strong Brand & Corporate Image
High Quality, Availability & Excellent Customer Services
Strong 40 year Distributorship network
• Infrastructure
Development in
Java & Outside Java
• Domino-effect for
residential/ housing
development after
infrastructure is
fully developed
• More sophisticated
design of
infrastructure &
building (MRT, Dam,
& 50-60 stories
building) require
high quality cement
& concrete
Conference Call Full Year 2015 Results
Slide 19

For Better Building Thank you
Indocement 40th Anniversary –
Strong and Reliable in Developing the Nation
Conference Call Full Year 2015 Results
Slide 20