Conference Call about the 2013 Results - Itaúsa · Realização PPA Itaú Unibanco x Redecard (38)...
59
Conference Call about the 2013 Results
Transcript of Conference Call about the 2013 Results - Itaúsa · Realização PPA Itaú Unibanco x Redecard (38)...

Conference Call about the 2013 Results

AGENDA
2
• Parent Company/ Individual- Sustainability
• Performance of the Main Companies
Itautec
Elekeiroz
Duratex
Itaú Unibanco
• Itaúsa in the Stock Market
Henri Penchas
Investor Relations Officer

Parent Company / Individual - Sustainability

Conference Call about the 2013 Results
Sustainability – Ownership structure – December 31, 2013
4
(*) Excluding the shares held by controlling interests and treasury shares. (C) Common Shares (P) Preferred Shares

Conference Call about the 2013 Results
Sustainability – Net Debt(1)
Share of Own Assets x Third Party Assets (%)
% Own assets
% Third party assets
12/31/2013 R$ million
1,301
936
365
5
Total Debt
• Dividends payable
• Other payables
92 93 92 96
8 7 84
12/31/2010 12/31/2011 12/31/2012 12/31/2013
(1) Individual balance sheet.

Conference Call about the 2013 Results
Sustainability – Net Debt (1)
6
Net Debt Index
Overall Liquidity
Debt Index
(1) Individual balance sheet
Overall Liquidity: Fiancial Assets + Tax Assets + Other Non Fiancial Assets
Current and Non Current Liabilities
Debt Index (%): Current and Non Current Liabilities x 100
Total Assets
Net Debt Index (%): (Loans + Dividends Payable – Dividends Receivable – Cash and Deposit on Demand) x 100
Shareholders’ Equity
0.9 1.0 0.91.3
8.4%
7.3%8.0%
3.8%
2.9%2.1% 2.3%
0.4%
12/31/2010 12/31/2011 12/31/2012 12/31/2013

Conference Call about the 2013 Results
Flow of Dividends and Interest on Capital (1)
CAGR (09 – 13): 11.1%
CAGR (09 – 13): 11.1%
7
R$ million
Dividends/ Interest on Capital Paid/ Payable by Itaúsa
Dividends/ Interest on Capital Received/ Receivable
directly and indirectly from Itaú Unibanco Holding
1,232
1,427
1,617 1,662
1,878
1,232
1,427
1,617 1,662
1,877
2009 2010 2011 2012 2013
(1) Interest on Capital net of income tax (IRRF).

Conference Call about the 2013 Results
Dividends and Interest on Capital (1) Net of Capital Increase
8
R$ million
Increase in Capital Dividends / Interest on capital net of
capital increase
(1) Interest on Capital net of income tax (IRRF).
965 966 1,015
1,617
762
1,352
450266
412 900
5251,415
1,232
1,427
1,617 1,662
1,877
2008 2009 2010 2011 2012 2013

Conference Call about the 2013 Results
Div./Interest on capital for the
Year net of capital increaseCapital increaseTheoretical growth of 10%
Comparative Div./ Interest on Capital (1) for the Year net of Capital Increase
1,427 1,617 1,662
-412
1,015
0
1,617
-900
762
1,877
-525
1,352
1,1161,228
2013
9
1,352
20122010 2011
R$ million
Dividends and interest
on capital for the Year
(1) Interest on Capital net of income tax (IRRF).
It is worth noting that total dividends/interest on capital of 2013, net of capital increases, represent the theoretical growth to 10% per year over
the net amount for 2010.

Conference Call about the 2013 Results
Dividend Yield in %
2.552.81
3.37
3.88
3.16 3.19
3.83
4.47
2.36
3.19
2.18
3.38
2010 2011 2012 2013
Itaú Itaúsa Itaúsa Net of Capital Increase
10
Dividend/ Interest on Capital per share related to base year (x)
Closing Price of Preferred Shares in 12/31/(x-1) – adjusted by bonus in shares, split and inplit.

Conference Call about the 2013 Results
Total Assets (1)
CAGR (10 – 13): 7.9%
CAGR (10 – 13): 7.0%
11
(1) Balanço Individual.
R$ million
Total Assets
Investments in Subsidiary Companies
28,07531,043 31,964
34,432
25,62528,996 29,688 32,181
12/31/2010 12/31/2011 12/31/2012 12/31/2013

Conference Call about the 2013 Results
Composition of Investments by Area (1)
12
R$ million
Duratex
1,542
Elekeiroz
486
Itautec
46
Financial Area
30,002 (93.3%)
Industrial Area
2,074 (6.4%)
Other Sectors
105 (0.3%)
23.656
34,432
Investments in Subsidiaries 32,181
12/31/2013
(1) Individual Balance Sheet.
Total Assets
Itaúsa
Investments in the
Industrial Area

Conference Call about the 2013 Results
Stockholders’ Equity and Net Income of the Parent Company
CAGR (10 – 13): 8.2%
13
R$ million
Net Income Jan-Dec
Stockholders’ Equity
26,159
29,341 30,027
33,131
4,417 4,837 4,5395,698
12/31/2010 12/31/2011 12/31/2012 12/31/2013
CAGR (10 – 13): 8.9%

Conference Call about the 2013 Results
Distribution of Profit by Sector
(1) Information available at the Selected Quarterly Information Report at www.itausa.com.br.
14
R$ million
6,035 96.9% 4,874 98.2% 23.8%
193 3.1% 88 1.8% 119.3%
199 3.2% 159 3.2% 25.2%
23 0.4% - 0.0% -
(29) -0.5% (71) -1.4% -59.2%
(1) 0.0% - 0.0% -
6,227 100.0% 4,962 100.0% 25.5%
(28) (185)
Total Recurrent Net Income 6,199 4,777 29.8%
Not Recurring Result(1) (501) (238)
5,698 4,539 25.5%Net Income
Itautec
Other
Total of Recurrent Share in Income
Itaúsa’s Own Profit Net of Taxes
Evolution
(%)
Financial Services Area
Industrial Area
Duratex
Elekeiroz
Equity Share in Income
Sectors Jan-Dec/13 % Jan-Dec/12 %

Performance of the Main Companies

Conference Call about the 2013 Results
Results of Itaúsa – Main indicators
16
(1) Based on the average quotation of preferred shares on the last day of the period.
(2) Calculated based on the average quotation of preferred shares on the last day of the period (quotation of average PN multiplied by the number of outstanding shares at
the end of the period).
Note: The number of outstanding shares and the share quotation were adjusted to reflect the 10% bonus carried out on April 30, 2013.
Results per share - in R$ 12/31/2013 12/31/2012 Actual change Change %
Net income of parent company 1.05 0.87 0.18 20.9
Recurring net income of parent company 1.15 0.92 0.23 24.9
Book value of parent company 6.06 5.63 0.43 7.5
Dividends/ interest on capital, net 0.34 0.31 0.03 10.2
Price of preferred share (PN) (1) 8.91 8.81 0.10 1.1
Market capitalization (2)
- R$ million 48,744 46,972 1,772 3.8
Results of Itaúsa - Main indicators R$ million
Parent company Non-controlling interests Consolidated
12/31/2013 12/31/2012 12/31/2013 12/31/2012 12/31/2013 12/31/2012
Net income 5,698 4,539 313 297 6,011 4,836
Recurring net income 6,199 4,777 362 279 6,561 5,056
Stockholders' equity 33,131 30,027 2,843 2,647 35,974 32,674
Annualized return on average equity (%) 18.2% 15.2% 11.3% 11.7% 17.6% 14.9%
Annualized recurring return on average
equity (%)19.8% 16.0% 13.1% 11.0% 19.2% 15.6%
R$ million

Conference Call about the 2013 Results
Reconciliation of recurring net income
17
R$ million
Parent company Non-controlling interests Consolidated
Jan-Dec/13 Jan-Dec/12 Jan-Dec/13 Jan-Dec/12 Jan-Dec/13 Jan-Dec/12
Net income 5,698 4,539 313 297 6,011 4,836
Inclusion/(Exclusion) of non-recurring effects 501 238 49 (18) 550 220
Itaúsa 14 - - - 14 -
Arising from stockholding interest in Itaú Unibanco 189 298 - - 189 298
Resulting from the ownership interest in Itautec 302 (55) 20 (4) 322 (59)
Resulting from the ownership interest in Duratex 16 (5) 30 (14) 46 (19)
Resulting from the ownership interest in Elekeiroz (15) - (1) - (16) -
Arising from interest in other controlled companies (5) - - - (5) -
Recurring net income 6,199 4,777 362 279 6,561 5,056

Conference Call about the 2013 Results
Main financial indicators of Itaúsa group companies
(1)
(1) Consolidated Itaúsa includes the consolidation of 100% of controlled companies. The amounts of Itaú Unibanco are being assessed under the equity method.
(2) Duratex and Itautec: disregard the Operating Revenues classified in Operating Discontinued Results. Consolidated Itaúsa: Sales of Products and Services; Banking
Service Fees and Equity in Earnings of Unconsolidated Companies.
(3) Refers to funds from operations obtained by the Statements of Cash Flows.
Main financial indicators of Itaúsa group companies
R$ million
2013 1,027,297 8,178 730 751 41,929
2012 957,154 7,759 672 1,076 39,050
2013 119,154 3,873 1,004 439 11,157
2012 125,484 3,373 900 700 9,490
2013 16,424 520 39 (389) 6,011
2012 12,634 460 - 1 4,836
2013 83,223 4,365 504 156 35,974
2012 75,902 4,024 476 543 32,674
2013 21.1% 12.3% 8.0% -112.2% 17.6%
2012 16.9% 11.9% 0.1% 0.3% 14.9%
2013 47,706 1,368 71 (183) 962
2012 54,805 1,104 50 (25) 710
Total assets
Operating revenues (2)
Financial
Services
Area Industrial Area
Internal fund generation (3)
Annualized return on average equity
(%)
Net income
Stockholders' equity
January to
December
18

Conference Call about the 2013 Results
Determination of Share of Income – January to December 2013
Determination of Share of Income - January to December 2013 R$ million
ITAÚ
UNIBANCODURATEX ELEKEIROZ ITAUTEC
OTHER
AREASTOTAL
Recurring net income 16,564 562 24 (67) (1)
(x) Direct/Indirect interest 36.87% 35.48% 96.60% 94.01% 100.00%
(=) Share of recurring net income 6,106 199 23 (63) (1) 6,264
(+/-) Share of income not arising from net income (71) - - 34 - (37)
Recurring share of income 6,035 199 23 (29) (1) 6,227
Non-recurring results (189) (16) 15 (302) 5 (487)
Change in treasury shares (99) (2) - - - (101)
Realização PPA Itaú Unibanco x Redecard (38) - - - - (38)
Effect of Adherence at the payment of taxes program - Law nº 12.865/13187 - (1) (1) - 185
Provision ( Tax/Civil lawsuits/Labor claims/Other) (278) - - - - (278)
IRB (Reinsurance) - Change of criteria in the investment recognition 48 - - - - 48
Provisions for economic plans - - 16 - - 16
Realization of Assets (88) - - - - (88)
Porto Seguro-Favorable Decison of STF( Federal Court ) - Incidence of
Cofins Tax 100 - - - - 100
Surplus of Pension Plan (BD - Defined Benefit) - 10 - 21 5 36
Write-off of surplus of pension plan (CD - Defined Contribution) - - - (67) - (67)
Provision for non-realization of deferred tax assets - - - (107) - (107)
Provision for obsolescence of computing inventories - - - (20) - (20)
Provision for reorganization of the computing segment and other - - - (25) - (25)
Write down - Agio Tablemac - (19) - - - (19)
Discontinued Operations - (5) - (103) - (108)
Other (21) - - - - (21)
Share of income 5,846 183 38 (331) 4 5,740
101.8% 3.2% 0.7% -5.8% 0.1% 100.0%
In 2013, the Recurring Share of Income reached R$ 6,227 million, which represented a 25.5% increase as compared to the same
period of the previous year, boosted by the result from the Financial Services Area with a 23.8% increase and Duratex with a
25.2% increase.
As a publicly-held holding company, the results are basically derived from its Recurring Share of Income of its subsidiaries.
We show below the calculation of Share of Income per company.
19

Guilherme Pereira
Investor Relations Officer

Business segments
Profitability in Itautec's business segment has fallen significantly due to a series of factors,
including macroeconomic, trade and competition aspects, which have become worse with
new players entering in Brazil and leveraging scale gains from global production.
Several initiatives were taken in order to adjust the Company to the competitive
conditions in this segment, but they were not enough to reverse the Operating Losses
posted over the last two years.
Therefore, low returns in the past and small prospects for shareholders value in the
future, together with globalization in the business segment, leading Itautec to start Strategic
Repositioning in 2013.21

Operating Income
Nature Extraordinary Events:2011 - Sale of property on Avenida Paulista;2012 - Assets arising from a special judicial order (precatório judicial);2013 Q1 - Recognition of pension plan surplus;2013 Q2 - Impacts of strategic repositioning (not including tax effects for income tax [IR] and social contribution [CS]).
R$ million 2010 1Q11 2Q11 3Q11 4Q11 2011 1Q12 2Q12 3Q12 4Q12 2012 1Q13 2Q13 3Q13 4Q13 2013
Net Revenue 1,571.4 331.4 358.7 384.0 468.2 1,542.3 362.0 439.9 364.9 378.6 1,545.3 287.2 310.4 208.1 245.1 1,050.8
Gross Profit 274.2 65.1 72.4 74.8 68.4 280.7 65.8 57.6 50.0 18.8 192.2 22.7 4.9 16.3 6.3 50.2
Gross Margin (%) 17.5% 19.6% 20.2% 19.5% 14.6% 18.2% 18.2% 13.1% 13.7% 5.0% 12.4% 7.9% 1.6% 7.8% 2.6% 4.8%
Operating Income before Financial Results 13.7 8.6 4.1 11.1 8.5 32.2 11.9 (21.6) (12.4) 15.6 (6.5) 0.6 (209.3) (48.0) (72.2) (329.0)
Nature Extraordinary Events 0.0 0.0 0.0 0.0 (17.0) (17.0) 0.0 0.0 0.0 (65.1) (65.1) (32.2) 163.6 0.0 0.0 131.4
Operating Income before Financial Results - Adjusted 13.7 8.6 4.1 11.1 (8.5) 15.2 11.9 (21.6) (12.4) (49.5) (71.6) (31.6) (45.8) (48.0) (72.2) (197.7)
0.9% 2.6% 1.1% 2.9%
-1.8%
3.3%
-4.9% -3.4%
-13.1% -11.0%-14.7%
-23.1%-29.5%
-40.0%
-30.0%
-20.0%
-10.0%
0.0%
10.0%
2010 1Q11 2Q11 3Q11 4Q11 1Q12 2Q12 3Q12 4Q12 1Q13 2Q13 3Q13 4Q13
Operating Income before Financial Results (Adjusted) % NR
22

05.15.2013
01.10.201406.17.2013
01.14.2014
08.31.2013 02.13.2014
07.31.2013 09.01.2013
Disclosure of Strategic partnership agreement with
OKI Electric , which was subject to prior conditions fulfillment.
Also disclosed the Company decision to gradually decommissioning the Computing segment
Assets transferred to BR Automação
Partnership with OKI Electric formally
agreed, after fulfilling all prior conditions
The Administrative Council for Economic Defense (CADE,
Brazil's anti-trust body) approves the Itautec - OKI
Electric operation
Itautec S.A.'s business purpose
amendedwith commencement of dissenting period
Ending of dissenting period
Conclusion of Computing
products sales in retail segment
Computers production outsourced to honor
corporate and government contracts
Strategic Repositioning
23

Partnership with OKI Electric
Current Ownership Structure
( * ) New corporate name of BR Automação
Calculation of Equity Equivalence ( 2014 )
Having formalized its strategic partnership with
Oki Electric in the Automation and Services
segments as of January 2014, Itautec S.A. will
recognize the results from the units with OKI
Brasil at Equity Equivalence corresponding to its
30% interest.
24

Computing Unit
Gradual decommissioning of Unit
Conclusion of Computing products sales in the Personal segment (retail) in July 2013 ;
Ending of production at the Jundiaí plant, outsourced as of August 2013 ;
Corporate segment's commercial operations maintained to honor existing agreements ;
Computer warranty services agreement signed with OKI Brasil on January 10, 2014. OKI will be
responsible for servicing all Itautec machines through 2019.
All contracts and obligations to supply, maintain and provide warranty servicing for Itautec / InfoWay
machines will be honored, as willl customer service and maintenance services.
25

Financial results
Breakdown of non-recurring
adjustments for 2013
R$ million 2013 2012 2013 vs 2012
Net Revenue 1,050.8 1,545.3 (32.0%)
Gross Profit 50.2 192.2 (73.9%)
Gross Margin 4.8% 12.4% (7,6 p.p.)
Operating Expenses (243.8) (257.1) (5.1%)
Other Gains (Losses), Net (135.4) 58.4 -
EBITDA (a) (310.4) 11.7 -
Income / (Loss) before Income
Tax and Social Contribution(328.8) (2.7) 11911.6%
Net Income / (Loss) (388.7) 1.5 -
Nature Extraordinary Events (b) 232.8 (65.1) -
Net Income / (Loss) Adjusted (155.9) (63.6) 145.1%
EBITDA Adjusted (179.0) (53.4) 235.0%
Cash and Cash Equivalents 53.0 196.4 (73.0%)
Net Debt 155.4 (44.6) -
Total Assets 731.9 1,075.6 (32.0%)
Shareholders' Equity 156.1 543.8 (71.3%)
(a) Earnings Before Interest, Taxes, Depreciation and Amortization
(b) Including special judicial order (precatório judicial) in 2012
Non-recurring results R$ million
- Write-off of Defined Contribution Plan's
surplus (CD Plan) (70.5)
- Non-realization of tax credits (113.7)
- Provision for obsolescence of inventories (21.8)
- Provisions for restructuring - other (26.8)
Total (232.8)
The financial results in this presentation take into account the consolidated financial information before the reclassification of Automation and Services business results,
assets and liabilities. In the accounting financial statements, the results of such businesses are booked at “net profit/(loss) of discontinued operation. 26

Awards and Recognitions
Sustainability
Itautec was awarded in three categories of the World Finance Technology Awards 2013 (made by international magazine World
Finance for best practices in finance and business)
- Latin America's best security solution developer (Editions: 2011/2012/2013)
- Latin America's best banking automation technology solutions company (Editions: 2011/2012/2013)
- Latin America's best solution provider for Middle & Back Office (Edition: 2013)
Environmental Responsibility
Itautec was nominated as finalist in the Communication and Transparency Category for the 2013 Ethics in Business Award
awards*
Itautec's nomination reflected its meticulous disclosure of specific data for internal and external audiences, including business
partners and other stakeholders in relation to the strategic repositioning process and announced partnership with OKI Electric.
( * ) Organized by the Brazilian Business Ethics Institute to recognize organizations taking initiatives to promote ethics in business , currently in its
fourth iteration.
For the second consecutive year, based on its greenhouse gas emissions inventory, Itautec provided voluntary responses to the questionnaire from
the Carbon Disclosure Project (CDP) , which is an initiative of the European financial sector encouraging disclosure of commitments and policies
related to climate change.
Of total waste generated in 2013, some 2,400 tons (83.8 %) were forwarded to specialized firms for reuse as raw materials in different supply
chains.
27

Ricardo Baraldi
Administrative Director

Oxo Gas Plant Acquisition
On December 6, Elekeiroz acquired from Air Products Brasil Ltda. all assets of the
oxo gas production plant located in the Camaçari Petrochemical Complex, Bahia.
The total investment is estimated at R$70 million over two years and covers not only
the assets proper, but also the interconnection with Elekeiroz’s facilities and the
purchase of equipments to adapt the product portfolio to company needs.
As a result, the company, which already produced oxo gas at its Camaçari site and
was also supplied by Air Products, takes in this important source of an input so
indispensable to its oxo-alcohols (n-butanol, 2-ethyl hexanol) and 2-ethyl hexanoic
acid production processes.
With this acquisition, Elekeiroz ensures its supply of this raw material required for
expanding its production and meeting the growing demand in the local market,
particularly for n-butanol, an important material for the acrylic complex that is
currently being set up at that industrial site.29
Fiscal Year 2013 Highlights

443462 470
2011 2012 2013
Shipped Volume (1,000 tons)
2738
81
3%4%
8%
2011 2012 2013
EBITDA (R$ million) and EBITDA Margin (%)
15
0
39
3%
0%
8%
2011 2012 2013
Net Income (R$ million) and ROE (%)
777900
1,004
12%11% 10%
2011 2012 2013
Net Sales (R$ million) and Gross Margin (%)
30
Performance Indicators
CAGR = 3% CAGR = 14%
CAGR = 73%
CAGR = 61%

31
Performance Indicators
Net Income and EBITDA were impacted by the effects of evolving tax-related lawsuits known as “PIS
07/70”.
Low
Indebtedness
The recovery of profitability in
2013 has enabled the Company
to pay out dividends totaling
R$15 million, equivalent to 39%
of its net income.
39
22
2013 2013 recurrent
Net Income (R$ million)
81
57
2013 2013 recurrent
EBITDA (R$ million)
1.1 1.1
0.3
2011 2012 2013
Net Debt / EBITDA
6%
9%
6%
2011 2012 2013
Net Debt / Stockholders' Equity

With 120 years of activity in the Brazilian chemical industry, which grows as does the quality of
life of Brazil’s population (7% increase in apparent consumption of chemicals for 2013), Elekeiroz
is the market leader in its main segments served.
The only integrated producer of oxo derivatives (2-ethyl hexanol, n-butanol, isobutanol, and 2-
ethyl hexanoic acid), organic anhydrides and plasticizers in South America.
A company who regroups and adapts to the current environment:
Increases competencies: creation of the Strategic Planning and R&D team
Gets closer to customers: creation of business units by products
Seeks operational excellence: implementation of industry competitiveness improvement plan
Modernizes its management model: Management Cockpit and new ERP
Innovation: partnerships recently struck with renowned research institutions for developing
products and processes through alternative production routes, especially those which use raw
materials from renewable sources.
Low indebtedness
The recent acquisition of a gas production plant in Bahia confirms that the company
strongly believes in growth opportunities, new developments and investments in Brazil,
so it will play an increasingly relevant role in the industry.32
On the Way to the Future

Marcio Pires
Diretor de Relações com Investidores
Flavio Marassi Donatelli
Investor Relations Director

Highlights
↗ INVESTMENTS during the period: R$601.5 mn
• Completion of Tender Offer for acquisition of additional capital of Tablemac
↗ NET REVENUE OF R$3,872.7 mn, with an annual growth of 14.8%
• Deca: +18.2%• Wood: +13.1%
↗ Recurring adjusted EBITDA reachead R$1,200.1 mn with a margin of 31,0%
• Deca: R$319.5 mn,+9.3% y-o-y, and margin of 23.4%• Wood: R$880.6 mn, +20.3% y-o-y, and margin of 35.1%
↗ Recurring NET INCOME: R$561.6 mn, + 23.3% y-o-y
• Recurring ROE of 13.3%• Disregarding the financial cost of investments, ROE would have gone to 14.2%
↗ PAY OUT of 40% in 2013
• Net remuneration to shareholders of R$ 197.3 mn• Pay out for the year 33% higher than the minimum dividend
34

439.4349.7
455.5561.6
2010 2011 2012 2013
850.6 799.5 1,024.6
1,200.1
31.0%
26.9%
30.4% 31.0%
2010 2011 2012 2013
2,741.8 2,970.43,372.5
3,872.7
2010 2011 2012 2013
Net Revenue (R$ million)
3,453 3,693 4,024 4,365
13.3%
9.8%
11.8%13.3%
2010 2011 2012 2013
PL (R$ million) & Recurring ROE (%) Recurring NET INCOME (R$ million)
Reccuring EBITDA (R$ million) & EBITDA Margin (%)
Financial Highlights
+14.8%
+41.2%+41.1%
+17.1%
+27.8%
+23.3%
+26.4%
+8.5%
35

912 1,094 1,156
1,367
2010 2011 2012 2013
2,312 2,269
2,635 2,668
2010 2011 2012 2013
21,639 25,505 25,772 27,983
2010 2011 2012 2013
1,830 1,876 2,216
2,506
2010 2011 2012 2013
Shipped Volume (´000 items) Net Revenue (R$ million) Recurring EBITDA (R$ million) & Margin
Shipped Volume (in´000 m³) Net Revenue (R$ million) Recurring EBITDA (R$ million) & Margim
580 530 732
881
31.7% 28.3%33.0% 35.1%
2010 2011 2012 2013
270 269 292 319
29.7%
24.6% 25.3% 23.4%
2010 2011 2012 2013
+1.3%
+15.4%
+13.1%
+36.9%+51.9%
+20.4%
+29.3%
+8.6%+18.3%
+49.9% +18.1%
+9.2%
WOOD
DECA
Financial Highlights
36

134.9
109.6
134.7
197.3
0.22
0.18
0.22
0.33
0,00
0,05
0,10
0,15
0,20
0,25
0,30
0
50
100
150
200
250
2010 2011 2012 2013
Shareholder remuneration and dividends per share
(R$ million)
+46.5%
Dividends / Interest on Own Capital net (in R$ million)
Dividends / Interest on Own Capital per share (in R$)
37

Caixa 2014 2015 2016 2017 2018 eapós
996.8
716.4857.2
326.9202.2
348.1
2018 andafter
↗ Amortization schedule (R$ million) ↗ Origin of Debt (%)
Domestic Currency 80.4%Foreign Currency* 19.6%
*(100% hedge)
INDEBTEDNESS
R$´000 12/31/2013 12/31/2012 Var R$ 12/31/2011 Var R$
Short Term Debt 716,373 681,774 34,599 687,902 28,471
Long Term Debt 1,734,468 1,720,013 14,455 1,227,588 506,880
Total Debt 2,450,841 2,401,787 49,054 1,915,490 535,351
Cash 996,843 1,032,077 -35,234 726,159 270,684
Net Debt 1,453,998 1,369,710 84,288 1,189,331 264,667
Net Debt/ Equity (in %) 33.3% 34.0% - 32.2% -
Net Debt/ EBITDA (last 12 months) 1.17 1.33 1.42
Cash
38

Consolidated CAPEX (R$ million)
2008 2009 2010 2011 2012 2013 2014
891.2
427.0 459.6635.8
832.2601.5 500.0
Completion of Tablemac’s Tender Offer (Colombia):
acquisition of all the tendered shares, 14,772,002,647 shares at COP$8.60 / share
additional investment of approximately R$152 million
Duratex now holds 80.62% stake in the Tablemac’s capital stock and starts consolidatingits results in 2014
Expectedwithout M&A
39

Investment of approximately R$1.2 Bn (between 2011 - 2013)
Evolution of Expansion Projects and Aquisitions
ORGANIC GROWTH
Projets Products Capacity Evolução 2013/2012
Itapetininga MDF 520 K m³
Taquari MDP 230 K m³
Queimados Sanitary Ware 2.400K items /year
AQUISITIONS
Projects Products Capacity Evolution 2013/2012
Thermosystem Electronic showers . 1.500K items /year. Net Revenue + 31%. EBITDA + 10%
Mipel Valves.Acquired capacity: 780K items /year
.After adjustment: 2.600K items / year
Tablemac MDF/MDP . 260K m³. Net Revenue 9M13/12: + 26.4%
EBITDA 9M13/12: + 29.8%
40

Positioned to grow
↗ Balanced capital structure to explore M&A opportunities
↗ Completion of major investments in both Divisions
↗ High degree of forest integration
↗ Proximity to customers with geographic diversification
↗ Skilled, focused and motivated team
41

Alfredo Setubal
Executive Vice President and
Investor Relations Officer
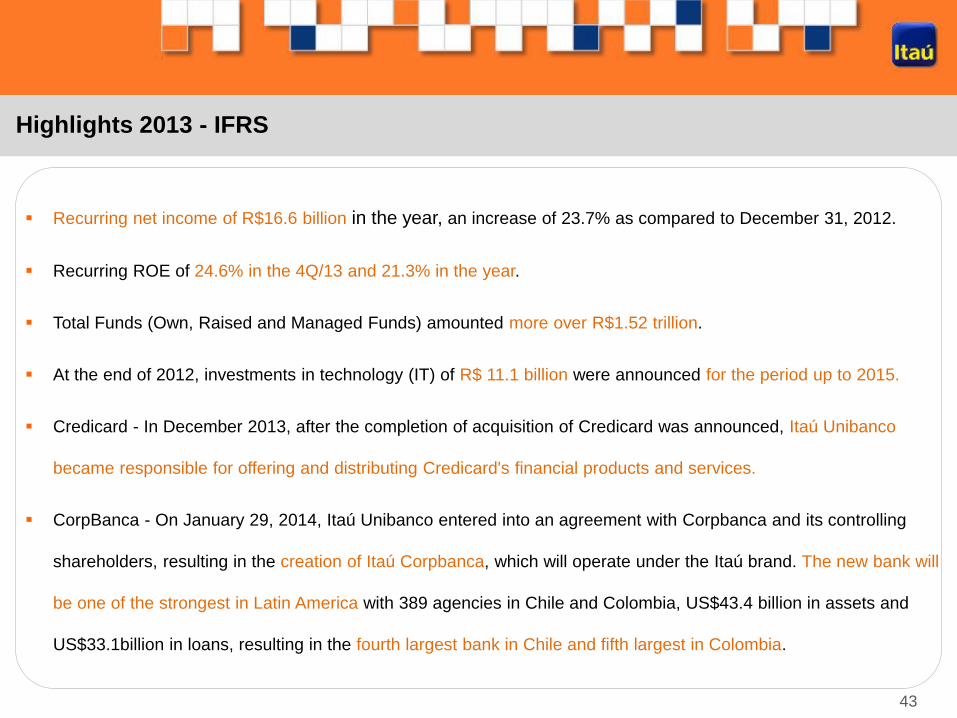
Highlights 2013 - IFRS
Recurring net income of R$16.6 billion in the year, an increase of 23.7% as compared to December 31, 2012.
Recurring ROE of 24.6% in the 4Q/13 and 21.3% in the year.
Total Funds (Own, Raised and Managed Funds) amounted more over R$1.52 trillion.
At the end of 2012, investments in technology (IT) of R$ 11.1 billion were announced for the period up to 2015.
Credicard - In December 2013, after the completion of acquisition of Credicard was announced, Itaú Unibanco
became responsible for offering and distributing Credicard's financial products and services.
CorpBanca - On January 29, 2014, Itaú Unibanco entered into an agreement with Corpbanca and its controlling
shareholders, resulting in the creation of Itaú Corpbanca, which will operate under the Itaú brand. The new bank will
be one of the strongest in Latin America with 389 agencies in Chile and Colombia, US$43.4 billion in assets and
US$33.1billion in loans, resulting in the fourth largest bank in Chile and fifth largest in Colombia.
43

Highlights - IFRS
4444
R$ million
Dec/13 Dec / 12 Dec 13 / Dec 12 (%)
Total Assets 1,027,297 957,154 7.3
Managerial Financial Margin(1) 51,567 55,354 -6.8
Banking Services Fees (2) 29,354 25,361 15.7
Loan Losses and Retained Claims(3) (14,868) (20,973) -29.1
General and Administrative Expenses (38,301) (36,258) 5.6
Stockholder’s Equity(4) 83,223 75,902 9.6
Recurring Net Income(4) 16,564 13,393 23.7
Net Income (4) 16,424 12,634 30.0
Efficiency Ratio (Cumulative of the last 12 months) 49.6% 47.0% 260 bps
Risk – Adjusted Efficiency Ratio (Cumulative of the last 12 months) 68.9% 74.1% -520 bps
(1) Interest and similar income and expense, dividend income, net gain (loss) from financial assets and liabilities, foreign exchange results
and exchange variation on transactions. Considers tax effects of the hedge in investments abroad.
(2) Includes results of insurance operations, pension plan and capitalization.
(3) Net of Recovery.
(4) Controlling Stockholder’s.
Financial Margin with Clients 49,623 51,544 -3.7
Financial Margin with Market 1,944 3,810 -49.0

45
R$ millionSegments
Dec/13 Dec/12 Dec13/Dec12 (%)
Individuals 167,946 151,123 11.1
Companies 275,827 242,872 11.7
Argentina/Chile/Colombia/Uruguay/Paraguay(*) 39,091 29,299 33.4
Total with Endorsements, Sureties and Private Securities 482,864 427,294 13.0
509,346 449,946 13.2
Credit Card 53,149 40,531 31.1
Personal Loans 27,149 26,951 0.7
Payroll Loans40,584 51,646 -21.4
Mortgage Loans 24,492 18,445 32.8
Corporate 190,373 157,913 20.6
Very Small, Small and Middle Market 85,454 88,959 -3.9
Securities – Private Securities(**) 26,482 22,652 16.9
468,761 398,300 17.7
45
Credit Portfolio - IFRS
Vehicles
22,571 13,550 66.6
(*) It does not consider Itaú CorpBanca credit operations
(**) Includes debentures, CRI and Commercial Paper
Total with Endorsements, Sureties and Private Securities
Total with Endorsements, Sureties and Private Securities (ex-vehicles)

46 46
Credit Ratios
3.7 3.5 3.3 3.22.9
2.5 2.32.0
5.0 5.2 5.14.8
4.54.2
3.9 3.7
6.6
7.3 7.5
6.8 6.6 6.46.0 5.8
Mar-12 Jun-12 Sep-12 Dec-12 Mar-13 Jun-13 Sep-13 Dec-13
Companies Total Individuals
NPL Ratio % (overdue 90 days) - IFRS
*
(*) The lowest level since Itaú and Unibanco merger in november 2008

47 47
2013 Actual x 2013 Outlook - BRGAAP

48
Operations in Latin America

49 49
2014 Outlook - BRGAAP

Itaúsa in the Stock Market
Henri Penchas
Investor Relations Officer

Conference Call about the 2013 Results
Corporate Governance – Investor Relations New Website
www.itausa.com.br
51

Conference Call about the 2013 Results
Corporate Governance - Sustainability
Itaúsa was selected for inclusion in the Dow Jones
Sustainability World Index for the 10th consecutive year. Itaúsa
reached the highest score in the sector for the criteria:
• Anti-Crime Policy/Measures
• Brand Management
• Financial Stability and Systemic Risk
• Human Capital Development
In addition, Itaúsa was selected for inclusion in the Dow Jones
Sustainability Emerging Markets Index portifolio.
52
Itaúsa was recognized by the CDP Latin America as Leader in
Transparency applied to the questionnaire "2013 Climate
Change Edition“.
Itaúsa for the 7th consecutive year was selected as component of
BM&FBovespa’s Corporate Sustainability Index for 2014.

Conference Call about the 2013 Results
43,837
62,271
81,470
114,411
156,471
188,089 186,262
Performance of Itaúsa Preferred shares – ITSA4
CAGR (08 – 13): 35.7%
990
1,645 1,718
2,606
3,552
4,5614,274
12008 2009 2010 2011 2012 2013 Jan/14
CAGR (08 – 13) : 33.8% BM&FBOVESPA
(3)
53
In thousand
Trading volume at BM&FBOVESPA(1)
Itaúsa Preferred – ITSA4
(1) São Paulo Stock Exchange.(2) Portfolio from January to April 2014.(3) For better comparability, we multiplied January by twelve.
Ibovespa Weight (2)
(Itaúsa + Itaú Unibanco +
Duratex)
9.7%
Conference Call about the 2013 Results
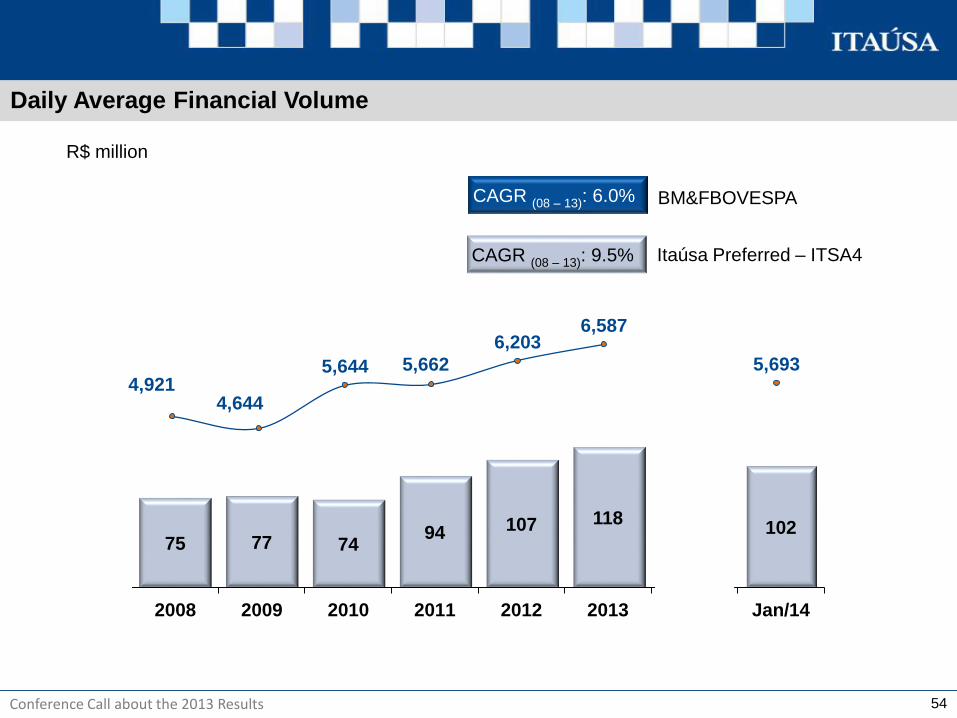
75 77 7494 107 118
102
2008 2009 2010 2011 2012 2013 Jan/14
Daily Average Financial Volume
4,9214,644
5,644 5,662
6,2036,587
5,693
CAGR (08 – 13): 9.5%
CAGR (08 – 13): 6.0% BM&FBOVESPA
54
R$ million
Itaúsa Preferred – ITSA4

Conference Call about the 2013 Results
Discount in the Price of Itaúsa
55
(1) Corresponds to the values at the stock
exchange of the public companies
controlled by Itaúsa (*).
(2) Market value of the sum of all parts, that
is, the interests held by Itaúsa in each
public company it controls.
(3) Theoretical market value of Itaúsa,
calculated based on the sum of the
market value of the interests held by
Itaúsa in public companies it controls.
(4) The “actual” market value, that is, the
value based on Itaúsa’s share price at
the stock exchange (*).
(5) Calculated discount value. The discount
is valid for the base date at which it was
calculated, because it changes daily
based on the share prices of public
companies in the market.
(*) For calculation purposes, the average
price of the most liquid share at the last
trading session of the period is
adopted.
(**) Excluding the shares held by parent
companies and those in treasury
Mercado (1)
38.86 %
82.98 %
Free Float at 12/31/2013 (**)
Valor de
Outros Investimentos
Total - Ita ú sa
Elekeiroz
Itautec
Duratex
R$ million
Other Assets and Liabilities, Net
Total - Itaúsa
Itaúsa Market Value
Discount %
Elekeiroz
Itautec
Duratex
Itaú Unibanco Holding 1.9 x
1.8 x
2.1 x
0.7 x 332
325
7,866
156,957
(3)
(4)
(5)
1.5 x
VMxVP
12/30/2013
Control
Premium
Excluded
96.60%
94.01%
35.48%
36.87%
61,875
48,744
- 21.22%
595
321
306
2,791
57,863
Market Value
(1)
Share % Market Value(2)
818,407 thousand Common shares
2,791,771 thousand Preferred shares

Conference Call about the 2013 Results
Discount History – Itaúsa
In %
56
23.3 23.017.0 15.9
20.2 21.2
Dec/08 Dec/09 Dec/10 Dec/11 Dec/12 Dec/13
• 8th Meetings with Analysts;
• Selected for the fifth time to compose the DJSI (2008)
• Merger between Itaú and Unibanco
• Bonus of 10%;
• 9th Meeting with Analysts;
• Selected for the sixth time to compose the DJSI (2009)
• Duratex/ Satipel Merger
• Alliance between Porto Seguro and Itaú Unibanco
• 11th Meeting with Analysts;
• Selected for the eighth time to compose the DJSI (2011)
• Selected for the fifth time to compose the ISE (2011/2012)
• 12th Meeting with Analysts;
• Selected for the ninth time to compose the DJSI (2012)
• Selected for the sixth time to compose the ISE (2012/2013)
• 13th Meeting with Analysts;
• Selected for the tenth time to compose the DJSI (2013)
• Selected for the seventh time to compose the ISE (2013/2014)

Conference Call about the 2013 Results
Analysts Recommendations ITSA4 - Consensus
Company Recommendations Target Price (R$) Date
Goldman Sachs Buy 10.80 01/27/2014
Nau Securities Ltd Buy 10.60 01/24/2014
Grupo Santander Buy 12.20 01/09/2014
EVA Dimensions Sell - 11/20/2013
UBS Buy 11.70 11/14/2013
Credit Suisse Buy 11.00 10/01/2013
Source: Bloomberg 02/14/2014
Consensus BRL
Buy 83.3%
Sell 16.7%
Target Price 11.32
Last Price 8.64
Potential Return 31.02%
R$
57
0
2
4
6
8
10
12
0%
20%
40%
60%
80%
100%
Feb
-12
Mar
-12
Ap
r-1
2
May
-12
Jun
-12
Jul-
12
Au
g-1
2
Sep
-12
Oct
-12
No
v-1
2
De
c-1
2
Jan
-13
Feb
-13
Mar
-13
Ap
r-1
3
May
-13
Jun
-13
Jul-
13
Au
g-1
3
Sep
-13
Oct
-13
No
v-1
3
De
c-1
3
sell hold buy Price ITSA4

Conference Call about the 2013 Results
Preferred Shares Appreciation – ITSA4
58
Annual Average Appreciation in Reais
Evolution of R$ 100 invested on December 30, 2003 until December 30, 2013
03 04 05 06 07 08 09 10 11 12 13
(2) Without reinvestment of dividends (4) Interbank Deposit Certificate(3) São Paulo Stock Exchange Index
432
232
637
315
Increase on
FED rates
Subprime
Lehman
Brothers
Itaúsa(1) Itaúsa(2) Ibov. (3)
10 years
5 years
12 months
20.35%
13.16%
5.63%
15.74%
8.50%
1.81%
8.76%
6.52%
-15.50%
CDI (4)
12.16%
9.52%
8.01%
100
(1) With reinvestment of dividends
European
Crisis

Conference Call about the 2013 Results