CONDUCTED IN SUMMER 2011 Local Public Health Agencies in Colorado Baseline Review.
82
CONDUCTED IN SUMMER 2011 Local Public Health Agencies in Colorado Baseline Review
-
Upload
ursula-stevenson -
Category
Documents
-
view
216 -
download
0
Transcript of CONDUCTED IN SUMMER 2011 Local Public Health Agencies in Colorado Baseline Review.

CONDUCTED IN SUMMER 2011
Local Public Health Agencies in Colorado Baseline Review
Objectives
Present a summary of the purpose and results of Colorado’s 2011 Baseline Review
Summarize how this effort connects with other national initiatives
Hear from you about how this information can be helpful

Why understanding public health activities, funding and staffing matters
Health care and other sectorsMeasuring performance begins with
understanding the current systemComparisons with more or less robust systems
helps to provide a rationale for your needsIdentifying your own capacity and needs for
improvement through: Comparisons to other, similar agencies Information for sharing information and services with other
agencies Potential ideas for improvement or implementation that
other agencies are doing

National Efforts
RWJF investmentsNational Surveys
NACCHO, NALBOH, ASTHO Data Harmonization Project
PHSSR Agenda PHAST PHUD$ MPROVE
CDC’s National Public Health Improvement Initiative (funding for this project)
IOM Report on measurement

Similar Efforts
Currently, service delivery measures are not well understood
Other states have struggled to collect service delivery across their state system Minnesota Washington Ohio

Colorado Efforts
NACCHO Profile response ratesNACCHO Profile testing projectPHAST participationAnnual report (to OPP)Baseline ReviewPHSSR Core Services research projectMPROVE

Today’s Focus
NACCHO Profile response ratesNACCHO Profile testing projectPHAST participationAnnual report (to OPP)Baseline ReviewPHSSR Core Services research projectMPROVEWith a little additional information thrown in

Baseline Review
Purpose: Catalogue current capacity of the CO system Inform core services and funding discussions Identify areas for improvement Fulfill CDC grant objectives Serve as the Annual Report to then be updated yearly
Methods: Tool questions reviewed by PHISC and task force
members Pre-populated tool with formerly gathered data
(NACCHO profile) 3-4 hour site visits March through August, 2011

Review Included:
Core Services Sections: Assessment/Planning, Vital Records, Communicable Disease, Prevention and Population Health Promotion (Chronic Disease, Injuries, Behavioral and Mental Health, Maternal and Child Health), Environmental Health, Emergency Preparedness
Other Direct Services Provided
Administrative/ Governance Sections: Structure, Governance, Human Resources (workforce), Financial

Core Services: Core Questions
1. Who provides service in your jurisdiction2. Do you share this service3. Could this service be shared4. Monitoring the service5. FTE dedicated to service6. Service adequately staffed7. Trainings needed for staff dedicated to service8. Funding for service9. Funding % based on sources10. Stability of funding11. Resources that have been cut12. Service adequacy for population13. Additional resources needed14. Rate CDPHE in consultation, TA and training15. What improvements are needed in this service delivery

Methods: Baseline Review of LPHA’s
Conducted Spring/Summer 2011All local public health agencies participated
Extensive tool filled out prior to visit 3-4 hour interview
Directors and staff members Board of health members (uncommon)
Data review and resubmission for any additional gaps

Baseline Review Tool
Used existing and validated tools as a starting point for development of Baseline Review Tool NACCHO Profile Minnesota’s Local Public Health Planning and
Performance Measurement Reporting System Washington’s Activities and Service Inventory McKinsey Capacity Assessment Grid

NACCHO Profile 2010

Baseline Review Tool
Included all Core Services Assessment, Planning, and Communication Vital Records and Statistics Communicable Disease Prevention, Investigation, and
Control Prevention and Population Health Promotion Emergency Preparedness and Response Environmental Health Administration and Governance

Baseline Review Tool
Service categories within each core service Chronic Disease prevention within prevention and
promotionService areas within each category
Nutrition Promotion in Chronic Disease preventionService activities within each area
Educational Materials or Policy Development within Nutrition Promotion


How is this service provided or assured?
3 = LPHA provides this service/activity. This includes main and satellite offices
2 = Provided by Another Agency (listed)1 = This service/activity is needed but not
available within jurisdiction 0 = This service/activity is not applicable
within jurisdiction

Who provides a service in your jurisdiction?
LPHA at Main Office Satellite OfficeOther County Office (please name) Obtained from another LPHA (please name)CDPHE Regional staff (CDPHE employees)CDPHE funded staff in regionsSomeone else (Please name) Contracted out by LPHA (Please name) Not available in jurisdiction Unknown Provided to another LPHA

Self-Reported Capacity
For each category within core services the following question was asked: How would you rank your jurisdiction’s capacity to
implement [core service category] at this point in time? Selection Options
1 = Clear need for increased capacity 2 = Basic level of capacity in place 3 = Moderate level of capacity in place 4 = High level of capacity in place
Adapted from McKinsey’s Capacity Grid

Self-Reported Capacity
4 = High level of capacity in place defined as: Stable funding, staffing, and facilities Majority of target population is served, including those
with health disparities Ability to measure outcomes and address needed
improvements Uses current knowledge and best practices in delivery of
service Follows current national standards [if available] Ability to seek new initiatives and access funding based
on community needs Service is supported by elected officials and well-
connected with other system partners
So, What did we learn?

Assessment and Planning
General Assessment and Planning Questions What assessment had been done by last summer Employees dedicated to Assessment and Planning Funding dedicated to Assessment and Planning Areas for improvement at the local jurisdictions Capacity in Assessment and Planning
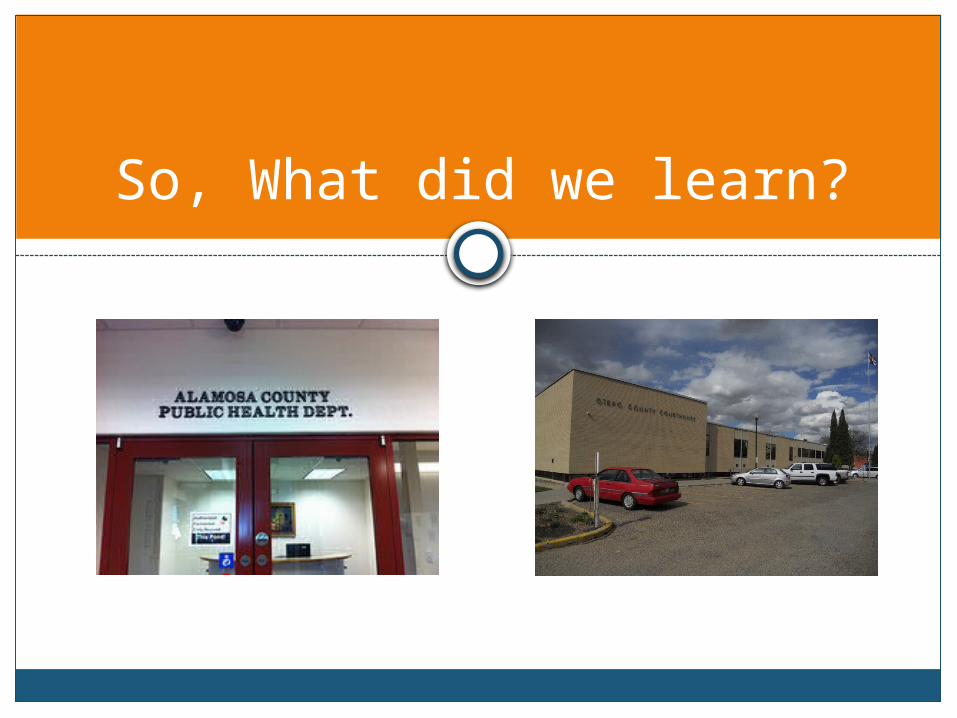
Comprehensive Community Health Assessment
77%
23%
Have done Comprehensive Community Health Assessment in last 3 years
Have NOT done Comprehensive Community Health Assessment in last 3 years
70%
30%
Lead Comprehensive Community Assessment

Current CHAPS Progress
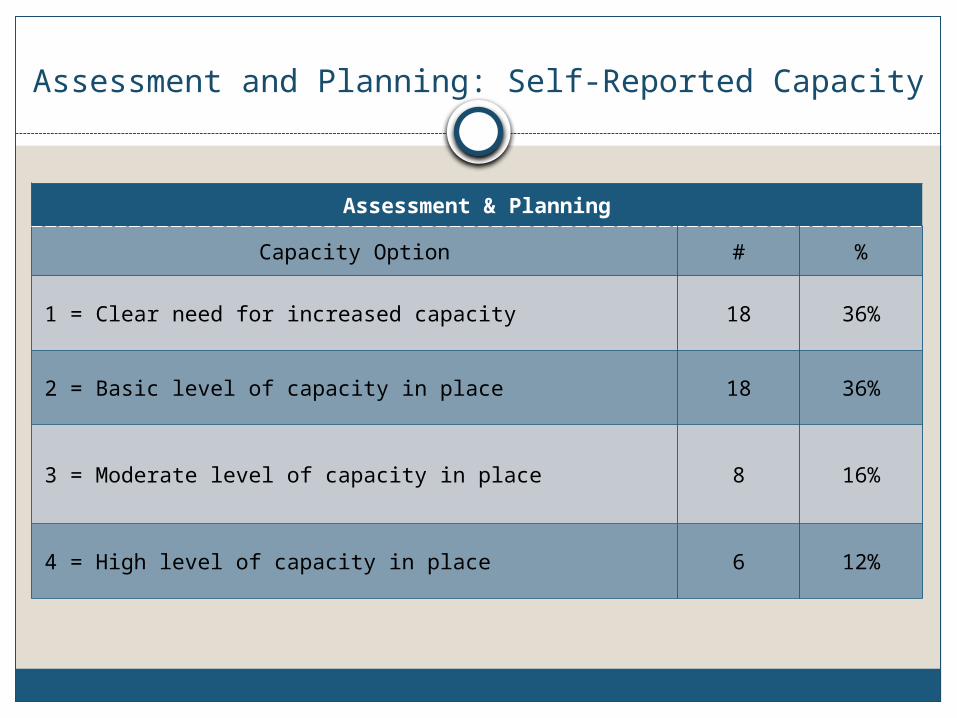
Assessment and Planning: Self-Reported Capacity
Assessment & Planning
Capacity Option # %
1 = Clear need for increased capacity 18 36%
2 = Basic level of capacity in place 18 36%
3 = Moderate level of capacity in place 8 16%
4 = High level of capacity in place 6 12%

Assessment and Planning: Self-Reported Capacity
36%
36%
16%
12%
1 = Clear need for increased capacity2 = Basic level of capacity in place3 = Moderate level of capacity in place4 = High level of capacity in place

Assessment and Planning: Areas for Improvement
Assessment & Planning
No Improvements Needed 4 8%
Other 12 24%
More Partnerships 13 25%
Differently Qualified Staff 16 31%
More Training for Staff 24 47%
More Technical Assistance 26 51%
More data/evaluation 28 55%
More Operations Funding 34 67%
More Staff 36 71%

Assessment and Planning: Areas for Improvement
No
Impr
ovem
ents N
eede
d
Other
Mor
e Pa
rtne
rshi
ps
Differ
ently
Qua
lified
Sta
ff
Mor
e Tr
aini
ng fo
r Sta
ff
Mor
e Te
chni
cal A
ssista
nce
Mor
e da
ta/eva
luat
ion
Mor
e Ope
ratio
ns F
undi
ng0
10
20
30
40
Nu
mb
er
of
ag
en
cies

Staffing
How many contracted staff and FTE are dedicated to Assessment and Planning? Mean Number of People = 2.4 Mean FTE = 0.99 31% did not have any staff dedicated to Assessment and Planning

Funding
Sources of funding for Assessment and Planning Percent of agencies reported by type of funding
STATE PER CAPITA (33% of agencies) COUNTY (22% of agencies) STATE DIRECT (not per capita) (18% of agencies)

Vital Records
43% of LPHA’s provide vital records services, directly
57% of LPHA’s have a formal MOU with county clerks, treasurers, etc, to perform vital records services.
7 counties made positive changes since the Public Health Act by moving records out of homes.

Questions?Thoughts?
Comments?

Communicable Disease
General Communicable Disease Questions Who is doing what within Communicable Disease Employees dedicated to Communicable Disease Funding dedicated to Communicable Disease Areas for improvement at the local jurisdictions Capacity in Communicable Disease

Communicable Disease
Prev
ent D
iseas
e Tr
ansm
ission
Collect
and
repo
rt d
iseas
e in
form
ation
Imm
uniza
tions
Inve
stig
ate ca
ses o
f rep
orta
ble di
seas
es0
102030405060
LPHA onlyIn Partnership (LPHA in Partnership with CD-PHE, CDPHE Regional Staff, Other LPHA or other community part-ner)
Nu
mb
er
of
Ag
en
cie
s

Communicable Disease: Self-Reported Capacity
Immunizations
Collect and report disease
information and investigate
Disease transmission
Capacity Option # % # % # %
1 1 2% 0 0% 4 8%
2 1 2% 8 16% 19 36%
3 22 42% 24 47% 19 36%
4 29 55% 19 37% 11 21%

Communicable Disease: Self-Reported Capacity
0%20%40%60%80%
100%
1 = Clear need for increased capacity 2 = Basic level of capacity in place3 = Moderate level of capacity in place 4 = High level of capacity in place

Communicable Disease: Areas for Improvement
Communicable Disease
No Improvement 3 6%
Differently Qualified Staff 6 11%
More TA 9 17%
More Partnerships 10 19%
Other 10 19%
More data/evaluation 17 32%
More Staff 23 43%
More Training for staff 26 49%
More Operations Funding 32 60%

Communicable Disease: Areas for Improvement
No
Impr
ovem
ents
Ne.
..
Differ
ently
Qua
lified
S...
Mor
e Te
chni
cal A
ssist
...
Other
Mor
e Pa
rtne
rshi
ps
Mor
e da
ta/e
valu
atio
n
Mor
e Sta
ff
Mor
e Tr
aini
ng fo
r Sta
ff
Mor
e Ope
ratio
ns F
un...
0
5
10
15
20
25
30
35
Nu
mb
er
of
Ag
en
cie
s
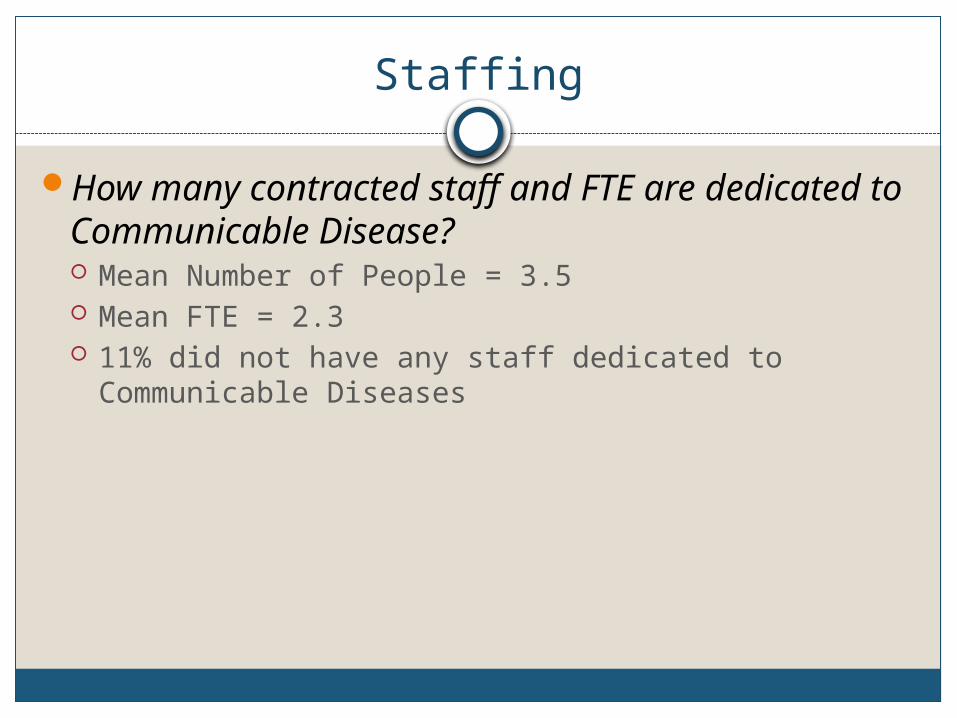
Staffing
How many contracted staff and FTE are dedicated to Communicable Disease? Mean Number of People = 3.5 Mean FTE = 2.3 11% did not have any staff dedicated to
Communicable Diseases

Funding
Common sources for Communicable DiseasePercent of agencies reported by type of funding
STATE DIRECT (not per capita) (43% of agencies) COUNTY (35% of agencies) FEDERAL, PASSED THROUGH STATE (28% of agencies)

Questions?Thoughts?
Comments?

Prevention and Promotion
General Prevention and Promotion Questions Who is doing what is Prevention and Promotion Employees dedicated to Prevention and Promotion Funding dedicated to Prevention and Promotion Areas for improvement at the local jurisdictions Capacity in Prevention and Promotion

Prevention & Promotion
010203040
LPHA onlyOther (could be in partnership with LPHA)UnknownNot Available

Prevention and Promotion: Self-Reported Capacity
Communicable disease prevention
Chronic disease prevention
Maternal & child health
Injury prevention
Capacity Option
# % # % # % # %
1 2 4% 13 25% 12 23% 29 56%
2 14 26% 20 38% 13 25% 15 29%
3 25 47% 16 31% 22 42% 7 13%
4 12 23% 3 6% 6 11% 1 2%

Prevention and Promotion: Self-Reported Capacity
0%
20%
40%
60%
80%
100%
1 = Clear need for increased capacity 2 = Basic level of capacity in place3 = Moderate level of capacity in place 4 = High level of capacity in place

Prevention and Promotion: Areas for Improvement
Prevention & Promotion
No Improvements Needed 0 0%
Other 3 6%
More Technical Assistance 14 26%
Differently Qualified Staff 17 31%
More data/evaluation 20 37%
More Partnerships 21 39%
More Training for Staff 25 46%
More Staff 37 69%
More Operations Funding 37 69%

Prevention and Promotion: Areas for Improvement
No
Impr
ovem
ents
Nee
ded
Other
Mor
e Te
chni
cal A
ssist
ance
Differ
ently
Qua
lified
Sta
ff
Mor
e da
ta/e
valu
atio
n
Mor
e Pa
rtne
rshi
ps
Mor
e Tr
aini
ng fo
r Sta
ff
Mor
e Sta
ff
Mor
e Ope
ratio
ns F
undi
ng05
10152025303540
Nu
mb
er
of
Ag
en
cie
s

Staffing
How many contracted staff and FTE are dedicated to Prevention and Promotion? Mean Number of People = 5.2 Mean FTE = 4.8 12% did not have any staff dedicated to Prevention
and Promotion

Funding
Common funding sources for Prevention and Promotion STATE DIRECT (not per capita) (41% of agencies) STATE PER CAPITA (31% of agencies) COUNTY (31% of agencies) FEDERAL, PASSED THROUGH STATE (30% of
agencies) FOUNDATIONS (30% of agencies)

Direct Services
EPSDT
Adult Immunizations
Childhood Immunizations
Family Planning
Nurse Home Visitor
Substance Abuse
WIC
HCP
Prenatal
0 5 10 15 20 25 30 35 40 45 50
Not AvailableOtherSecondaryPrimary

Questions?Thoughts?
Comments?

Environmental Health
General Environmental Health Questions What assessment have been done Employees dedicated to Environmental Health Funding dedicated to Environmental Health Areas for improvement at the local jurisdictions Capacity in Environmental Health

Environmental Health
05
101520253035404550
LPHA Only Other (could be in partnership with LPHA) UnknownNot Available

Environmental Health: Self-Reported Capacity
Sanitation of
Institutional
Facilities
Food Safety
Zoonotic and
vector borne
disease
Air quality
Water
Community design
and planning
Waste Other
Capacity
Option
# % # % # % # % # % # % # % # %
1 920%
715%
3 7% 1329%
920%
1534%
1637%
1227%
2 1124%
3 7% 2043%
1431%
1432%
1125%
1126%
1943%
3 1941%
1430%
1533%
1533%
1125%
1023%
1023%
920%
4 715%
2248%
817%
3 7% 1023%
818%
614%
4 9%

Environmental Health: Self-Reported Capacity
0%10%20%30%40%50%60%70%80%90%
100%
1 = Clear need for increased capacity
2 = Basic level of capacity in place

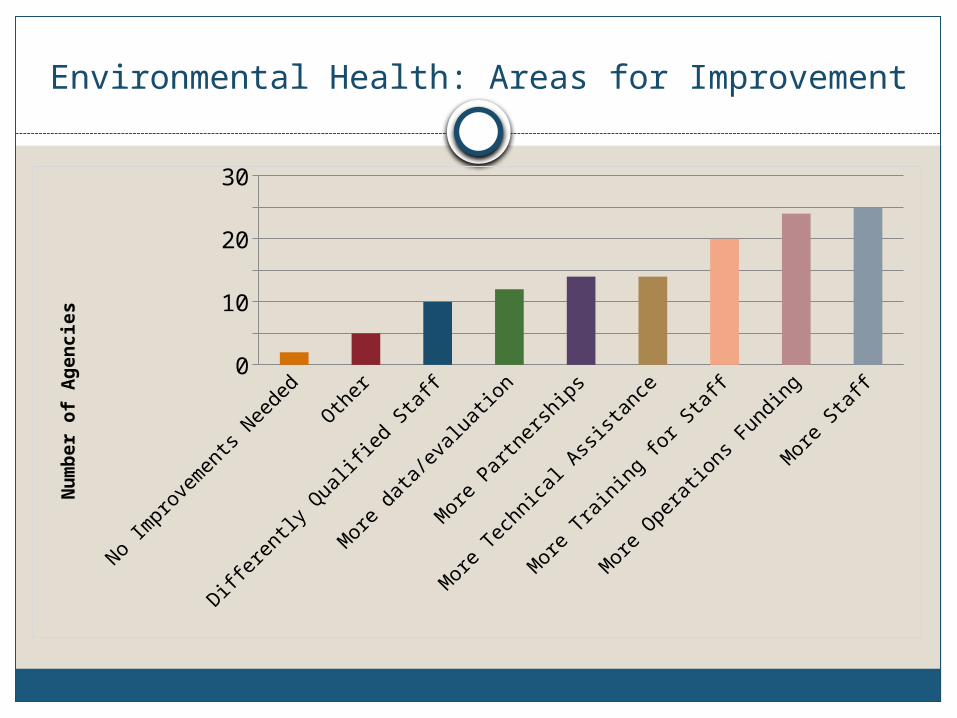
Environmental Health: Areas for Improvement
Environmental Health
No Improvements Needed 2 4%
Differently Qualified Staff 5 9%
More Technical Assistance 10 19%
More data/evaluation 12 23%Other 14 26%
More Partnerships 14 26%
More Staff 20 38%
More Operations Funding 24 45%
More Training for Staff 25 47%
Environmental Health: Areas for Improvement
No
Impr
ovem
ents
Nee
ded
Other
Differ
ently
Qua
lified
Sta
ff
Mor
e da
ta/e
valu
atio
n
Mor
e Pa
rtne
rshi
ps
Mor
e Te
chni
cal A
ssist
ance
Mor
e Tr
aini
ng fo
r Sta
ff
Mor
e Ope
ratio
ns F
undi
ng
Mor
e Sta
ff0
5
10
15
20
25
30
Nu
mb
er
of
Ag
en
cie
s

Staffing
How many contracted staff and FTE are dedicated to Environmental Health? Mean Number of People = 5.4 Mean FTE = 4.8 19% did not have any staff dedicated to
Environmental Health

Environmental Health

Questions?Thoughts?
Comments?
Emergency Preparedness & Response
General Emergency Preparedness Questions What assessment have been done Employees dedicated to Emergency Preparedness Funding dedicated to Emergency Preparedness Areas for improvement at the local jurisdictions Capacity in Emergency Preparedness

Emergency Preparedness & Response
0
10
20
30
40
LPHA OnlyOther (could be in partnership with LPHA)UnknownNot Available

EPR: Self-Reported Capacity
Emergency Preparedness & Response
Capacity Option # %
1 = Clear need for increased capacity 0 0%
2 = Basic level of capacity in place 10 21%
3 = Moderate level of capacity in place 26 55%
4 = High level of capacity in place 11 23%
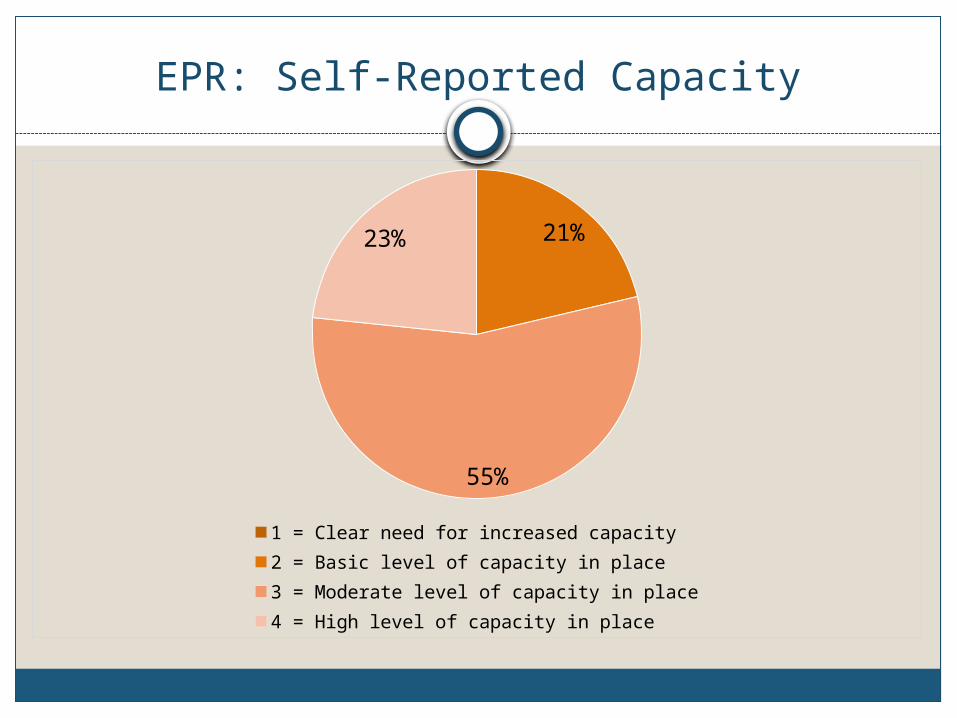
EPR: Self-Reported Capacity
21%
55%
23%
1 = Clear need for increased capacity 2 = Basic level of capacity in place3 = Moderate level of capacity in place 4 = High level of capacity in place

EPR: Areas for Improvement
Emergency Preparedness and Response
No Improvements Needed 4 8%
Other 4 8%
Differently Qualified Staff 5 10%
More data/evaluation 7 13%
More Partnerships 11 21%
More Technical Assistance 4 8%
More Training for Staff 22 42%
More Operations Funding 20 38%
More Staff 30 58%

EPR: Areas for Improvement
No
Impr
ovem
ents
Nee
ded
Other
Mor
e Te
chni
cal A
ssist
ance
Differ
ently
Qua
lified
Sta
ff
Mor
e da
ta/e
valu
atio
n
Mor
e Pa
rtne
rshi
ps
Mor
e Ope
ratio
ns F
undi
ng
Mor
e Tr
aini
ng fo
r Sta
ff
Mor
e Sta
ff05
101520253035
Nu
mb
er
of
Ag
en
cie
s

Staffing
How many contracted staff and FTE are dedicated to Emergency Preparedness and Response? Mean Number of People = 3.1 Mean FTE = 1.4 2.2% did not have any staff dedicated to EPR

Funding
Primary funding sources for EPR FEDERAL, PASSED THROUGH STATE (67%) COUNTY (13%) STATE DIRECT (not per capita) (13%) FOUNDATIONS (6%)

Questions?Thoughts?
Comments?

Statewide: How do regions view their capacity?
The following tables present self reported capacity by region 0-1.99 in red-lowest 2.00-2.99 in yellow-moderate 3.00-4.00 in green-highest

Assessment and Planning
Collect and report disease
info, investigate
cases of reportable diseases
ImmunizationsPrevent Disease
Transmission
Emergency Preparedness &
Response
Eastern Corridor
2.00 3.75 4.00 3.50 3.33
Southeast 2.17 3.20 3.50 3.00 3.00
San Luis Valley
1.67 3.00 3.50 2.17 2.83
Southwest 1.75 2.75 3.75 2.75 2.75
West Central 2.67 3.00 3.50 3.33 3.00
Northwest 1.50 2.75 3.25 2.25 3.25
Western Corridor
1.60 3.25 3.40 2.20 2.33
South 1.67 3.75 3.50 2.75 3.25
Central 2.00 3.00 3.00 1.50 3.00
Large Agencies* 2.63 3.50 3.50 3.00 3.20*Population > 70,000
State 2.04 3.22 3.49 2.70 3.02

Communicable Disease
prevention and education
Chronic Diseases, prevention and
education
Maternal and Child Health Promotion,
Prevention and Education
Injury Prevention and Education
Eastern Corridor 3.00 2.50 3.50 2.00
Southeast 2.80 2.50 2.17 2.00
San Luis Valley 2.67 1.67 1.67 1.33
Southwest 2.75 2.00 2.00 1.25
West Central 3.33 2.00 2.83 1.83
Northwest 2.50 3.00 2.50 1.50
Western Corridor 2.20 1.75 2.00 1.75
South 3.00 2.75 2.50 1.25
Central 2.75 2.00 2.50 1.75
Large Agencies* 3.20 2.00 2.60 1.50
*Population > 70,000
State 2.89 2.17 2.42 1.62

Safety of food
provided to the public
Sanitation of
institutional facilities
Zoonotic and vector-borne
environ. hazards
Air-borne environ. hazards
Water-borne public health
environ. hazards
and surface and ground
water
Land use planning
and sustainable developmen
t
Solid and hazardous waste and recycling and reuse
Other public health threats
related to environ. health
hazards
Eastern Corridor
2.33 2.33 2.33 2.33 1.67 2.33 3.00 2.33
Southeast 3.40 3.40 3.40 2.20 2.40 1.40 1.40 1.80
San Luis Valley
2.33 1.67 2.17 1.17 1.33 1.33 1.33 1.17
Southwest 3.00 2.25 2.75 1.50 1.75 1.50 1.25 1.67
West Central
3.25 2.75 2.50 2.25 2.75 2.50 2.75 2.50
Northwest 3.50 3.50 2.00 2.50 2.50 2.50 1.50 2.00
Western Corridor
2.40 1.60 1.80 1.80 3.00 2.20 2.40 1.40
South 3.25 2.75 2.00 2.00 2.75 2.33 2.33 2.50
Central 3.67 2.33 3.33 3.50 3.00 3.50 2.50 2.50
Large Agencies* 3.70 2.90 3.10 2.90 3.30 3.10 2.80 2.90
*Population > 70,000
State 3.11 2.52 2.61 2.18 2.50 2.25 2.14 2.11

Questions on data so far?

Ongoing data analysis
Research Projects Core Services Research Multi-network Practice and Outcome Variation
Examination (MPROVE) StudyBoth Projects will use collected data to find
and understand the best measures for service delivery

Your thoughts
What uses do you see for this data?How can we organize the data to help you?What other information asked in the Baseline
Review would be useful for you in your work?What kind of report/reports would you like to
see out of this work?What kind of report would you use?

Let’s Discuss

Contact
Kathleen Matthews Office of Planning and Partnership, CDPHE [email protected]
Lisa VanRaemdonck Colorado Association of Local Public Health Officials [email protected]
Sarah Lampe Colorado Association Local Public Health Officials [email protected]

Service Area in Communicable Disease Prevention and Promotion by Capacity

Service Area in Communicable Disease Prevention and Promotion by Capacity
Total Topic Score = The Numbered entered into the box corresponding to
that service area.
Therefore, the higher the score the more likely the public health agency
delivers the service
The lower the score the more likely the service is not available within the
jurisdiction
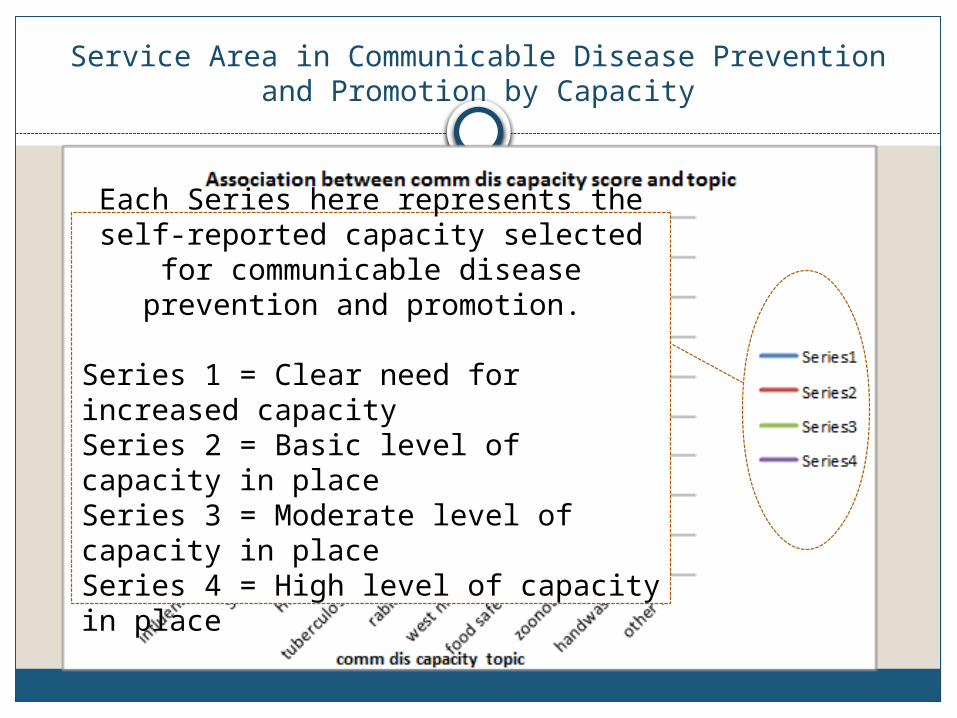
Service Area in Communicable Disease Prevention and Promotion by Capacity
Each Series here represents the self-reported capacity selected for
communicable disease prevention and promotion.
Series 1 = Clear need for increased capacitySeries 2 = Basic level of capacity in placeSeries 3 = Moderate level of capacity in placeSeries 4 = High level of capacity in place

Service Area in Communicable Disease Prevention and Promotion by Capacity