
Conditions of Carrying Out and Verification of Diagnostic ...
6
International Journal on Marine Navigation and Safety of Sea Transportation Volume 6 Number 2 June 2012 235 1 SYMBOLS B –fuel consumption [kg/h]; b e – unit fuel consumption [kg/kWh]; G K –air consumption [kg/s]; D – propeller dimension [m]; J – advance of propeller; K Q – torque coefficient; K T – thrust coefficient; L – work [kJ]; M – mass [kg]; N – power [kW]; n – rotational speed of a propeller [1/s]; p – pressure [Pa]; Q – torque [Nm]; R- Vessel resistance [N]; T – propeller thrust [N]; T – temperature [K]; t – temperaturę [ o C]; t – suction coefficient ; w –wake fraction; x – content relative to dry air mass; v p – propeller advance speed [m/s]; ρ – water density [kg/m 3 ]; η p – freewheeling propeller efficiency; Index’s: h – per hour; m – concern measured parameters; o – ambient parameters; r – concern reduced parameters. 2 INTRODUCTION Measurements performed on vessels are aimed at de- termining the up-to-date technical condition of the elements of the main propulsion or the evaluation of the operating elements of a vessel. The diagnostic measurements should be performed in a continuous manner, and the measurements to determine propul- sion characteristics should be performed at specified time points, e.g. after completing the construction works on the vessel, after repairing elements of the propulsion system, etc. The measurements are per- formed on a vessel to develop propulsion forecast for a new built ship, or to evaluate current operating parameters of an exploited vessel. Irrespective of the aim of the measurements, it should be noted that a vessel always works in different conditions and the conditions may affect the quality and reliability of measurements. The change of the conditions for ves- sel movement is induced by parameters linked with: − the vessel, i.e. vessel loading, use of reserves (change in displacement), change in the condition of hull, propellers, engines, etc. − hydrometeorological conditions − vessel operation region. The evaluation of factual propulsive characteris- tics in exploitation is performed during vessel sea trials [2]. In order to fully evaluate the propulsive charac- teristics, the following should be measured: torque Conditions of Carrying Out and Verification of Diagnostic Evaluation in a Vessel A. Charchalis Gdynia Maritime University, Gdynia, Poland ABSTRACT: The paper presents some problems of carrying out measurements of energetic characteristics and vessel’s performance in the conditions of sea examinations. We present the influence of external condi- tions in the change of vessel’s hull resistance and propeller characteristics as well as the influence of weather conditions in the results of examinations and characteristics of gas turbine engine. We also discuss the manner of reducing the results of measurements to the standard conditions. We present the way of preparing propul- sion characteristics and the analysis of examination uncertainty for the measurement of torque.
Transcript of Conditions of Carrying Out and Verification of Diagnostic ...
International Journal on Marine Navigation and Safety of Sea Transportation
Volume 6 Number 2 June 2012
235
1 SYMBOLS
B –fuel consumption [kg/h]; be – unit fuel consumption [kg/kWh]; GK –air consumption [kg/s]; D – propeller dimension [m]; J – advance of propeller; KQ – torque coefficient; KT – thrust coefficient; L – work [kJ]; M – mass [kg]; N – power [kW]; n – rotational speed of a propeller [1/s]; p – pressure [Pa]; Q – torque [Nm]; R- Vessel resistance [N]; T – propeller thrust [N]; T – temperature [K]; t – temperaturę [oC]; t – suction coefficient ; w –wake fraction; x – content relative to dry air mass; vp – propeller advance speed [m/s]; ρ – water density [kg/m3]; ηp – freewheeling propeller efficiency; Index’s: h – per hour; m – concern measured parameters; o – ambient parameters; r – concern reduced parameters.
2 INTRODUCTION
Measurements performed on vessels are aimed at de-termining the up-to-date technical condition of the elements of the main propulsion or the evaluation of the operating elements of a vessel. The diagnostic measurements should be performed in a continuous manner, and the measurements to determine propul-sion characteristics should be performed at specified time points, e.g. after completing the construction works on the vessel, after repairing elements of the propulsion system, etc. The measurements are per-formed on a vessel to develop propulsion forecast for a new built ship, or to evaluate current operating parameters of an exploited vessel. Irrespective of the aim of the measurements, it should be noted that a vessel always works in different conditions and the conditions may affect the quality and reliability of measurements. The change of the conditions for ves-sel movement is induced by parameters linked with: − the vessel, i.e. vessel loading, use of reserves
(change in displacement), change in the condition of hull, propellers, engines, etc.
− hydrometeorological conditions − vessel operation region.
The evaluation of factual propulsive characteris-tics in exploitation is performed during vessel sea trials [2].
In order to fully evaluate the propulsive charac-teristics, the following should be measured: torque
Conditions of Carrying Out and Verification of Diagnostic Evaluation in a Vessel
A. Charchalis Gdynia Maritime University, Gdynia, Poland
ABSTRACT: The paper presents some problems of carrying out measurements of energetic characteristics and vessel’s performance in the conditions of sea examinations. We present the influence of external condi-tions in the change of vessel’s hull resistance and propeller characteristics as well as the influence of weather conditions in the results of examinations and characteristics of gas turbine engine. We also discuss the manner of reducing the results of measurements to the standard conditions. We present the way of preparing propul-sion characteristics and the analysis of examination uncertainty for the measurement of torque.
236
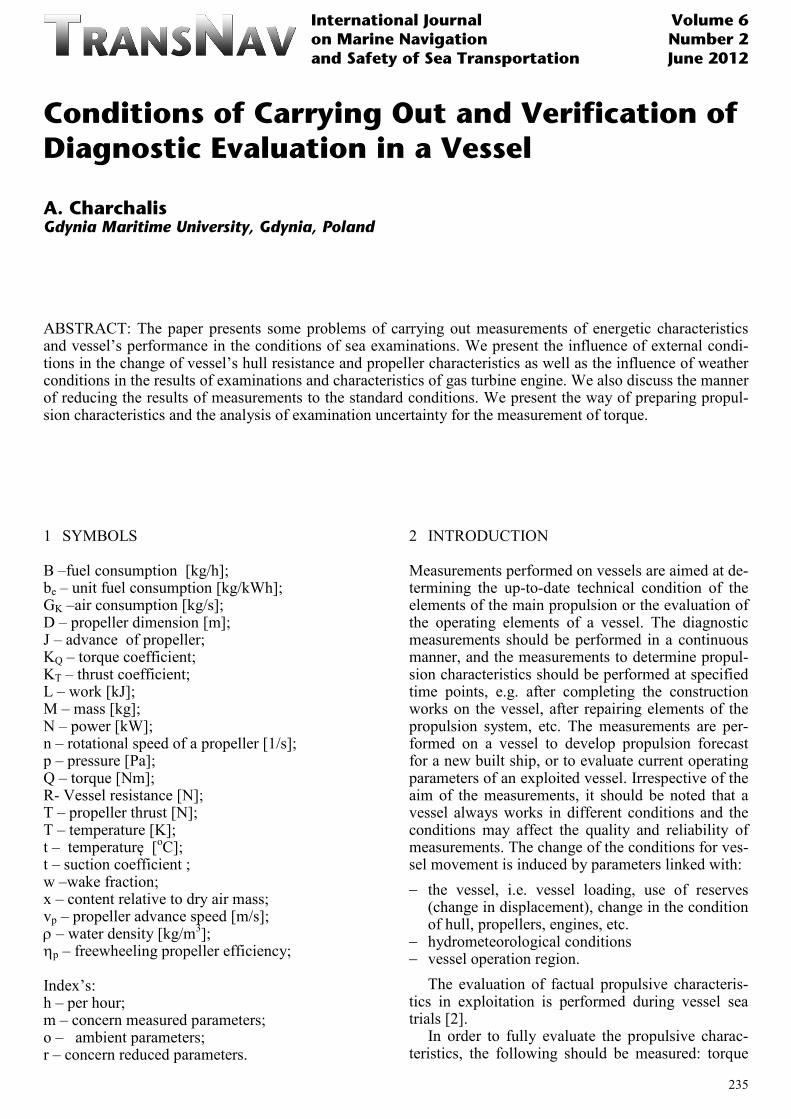
on propulsion shafts; propeller thrust; rotational speed of shafts, vessel speed and the use of fuel by particular engines. Fig. 1 presents a block diagram of a vessel as the object of sea propulsion trials.
Figure 1. Block diagram of a vessel.
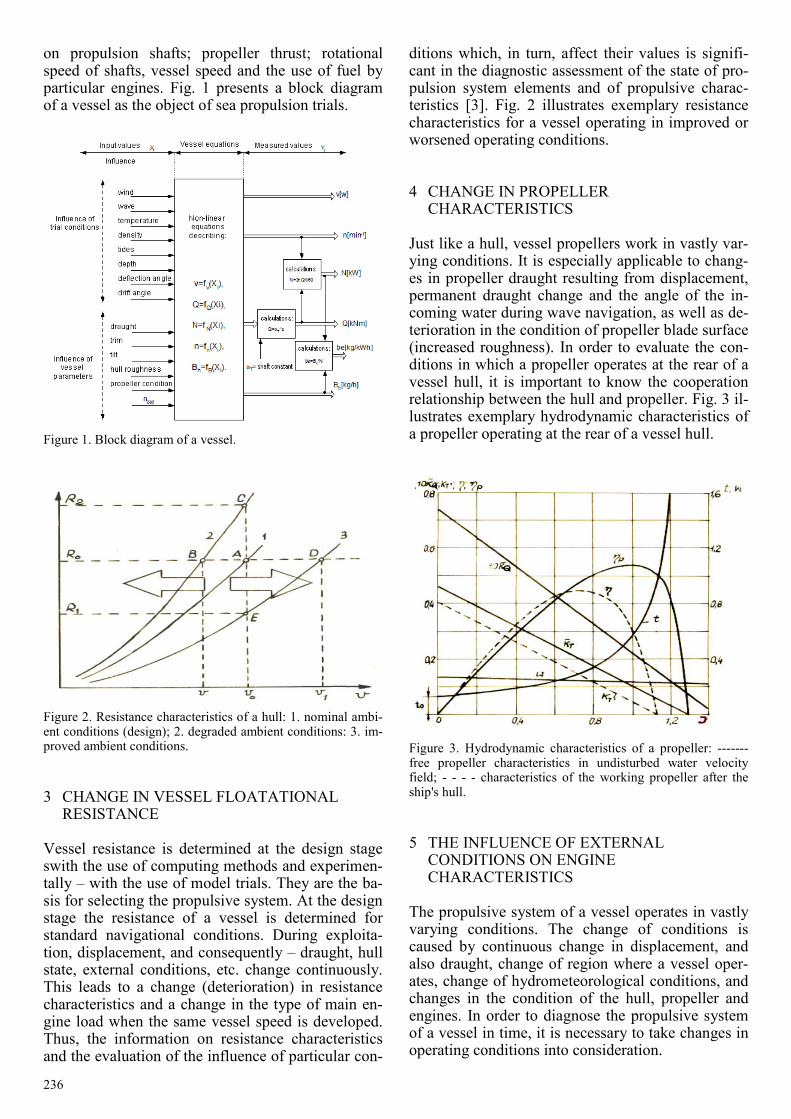
Figure 2. Resistance characteristics of a hull: 1. nominal ambi-ent conditions (design); 2. degraded ambient conditions: 3. im-proved ambient conditions.
3 CHANGE IN VESSEL FLOATATIONAL RESISTANCE
Vessel resistance is determined at the design stage swith the use of computing methods and experimen-tally – with the use of model trials. They are the ba-sis for selecting the propulsive system. At the design stage the resistance of a vessel is determined for standard navigational conditions. During exploita-tion, displacement, and consequently – draught, hull state, external conditions, etc. change continuously. This leads to a change (deterioration) in resistance characteristics and a change in the type of main en-gine load when the same vessel speed is developed. Thus, the information on resistance characteristics and the evaluation of the influence of particular con-
ditions which, in turn, affect their values is signifi-cant in the diagnostic assessment of the state of pro-pulsion system elements and of propulsive charac-teristics [3]. Fig. 2 illustrates exemplary resistance characteristics for a vessel operating in improved or worsened operating conditions.
4 CHANGE IN PROPELLER CHARACTERISTICS
Just like a hull, vessel propellers work in vastly var-ying conditions. It is especially applicable to chang-es in propeller draught resulting from displacement, permanent draught change and the angle of the in-coming water during wave navigation, as well as de-terioration in the condition of propeller blade surface (increased roughness). In order to evaluate the con-ditions in which a propeller operates at the rear of a vessel hull, it is important to know the cooperation relationship between the hull and propeller. Fig. 3 il-lustrates exemplary hydrodynamic characteristics of a propeller operating at the rear of a vessel hull.
Figure 3. Hydrodynamic characteristics of a propeller: ------- free propeller characteristics in undisturbed water velocity field; - - - - characteristics of the working propeller after the ship's hull.
5 THE INFLUENCE OF EXTERNAL CONDITIONS ON ENGINE CHARACTERISTICS
The propulsive system of a vessel operates in vastly varying conditions. The change of conditions is caused by continuous change in displacement, and also draught, change of region where a vessel oper-ates, change of hydrometeorological conditions, and changes in the condition of the hull, propeller and engines. In order to diagnose the propulsive system of a vessel in time, it is necessary to take changes in operating conditions into consideration.

237
5.1 The influence of atmospheric parameters Atmospheric conditions affect the performance of each engine type, major influence, however, is ob-served in gas turbine engines [1]. In order to ensure adequate course of operation processes, gas turbine engines need considerable amounts of air. Excess air coefficient in the engine is 3,6–5. This accounts for unit air demand of 18 – 25 kg/kWh. The need for compressing large masses of air increases the im-portance of the influence of change in atmospheric conditions on engine functions, conditions for regu-lation, performance, etc. Significant influence is produced by changes in temperature, pressure and humidity of air, which cause changes in physical properties of the operating factor, such as density, viscosity, heat capacity, gas constant, etc.
Changes in engine performance resulting from atmospheric conditions may be considerable and sometimes may hinder the achievement of adequate engine performance, or the diagnosis due to the in-comparability of measurement conditions.
5.1.1 The influence of incoming air temperature Changes in incoming air temperature are due to
the fact that vessels are exploited in various regions, or even climate zones, various seasons of the year, and day times.
The standard assumption is that ambient tempera-ture is 288 K. And for the region of the Baltic Sea it may be assumed that ambient temperature fluctuates within the range of 238 –308 K. Such large fluctua-tions lead to considerable changes in engine work conditions, which needs to be taken into considera-tion while evaluating performance in an engine that operates in various conditions. The increase in in-coming air temperature leads to reducing the air mass stream due to reduced density, and, as a result - decrease of engine power. What also changes are other figures that characterize the course of the working process of an engine and compressor effi-ciency. In the ranges of load that are close to those is calculations, the increase in air temperature leads to a minor increase in compressor efficiency. This is caused by an increase in sound speed and decrease of Mach number, as a result of which the conditions of transitional flow are improved, which translates to reduced hydraulic loss.
When incoming air temperature drops, the de-crease of compressor efficiency leads to an increase in unit fuel consumption. Fig. 4 illustrates the prop-erties of changes in compressor efficiency and its ef-fective work depending on air temperature for vari-ous compression values. The presented relationships indicate that optimum compression is subject to lin-ear changes both for compressor efficiency and work.
Figure. 4. The properties of changes in compressor efficiency and its effective work depending on air temperature and com-pression: ____ The optimum range of efficiency;
------ The optimum range of effective work.
The larger the difference in temperature, the larg-
er the differences in the changes of optimum values.
5.1.2 The influence of atmospheric pressure chang-es
In comparison with temperatures, changes in at-mospheric pressure are relatively minor. Changes in air pressure may be within the range 96 –104 kPa. Relative change of pressure in relation to standard pressure (101,3 kPa) is up to 10%. That is why the influence of pressure change on the properties of en-gine functions is not as significant, as the influence of temperature. Change of air pressure and the re-sulting change in air density at the engine inlet leads to proportional changes in all engine control cross-sections. An increase in atmospheric pressure leads to increasing air mass and, as a result, increase in engine power. What does not change is temperature, rotational speed, compression, efficiency and unit fuel consumption.
5.1.3 The influence of change in air humidity Air humidity may be subject to a wide range of
changes – from dry air to air containing saturated vapour. Humidity indeed affects gas engine perfor-mance. It is especially related to changes in air mass and with changes of air heat parameters, such as heat capacity and gas constant. An increase in humidity leads to an increase in gas capacity, leading to a de-crease in incoming air density. That, in turn, leads to decreasing the volume of air flow through an engine. The influence of the decreased volume of air flow is larger than the increase in heat capacity, which leads to engine power drop. Apart from vapour, the in-coming air also contains water drops in the form of sea spray. Moistening degree is determined based on water and vapour content relative to dry air mass.
238
X=ps
H
mom 2 (1)
where psm - dry air mass.
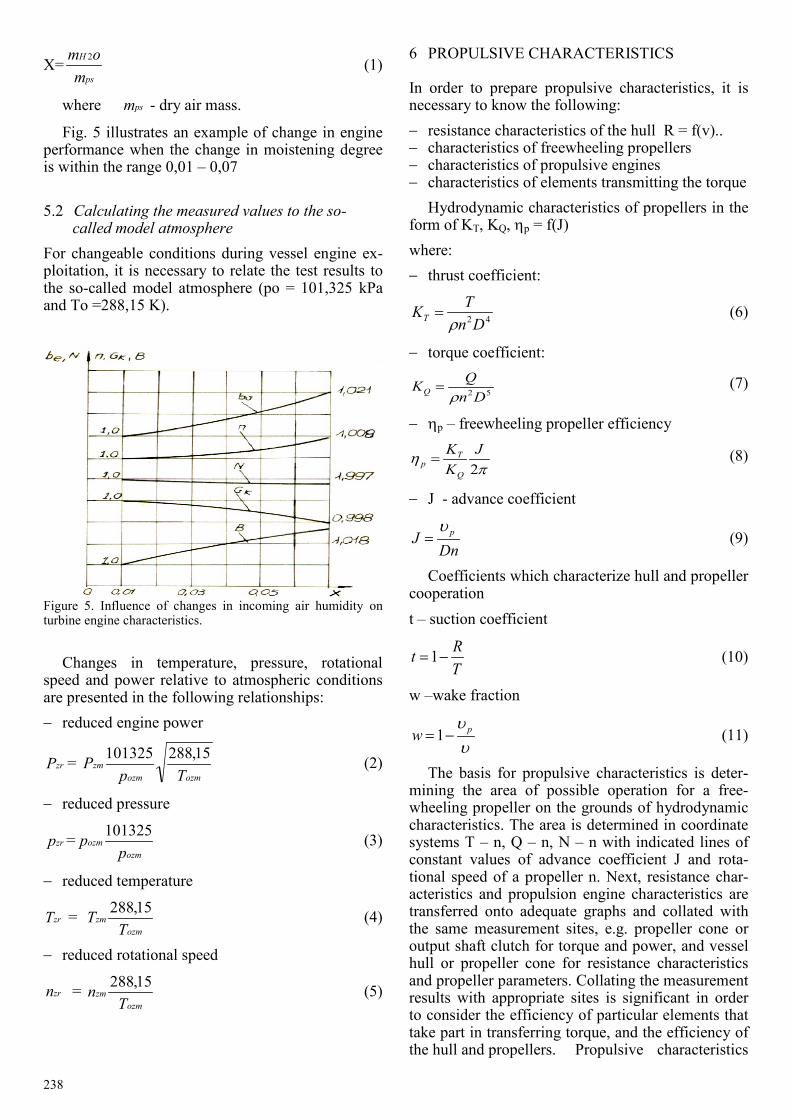
Fig. 5 illustrates an example of change in engine performance when the change in moistening degree is within the range 0,01 – 0,07
5.2 Calculating the measured values to the so-called model atmosphere
For changeable conditions during vessel engine ex-ploitation, it is necessary to relate the test results to the so-called model atmosphere (po = 101,325 kPa and To =288,15 K).
Figure 5. Influence of changes in incoming air humidity on turbine engine characteristics.
Changes in temperature, pressure, rotational
speed and power relative to atmospheric conditions are presented in the following relationships: − reduced engine power
zrP = ozmozm
zmTp
P 15,288101325 (2)
− reduced pressure
zrp =ozm
ozmp
p 101325 (3)
− reduced temperature
zrT = ozm
zmT
T 15,288 (4)
− reduced rotational speed
zrn = ozm
zmT
n 15,288 (5)
6 PROPULSIVE CHARACTERISTICS
In order to prepare propulsive characteristics, it is necessary to know the following: − resistance characteristics of the hull R = f(v).. − characteristics of freewheeling propellers − characteristics of propulsive engines − characteristics of elements transmitting the torque
Hydrodynamic characteristics of propellers in the form of KT, KQ, ηp = f(J) where: − thrust coefficient:
42DnTKT ρ
= (6)
− torque coefficient:
52DnQKQ ρ
= (7)
− ηp – freewheeling propeller efficiency
πη
2J
KK
Q
Tp = (8)
− J - advance coefficient
DnJ pυ
= (9)
Coefficients which characterize hull and propeller cooperation t – suction coefficient
TRt −=1 (10)
w –wake fraction
υυ pw −=1 (11)
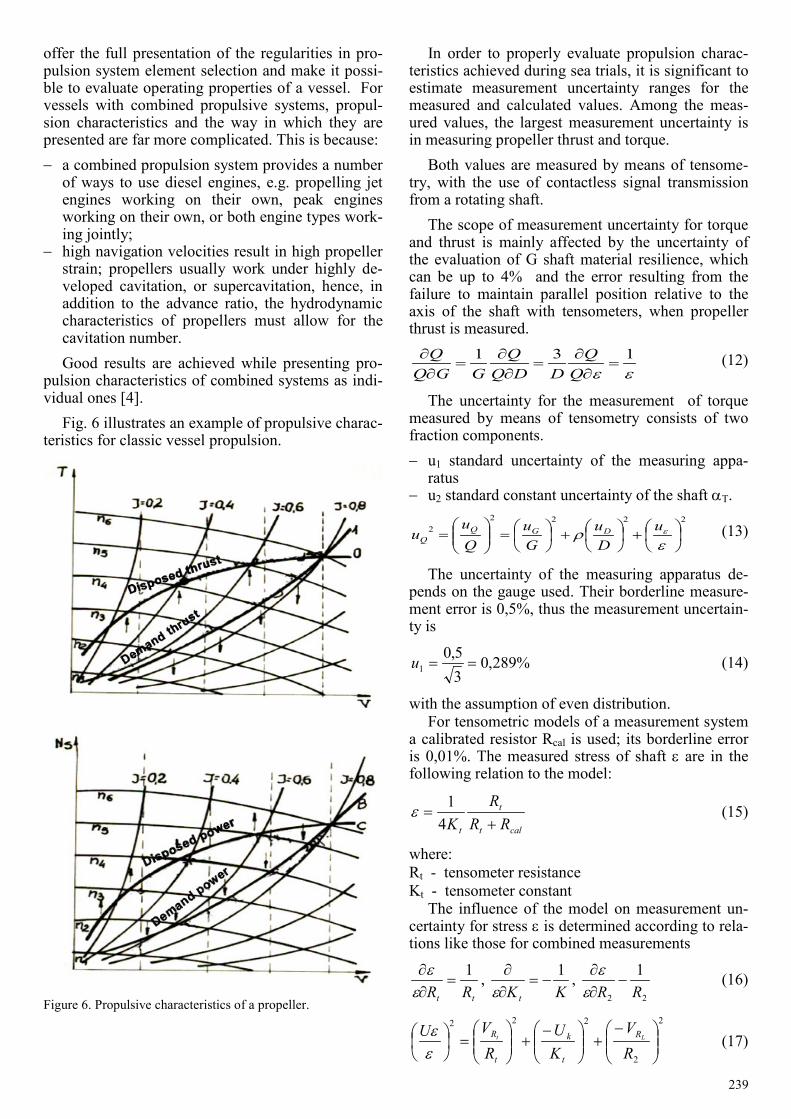
The basis for propulsive characteristics is deter-mining the area of possible operation for a free-wheeling propeller on the grounds of hydrodynamic characteristics. The area is determined in coordinate systems T – n, Q – n, N – n with indicated lines of constant values of advance coefficient J and rota-tional speed of a propeller n. Next, resistance char-acteristics and propulsion engine characteristics are transferred onto adequate graphs and collated with the same measurement sites, e.g. propeller cone or output shaft clutch for torque and power, and vessel hull or propeller cone for resistance characteristics and propeller parameters. Collating the measurement results with appropriate sites is significant in order to consider the efficiency of particular elements that take part in transferring torque, and the efficiency of the hull and propellers. Propulsive characteristics
239
offer the full presentation of the regularities in pro-pulsion system element selection and make it possi-ble to evaluate operating properties of a vessel. For vessels with combined propulsive systems, propul-sion characteristics and the way in which they are presented are far more complicated. This is because: − a combined propulsion system provides a number
of ways to use diesel engines, e.g. propelling jet engines working on their own, peak engines working on their own, or both engine types work-ing jointly;
− high navigation velocities result in high propeller strain; propellers usually work under highly de-veloped cavitation, or supercavitation, hence, in addition to the advance ratio, the hydrodynamic characteristics of propellers must allow for the cavitation number. Good results are achieved while presenting pro-
pulsion characteristics of combined systems as indi-vidual ones [4].
Fig. 6 illustrates an example of propulsive charac-teristics for classic vessel propulsion.
Figure 6. Propulsive characteristics of a propeller.
In order to properly evaluate propulsion charac-teristics achieved during sea trials, it is significant to estimate measurement uncertainty ranges for the measured and calculated values. Among the meas-ured values, the largest measurement uncertainty is in measuring propeller thrust and torque.
Both values are measured by means of tensome-try, with the use of contactless signal transmission from a rotating shaft.
The scope of measurement uncertainty for torque and thrust is mainly affected by the uncertainty of the evaluation of G shaft material resilience, which can be up to 4% and the error resulting from the failure to maintain parallel position relative to the axis of the shaft with tensometers, when propeller thrust is measured.
εε131
=∂
∂=
∂∂
=∂
∂Q
QDDQ
QGGQ
Q (12)
The uncertainty for the measurement of torque measured by means of tensometry consists of two fraction components. − u1 standard uncertainty of the measuring appa-
ratus − u2 standard constant uncertainty of the shaft αT.
22222
+
+
=
=
ερ εu
Du
Gu
Qu
u DGQQ
(13)
The uncertainty of the measuring apparatus de-pends on the gauge used. Their borderline measure-ment error is 0,5%, thus the measurement uncertain-ty is
%289,035,0
1 ==u (14)
with the assumption of even distribution. For tensometric models of a measurement system
a calibrated resistor Rcal is used; its borderline error is 0,01%. The measured stress of shaft ε are in the following relation to the model:
calt
t
t RRR
K +=
41ε (15)
where: Rt - tensometer resistance Kt - tensometer constant
The influence of the model on measurement un-certainty for stress ε is determined according to rela-tions like those for combined measurements
tt RR1
=∂∂
εε ,
KKt
1−=
∂∂
ε,
22
1RR
−∂∂
εε (16)
2
2
222
−+
−+
=
RV
KU
RVU Lt R
t
k
t
R
εε (17)
240
With borderline errors of basic values Rt→±0,2%, Kt→±0,5% and R2→±0,01%, the uncer-tainty for models of shaft stress is 0,314%. Torque is calculated based on the variable shaft stress value
Q = αT ε (18)
where
32
4DJ π=
DGJ
T4
=α (19)
αT – constant for a praticular shaft J- moment of inertia; G- shear modules
Torque measurement uncertainty calculated like it is the case in combined measurements and with bor-derline errors for G 3s = 3,45 % thus uG /G = 1,15% for D ±0,1 mm D>200 mm and uD/D = 0,029% for ε uε/ε = 0,314% is: 1,2%
Measurement uncertainty is largely due to errors in estimating G resilience module. This error may be eliminated by running resistance tests on steel used for shafts or using special scale measurement middlebody in the shaft line segment
7 CONCLUSIONS
Vessel operating system trials conducted in real conditions, with effects affected by external factors, i.e. trial environment, broadly understood hull and propeller condition may enable estimation of the
technical condition of the whole vessel, i.e. hull and propulsion system. Periodical tests make it possible to determine reciprocal relationships between fuel use, torque, rotational speed, and vessel speed. The-se relations may be used in ongoing exploitation in order to evaluate the condition of particular elements of a propulsion system while using theoretical pro-pulsion characteristics calculated for the adequate hull and propeller. In diagnostic tests the following factors need to be taken into consideration every time: vessel loading, for warships – reserves, includ-ing fuel reserves, which account for a considerable share of the total mass of the vessel, as well as at-mospheric and hydrometeorological conditions of measurements.
REFERENCES
Charchalis A., 1991.Diagnozowanie okretowych silników tur-binowych. wyd. AMW Gdynia.
Charchalis A., 2001. Nadzór eksploatacyjny siłowni z turbino-wymi silnikami spalinowym.i PROBLEMY EKSPLOAT-ACJI nr 4/2001
Charchalis A., 2001.Opory okretów wojennych i pedniki okre-towe. wyd. Akademii Marynarki Wojennej w Gdyni.
Charchalis A., 2003. Wykorzystanie charakterystyk napedo-wych układów ruchowych okretów szybkich. XXX Sympo-zjum DIAGNOSTYKA MASZYN. Wegierska Górka.
Charchalis A., 2004. Diagnozowanie układów napedowych okretów w oparciu o pomiar parametrów eksploatacyjnych. XXXI Sympozjum DIAGNOSTYKA MASZYN.Wegierska Górka
Charchalis A., 2006. Conditions of drive and diagnostic meas-urements during sea tests. Journal of KONES. Warszawa