
Conditional Conservatism and the Cost of Equity Capital ...
20
Applied Finance and Accounting Vol. 2, No. 1, February 2016 ISSN 2374-2410 E-ISSN 2374-2429 Published by Redfame Publishing URL: http://afa.redfame.com 69 Conditional Conservatism and the Cost of Equity Capital: Information Precision and Information Asymmetry Effects Gary C. Biddle 1 , Mary L. Z. Ma 2 , Feng Wu 3 1 Faculty of Business and Economics, the University of Hong Kong 2 School of Administrative Studies, York University 3 School of Accounting and Finance, the Hong Kong Polytechnic University Correspondence: Mary L. Z. Ma, School of Administrative Studies, York University, Atkinson College, 204A, 4700 Keele Street, Toronto, ON M3J 1P3, Canada. Received: November 2, 2015 Accepted: November 16, 2015 Available online: November 30, 2015 doi:10.11114/afa.v2i1.1225 URL: http://dx.doi.org/10.11114/afa.v2i1.1225 Abstract Prior studies report negative or insignificant relations between conditional conservatism and the cost of equity capital, arguing that conservatism reduces information risk. Using accounting-based conditional conservatism proxies, however, we find a significantly positive association between conditional conservatism and the cost of equity. This positive relation operates via improving information precision about negative earnings shocks and generally inflating information asymmetry among investors, both of which increase the cost of equity. We further find that the cost of equity effect of conditional conservatism disappears in the period after the enactment of the Sarbanes-Oxley Act (SOX), consistent with the notion that nationwide improvement of information precision about negative news and diminished information asymmetry are engendered by the SOX regulation. This study adds to researches on conditional conservatism, SOX, and the cost of equity, and also has policy implications. Keywords: conditional conservatism, cost of equity capital, asset pricing test, Sarbanes-Oxley Act (SOX) 1. Introduction Conditional conservatism is a longstanding feature of financial reporting characterized by the asymmetric timely recognition of bad earnings news relative to good news (Note 1). This more timely loss recognition has been explained as arising from debtholders’ demands for information regarding borrowers’ net liquidation values, thus enabling timely actions to protect debtholders’ interests. The contracting benefit of conservative accounting, however, may come at the expense of its valuation role especially in the stock market (Armstrong, Guay, & Weber, 2010). Recently, the Financial Accounting Standards Board [FASB] and the International Accounting Standards Board [IASB] have removed conservatism from their conceptual framework, arguing that conservative accounting induces information asymmetries that reduce shareholders’ insights into future cash flows from growth options. Johnstone (in press) analy tically shows that even in cases where information does bring greater precision, the precision about bad news could lower expected payoffs and thus increase the equity financing cost. These arguments suggest that timely loss recognition may increase the cost of equity by affecting information precision and information asymmetry. Little prior evidence exists regarding this contention. However, several studies provide some hints about the possible information precision and information asymmetry effects of conditional conservatism. Ball, Jayaraman, and Shivakumar (2012) find that fair value accounting (FVA) increases information asymmetry; as conditional conservatism approximates FVA for net assets at bad times, the evidence suggests that conditional conservatism may similarly increase the cost of equity via enlarging information asymmetry. Kothari, Shu, and Wysocki (2009) report that negative news released by management, analysts, and the business press increases the cost of capital, and Rogers, Skinner, and Buskirk (2009) document that sporadic managerial forecasts of unexpected bad news increase market uncertainty. Since conditional conservatism reveals unexpected negative news, it could possibly increase market risk and thus the cost of equity. Contrary to the implications of these studies, literatures on conditional conservatism and the cost of equity document either a negative relation (e.g., Li, 2010; Garcia Lara, Garcia Osma, & Penalva, 2011) or an insignificant one (e.g., Francis, LaFond, Olsson, & Schipper, 2004). Therefore, the association between conditional conservatism and the cost of equity capital is still an open empirical question.
Transcript of Conditional Conservatism and the Cost of Equity Capital ...

Applied Finance and Accounting
Vol 2 No 1 February 2016
ISSN 2374-2410 E-ISSN 2374-2429
Published by Redfame Publishing
URL httpafaredfamecom
69
Conditional Conservatism and the Cost of Equity Capital Information
Precision and Information Asymmetry Effects
Gary C Biddle1 Mary L Z Ma
2 Feng Wu
3
1Faculty of Business and Economics the University of Hong Kong
2School of Administrative Studies York University
3School of Accounting and Finance the Hong Kong Polytechnic University
Correspondence Mary L Z Ma School of Administrative Studies York University Atkinson College 204A 4700
Keele Street Toronto ON M3J 1P3 Canada
Received November 2 2015 Accepted November 16 2015 Available online November 30 2015
doi1011114afav2i11225 URL httpdxdoiorg1011114afav2i11225
Abstract
Prior studies report negative or insignificant relations between conditional conservatism and the cost of equity capital
arguing that conservatism reduces information risk Using accounting-based conditional conservatism proxies however
we find a significantly positive association between conditional conservatism and the cost of equity This positive
relation operates via improving information precision about negative earnings shocks and generally inflating
information asymmetry among investors both of which increase the cost of equity We further find that the cost of
equity effect of conditional conservatism disappears in the period after the enactment of the Sarbanes-Oxley Act (SOX)
consistent with the notion that nationwide improvement of information precision about negative news and diminished
information asymmetry are engendered by the SOX regulation This study adds to researches on conditional
conservatism SOX and the cost of equity and also has policy implications
Keywords conditional conservatism cost of equity capital asset pricing test Sarbanes-Oxley Act (SOX)
1 Introduction
Conditional conservatism is a longstanding feature of financial reporting characterized by the asymmetric timely
recognition of bad earnings news relative to good news (Note 1) This more timely loss recognition has been explained
as arising from debtholdersrsquo demands for information regarding borrowersrsquo net liquidation values thus enabling timely
actions to protect debtholdersrsquo interests The contracting benefit of conservative accounting however may come at the
expense of its valuation role especially in the stock market (Armstrong Guay amp Weber 2010) Recently the Financial
Accounting Standards Board [FASB] and the International Accounting Standards Board [IASB] have removed
conservatism from their conceptual framework arguing that conservative accounting induces information asymmetries
that reduce shareholdersrsquo insights into future cash flows from growth options Johnstone (in press) analytically shows
that even in cases where information does bring greater precision the precision about bad news could lower expected
payoffs and thus increase the equity financing cost These arguments suggest that timely loss recognition may increase
the cost of equity by affecting information precision and information asymmetry
Little prior evidence exists regarding this contention However several studies provide some hints about the possible
information precision and information asymmetry effects of conditional conservatism Ball Jayaraman and
Shivakumar (2012) find that fair value accounting (FVA) increases information asymmetry as conditional conservatism
approximates FVA for net assets at bad times the evidence suggests that conditional conservatism may similarly
increase the cost of equity via enlarging information asymmetry Kothari Shu and Wysocki (2009) report that negative
news released by management analysts and the business press increases the cost of capital and Rogers Skinner and
Buskirk (2009) document that sporadic managerial forecasts of unexpected bad news increase market uncertainty Since
conditional conservatism reveals unexpected negative news it could possibly increase market risk and thus the cost of
equity Contrary to the implications of these studies literatures on conditional conservatism and the cost of equity
document either a negative relation (eg Li 2010 Garcia Lara Garcia Osma amp Penalva 2011) or an insignificant one
(eg Francis LaFond Olsson amp Schipper 2004) Therefore the association between conditional conservatism and the
cost of equity capital is still an open empirical question
Applied Finance and Accounting Vol 2 No 1 2016
70
This study is thus motivated to examine how conditional conservatism affects the cost of equity via the effects of
information precision (ie more precisely revealing bad news) and information asymmetry Most analytical studies
demonstrate that conditional conservatism improves information quality by providing more accurate negative earnings
signals (eg Gao 2011 Fan amp Zhang 2012) The main argument is that increased information quality through timely
bad earnings news reporting reduces investorsrsquo uncertainty regarding expected future cash flows and the cost of equity
capital (Guay amp Verrecchia 2007 Lambert Leuz amp Verrecchia 2007) which underlies prior studies on the relation
between conditional conservatism and the cost of equity However existing evidence fails to provide consistent
empirical supports for this argument because both negative and insignificant conservatism-cost of capital relations are
documented as mentioned above We propose that the lack of considerations in two dimensions of the implication of
information quality may contribute to the mixed evidence Specifically improved information quality by conditional
conservatism may generate both a precision effect via changing the average precision level of information and an
asymmetry effect through increasing information asymmetry among market participants With regard to the information
precision effect Johnstone (in press) states that although conditional conservatism increases information certainty it
conveys unexpected bad earnings news and lower expected payoffs and a more precise revealing of bad news can
increase the cost of equity This suggests that the more precise bad news shocks are conveyed by conditional
conservatism the more possible that the relation between conditional conservatism and the cost of equity is positive
For the information asymmetry effect existing studies ignore this channel because they assume an efficient and
perfectly competitive equity market that only allows the information precision effect of conditional conservatism
Relaxing this assumption conditional conservatism can also increase the cost of capital through the information
asymmetry effect In particular despite enhancing information quality conditional conservatism can nevertheless
increase information asymmetry and heterogeneity of opinions among analysts and investors by inducing unexpected
negative information shocks Earlier theoretical works concur that accelerating public disclosures and enhancing
information quality can trigger private information acquisition by sophisticated investors which escalates information
asymmetry among investors in general (Kim amp Verrecchia 1991 Demski amp Feltham 1994 McNichols amp Trueman
1994) Recent theoretical and empirical studies argue and provide confirming evidence that enhanced information
quality increases equity cost by generating the information asymmetry effect especially when the market is less than
perfectly competitive andor illiquid (Armstrong Core Taylor amp Verrecchia 2011 Gow Taylor amp Verrecchia 2011
Lambert Leuz amp Verrecchia 2012) Consistently several other studies report a positive relation between conditional
conservatism and analyst forecast errors (Mensah Song amp Ho 2004 Louis Lys amp Sun 2014) Therefore when the
market is imperfect beyond a threshold the information asymmetry effect of conditional conservatism may enhance the
potential information precision effect in increasing equity cost whereas in a more perfect market the information
asymmetry effect does not work Overall the above analysis suggests that the conditional conservatism and equity cost
relation through information quality hinges on the combined effects of information precision and information
asymmetry which are to date empirically unexplored
To examine the relation between conditional conservatism and the cost of equity that operates via the information
precision and information asymmetry effects it is crucial to insulate the measures for conditional conservatism and the
cost of equity from the influences of concurrent stock price information and cash flow shocks Prior studies on this line
of research use stock price-based conditional conservatism measures such as the Basu (1997) measure in Francis et al
(2004) and the CR ratio in Garcia Lara et al (2011) These measures not only assume market efficiency and perfect
competition which are inconsistent with the tests for information effects of conditional conservatism but also reflect
cash flow news inherent in stock returns (Caskey amp Petersen 2009) which may induce a mechanical (possibly negative)
relation between conditional conservatism and equity return (Note 2) These measurement issues are potentially (at least
partially) responsible for the mixed findings about the association between conditional conservatism and the cost of
equity in prior studies To mitigate the confounding effects we employ an alternative accounting-based conditional
conservatism proxy ndash the average of accumulated non-operational accruals and earnings skewness ndash to provide clearer
inferences regarding the informational effects of conservatism following Basu (1995) Givoly and Hyan (2000) and
Zhang (2008) We also control for the impacts of cash flow shocks induced by conditional conservatism which are
impounded into and decrease the realized stock return a proxy for expected return and cost of equity capital often used
in prior studies Specifically we adjust the realized excess return by concurrent cash flow news and use it as our
measure for the cost of equity as suggested by Vuolteenaho (2002) McInnis (2010) Botosan Plumlee amp Wen (2011)
and Ogneva (2012) (Note 3)
Utilizing standard asset pricing tests including hedging portfolio analyses and multivariate regressions based on these
measures we find a significant positive relation between conditional conservatism and the expected stock return
adjusted for cash flow news In particular a hedging strategy for conditional conservatism-sorted portfolios earns
significantly positive excess returns and firm-level Fama-MacBeth cross-sectional regressions yield significantly
positive associations between conditional conservatism and future excess returns adjusted for cash flow news both
Applied Finance and Accounting Vol 2 No 1 2016
71
before and after controlling for firm risk characteristics Portfolio-level two-stage cross-sectional regressions further
reveal that factor loadings on conditional conservatism are significantly positively associated with return spreads for
conditional conservatism-sorted portfolios implying that conditional conservatism is priced by market participants
These findings are in line with the notion that the effects of conditional conservatism on information precision and
information asymmetry increase the cost of equity
We conduct additional analyses to provide more direct supporting evidence regarding the information precision and
information asymmetry effects of conditional conservatism on the cost of equity We use the bid-ask spread to capture
the information asymmetry effect and the magnitude of earnings downside risk to capture the information precision
effect regarding negative earnings shocks We find that larger conditional conservatism is generally associated with
higher information asymmetry and higher precision about earnings downside risk In addition controlling information
asymmetry andor precision about negative earnings shocks in Fama-MacBeth regressions substantially reduces the
conditional conservatism coefficients consistent with our proposition that information precision and information
asymmetry effects of conditional conservatism at least partially explain the positive association between conditional
conservatism and the cost of equity
The passage of the Sarbanes-Oxley Act of 2002 (SOX) offers a unique setting to further investigate the effects of
information precision and information asymmetry on the positive relation between conditional conservatism and the
cost of equity SOX regulations are promulgated to increase financial reporting transparency reduce information
asymmetry and improve market efficiency In particular the nationwide improvement of information precision about
negative news and diminished information asymmetry engendered by SOX regulation holds the potential to mitigate the
cross-sectional firm-specific effect of conditional conservatism on the cost of equity We thus expect a weakened
relation between conditional conservatism and the cost of equity following the enactment of SOX despite the fact that
SOX increases conditional conservatism as shown in Lobo and Zhou (2006) Fama-MacBeth regressions for the periods
before and after SOX give confirming evidence that the enhancing effect of conditional conservatism on the cost of
equity has disappeared in the post-SOX period
This study contributes to literatures on accounting conservatism the cost of equity capital and SOX and holds policy
implications First utilizing conditional conservatism measures net of the influences from stock market and cash flow
shocks we provide original evidence supporting the notion that conditional conservatism reveals more precise
information about unexpected negative earnings shocks and reduces expected payoffs and also generates new
information asymmetry among investors both of which ultimately dampen stock prices and enhance the cost of equity
Our study thus extends prior research that draws only on one facet of the information effect of conservatism and
documents mixed evidence of negative or insignificant associations between conservatism and the cost of equity
(Francis et al 2004 Li 2010 Garcia Lara et al 2011) Differing from these studies we provide an opposite finding
using refined measures and testing methods via a more comprehensive perspective regarding the information quality
effect of conservatism
Second we provide evidence supporting Johnstonersquos (in press) argument that more precise information about bad
earnings news can increase the cost of equity capital We further identify information asymmetry as a channel for the
observed positive relation between conditional conservatism and the cost of equity which extends prior studies on the
asset pricing effect of information asymmetry (Armstrong et al 2011 Gow et al 2011 Lambert Leuz amp Verrecchia
2012) This also adds to the literature on the relation between conservatism and information asymmetry Watts (2003)
LaFond and Roychowdhury (2008) and LaFond and Watts (2008) argue that accounting conservatism mitigates
deadweight losses arising from information asymmetry between firms and external shareholders Extending this line of
research we document a significant positive relation between conditional conservatism and information asymmetry in
general
Third this study contributes to the SOX literature by providing evidence that the positive relation between conditional
conservatism and equity cost disappears following the implementation of SOX which reconfirms that the relation
operates through the informational effect of conservatism Our research also lends credence to SOXrsquos intended purpose
to reduce information asymmetry and enhance information quality
Finally our study also has practical implications It informs deliberations regarding the economic influence of
accounting conservatism that the FASB and IASB recently removed as a fundamental characteristic of financial
information in favor of neutrality Our findings imply that conditional conservatism imposes costs on both stock market
investors and managers thus pointing to a legitimate yet neglected rationale for managers to disfavor conditional
conservatism ndash it creates unexpected negative earnings shocks and generates new information asymmetry among
investors both of which enhance the cost of equity and dampens stock prices
We proceed as follows Section 2 describes prior literature and theory development Section 3 explains our measures
and research design Section 4 reports the main testing results Section 5 presents robustness checks and Section 6
Applied Finance and Accounting Vol 2 No 1 2016
72
concludes
2 Literature Review and Theory Development
21 The Information Precision Effect of Conditional Conservatism
Most analytical studies demonstrate that conditional accounting conservatism improves information quality by
providing more accurate signals (Fan amp Zhang 2012) alleviating dysfunctional earnings manipulations (Chen Hemmer
amp Zhang 2007 Gao 2011) limiting false signaling and free-riding by bad firms (Nan amp Wen 2011) and promoting
timely good news disclosures (Guay amp Verrecchia 2007) Whereas Gigler Kanodia Sapra and Venugopalan (2009)
argue that conditional conservatism conveys news about income-decreasing events at the cost of downward-biased
estimation and thus reduces its information content Gao (2011) demonstrates that in the presence of managerial
opportunism (eg earnings management) the optimal measurement rule is conservatism since it helps cancel off
upward bias and leads to more accurate estimation than a neutrality convention (Gox amp Wagenhofer 2009)
By focusing on improved information quality prior empirical studies on conditional conservatism and the cost of equity
report insignificant or negative relations between them (Francis et al 2004 Li 2010 Garcia Lara et al 2011) Using
Basursquos (1997) conditional conservatism measure based on investorsrsquo asymmetric responses to good and bad earnings
news Francis et al (2004) fail to find a significant association between conditional conservatism and the cost of equity
Also using Basursquos (1997) measure Li (2010) examines the cost of capital effect of conditional conservatism in
international debt and equity market settings and reports that firms domiciled in countries with more conservative
reporting systems have lower cost of equity Garcia Lara et al (2011) also report a significantly negative relation by
adopting a stock return-based conditional conservatism measure the CR ratio
These existing studies mainly employ the theoretical models of Hughes Liu and Liu (2007) Guay and Verrecchia
(2007) and Lambert et al (2007) and argue that more timely bad earnings news reporting via conservatism increases
average information precision among investors about expected cash flows which reduces the covariance between a
firmrsquos stock return and the market return and thus lowers the cost of equity capital However in a recent theoretical
paper Johnstone (in press) analytically demonstrates that the logic underlying these prior theories is misleading in the
sense that (i) the best available information can sometimes leave decision makers less certain about future events and
(ii) even if better information precision brings greater certainty among investors more precise bad news could lower
expected payoffs and thus increase the cost of equity
Consistent with Johnstonersquos (in press) argument another pitfall in prior theoretical studies is that they only focus on
covariance Given unchanged covariance if more precise information lowers investorsrsquo cash flow expectation which is
associated with macroeconomic trends it may increase the cost of equity For instance if more precise information of
timely earnings loss has a systematic economy-wide component by mirroring macroeconomic figures andor projecting
downward market-wide uncertainty into a firmrsquos earnings numbers then it should hold the potential to increase the cost
of equity Crawley (2012) indicates that aggregate conditional conservatism increases the response of macroeconomic
indicators to negative economic news and enhances its negative relation with the federal funds rate Jorgensen Li and
Sadkay (2012) argue (but do not directly test) that conditional conservatism increases aggregate earnings dispersion
which reflects systematic economic uncertainty and increases expected return The evidence and reasoning suggest that
more precise and timely information about bad news recognition has a systematic risk component which goes hand in
hand with its effect of lowering payoff expectations as suggested by Johnstone (in press) to increase the cost of equity
capital Moreover conditional conservatism especially captures bad earnings news shocks which are reflected in a large
magnitude of negative shocks of earnings downside risk Luo Ma and Wu (2014) show that earnings downside risk
measured by the lower partial moment of earnings reflects macroeconomic downward trends and is positively
associated with the cost of equity Overall the above analyses collectively suggest that conditional conservatism can
increase the cost of equity due to more precision in revealing bad news of negative earnings shocks
22 The Information Asymmetry Effect of Conditional Conservatism
Most prior studies relevant to the association between conditional conservatism and the cost of equity implicitly assume
market efficiency and perfect competition (eg Francis et al 2004 Hughes Liu amp Liu 2007 Garcia Lara et al 2011
Lambert et al 2012) Specifically Hughes et al (2007) and Lambert et al (2012) observe that under these assumptions
there is no opportunity for information asymmetry to influence the cost of equity and only information precision can be
priced For example Hughes et al (2007) argue that the pricing of asymmetric information in a competitive market as
claimed by Easley and OrsquoHara (2004) is a ldquomisperceptionrdquo Without these assumptions however ie in a less perfectly
competitive setting information asymmetry may play a role in affecting the cost of equity Several theoretical studies
claim that public disclosures can trigger private information acquisition and increase opinion divergence and
information asymmetries among investors (Kim amp Verrecchia 1991 Demski amp Feltham 1994 McNichols amp Trueman
1994) Investors with an information advantage have a stronger influence on stock price and investors with less
Applied Finance and Accounting Vol 2 No 1 2016
73
sophisticated information processing ability andor with an information disadvantage will thus require higher
compensation to enter the market and to trade with better-informed counterparties (eg Diamond amp Verrecchia 1991
Verrecchia 2001 Easley Hvidkjaer amp OrsquoHara 2002 Easley amp OrsquoHara 2004) Consistent with this reasoning recent
empirical and theoretical works such as Gow et al (2011) and Lambert et al (2012) argue that higher precision of
reported (earnings) information complements private information acquired by sophisticated investors (ie discourages
them from acquiring private information) leading to higher opinion heterogeneity and more rather than less information
asymmetry Armstrong et al (2011) Gow et al (2011) and Akins Ng and Verdi (2012) document consistent evidence
that information asymmetry increases the cost of capital when the market is less than perfectly competitive (Note 4)
While conditional conservatism increases information quality and thereby enhances outsidersrsquo ability to verify
information provided by insiders (Watts 2003) this enhanced information precision can alternatively cause a greater
heterogeneity of opinions and generate new information asymmetry among external shareholders as stock market
investors are more sensitive to sporadic unexpected and negative earnings news (Rogers et al 2009) Therefore we
expect that on net conditional conservatism increases information asymmetry and equity cost via its information
asymmetry effect in less than perfectly competitive settings When the market is imperfect beyond a certain level the
information asymmetry effect of conditional conservatism may add to its information precision effect and lead to a
larger increase in equity cost although this information asymmetry effect should be nonexistent in a perfect market
In summary given the fact that conditional conservatism leads to high information quality high quality information
may not necessarily lead to low cost of equity The key insight is that conservative reporting reveals bad news more
precisely Such precise revealing of bad news could possibly increase the cost of equity by (i) inducing a pessimistic
expectation of fundamental payoffs (the information precision effect) and (ii) entailing additional asymmetric
information among investors (the information asymmetry effect) especially in an imperfect market Prior studies on the
relation between conservatism and the cost of equity capital largely neglect these two aspects inherent in the
information quality effect of conditional conservatism Our work is therefore set on investigating the relation between
conditional conservatism and the cost of equity via these new informational perspectives
3 Measurements and Research Methodology
Two necessary requirements for studying conditional conservatism and its relation with the cost of equity from the
informational perspective are that (i) the conditional conservatism measure should be free of the confounding impact of
stock market information and (ii) the realized equity return as a proxy for the ex ante cost of equity should be net of
unexpected cash flow shocks ex post The reason is that both considerations could possibly induce spurious results and
biased inferences about the association between conditional conservatism and the cost of equity Specifically the
conditional conservatism measure should not endogenously incorporate stock return data which already impound the
effects of information precision and information asymmetry and their feedbacks to firmsrsquo and investorsrsquo investment
behaviors This consideration is critical especially when the cost of equity is measured by stock returns otherwise a
potential mechanical relation may arise by construction For the same reason it is important to control for unexpected
cash flow shocks (cash flow news) embedded in realized stock returns when measuring investorsrsquo expected returns for
equity investment Prior evidence suggests that conditional conservatism is closely related to cash flow news (eg
Callen Segal amp Hope 2010 Kim amp Pevzner 2010 Srivastava amp Sunder 2011) that is reflected in stock prices (Note
5) Cash flow news may also subsume private information feedback (Gao amp Liang 2011) and twist with the information
asymmetry effect (Gow et al 2011) Therefore empirical tests involving equity returns without controlling for cash
flow news may yield spurious inferences about the impact of conditional conservatism on the cost of equity
For these reasons we use realized excess stock returns that explicitly control for cash flow news to measure the cost of
equity and employ accounting-based conditional conservatism measures immune from asset market influences Both
treatments are amenable to our research purpose of having a comprehensive examination of conditional conservatismrsquos
impact on equity cost from the perspectives of the information precision effect and information asymmetry effect In
this sense our measures are supplements to rather than substitutes for existing proxies for conditional conservatism and
the cost of equity
31 The Conditional Conservatism Measure
In the main tests our accounting-based conditional conservatism measure CON is defined as the average of relative
accumulated non-operational accruals (CON_Acm) and relative earnings skewness (CON_Skew) CON_Acm is negative
one times the ratio of accumulated non-operating accruals to accumulated total assets with both computed using a
moving average of the current and prior two years for each firm-year observation and
Non-operating accruals = Total accruals - Δaccounts receivable (Compustat RECT) (1)
- Δinventories (Compustat INVT) - Δprepaid expenses (Compustat XPP)
+ Δaccounts payable (Compustat AP) + Δtaxes payable (Compustat TXT)
Applied Finance and Accounting Vol 2 No 1 2016
74
This measure follows Givoly and Hayn (2000) and Zhang (2008) and captures bad earnings news reporting via
non-operational accruals for example those arising from restructuring charges and asset write-downs However this is
a noisy measure for conditional conservatism (Ryan 2006) Presumably it also captures unconditional conservatism
(eg pooling vs purchase accounting) (real) earnings management the stock option expense etc
CON_Skew is negative one times the ratio of the sum of 10 and earnings skewness to the sum of 10 and operating cash
flow (OCF) skewness where skewness is estimated using a rolling window of 20 quarters with a minimum requirement
of 12 quarters of data This measure derives from Basu (1995) and adapts the negative skewness measure in Zhang
(2008) to ensure that higher skewness indicates higher degree of conditional conservatism We deflate earnings
skewness by OCF skewness to control for the influence of shocks in the cash flow Since CON_Acm and CON_Skew are
both noisy proxies for conditional conservatism and may capture non-conservatism elements such as big baths we use
their average CON to help mitigate potential measurement errors In robustness tests we examine CON_Acm and
CON_Skew separately We also employ negative earnings skewness Skew defined as the difference between the
skewnesses of OCF and earnings estimated over a 20-quarter rolling window (Callen et al 2010) and CONA defined
as the average of Skew and CON_Acm as alternative conditional conservatism measures for robustness checks
32 The Cost of Equity Measure
Our cost of equity measure controls for the effect of cash flow news by subtracting it from realized excess stock returns
extending the methodology in McInnis (2010) and Ogneva (2012) (Note 6) Specifically we calculate cash flow news
(Ne) as follows First we estimate earnings surprises (SURP) from a time-series earnings prediction model augmented
by the economic determinants of earnings assuming that annual earnings for firm i follow an AR (1) process We use a
rolling window of five years to fit model (2) below by Fama and French (1997) industry classifications
EARNit+1 = β0 + β1EARNit + β2SALEit + β3SIZEit + εit+1 (2)
where EARNit+1 (EARNit) is earnings over book equity for the next (current) fiscal year SALEit is sales over book value
of total assets for the current fiscal year and SIZEit is firm size measured as the natural logarithm of market equity at the
current fiscal year-end
Earnings surprise SURPit+1 is then calculated as the difference between the actual and predicted EARN times the
book value of equity which is scaled by the market value of equity at the beginning of the month We obtain cash flow
news from monthly cross-sectional regressions of excess stock returns on contemporaneous earnings surprises using a
linear OLS specification Cash flow news (Neit+1) is calculated as the product of SURPit+1 and its estimated coefficient
from the following models
Rraw
it+1 = α0 + α1SURPit+1 + εit+1 (3)
Neit+1 = ά1SURPit+1 (4)
where Rraw
is monthly excess return and ά1 is the estimated α1 in model (3) We use the next monthrsquos excess return
adjusted for cash flow news Rit+1 as the cost of equity capital proxy (ie Rit+1 = α0 + εit+1 = Rraw
it+1 - Neit+1)
33 Measures for Information Precision and Information Precision
Following the literature we use three measures for information asymmetry average bid-ask spread IRisk average daily
high and low spread HLSpread and private information trading Itrade IRisk is defined as the average daily percentage
bid-ask spread over the 12 months prior to the current fiscal year-end HLSpread refers to the average daily high and
low spread over the 12 months prior to the current fiscal year-end calculated following Corwin and Schultz (2011) and
Itrade is estimated as in Llorente Michaely Saar and Wang (2002) and Ferreira and Laux (2007) Both IRisk and
HLSpread reflect information asymmetry in general while Itrade denotes information asymmetry arising from
speculatorsrsquo information hunting We use IRisk in the main tests and employ HLSpread and Itrade in robustness checks
Measuring the information precision associated with conditional conservatism is not as easy The traditional measure for
information precision (quality) is accrual quality Acc the volatility of residual accruals estimated from an accrual
prediction model However Acc reflects information precision of both and bad earnings news Therefore it cannot
accurately capture the information precision of negative earnings shocks conveyed by conditional conservatism which
should be only relevant to the downside volatility of accruals or earnings We thus adopt the following downside risk
measures used in Luo et al (2014) ERisk and AERisk to capture the information precision of conditional conservatism
about bad earnings shocks ERisk refers to the downside risk of residual accruals from an accrual prediction model and
is calculated as the natural logarithm of the ratio of one plus the accrual root lower partial moment over one plus the
accrual root upper partial moment (Note 7) Similarly AERisk measures the downside risk of residual earnings
estimated from an earnings prediction model and calculated as the natural logarithm of the ratio of one plus the root
lower partial moment of return on assets (ROA) over one plus the root upper partial moment of ROA
Applied Finance and Accounting Vol 2 No 1 2016
75
Both ERisk and AERisk are significantly positively associated with accrual quality Acc (as shown in Table 1 later) Luo
et al (2014) report that earnings and accrual downside risk measures are also positively associated with other available
information quality measure such as predictability and timeliness suggesting that they are valid measures for
information precision of negative earnings shocks associated with conditional conservatism Since accrual-based
downside risk ERisk is the main source of earnings downside risk and drives its relation with the cost of capital (Luo et
al 2014) we use ERisk in our main tests and use AERisk (and simple earnings volatility) in robustness checks
34 The Asset Pricing Methodology
Our main approach to examining the relation between conditional conservatism and the cost of equity capital follows
standard asset pricing methods including the hedging portfolio analysis the firm-level Fama-MacBeth cross-sectional
regression and the portfolio-level two-stage cross-sectional regression (2SCSR) analysis as elaborated below We also
employ other approaches such as the pooled OLS regression in robustness checks
We first use a hedging portfolio approach that buys (sells) stocks with high (low) conditional conservatism measures to
assess the association of conditional conservatism with the cost of equity (excess equity returns adjusted for cash flow
news) (Note 8) Specifically for each month stocks are assigned to one of five portfolios based on a firmrsquos most recent
conditional conservatism measure CON with at least four months lag and portfolio 1 (5) containing firms with the
lowest (highest) level of CON The monthly return difference between the highest (portfolio 5) and lowest (portfolio 1)
CON portfolios is computed with a significantly positive (negative) mean difference indicating a positive (negative)
relation between CON and the cost of equity capital
To control for other factors that may influence the CON-return relation we regress firm-specific excess returns adjusted
for cash flow news on CON and other firm characteristics We match annual CON estimates with monthly returns in the
next 12 months starting four months after the fiscal year-end For example for firms with fiscal year t ending in
December we collect monthly returns data from April of calendar year t+1 to March of calendar year t+2 We estimate
the following cross-sectional regression model and its simplified variations by month and then average the coefficient
parameters following the procedures in Fama and MacBeth (1973)
Rit+1 - RFt+1 = α + β1CONit + β2Betait + β3Sizeit + β4BMit + β5Momentumit + β6TCAit (5)
+ β7Accit + β8 Low_Pricedit + μit+1
where CONit is the conditional conservatism measure for stock i in month t Rit+1 refers to return adjusted for cash flow
news for stock i in month t +1 RFt+1 is the US one-month T-bill rate in month t +1 Betait refers to the beta of stock i
for month t estimated as in Fama and French (1992) Sizeit is defined as the natural logarithm of market capitalization of
stock i for month t as in Fama and French (1992) BMit is the natural logarithm of the ratio of book to market equity of
stock i for month t as in Fama and French (1992) Momentumit refers to the buy-and-hold return of stock i for the
11-month period ending one month prior to the current month t TCAit is total accrual measured in the balance sheet
approach scaled by total assets following Sloan (1996) (Note 9) Accit is the decile ranking of accrual quality from Kim
and Qi (2010) and Ogneva (2012) (Note 10) and Low_Pricedit is an indicator variable for returns with two adjacent
prices of less than five US dollars as defined in Kim and Qi (2010) Among the control variables Beta Size and BM
are commonly accepted factors that affect expected stock returns We include Momentum to ensure that the results are
not attributable to conservative firms with previous negative returns Since one CON component (CON_Acm) is
accrual-based we control for TCA and Acc to ensure that the relation between conditional conservatism and equity
returns is robust to the pricing effects of TCA and Acc (Khan 2008 Ogneva 2012 Kim amp Qi 2010) Low_Priced is
also controlled along with Acc since penny stocks substantially impact Accrsquos pricing (Kim amp Qi 2010) Following
Lewellen Nagel and Shanken (2010) we include industry dummies in cross-sectional regressions to address the
concern that missing industry effects may bias the coefficient estimates
We further conduct a 2SCSR analysis on Fama-French 25 size and BM portfolios to examine possible risk-based asset
pricing implications of conditional conservatism In the first stage we construct a conservatism factor RCON which
represents return on a zero-investment portfolio buying the top 20 percent of firms and selling the bottom 20 percent of
firms sorted by CON and estimate the multivariate betas from time-series regressions of excess returns for a portfolio
of firms according to size and BM Rqt - RFt on contemporaneous portfolio returns to the Fama-French and momentum
factors along with RCON The first-stage models are
Rqt - RFt = b0 + bqRM-RF(RMt - RFt) + bqSMBSMBt + bqHMLHMLt + bqRCONRCONt + εqt (6)
Rqt - RFt = b0 + bqRM-RF(RMt - RFt) + bqSMBSMBt + bqHMLHMLt (7)
+ bqUMDUMDt + bqRCONRCONt + εqt
Applied Finance and Accounting Vol 2 No 1 2016
76
where Rqt refers to average excess return on the size-BM portfolio q in month t RCONqt is the return on CON factor as
explained above RMt - RFt refers to the return on market portfolio (CRSP value-weighted) minus the risk free rate
proxied by the US one-month T-bill rate RFt SMBt is the return on a factor-mimicking hedge portfolio for size as in
Fama and French (1993) HMLt is the return on a factor-mimicking hedge portfolio for BM as in Fama and French
(1993) and UMDt refers to the return on a factor-mimicking hedge portfolio for momentum as in Carhart (1997)
The second stage estimates the cross-sectional regressions of mean excess factor returns on the factor loadings
estimated in the first-stage time-series regressions as follows
Rqt - RFt = a0 + a1bqRM_RF + a2bqSMB + a3bqHML + a4bqRCON + ηqt (8)
Rqt - RFt = a0 + a1bqRM_RF + a2bqSMB + a3bqHML + a4bqUMD + a5bqRCON + ηqt (9)
where bqRM_RF bqSMB bqHML bqUMD and bqRCON are factor loadings estimated in the first stage If the estimated
coefficients for bqRCON are significantly positive (negative) then RCON is deemed to reflect a priced factor with a
positive (negative) risk premium
4 Data and the Relation between Conditional Conservatism and the Cost of Equity
41 Data and Descriptive Statistics
Our sample consists of all common stocks traded on the NYSE NASDAQ and AMEX during the period from January
1986 to December 2008 Daily and monthly returns and the US one-month T-bill rates are obtained from CRSP with
corresponding accounting data retrieved from COMPUSTAT Conditional conservatism estimates are winsorized to the
1 and 99 percentiles of Fama and French (1997) industry distributions for each fiscal year to abate potential biases
from outliers The final sample includes 62833 firm-year observations with conditional conservatism estimates Table 1
reports descriptive statistics for variables used in the main tests Panel A shows that the means (medians) of CON and its
two components CON_Acm and CON_Skew are -05035 (-05129) 00085 (00116) and -10155 (-10303)
respectively (Note 11) Panel B indicates that the Pearson and Spearman correlations of CON with CON_Skew and
CON_Acm are significantly positive within the range of 01338 to 09913 lending construction validity to CON as a
representative conditional conservatism measure Nonetheless the Pearson (Spearman) correlation between CON_Skew
and CON_Acm is only 00018 (00623) with the former statistically insignificant which is not necessarily inappropriate
since they gauge conditional conservatism from different dimensions CON_Skew measures conservatism arising from
earnings and operating accruals while CON_Acm captures conservatism arising from non-operating accruals In
addition all Pearson and Spearman correlations of conditional conservatism measures with total accruals (TCA) are
significantly negative whereas those with accrual quality (Acc) are significantly positive This suggests that
accounting-based conditional conservatism measures convey information about TCA and ACC but such information is
not exactly the same as (and therefore cannot be subsumed by) that contained in total accruals and accrual quality of
firms
Table 1 Descriptive statistics for conditional conservatism and firm characteristic variables
Panel A Summary Statistics
CON CON_Skew CON_Acm TCA Acc IRisk ERisk Size Beta BM Momentum
Mean -05035 -10155 00085 00099 00534 00278 -00063 24113615 12276 06252 01570
STD 07700 02000 15200 01200 00500 00400 01200 127247500 03500 04400 05900
Q1 -05780 -11477 -00231 -00316 00224 00061 -00544 559520 09648 03256 -01667
Median -05129 -10303 00116 00080 00379 00170 -00076 2284739 11726 05167 00667
Q3 -04291 -08726 00425 00546 00664 00362 00393 10076076 14421 07952 03403
Panel B Correlation Matrix
CON CON_Skew CON_Acm TCA Acc IRisk ERisk Size Beta BM Momentum
CON 1 01338 09913 -00068 02244 00174 02947 -00054 00236 -00005 00016
CON_Skew 09129 1 00018 -00318 02552 00663 00681 -00426 01595 00434 00255
CON_Acm 04001 00623 1 -00027 00493 -00158 02887 00002 00027 -00063 -00017
TCA -00560 -00375 -00386 1 -00451 -00254 -03036 -00018 00184 -01140 00112
Acc 02620 02780 00547 -00198 1 00419 00185 -00650 03004 -00714 00119
IRisk 00546 00942 -00699 00095 01154 1 00054 -01180 00588 03537 00653
ERisk 01447 00629 02484 -03270 00026 -00112 1 00234 00099 00022 00268
Size -01047 -01442 00564 00221 -02798 -07671 00448 1 -01202 -01248 -00019
Beta 01474 01531 00518 00198 03271 00808 -00340 -02068 1 00114 00331
BM 00093 00305 -00622 -01314 -00880 03620 -00090 -04294 -00036 1 00619
Momentum -00051 -00162 00213 00019 -00717 00018 00412 01026 -00527 00472 1
Description This table reports descriptive statistics for conditional conservatism measures and firm characteristic
variables for the sample period of January 1986 to December 2008 Panel A shows summary statistics and Panel B
Applied Finance and Accounting Vol 2 No 1 2016
77
presents Pearson and Spearman correlations among these variables in the upper and lower triangles respectively
Highlighted numbers are statistically significant at the 10 level Variable definitions are available in Sections 3 and 4
42 Hedging Portfolio Analysis Results
Table 2 reports the hedging portfolio results for the average excess returns adjusted for cash flow news and abnormal
returns represented by alphas as well as other measures that have influences on the expected stock returns or equity cost
We construct five CON-sorted portfolios rebalanced each month with portfolio 1 (5) representing observations with the
smallest (largest) CON The average cash flow news adjusted excess return (Ret) and three abnormal return measures
(CAPM alpha 3-factor alpha 4-factor alpha) all increase monotonically across CON portfolios with average mean
differences between the top and bottom portfolios as 00053 00044 00048 and 00056 respectively all statistically
significant at the 1 confidence level A similar pattern is observed for Mom In contrast total accrual (TCA) declines
monotonically with CON with an average of 00181 for portfolio 1 and 00005 for portfolio 5 The mean difference of
-00176 is statistically significant suggesting that CON is negatively correlated with TCA consistent with evidence in
Table 1 The pattern for accrual quality Acc although non-monotonic generally exhibits a positive relation with CON
where the mean difference between portfolios 1 and 5 is 00338 statistically significant at the 1 confidence level
Overall Table 2 provides evidence that a higher CON is associated with higher expected returns (alphas or cash flow
news adjusted excess returns) implying that larger conditional conservatism increases the cost of equity Moreover
CON is shown to be significantly correlated with return momentum total accruals and accrual quality indicating a
need to control for these variables in multivariate cross-sectional regressions
Table 2 Conditional conservatism-sorted portfolio analysis for average monthly cash flow news adjusted excess returns
alphas momentum total accruals and accrual quality
Portfolio Ret CAPM alpha 3-factor alpha 4-factor alpha Momentum TCA Acc
1 00074 00031 00015 00030 01354 00181 00431
2 00088 00044 00027 00041 01425 00132 00402
3 00096 00049 00035 00053 01511 00129 00455
4 00108 00058 00047 00062 0175 00093 00569
5 00127 00074 00063 00085 01772 00005 00769
(5-1) 00053 00044 00048 00056 00418 -00176 00338
t-statistic (396)
(370)
(463)
(487)
(560)
(-2368)
(4075)
Description The table compares cash flow news adjusted excess returns abnormal returns (alphas) momentum total
accruals and accrual quality across portfolios formed on conditional conservatism (CON) for a sample of 62833
observations of firms listed on the NYSE NASDAQ and AMEX with available CON measures over the period of
January 1986 to December 2008 At the end of each month firm-month observations are assigned into five portfolios
based on the firmrsquos most recent CON known four months prior to the current date Portfolio 1 (5) contains firms with
the smallest (largest) CON Average differences between the top and bottom portfolios are reported in the row (5-1) The
t-statistics for these differences are computed with a Newey and West (1987) correction Ret refers to return excluding
cash flow news and risk free rate CAPM alpha 3-factor alpha and 4-factor alpha refer to abnormal returns from
CAPM Fama-French three-factor model and Fama-French-Carhart four-factor model respectively TCA is total
accruals (Sloan 1996) and Acc is accrual quality (Kim amp Qi 2010)
43 Firm-Level Fama-MacBeth Regression Results
Table 3 presents results for the Fama-MacBeth cross-sectional regressions of monthly cash flow news adjusted excess
returns on CON and other firm risk characteristics including Beta Size BM Mom TCA and Acc Following Kim and
Qi (2010) we also include Low_Priced an indicator for low-priced shares along with Acc Panels A and B show results
without and with controls for Fama and French (1997) industry effects respectively
Consistent with results from the portfolio analysis cross-sectional regression loadings on CON are consistently positive
and significant with coefficients (t-statistics) of 00138 (354) and 00098 (332) in univariate regressions without and
with controlling for industry effects respectively (Note 12) After Beta Size and BM are added as further controls
CON coefficients remain significantly positive with corresponding coefficients (t-statistics) of 00091 (342) and
00063 (277) in Panels A and B respectively Moreover CONrsquos effect on the cost of equity is not subsumed by either
Mom TCA or Acc when they enter into the regressions individually or collectively suggesting that CON provides
incremental information beyond that from momentum total accruals and accrual quality Therefore results in Table 3
reconfirm that conditional conservatism is positively related to the cost of equity capital which cannot be captured by
standard risk factors and is not contributable to total accruals andor accrual quality effects The relation between
Applied Finance and Accounting Vol 2 No 1 2016
78
conditional conservatism and the cost of equity is also robust to industrial characteristics
Table 3 Fama-MacBeth regressions of monthly cash flow news adjusted excess returns on conditional conservatism
Panel A Regressions without Industry Dummies
Model CON Beta Size BM Momentum TCA Acc Low_Priced Avg Adj R-square
1 00138 00017
(354)
2 00091 00029 -00014 00022 00256
(342) (092) (-275) (246)
3 00088 00019 -00015 00022 00022 00325
(341) (068) (-301) (252) (124)
4 00085 00031 -00014 00017 -00171 00267
(324) (101) (-278) (197) (-588)
5 00115 00023 -00021 00026 00324 -00158 00345
(524) (077) (-485) (345) (245) (-846)
6 00107 00018 -00022 00023 00000 -00169 00295 -00158 00419
(494) (065) (-511) (297) (003) (-578) (238) (-930)
Panel B Regressions with Industry Dummies
Model CON Beta Size BM Momentum TCA Acc Low_Priced Avg Adj R-square
1 00098 00367
(332)
2 00063 00025 -00013 00025 00535
(277) (095) (-272) (365)
3 00061 00018 -00014 00026 00008 00587
(273) (074) (-297) (377) (048)
4 00059 00027 -00013 00021 -00151 00544
(259) (104) (-275) (307) (-575)
5 00106 00032 -00023 00025 00103 -00159 00626
(501) (126) (-535) (389) (096) (-890)
6 00099 00028 -00024 00023 -00013 -00156 00087 -00164 00682
(471) (119) (-560) (354) (-085) (-562) (085) (-1000)
Description This table presents estimation results for Fama-MacBeth regressions of monthly cash flow news adjusted
excess returns against conditional conservatism (CON) and other firm characteristics including Beta Size BM
Momentum TCA Acc and a low-priced return indicator variable Low_Priced for the period of January 1986 to
December 2008 The reported estimates are time-series averages of coefficients from 276 monthly cross-sectional
regressions The t-statistics are calculated from Newey and West (1987) standard errors of these monthly averages
Panel A reports results without controlling for Fama and French (1997) industry effect whereas Panel B reports results
after controlling for industry effect by adding dummies for the Fama-French industries Monthly cash flow news
adjusted excess return is calculated as the raw return less cash flow news and the risk free return proxied by US
one-month T-bill rate Beta is estimated following the procedure in Fama and French (1992) Size is the natural log of
market capitalization BM is the natural log of the ratio of book value of equity to market value of equity We match
Beta Size and BM measures with return data following Fama and French (1992) Momentum is an 11-month return in
the prior-year omitting the most recent month CON is the average of firm-year conditional conservatism measure
CON_Acm and CON_Skew TCA is total accruals (Sloan 1996) Acc is the accrual quality measure used in Kim and Qi
(2010) and Ogneva (2012) We match annual estimates of CON TCA and Acc with monthly stock returns in the next 12
months starting four months after the fiscal year-end The low-priced return indicator is set to 1 if returns are computed
using two adjacent prices less than $5 and 0 otherwise The main models used in Panels A and B are estimated using
model (5) described in Section 3
44 Portfolio-Level 2SCSR Results
To further confirm conditional conservatismrsquos impact on the cost of equity we conduct the 2SCSR analysis at the
portfolio-level which is less affected by firm-specific characters that may contaminate the underlying relation
considered Table 4 reports estimation results for models (6) to (9) Panel A presents the first-stage time-series
regressions of monthly portfolio excess stock returns adjusted for cash flow news on the CON factor (RCON) Fama and
French (1993) three factors (RM - RFt SMB and HML) and Carhart (1997) momentum factor (UMD) Factor loadings
Applied Finance and Accounting Vol 2 No 1 2016
79
on RCON are significantly positive with magnitudes (t-statistics) of 04725 (416) when the three Fama-French factors
are controlled and 03814 (341) when the momentum factor is further added
Panel B reports results for the second-stage cross-sectional regressions of mean cash flow news adjusted excess
portfolio returns on factor loadings estimated from the first stage The coefficients for the factor loadings on RCON
βRCON are significantly positive with magnitudes (t-statistics) of 00051 (342) and 00055 (349) when loadings on the
Fama and French (1993) three factors and Carhart (1997) four factors are controlled respectively The last column
indicates that when βRCON is included the average adjusted R2 jumps from 04170 to 07566 for the three-factor model
and from 04086 to 07530 for the four-factor model Therefore evidence from the 2SCSR analysis provides further
support for the enhancing effect of conditional conservatism on the cost of equity In the next section we explore the
proposed information precision and information asymmetry effects that contribute to the positive conditional
conservatism and cost of equity relation
Table 4 Portfolio-level two-stage cross-sectional regressions
Panel A First-stage Time-series Regressions of Portfolio Returns on Factor Returns
Model Intercept RM-RF SMB HML UMD RCON Adj R-square
1 00053 10925 08475 02868 07626
(454) (4225) (1183) (405)
2 00031 10292 07242 03330 04725 07857
(337) (3114) (1371) (492) (416)
3 00077 10457 08665 02272 -02305 07834
(638) (4116) (1196) (306) (-1126)
4 00056 10003 07647 02718 -02023 03814 08024
(674) (3052) (1438) (383) (-1170) (341)
Panel B Second-stage Cross-sectional Regressions of Portfolio Returns on Factor Loadings
Model Intercept βRM-RF βSMB βHML βUMD βRCON Adj R-square
1 00250 -00184 00061 00051 04170
(260) (-242) (221) (195)
2 00282 -00180 -00049 00091 00051 07566
(452) (-366) (182) (493) (342)
3 00263 -00214 00045 0007 -00090 04086
(268) (-253) (133) (198) (-061)
4 00275 -00159 -00044 00079 00050 00055 07530
(436) (-290) (-159) (345) (-051) (349)
Description This table shows results of Fama-French 25 portfolio-level two-stage cross-sectional regressions for a
sample over the 1986-2008 period Panel A reports average factor loadings and adjusted R2 of the first-stage time-series
regressions of monthly portfolio cash flow news adjusted excess returns against the three FamandashFrench factors a
momentum factor and a conservatism factor RCON using models (6) and (7) described in Section 3 We construct
RCON as the return on a zero-investment portfolio by buying the top 20 percent of firms and selling the bottom 20
percent of firms in terms of CON Panel B reports estimated coefficients for the second-stage cross-sectional regressions
of excess portfolio returns on portfolio factor loadings estimated from the first stage according to models (8) and (9) in
Section 3
45 Information Precision and Information Asymmetry Effects of Conditional Conservatism and Its Relation with the
Cost of Equity
We move on to investigate how conditional conservatism affects the cost of equity through its information precision
effect and information asymmetry effect We first employ a portfolio approach to examine how they mediate the relation
between conditional conservatism and the cost of equity Specifically we construct five CON-based portfolios and
check the levels of information asymmetry IRisk and information precision (about negative earnings shocks) ERisk in
each portfolio If high-CON portfolios on average have significantly higher IRisk andor ERisk then we can conclude
Applied Finance and Accounting Vol 2 No 1 2016
80
that conditional conservatism can generally elevate the information asymmetry andor information precision of negative
earnings shocks We then use the following Fama-MacBeth model and its simplified variations to investigate both
effects in multivariate regressions
Rit+1 - RFt+1 = α + β1CONit + β2Betait + β3Sizeit + β4BMit + β5IRiskit+ β6ERiskit (10)
+ sumIndustry_Dummies + μit+1
where Rit+1 RFt+1 Betait Sizeit and CONit are defined as in model (5) and Industry_Dummies represents the Fama and
French (1997) industry classifications If CON affects the cost of equity capital via information asymmetry andor
earnings downside risk then adding IRisk andor ERisk should weaken the relation as reflected in the magnitude and
significance level of the CON coefficient
Table 5 reports results from the portfolio analysis and Fama-MacBeth regressions for testing how conditional
conservatism affects the cost of equity through the information asymmetry and information precision effects Panel A
presents mean values of the information asymmetry measure IRisk and the measure for information precision of
negative earnings shocks ERisk in different CON-sorted portfolios with portfolio 1 (5) containing observations with the
smallest (largest) CON IRisk increases non-monotonically with CON revealing an asymmetric ldquoVrdquo pattern It falls
from 00303 in portfolio 1 to 00284 in portfolio 2 suggesting that conditional conservatism at lower levels serves to
reduce information asymmetry Then IRisk increases monotonically to 00350 in portfolio 5 implying that at higher
levels CON increases information asymmetry The mean difference of IRisk between portfolios 5 and 1 is 00047
statistically significant at the 1 confidence level Therefore CON is nonlinearly associated with information
asymmetry but on average a positive relation dominates suggesting that high conditional conservatism can in general
increase the cost of equity capital via enhancing information asymmetry as suggested by Gow et al (2011) and Lambert
et al (2012) The information precision of negative earnings shocks measure ERisk increases monotonically with CON
and the mean difference (t-statistic) between the top and bottom portfolios is 00567 (3895) suggesting that conditional
conservatism does increase the precision of information regarding negative earnings shocks Since earnings downside
risk induces a higher cost of equity (Luo et al 2014) this evidence suggests that conditional conservatism may increase
the cost of equity capital through enhancing the precision of negative earnings news
Panel B of Table 5 presents estimated results for the Fama-MacBeth regressions using model (10) with fixed industry
effects In all models the coefficients on conditional conservatism CON become much smaller than those in Panel B of
Table 3 where IRisk and ERisk are not controlled In particular the CON coefficients (t-statistics) drop to 00053 (213)
and 00049 (222) respectively after adding IRisk and ERisk as further controls compared with the figure of 00063
(277) in Panel B of Table 3 where only the three Fama-French factors are controlled for Importantly the CON
coefficient falls to 00041 when both IRisk and ERisk are controlled and it is only marginally significant with a
t-statistic of 168 Combined the findings indicate that information asymmetry and information precision of negative
earnings shocks partially account for the effect of conditional conservatism on the cost of equity and they subsume a
larger portion of loading on conditional conservatism when both are included in the regression model This evidence
lends support to the notion that the positive relation between conditional conservatism and the cost of equity operates
(at least partially) through the effects of information asymmetry and information precision of negative earnings shocks
Table 5 Conditional conservatism-sorted portfolio analysis and Fama-MacBeth regression of cash flow news adjusted
excess returns on conditional conservatism information asymmetry and information precision about negative earnings
shocks
Panel A Portfolio Analysis
Portfolio IRisk ERisk
1 00303 -00313
2 00284 -00109
3 00310 -00108
4 00341 -00063
5 00350 00254
(5-1) 00047 00567
t-statistic (2411) (3895)
Panel B Fama-MacBeth Regressions with Industry Dummies
Model CON Beta Size BM IRisk ERisk Avg Adj R-square
1 00053 00036 -00004 00022 01522 00545
(213) (129) (-065) (292) (413)
2 00049 00021 -00012 00025 00152 00555
(222) (080) (-273) (363) (510)
3 00041 00034 -00004 00024 01595 00145 00561
(168) (118) (-085) (301) (406) (432)
Applied Finance and Accounting Vol 2 No 1 2016
81
Description This table presents estimation results for testing the information asymmetry and information precision
effects on the conditional conservatism and cost of equity relation Panel A reports results from portfolio analyses for
information asymmetry proxy IRisk and earnings downside risk measure ERisk At the end of each month firm-month
observations are assigned into one of five portfolios based on a firmrsquos most recent CON known four months prior to the
current date Portfolio 1 (5) contains firms with the smallest (largest) CON Average differences in IRisk and ERisk
between the top and bottom portfolios are reported in row (5-1) The t-statistics for these differences are computed with
a Newey-West (1987) correction Panel B shows results for Fama-MacBeth regressions (model (10) of Section 4) of
future monthly cash flow news adjusted excess returns on CON IRisk ERisk and other firm characteristics (Beta Size
BM) The reported estimates are time-series averages of the coefficients on CON from 276 monthly cross-sectional
regressions Reported t-statistics are calculated from Newey and West (1987) standard errors of these monthly averages
46 SOX and the Relation between Conditional Conservatism and the Cost of Equity
Thus far we have examined how the effects of conditional conservatism on information asymmetry and precision of
negative earnings shocks affect its association with the cost of equity If these channels play a role then the passage of
SOX provides an ideal setting wherein their influences should change and thus induce alternation in the relation
between conditional conservatism and the cost of equity capital (Chang Fernando amp Liao 2009 Skaife Collins
Kinney amp LaFond 2009 Amir Guan amp Livne 2010) (Note 13) The SOX Act enacted in 2003 is a response to
allegations of accounting irregularities in Enron and other firms and it is intended in part to improve the overall
financial reporting quality of all public firms enhance information precision mitigate information asymmetry between
firms and investors and improve market efficiency Whereas several prior studies document increased conditional
conservatism in the post-SOX period (eg Lobo amp Zhou 2006) our design lends itself to further detecting potential
reductions in equity cost arising from reduced information asymmetry after SOX thus complementing prior findings
With regard to the information precision effect since SOX increases information transparency for all firms the
cross-sectional information precision effect of negative earnings shocks conveyed via conditional conservatism may be
weakened by the nationwide heightened information precision This connotes a reduced effect of conservatism on the
cost of equity in the post-SOX period ceteris paribus The SOX passage also decreases information asymmetry and
shrinks potential mispricing which further abates the potential information asymmetry effect of conditional
conservatism on the cost of equity Based on these arguments we expect a weakened association between conditional
conservatism and the cost of equity after the SOX enactment This serves to provide additional support for the
informational effects of conditional conservatism on increasing the cost of equity in the pre-SOX period
Figure 1 graphically presents the per-year average cash flow news adjusted excess returns to conditional
conservatism-sorted hedging portfolios A striking pattern is observed whereby hedging returns are consistently positive
for most years during the pre-SOX period from 1986 to 2002 The returns become negative from 2004 through 2008
the post-SOX period with generally smaller magnitudes and variability compared with the pre-SOX period The spike
in 2003 is consistent with enhanced revelations of bad news associated with the implementation of SOX
Figure 1 Mean differences in cash flow news adjusted excess return
for conditional conservatism-sorted hedging portfolios by year
To further examine the influence of SOX on the association between conditional conservatism and the cost of equity we
conduct firm-level Fama-MacBeth regressions of cash flow news adjusted excess returns on conditional conservatism
Applied Finance and Accounting Vol 2 No 1 2016
82
CON separately for the pre- and post-SOX periods We report results in Panels A and B of Table 6 To avoid possible
noises from transient market reactions to the SOX regulation we omit the years when SOX was passed (2002) and
implemented (2003) Panel A reveals that the positive relation between conditional conservatism and the cost of equity
is driven primarily by observations from the pre-SOX period In particular loadings on CON are positive and
significant in all regressions before the implementation of SOX Panel B indicates that CON coefficients are generally
negative andor insignificant in the post-SOX period consistent with Figure 1 In summary results in pre- and
post-SOX periods collectively corroborate the notion that the passage of SOX diminishes the information asymmetry
and information precision effects of conditional conservatism on the cross-section of stock returns resulting in a weak
relation between conditional conservatism and the cost of equity
Table 6 SOX and Fama-MacBeth regressions of cash flow news adjusted excess returns on conditional conservatism
and firm characteristics with industry dummies
Panel A Fama-MacBeth Regressions in the Pre-SOX Period before 2002 (198601-200112)
Model CON Beta Size BM Momentum TCA Acc Low_Priced IRisk ERisk Ave Adj R-square
1 00124 00334
(387)
2 00095 00032 -00011 00028 00505
(362) (110) (-180) (320)
3 00094 00023 -00013 00027 00030 00554
(363) (089) (-202) (317) (172)
4 00088 00035 -00012 00022 -00198 00515
(336) (119) (-182) (255) (-602)
5 00124 00032 -00020 00029 00230 -00154 00611
(506) (115) (-364) (351) (156) (-672)
6 00086 00046 -00002 00026 00816 00499
(293) (145) (-031) (275) (355)
7 00082 00028 -00011 00028 00207 00523
(324) (092) (-180) (314) (584)
8 00105 00061 -00013 00017 00004 -00207 00115 -00206 01434 00163 00684
(344) (218) (-194) (169) (020) (-480) (072) (-943) (547) (357)
Panel B Fama-MacBeth Regressions in the Post-SOX Period after 2003 (200401-200812)
Model CON Beta Size BM Momentum TCA Acc Low_Priced IRisk ERisk Ave Adj R-square
1 -00073 00449
(-131)
2 -00062 -00046 -00005 00011 00559
(-160) (-114) (-091) (096)
3 -00063 -00045 -00007 00012 -00009 00604
(-158) (-118) (-111) (105) (-031)
4 -00058 -00043 -00006 00011 -00012 00565
(-155) (-106) (-095) (099) (-028)
5 00046 -00025 -00022 00010 -00145 -00212 00599
(-119) (-063) (-435) (086) (-151) (-757)
6 -00068 -00043 00003 00007 03126 00595
(-171) (-109) (-057) (062) (233)
7 -00057 -00046 -00007 00010 -00002 00572
(-151) (-114) (-117) (083) (-004)
8 00027 -00014 -00004 00007 -00057 -00015 -00060 -00258 06457 00059 00714
(-071) (-038) (-073) (060) (-202) (-035) (-061) (-898) (436) (-089)
Description This table presents estimation results for Fama-MacBeth regressions of monthly cash flow news adjusted
excess returns on conditional conservatism (CON) total accruals (TCA) accrual quality (Acc) (along with a low-priced
return indicator variable Low_Priced) information asymmetry (IRisk) earnings downside risk (ERisk) and firm
characteristics including Beta Size and BM plus controls for dummies for Fama and French (1997) industries Panel A
reports average regression coefficients for the period of January 1986 to December 2001 a period before SOX Panel B
reports average coefficients for the period of January 2004 to December 2008 a period after SOX Reported t-statistics
are calculated from Newey and West (1987) standard errors of these monthly averages
Applied Finance and Accounting Vol 2 No 1 2016
83
5 Robustness Checks
51 Alternative Conditional Conservatism Measures
To check the robustness of our main findings we use several alternative measures for conditional conservatism We first
separately use CON_Skew CON_Acm and the ranking of CON with results qualitatively unchanged Then we use two
other conditional conservatism proxies Skew and CONA as introduced in Section 3 and also find qualitatively similar
results Nevertheless one may still be concerned about whether our results still hold when using the traditional
accounting-based conditional conservatism measures in Basu (1997) and doubt the validity of our findings To address
this issue we try the more classical measure based on the asymmetric persistence of net income in Basu (1997) We
have to make two extensions to the original measure in Basu (1997) to better fit in our research (i) to derive a pure
accounting-based conservatism measure we use total assets or sales as the deflator for net income instead of using stock
price and (ii) to avoid a potentially serious survival bias we estimate the model of net income changes or levels below
by quarterly data rather than annual data because at least 12 observations are needed to comparatively and accurately
estimate the model We use a rolling window of 16 quarterly observations to estimate models (11) and (12) below
∆NIit = β0 + β1DDit-1 + β2∆NIit-1 + β3DDit-1∆NIit-1 + εit+1 (11)
NIit = τ0 + τ1Dit-1 + τ2NIit-1 + τ3Dit-1NIit-1 + ϕit+1 (12)
where ∆NIit (NIit) refers to the ratio of quarterly net income changes (quarterly net income) to lagged corresponding
values in total assets ∆ROAit (ROAit) or the ratio of quarterly net income changes (quarterly net income) to lagged
corresponding values in sales ∆ROSit (ROSit) DDit-1 is the indicator for negative ∆NIit-1 while Dit-1 is the indicator for
negative NIit-1 We use the rankings of the estimated coefficients β3 or τ3 as the conditional conservatism measure
because using quarterly earnings data yields noisy coefficient estimations When ∆ROAit or ROAit is used the estimated
conditional conservatism measures from models (11) and (12) are denoted Basu_∆ROAit and Basu_ROAit respectively
When ∆ROSit or ROSit is used we denote the estimated conditional conservatism measures as Basu_∆ROSit and
Basu_ROSit respectively Table 7 reports the estimation results for our baseline Fama-MacBeth regression tests using
these alternative conservatism measures In all univariate and multivariate regressions Basu_∆ROAit Basu_∆ROSit
Basu_ROAit and Basu_ROSit are significantly positively associated with the cost of equity capital except for the last
model where Basu_ROSit is used in the multivariate regression Therefore our testing results are generally robust to the
classical accounting-based conditional conservatism measures based on the asymmetric earnings persistence
Table 7 Alternative conditional conservatism measures and Fama-MacBeth regression for the relation between
conditional conservatism and cash flow news adjusted excess returns
Model Basu_∆ROA Basu_∆ROS Basu_ROA Basu_ROS Beta Size BM Momentum TCA Acc Low_Priced Avg Adj R-square
1 00038
00378
(360)
2 00037
00037 -00022 00019 -00016 -00158 00127 -00153 00692
(399)
(161) (-515)
(300)
(-103) (-566)
(118) (-949)
3
00029
00372
(328)
4
00032
00037 -00022 00019 -00016 -00172 00153 -00152 00692
(388)
(161) (-504)
(293)
(-102) (-601)
(139) (-935)
5
00015
00376
(168)
6
00018
00038 -00022 00020 -00016 -00155 00157 -00152 00691
(213)
(166) (-507)
(322)
(-102) (-558)
(142) (-939)
7
00016
00373
(164)
8
00014 00038 -00022 00019 -00015 -00171 00160 -00150 00693
(150) (165) (-501)
(303)
(-099) (-592)
(144) (-925)
Description This table presents estimation results for univariate and multivariate Fama-MacBeth regressions (after
controlling for industry effect) of monthly cash flow news adjusted excess returns on alternative conditional
conservatism measures extending the measurement in Basu (1997) Construction of Basu-based conditional
Applied Finance and Accounting Vol 2 No 1 2016
84
conservatism measures are detailed in Section 5 Definitions of other variables are the same as in Tables 3 and
6 Reported t-statistics are calculated from Newey and West (1987) standard errors
52 Alternative Cost of Capital Measures
For alternative measures of the cost of equity we extend Botosan et al (2011) and use the analyst forecast error as an
approximation for cash flow news which is computed as the difference between the reported annual earnings per share
less its analyst forecast deflated by the stock price Using the newly constructed cost of equity measure we find that the
baseline results are similar to the reported
53 Alternative Measures for Information Precision and Information Asymmetry
We also use the following alternative measures for information asymmetry (i) the annual average of daily high and low
spread over the 12 months prior to the current fiscal year-end HLSpread calculated following Corwin and Schultz
(2011) and (ii) private information trading Itrade calculated following Llorente et al (2002) and Ferreira and Laux
(2007) These treatments do not qualitatively change the estimation results For alternative earnings downside risk
proxies that reflect the information precision effect we further adopt earnings volatility and the root lower partial
moment of ROA AERisk as substitute measures When these proxies are used results are consistent with those reported
in the main tests
54 Alternative Estimation Methods
In alternative asset pricing tests we used pooled OLS regressions instead of the Fama-MacBeth method We also follow
McInnis (2010) and drop all return-months in which a firm announces quarterly earnings to reduce the possibility that
improper adjustments for cash flow news may bias the results We further add the liquidity beta as a control for the
liquidity effect All these schemes deliver findings that are qualitatively similar to the reported Finally to address the
concern that the results for the post-SOX period are driven by the price plump and liquidity depletion during the 2007 to
2008 financial crisis we drop the years of 2007 and 2008 from our post-SOX sample period replicate Panel B of Table
6 and achieve qualitatively unchanged results
6 Conclusion
Prior studies examine the effect of conditional conservatism on the cost of equity mainly based on the theory that
improved information quality reduces covariance between a firmrsquos stock return and the market return thus decreasing
the cost of equity The empirical evidence however is mixed and not consistent In this study we propose that
improved information quality regarding bad earnings news as induced by conditional conservatism entails two
informational consequences more precise information about negative earnings shocks and heightened information
asymmetry both of which may generate economy-wide or market-wide effects and increase the cost of equity Using
accounting-based conditional conservatism measures and the cash flow news adjusted stock returns as the proxy for the
cost of equity we find a significantly positive relation between conditional conservatism and the cost of equity capital
and document evidence that such positive relation (at least partially) operates via the effects of information asymmetry
and information precision about negative earnings shocks We also find that the positive association between
conditional conservatism and the cost of equity disappears in the post-SOX period consistent with the mitigated
cross-sectional power of the information precision and information asymmetry effects of conditional conservatism
engendered by the nationwide improved information quality after SOX
This study supplements prior literature that documents an insignificant or negative relation between conditional
conservatism and the cost of equity Our findings also augment the SOX literature by documenting a diminution of the
influence of conditional conservatism in the direction of increasing the cost of capital after the implementation of SOX
and connote the importance of considering regulation-induced economy-wide effects Moreover the evidence holds
implications for ongoing deliberations regarding the costs and benefits of conservatism and further implies that
conditional conservatism imposes costs on both equity investors and managers thus pointing to a legitimate rationale
for managers to disfavor conditional conservatism which is largely neglected in the literature
Acknowledgements
We are grateful for the comments and advices from Pingyang Gao Chaoli Guo Tao Lin Yan Luo Xingrong Qiang
Tony Jun Ruan Jing Wang Yanyan Wang participants and discussants at the 2011 Canadian Academic Accounting
Association Annual Meetings the 2011 Asian Academic Accounting Association Annual Meetings and the 2011
International Symposium on Empirical Accounting Research We appreciate research assistance from Chen Chen and
Ariel Liao
References
Accounting Principles Board (1970) Statement No 4 Basic concepts and accounting principles underlying financial
statements of business enterprises Stamford CT Financial Accounting Standards Board [FASB]
Applied Finance and Accounting Vol 2 No 1 2016
85
Akins B Ng J amp Verdi R (2012) Investor competition over information and the pricing of information asymmetry
The Accounting Review 87(1) 35-58
Armstrong C Guay W amp Weber J (2010) The role of information and financial reporting in corporate governance
and debt contracting Journal of Accounting and Economics 50(2-3) 179-234
Armstrong C Core J Taylor D amp Verrecchia V (2011) When does information asymmetry affect the cost of
capital Journal of Accounting Research 49(1) 1-40
Amir E Guan Y amp Livne G (2010) Auditor independence and the cost of capital before and after Sarbanes-Oxley
The case of newly issued public debt European Accounting Review 19(4) 633-664
Ball R Jayaraman S amp Shivakumar L (2012) Mark-to-market accounting and information asymmetry in banks
Working paper University of Chicago
Basu S (1995) Conservatism and the asymmetric timeliness of earnings (Doctoral dissertation) University of
Rochester New York USA
Basu S (1997) The conservatism principle and the asymmetric timeliness of earnings Journal of Accounting and
Economics 24(1) 3-37
Botosan C Plumlee M amp Wen H (2011) The relation between expected returns realized returns and firm risk
characteristics Contemporary Accounting Research 28(4) 1085-1122
Callen J Segal D amp Hope O-K 2010 The pricing of conservative accounting and the measurement of conservatism
at the firm-year level Review of Accounting Studies 15(1) 145-178
Carhart M (1997) On the persistence of mutual fund performance Journal of Finance 52(1) 57-82
Caskey J amp Peterson K (2009) On the estimation of the asymmetric timeliness of earnings Inference and bias
corrections Working Paper University of California at Los Angeles
Chang H Fernando G amp Liao L (2009) Sarbanes-Oxley act perceived earnings quality and cost of capital Review
of Accounting and Finance 8(3) 216-231
Chen Q Hemmer T amp Zhang Y (2007) On the relation between conservatism in accounting standards and
incentives for earnings management Journal of Accounting Research 45(3) 541-565
Corwin S amp Schultz P (2011) A Simple way to estimate bid-ask spreads from daily high and low prices Journal of
Finance 67(2) 719ndash760
Crawley M (2012) Macroeconomic consequences of accounting The effect of accounting conservatism on
macroeconomic indicators and the money supply Working paper Indiana University
Demski J amp Feltham G (1994) Market response to financial reports Journal of Accounting and Economics 17(1-2)
3-40
Diamond D amp Verrecchia R (1991) Disclosure liquidity and the cost of capital Journal of Finance 46(4)
1325-1359
Easley D Hvidkjaer S amp OrsquoHara M (2002) Is information risk a determinant of asset returns Journal of Finance
57(5) 2185-2221
Easley D amp OrsquoHara M (2004) Information and the cost of capital Journal of Finance 59(4) 1553ndash1583
Fama E amp French K (1992) The cross-section of expected stock returns Journal of Finance 47(2) 427-465
Fama E amp French K (1993) Common risk factors in the returns on stocks and bonds Journal of Financial
Economics 33(1) 3-56
Fama E amp French K (1997) Industry cost of equity Journal of Financial Economics 43(2) 153-193
Fama E amp MacBeth J (1973) Risk return and equilibrium Empirical tests Journal of Political Economy 81(3)
607-636
Fan Q amp Zhang X (2012) Accounting conservatism aggregation and information quality Contemporary
Accounting Research 29(1) 38-56
Ferreira M amp Laux P (2007) Corporate governance idiosyncratic risk and information flow Journal of Finance
62(2) 951-989
Financial Accounting Standards Board (1980) Statement of financial accounting concepts No 2 Qualitative
characteristics of accounting information Stamford CT Financial Accounting Standards Board [FASB]
Applied Finance and Accounting Vol 2 No 1 2016
86
Francis J LaFond R Olsson P amp Schipper K (2004) Cost of equity and earnings attributes The Accounting
Review 79(4) 967-1010
Gao P (2011) A contracting approach to conservatism and earnings management Working paper University of
Chicago
Gao P amp Liang P (2011) Informational feedback effect adverse selection and the optimal disclosure policy Working
paper University of Chicago
Garcia Lara J Garcia Osma B amp Penalva F (2011) Conditional conservatism and cost of capital Review of
Accounting Studies 16(2) 247-271
Gigler F Kanodia C Sapra H amp Venugopalan R (2009) Accounting conservatism and the efficiency of debt
contracts Journal of Accounting Research 47(3) 767-97
Givoly D amp Hayn C (2000) The changing time-series properties of earnings cash flows and accruals Has financial
reporting become more conservative Journal of Accounting and Economics 29(3) 287-320
Gox R amp Wagenhofer A (2009) Optimal impairment rules Journal of Accounting and Economics 48(1) 2-16
Gow I Taylor D amp Verrecchia R (2011) Earnings precision information asymmetry and the cost of capital
Evidence of information complementarities Working paper Harvard University
Guay W amp Verrecchia R (2007) Conservative disclosure Working paper University of Pennsylvania
Hughes J Liu J amp Liu J (2007) Information asymmetry diversification and cost of capital The Accounting Review
82(3) 705-730
Jorgensen B Li J amp Sadkay G (2012) Earnings dispersion and aggregate stock returns Journal of Accounting and
Economics 53(1-2) 1-20
Johnstone D (In Press) The effect of information on uncertainty and the cost of capital Contemporaneous Accounting
Research
Khan M (2008) Are accruals mispriced Evidence from tests of an intertemporal capital asset pricing model Journal
of Accounting and Economics 45(1) 55-77
Khan M amp Watts R (2009) Estimation and empirical properties of a firm-year measure of accounting conservatism
Journal of Accounting and Economics 48(2-3) 131-150
Kim B amp Pevzner M (2010) Conditional accounting conservatism and future negative surprises An empirical
investigation Journal of Accounting Public Policy 29(4) 311-329
Kim D amp Qi Y (2010) Accruals quality stock returns and macroeconomic conditions The Accounting Review 85(3)
937ndash978
Kim O amp Verrecchia R (1991) Market reaction to anticipated announcements Journal of Financial Economics
30(2) 273-309
Kothari S Shu S amp Wysocki P (2009) Do managers withhold bad news Journal of Accounting Research 47(1)
241ndash276
LaFond R amp Roychowdhury S (2008) Managerial ownership and accounting conservatism Journal of Accounting
Research 46(1) 101-135
LaFond R amp Watts R (2008) The information role of conservatism The Accounting Review 83(2) 447-478
Lambert R Leuz C amp Verrecchia R (2007) Accounting information disclosure and the cost of capital Journal of
Accounting Research 45(2) 385-420
Lambert R Leuz C amp Verrecchia R (2012) Information asymmetry information precision and the cost of capital
Review of Finance 16(1) 1-29
Lewellen J Nagel S amp Shanken J (2010) A skeptical appraisal of asset pricing tests Journal of Financial
Economics 96(2) 175-194
Li X (2010) Accounting conservatism and cost of capital An international analysis Working paper Temple
University
Llorente G Michaely R Saar G amp Wang J (2002) Dynamic volume-return relation of individual stocks Review of
Financial Studies 15(4) 1005-1047
Lobo G amp Zhou J (2006) Did conservatism in financial reporting increase after the Sarbanes-Oxley Act Initial
evidence Accounting Horizons 20(1) 57-73
Applied Finance and Accounting Vol 2 No 1 2016
87
Louis H Lys T amp Sun A (2014) Conservatism and analyst earnings forecast bias Working paper Pennsylvania
State University
Luo Y Ma M amp Wu F (2014) Earnings downside risk Working paper Fudan University
McInnis J (2010) Earnings smoothness average returns and implied cost of equity capital The Accounting Review
85(1) 315-341
McNichols M amp Trueman B (1994) Public disclosures private information collection and short-term trading
Journal of Accounting and Economics 17(1-2) 69-94
Mensah Y Song X amp Ho S (2004) The effect of conservatism on analystsrsquo annual earnings forecast accuracy and
dispersion Journal of Accounting Auditing and Finance 19(2) 159-183
Nan L amp Wen X (2011) Conservatismrsquos effects on capital structure efficiency and information quality Working
paper University of Illinois at Chicago
Newey W amp West K (1987) A simple positive semi-definite heteroskedasticity and autocorrelation consistent
covariance matrix Econometrica 55(3) 703-708
Ogneva M (2012) Accrual quality realized returns and expected returns The importance of controlling for cash flow
shocks The Accounting Review 87(4) 1415-1444
Rogers J Skinner D amp Buskirk A (2009) Earnings guidance and market uncertainty Journal of Accounting and
Economics 48(1) 90-109
Ryan S (2006) Identifying conditional conservatism European Accounting Review 15(4) 511-525
Skaife H Collins D Kinney W amp LaFond R (2009) The effect of SOX internal control deficiencies on firm risk
and cost of equity Journal of Accounting Research 47(1) 1-43
Sloan R (1996) Do stock prices fully reflect information in accruals and cash flows about future earnings The
Accounting Review 71(3) 289-315
Srivastava T amp Sunder S (2011) Timely loss recognition and the early termination of unprofitable projects Working
paper Northwestern University
Verrecchia R (2001) Essays on disclosure Journal of Accounting and Economics 32(1-3) 97-180
Vuolteenaho T (2002) What drives firm-level stock returns Journal of Finance 57(1) 233-264
Watts R (2003) Conservatism in accounting Part I Explanations and implications Accounting Horizons 17(3)
207-221
Zhang J (2008) The contracting benefits of accounting conservatism to lenders and borrowers Journal of Accounting
and Economics 45(1) 27-54
Notes
Note 1 As guidance the Financial Accounting Standards Boardrsquos Statement of Financial Accounting Concepts No 2
(1980 para 95) intones that ldquoif two estimates of amounts to be received or paid in the future are about equally likely
conservatism dictates using the less optimistic estimaterdquo The Accounting Principles Board (Statement No 4 1970 para
171) observes that ldquomanagers investors and accountants have generally preferred that possible errors in measurement
be in the direction of understatement rather than overstatement of net income and net assets This has led to the
convention of conservatismrdquo
Note 2 In particular Caskey and Petersen (2009) argue that the Basu (1997) measure uses the ratio of slope coefficients
and thus may provide biased estimates because returns are impacted by expected future profits Other market-based
conditional conservatism measures such as the C-score in Khan and Watts (2009) also share a similar weakness
Note 3 Botosan et al (2011) and Ogneva (2012) argue that cash flow news does not cancel out in large samples and
therefore asset pricing tests may induce biases when future realized returns are used to proxy for expected returns
Note 4 Akins et al (2012) Armstrong et al (2011) and Gow et al (2011) also find that information asymmetry does
not affect the cost of equity incremental to market risk if firmsrsquo stocks are traded in highly liquid and competitive
markets
Note 5 Callen et al (2010) develop the CR ratio a market-based conservatism measure from the relation between
conditional conservatism and cash flow news
Note 6 Another measure for cash flow news is earnings forecast error (Botosan et al 2011 Ogneva 2012) which is
Applied Finance and Accounting Vol 2 No 1 2016
88
not used in our main tests since it introduces estimation bias However in robustness checks we use it as an alternative
proxy for cash flow news and obtain similar results
Note 7 We utilize accrual downside risk because it is the source of earnings downside risk and has better prediction
power for negative fundamental operational shocks (Luo et al 2014)
Note 8 Henceforth we use the term return or equity return to represent the excess returns adjusted for cash flow news
provided that no confusion arises
Note 9 TCAit = (ΔCAit - ΔCLit - ΔCashit + ΔSTDEBTit + ΔTPit - DPit)ATAit where ΔCAit is the one-year change in
current assets ΔCLit is the one-year change in current liabilities ΔCashit is the one-year change in cash ΔSTDEBTit is
the one-year change in current liabilities ΔTPit is the income tax payable DPit is the depreciation expense and ATAit is
the average total assets over t-1 t and t+1
Note 10 The accrual quality measure Acc is defined as the decile ranking of the ratio of the standard deviation of the
residual from the regression TCAit = αt + β0t ATAit + β1tOCFit-1 + β2tOCFit + β3tOCFit+1 + β4tΔREVit + β5tPPEit + εit
where TCAit is total current accruals for year t as defined above OCFit is operating cash flow for year t ΔREVit is the
one-year change in revenues and PPEit is the property plant and equipment for year t
Note 11 The mean (median) of total accruals TCA is 00099 (00080) which is higher than the documented negative
values in Sloan (1996) due to different sampling periods The sampling period in this study is from 1986 to 2008
whereas the period in Sloan (1996) is from 1962 to 1991 As we extend the sampling period back to 1962 the mean and
median of total accruals become negative in line with Sloanrsquos (1996) evidence
Note 12 Rigorously speaking model 1 in Panel B is not a univariate regression because it also includes industry
dummy variables We call it univariate for simplicity
Note 13 Chang et al (2009) report that SOX reduces the cost of equity capital in general by improving financial
reporting quality Skaife et al (2009) document that SOX reduces equity cost via mandatory disclosures of internal
control weaknesses Amir et al (2010) likewise argue that SOX enhances the negative relation between auditor
independence and the cost of debt capital proxied by bond ratings and yields
This work is licensed under a Creative Commons Attribution 30 License

Applied Finance and Accounting Vol 2 No 1 2016
77
presents Pearson and Spearman correlations among these variables in the upper and lower triangles respectively
Highlighted numbers are statistically significant at the 10 level Variable definitions are available in Sections 3 and 4
42 Hedging Portfolio Analysis Results
Table 2 reports the hedging portfolio results for the average excess returns adjusted for cash flow news and abnormal
returns represented by alphas as well as other measures that have influences on the expected stock returns or equity cost
We construct five CON-sorted portfolios rebalanced each month with portfolio 1 (5) representing observations with the
smallest (largest) CON The average cash flow news adjusted excess return (Ret) and three abnormal return measures
(CAPM alpha 3-factor alpha 4-factor alpha) all increase monotonically across CON portfolios with average mean
differences between the top and bottom portfolios as 00053 00044 00048 and 00056 respectively all statistically
significant at the 1 confidence level A similar pattern is observed for Mom In contrast total accrual (TCA) declines
monotonically with CON with an average of 00181 for portfolio 1 and 00005 for portfolio 5 The mean difference of
-00176 is statistically significant suggesting that CON is negatively correlated with TCA consistent with evidence in
Table 1 The pattern for accrual quality Acc although non-monotonic generally exhibits a positive relation with CON
where the mean difference between portfolios 1 and 5 is 00338 statistically significant at the 1 confidence level
Overall Table 2 provides evidence that a higher CON is associated with higher expected returns (alphas or cash flow
news adjusted excess returns) implying that larger conditional conservatism increases the cost of equity Moreover
CON is shown to be significantly correlated with return momentum total accruals and accrual quality indicating a
need to control for these variables in multivariate cross-sectional regressions
Table 2 Conditional conservatism-sorted portfolio analysis for average monthly cash flow news adjusted excess returns
alphas momentum total accruals and accrual quality
Portfolio Ret CAPM alpha 3-factor alpha 4-factor alpha Momentum TCA Acc
1 00074 00031 00015 00030 01354 00181 00431
2 00088 00044 00027 00041 01425 00132 00402
3 00096 00049 00035 00053 01511 00129 00455
4 00108 00058 00047 00062 0175 00093 00569
5 00127 00074 00063 00085 01772 00005 00769
(5-1) 00053 00044 00048 00056 00418 -00176 00338
t-statistic (396)
(370)
(463)
(487)
(560)
(-2368)
(4075)
Description The table compares cash flow news adjusted excess returns abnormal returns (alphas) momentum total
accruals and accrual quality across portfolios formed on conditional conservatism (CON) for a sample of 62833
observations of firms listed on the NYSE NASDAQ and AMEX with available CON measures over the period of
January 1986 to December 2008 At the end of each month firm-month observations are assigned into five portfolios
based on the firmrsquos most recent CON known four months prior to the current date Portfolio 1 (5) contains firms with
the smallest (largest) CON Average differences between the top and bottom portfolios are reported in the row (5-1) The
t-statistics for these differences are computed with a Newey and West (1987) correction Ret refers to return excluding
cash flow news and risk free rate CAPM alpha 3-factor alpha and 4-factor alpha refer to abnormal returns from
CAPM Fama-French three-factor model and Fama-French-Carhart four-factor model respectively TCA is total
accruals (Sloan 1996) and Acc is accrual quality (Kim amp Qi 2010)
43 Firm-Level Fama-MacBeth Regression Results
Table 3 presents results for the Fama-MacBeth cross-sectional regressions of monthly cash flow news adjusted excess
returns on CON and other firm risk characteristics including Beta Size BM Mom TCA and Acc Following Kim and
Qi (2010) we also include Low_Priced an indicator for low-priced shares along with Acc Panels A and B show results
without and with controls for Fama and French (1997) industry effects respectively
Consistent with results from the portfolio analysis cross-sectional regression loadings on CON are consistently positive
and significant with coefficients (t-statistics) of 00138 (354) and 00098 (332) in univariate regressions without and
with controlling for industry effects respectively (Note 12) After Beta Size and BM are added as further controls
CON coefficients remain significantly positive with corresponding coefficients (t-statistics) of 00091 (342) and
00063 (277) in Panels A and B respectively Moreover CONrsquos effect on the cost of equity is not subsumed by either
Mom TCA or Acc when they enter into the regressions individually or collectively suggesting that CON provides
incremental information beyond that from momentum total accruals and accrual quality Therefore results in Table 3
reconfirm that conditional conservatism is positively related to the cost of equity capital which cannot be captured by
standard risk factors and is not contributable to total accruals andor accrual quality effects The relation between
Applied Finance and Accounting Vol 2 No 1 2016
78
conditional conservatism and the cost of equity is also robust to industrial characteristics
Table 3 Fama-MacBeth regressions of monthly cash flow news adjusted excess returns on conditional conservatism
Panel A Regressions without Industry Dummies
Model CON Beta Size BM Momentum TCA Acc Low_Priced Avg Adj R-square
1 00138 00017
(354)
2 00091 00029 -00014 00022 00256
(342) (092) (-275) (246)
3 00088 00019 -00015 00022 00022 00325
(341) (068) (-301) (252) (124)
4 00085 00031 -00014 00017 -00171 00267
(324) (101) (-278) (197) (-588)
5 00115 00023 -00021 00026 00324 -00158 00345
(524) (077) (-485) (345) (245) (-846)
6 00107 00018 -00022 00023 00000 -00169 00295 -00158 00419
(494) (065) (-511) (297) (003) (-578) (238) (-930)
Panel B Regressions with Industry Dummies
Model CON Beta Size BM Momentum TCA Acc Low_Priced Avg Adj R-square
1 00098 00367
(332)
2 00063 00025 -00013 00025 00535
(277) (095) (-272) (365)
3 00061 00018 -00014 00026 00008 00587
(273) (074) (-297) (377) (048)
4 00059 00027 -00013 00021 -00151 00544
(259) (104) (-275) (307) (-575)
5 00106 00032 -00023 00025 00103 -00159 00626
(501) (126) (-535) (389) (096) (-890)
6 00099 00028 -00024 00023 -00013 -00156 00087 -00164 00682
(471) (119) (-560) (354) (-085) (-562) (085) (-1000)
Description This table presents estimation results for Fama-MacBeth regressions of monthly cash flow news adjusted
excess returns against conditional conservatism (CON) and other firm characteristics including Beta Size BM
Momentum TCA Acc and a low-priced return indicator variable Low_Priced for the period of January 1986 to
December 2008 The reported estimates are time-series averages of coefficients from 276 monthly cross-sectional
regressions The t-statistics are calculated from Newey and West (1987) standard errors of these monthly averages
Panel A reports results without controlling for Fama and French (1997) industry effect whereas Panel B reports results
after controlling for industry effect by adding dummies for the Fama-French industries Monthly cash flow news
adjusted excess return is calculated as the raw return less cash flow news and the risk free return proxied by US
one-month T-bill rate Beta is estimated following the procedure in Fama and French (1992) Size is the natural log of
market capitalization BM is the natural log of the ratio of book value of equity to market value of equity We match
Beta Size and BM measures with return data following Fama and French (1992) Momentum is an 11-month return in
the prior-year omitting the most recent month CON is the average of firm-year conditional conservatism measure
CON_Acm and CON_Skew TCA is total accruals (Sloan 1996) Acc is the accrual quality measure used in Kim and Qi
(2010) and Ogneva (2012) We match annual estimates of CON TCA and Acc with monthly stock returns in the next 12
months starting four months after the fiscal year-end The low-priced return indicator is set to 1 if returns are computed
using two adjacent prices less than $5 and 0 otherwise The main models used in Panels A and B are estimated using
model (5) described in Section 3
44 Portfolio-Level 2SCSR Results
To further confirm conditional conservatismrsquos impact on the cost of equity we conduct the 2SCSR analysis at the
portfolio-level which is less affected by firm-specific characters that may contaminate the underlying relation
considered Table 4 reports estimation results for models (6) to (9) Panel A presents the first-stage time-series
regressions of monthly portfolio excess stock returns adjusted for cash flow news on the CON factor (RCON) Fama and
French (1993) three factors (RM - RFt SMB and HML) and Carhart (1997) momentum factor (UMD) Factor loadings
Applied Finance and Accounting Vol 2 No 1 2016
79
on RCON are significantly positive with magnitudes (t-statistics) of 04725 (416) when the three Fama-French factors
are controlled and 03814 (341) when the momentum factor is further added
Panel B reports results for the second-stage cross-sectional regressions of mean cash flow news adjusted excess
portfolio returns on factor loadings estimated from the first stage The coefficients for the factor loadings on RCON
βRCON are significantly positive with magnitudes (t-statistics) of 00051 (342) and 00055 (349) when loadings on the
Fama and French (1993) three factors and Carhart (1997) four factors are controlled respectively The last column
indicates that when βRCON is included the average adjusted R2 jumps from 04170 to 07566 for the three-factor model
and from 04086 to 07530 for the four-factor model Therefore evidence from the 2SCSR analysis provides further
support for the enhancing effect of conditional conservatism on the cost of equity In the next section we explore the
proposed information precision and information asymmetry effects that contribute to the positive conditional
conservatism and cost of equity relation
Table 4 Portfolio-level two-stage cross-sectional regressions
Panel A First-stage Time-series Regressions of Portfolio Returns on Factor Returns
Model Intercept RM-RF SMB HML UMD RCON Adj R-square
1 00053 10925 08475 02868 07626
(454) (4225) (1183) (405)
2 00031 10292 07242 03330 04725 07857
(337) (3114) (1371) (492) (416)
3 00077 10457 08665 02272 -02305 07834
(638) (4116) (1196) (306) (-1126)
4 00056 10003 07647 02718 -02023 03814 08024
(674) (3052) (1438) (383) (-1170) (341)
Panel B Second-stage Cross-sectional Regressions of Portfolio Returns on Factor Loadings
Model Intercept βRM-RF βSMB βHML βUMD βRCON Adj R-square
1 00250 -00184 00061 00051 04170
(260) (-242) (221) (195)
2 00282 -00180 -00049 00091 00051 07566
(452) (-366) (182) (493) (342)
3 00263 -00214 00045 0007 -00090 04086
(268) (-253) (133) (198) (-061)
4 00275 -00159 -00044 00079 00050 00055 07530
(436) (-290) (-159) (345) (-051) (349)
Description This table shows results of Fama-French 25 portfolio-level two-stage cross-sectional regressions for a
sample over the 1986-2008 period Panel A reports average factor loadings and adjusted R2 of the first-stage time-series
regressions of monthly portfolio cash flow news adjusted excess returns against the three FamandashFrench factors a
momentum factor and a conservatism factor RCON using models (6) and (7) described in Section 3 We construct
RCON as the return on a zero-investment portfolio by buying the top 20 percent of firms and selling the bottom 20
percent of firms in terms of CON Panel B reports estimated coefficients for the second-stage cross-sectional regressions
of excess portfolio returns on portfolio factor loadings estimated from the first stage according to models (8) and (9) in
Section 3
45 Information Precision and Information Asymmetry Effects of Conditional Conservatism and Its Relation with the
Cost of Equity
We move on to investigate how conditional conservatism affects the cost of equity through its information precision
effect and information asymmetry effect We first employ a portfolio approach to examine how they mediate the relation
between conditional conservatism and the cost of equity Specifically we construct five CON-based portfolios and
check the levels of information asymmetry IRisk and information precision (about negative earnings shocks) ERisk in
each portfolio If high-CON portfolios on average have significantly higher IRisk andor ERisk then we can conclude
Applied Finance and Accounting Vol 2 No 1 2016
80
that conditional conservatism can generally elevate the information asymmetry andor information precision of negative
earnings shocks We then use the following Fama-MacBeth model and its simplified variations to investigate both
effects in multivariate regressions
Rit+1 - RFt+1 = α + β1CONit + β2Betait + β3Sizeit + β4BMit + β5IRiskit+ β6ERiskit (10)
+ sumIndustry_Dummies + μit+1
where Rit+1 RFt+1 Betait Sizeit and CONit are defined as in model (5) and Industry_Dummies represents the Fama and
French (1997) industry classifications If CON affects the cost of equity capital via information asymmetry andor
earnings downside risk then adding IRisk andor ERisk should weaken the relation as reflected in the magnitude and
significance level of the CON coefficient
Table 5 reports results from the portfolio analysis and Fama-MacBeth regressions for testing how conditional
conservatism affects the cost of equity through the information asymmetry and information precision effects Panel A
presents mean values of the information asymmetry measure IRisk and the measure for information precision of
negative earnings shocks ERisk in different CON-sorted portfolios with portfolio 1 (5) containing observations with the
smallest (largest) CON IRisk increases non-monotonically with CON revealing an asymmetric ldquoVrdquo pattern It falls
from 00303 in portfolio 1 to 00284 in portfolio 2 suggesting that conditional conservatism at lower levels serves to
reduce information asymmetry Then IRisk increases monotonically to 00350 in portfolio 5 implying that at higher
levels CON increases information asymmetry The mean difference of IRisk between portfolios 5 and 1 is 00047
statistically significant at the 1 confidence level Therefore CON is nonlinearly associated with information
asymmetry but on average a positive relation dominates suggesting that high conditional conservatism can in general
increase the cost of equity capital via enhancing information asymmetry as suggested by Gow et al (2011) and Lambert
et al (2012) The information precision of negative earnings shocks measure ERisk increases monotonically with CON
and the mean difference (t-statistic) between the top and bottom portfolios is 00567 (3895) suggesting that conditional
conservatism does increase the precision of information regarding negative earnings shocks Since earnings downside
risk induces a higher cost of equity (Luo et al 2014) this evidence suggests that conditional conservatism may increase
the cost of equity capital through enhancing the precision of negative earnings news
Panel B of Table 5 presents estimated results for the Fama-MacBeth regressions using model (10) with fixed industry
effects In all models the coefficients on conditional conservatism CON become much smaller than those in Panel B of
Table 3 where IRisk and ERisk are not controlled In particular the CON coefficients (t-statistics) drop to 00053 (213)
and 00049 (222) respectively after adding IRisk and ERisk as further controls compared with the figure of 00063
(277) in Panel B of Table 3 where only the three Fama-French factors are controlled for Importantly the CON
coefficient falls to 00041 when both IRisk and ERisk are controlled and it is only marginally significant with a
t-statistic of 168 Combined the findings indicate that information asymmetry and information precision of negative
earnings shocks partially account for the effect of conditional conservatism on the cost of equity and they subsume a
larger portion of loading on conditional conservatism when both are included in the regression model This evidence
lends support to the notion that the positive relation between conditional conservatism and the cost of equity operates
(at least partially) through the effects of information asymmetry and information precision of negative earnings shocks
Table 5 Conditional conservatism-sorted portfolio analysis and Fama-MacBeth regression of cash flow news adjusted
excess returns on conditional conservatism information asymmetry and information precision about negative earnings
shocks
Panel A Portfolio Analysis
Portfolio IRisk ERisk
1 00303 -00313
2 00284 -00109
3 00310 -00108
4 00341 -00063
5 00350 00254
(5-1) 00047 00567
t-statistic (2411) (3895)
Panel B Fama-MacBeth Regressions with Industry Dummies
Model CON Beta Size BM IRisk ERisk Avg Adj R-square
1 00053 00036 -00004 00022 01522 00545
(213) (129) (-065) (292) (413)
2 00049 00021 -00012 00025 00152 00555
(222) (080) (-273) (363) (510)
3 00041 00034 -00004 00024 01595 00145 00561
(168) (118) (-085) (301) (406) (432)
Applied Finance and Accounting Vol 2 No 1 2016
81
Description This table presents estimation results for testing the information asymmetry and information precision
effects on the conditional conservatism and cost of equity relation Panel A reports results from portfolio analyses for
information asymmetry proxy IRisk and earnings downside risk measure ERisk At the end of each month firm-month
observations are assigned into one of five portfolios based on a firmrsquos most recent CON known four months prior to the
current date Portfolio 1 (5) contains firms with the smallest (largest) CON Average differences in IRisk and ERisk
between the top and bottom portfolios are reported in row (5-1) The t-statistics for these differences are computed with
a Newey-West (1987) correction Panel B shows results for Fama-MacBeth regressions (model (10) of Section 4) of
future monthly cash flow news adjusted excess returns on CON IRisk ERisk and other firm characteristics (Beta Size
BM) The reported estimates are time-series averages of the coefficients on CON from 276 monthly cross-sectional
regressions Reported t-statistics are calculated from Newey and West (1987) standard errors of these monthly averages
46 SOX and the Relation between Conditional Conservatism and the Cost of Equity
Thus far we have examined how the effects of conditional conservatism on information asymmetry and precision of
negative earnings shocks affect its association with the cost of equity If these channels play a role then the passage of
SOX provides an ideal setting wherein their influences should change and thus induce alternation in the relation
between conditional conservatism and the cost of equity capital (Chang Fernando amp Liao 2009 Skaife Collins
Kinney amp LaFond 2009 Amir Guan amp Livne 2010) (Note 13) The SOX Act enacted in 2003 is a response to
allegations of accounting irregularities in Enron and other firms and it is intended in part to improve the overall
financial reporting quality of all public firms enhance information precision mitigate information asymmetry between
firms and investors and improve market efficiency Whereas several prior studies document increased conditional
conservatism in the post-SOX period (eg Lobo amp Zhou 2006) our design lends itself to further detecting potential
reductions in equity cost arising from reduced information asymmetry after SOX thus complementing prior findings
With regard to the information precision effect since SOX increases information transparency for all firms the
cross-sectional information precision effect of negative earnings shocks conveyed via conditional conservatism may be
weakened by the nationwide heightened information precision This connotes a reduced effect of conservatism on the
cost of equity in the post-SOX period ceteris paribus The SOX passage also decreases information asymmetry and
shrinks potential mispricing which further abates the potential information asymmetry effect of conditional
conservatism on the cost of equity Based on these arguments we expect a weakened association between conditional
conservatism and the cost of equity after the SOX enactment This serves to provide additional support for the
informational effects of conditional conservatism on increasing the cost of equity in the pre-SOX period
Figure 1 graphically presents the per-year average cash flow news adjusted excess returns to conditional
conservatism-sorted hedging portfolios A striking pattern is observed whereby hedging returns are consistently positive
for most years during the pre-SOX period from 1986 to 2002 The returns become negative from 2004 through 2008
the post-SOX period with generally smaller magnitudes and variability compared with the pre-SOX period The spike
in 2003 is consistent with enhanced revelations of bad news associated with the implementation of SOX
Figure 1 Mean differences in cash flow news adjusted excess return
for conditional conservatism-sorted hedging portfolios by year
To further examine the influence of SOX on the association between conditional conservatism and the cost of equity we
conduct firm-level Fama-MacBeth regressions of cash flow news adjusted excess returns on conditional conservatism
Applied Finance and Accounting Vol 2 No 1 2016
82
CON separately for the pre- and post-SOX periods We report results in Panels A and B of Table 6 To avoid possible
noises from transient market reactions to the SOX regulation we omit the years when SOX was passed (2002) and
implemented (2003) Panel A reveals that the positive relation between conditional conservatism and the cost of equity
is driven primarily by observations from the pre-SOX period In particular loadings on CON are positive and
significant in all regressions before the implementation of SOX Panel B indicates that CON coefficients are generally
negative andor insignificant in the post-SOX period consistent with Figure 1 In summary results in pre- and
post-SOX periods collectively corroborate the notion that the passage of SOX diminishes the information asymmetry
and information precision effects of conditional conservatism on the cross-section of stock returns resulting in a weak
relation between conditional conservatism and the cost of equity
Table 6 SOX and Fama-MacBeth regressions of cash flow news adjusted excess returns on conditional conservatism
and firm characteristics with industry dummies
Panel A Fama-MacBeth Regressions in the Pre-SOX Period before 2002 (198601-200112)
Model CON Beta Size BM Momentum TCA Acc Low_Priced IRisk ERisk Ave Adj R-square
1 00124 00334
(387)
2 00095 00032 -00011 00028 00505
(362) (110) (-180) (320)
3 00094 00023 -00013 00027 00030 00554
(363) (089) (-202) (317) (172)
4 00088 00035 -00012 00022 -00198 00515
(336) (119) (-182) (255) (-602)
5 00124 00032 -00020 00029 00230 -00154 00611
(506) (115) (-364) (351) (156) (-672)
6 00086 00046 -00002 00026 00816 00499
(293) (145) (-031) (275) (355)
7 00082 00028 -00011 00028 00207 00523
(324) (092) (-180) (314) (584)
8 00105 00061 -00013 00017 00004 -00207 00115 -00206 01434 00163 00684
(344) (218) (-194) (169) (020) (-480) (072) (-943) (547) (357)
Panel B Fama-MacBeth Regressions in the Post-SOX Period after 2003 (200401-200812)
Model CON Beta Size BM Momentum TCA Acc Low_Priced IRisk ERisk Ave Adj R-square
1 -00073 00449
(-131)
2 -00062 -00046 -00005 00011 00559
(-160) (-114) (-091) (096)
3 -00063 -00045 -00007 00012 -00009 00604
(-158) (-118) (-111) (105) (-031)
4 -00058 -00043 -00006 00011 -00012 00565
(-155) (-106) (-095) (099) (-028)
5 00046 -00025 -00022 00010 -00145 -00212 00599
(-119) (-063) (-435) (086) (-151) (-757)
6 -00068 -00043 00003 00007 03126 00595
(-171) (-109) (-057) (062) (233)
7 -00057 -00046 -00007 00010 -00002 00572
(-151) (-114) (-117) (083) (-004)
8 00027 -00014 -00004 00007 -00057 -00015 -00060 -00258 06457 00059 00714
(-071) (-038) (-073) (060) (-202) (-035) (-061) (-898) (436) (-089)
Description This table presents estimation results for Fama-MacBeth regressions of monthly cash flow news adjusted
excess returns on conditional conservatism (CON) total accruals (TCA) accrual quality (Acc) (along with a low-priced
return indicator variable Low_Priced) information asymmetry (IRisk) earnings downside risk (ERisk) and firm
characteristics including Beta Size and BM plus controls for dummies for Fama and French (1997) industries Panel A
reports average regression coefficients for the period of January 1986 to December 2001 a period before SOX Panel B
reports average coefficients for the period of January 2004 to December 2008 a period after SOX Reported t-statistics
are calculated from Newey and West (1987) standard errors of these monthly averages
Applied Finance and Accounting Vol 2 No 1 2016
83
5 Robustness Checks
51 Alternative Conditional Conservatism Measures
To check the robustness of our main findings we use several alternative measures for conditional conservatism We first
separately use CON_Skew CON_Acm and the ranking of CON with results qualitatively unchanged Then we use two
other conditional conservatism proxies Skew and CONA as introduced in Section 3 and also find qualitatively similar
results Nevertheless one may still be concerned about whether our results still hold when using the traditional
accounting-based conditional conservatism measures in Basu (1997) and doubt the validity of our findings To address
this issue we try the more classical measure based on the asymmetric persistence of net income in Basu (1997) We
have to make two extensions to the original measure in Basu (1997) to better fit in our research (i) to derive a pure
accounting-based conservatism measure we use total assets or sales as the deflator for net income instead of using stock
price and (ii) to avoid a potentially serious survival bias we estimate the model of net income changes or levels below
by quarterly data rather than annual data because at least 12 observations are needed to comparatively and accurately
estimate the model We use a rolling window of 16 quarterly observations to estimate models (11) and (12) below
∆NIit = β0 + β1DDit-1 + β2∆NIit-1 + β3DDit-1∆NIit-1 + εit+1 (11)
NIit = τ0 + τ1Dit-1 + τ2NIit-1 + τ3Dit-1NIit-1 + ϕit+1 (12)
where ∆NIit (NIit) refers to the ratio of quarterly net income changes (quarterly net income) to lagged corresponding
values in total assets ∆ROAit (ROAit) or the ratio of quarterly net income changes (quarterly net income) to lagged
corresponding values in sales ∆ROSit (ROSit) DDit-1 is the indicator for negative ∆NIit-1 while Dit-1 is the indicator for
negative NIit-1 We use the rankings of the estimated coefficients β3 or τ3 as the conditional conservatism measure
because using quarterly earnings data yields noisy coefficient estimations When ∆ROAit or ROAit is used the estimated
conditional conservatism measures from models (11) and (12) are denoted Basu_∆ROAit and Basu_ROAit respectively
When ∆ROSit or ROSit is used we denote the estimated conditional conservatism measures as Basu_∆ROSit and
Basu_ROSit respectively Table 7 reports the estimation results for our baseline Fama-MacBeth regression tests using
these alternative conservatism measures In all univariate and multivariate regressions Basu_∆ROAit Basu_∆ROSit
Basu_ROAit and Basu_ROSit are significantly positively associated with the cost of equity capital except for the last
model where Basu_ROSit is used in the multivariate regression Therefore our testing results are generally robust to the
classical accounting-based conditional conservatism measures based on the asymmetric earnings persistence
Table 7 Alternative conditional conservatism measures and Fama-MacBeth regression for the relation between
conditional conservatism and cash flow news adjusted excess returns
Model Basu_∆ROA Basu_∆ROS Basu_ROA Basu_ROS Beta Size BM Momentum TCA Acc Low_Priced Avg Adj R-square
1 00038
00378
(360)
2 00037
00037 -00022 00019 -00016 -00158 00127 -00153 00692
(399)
(161) (-515)
(300)
(-103) (-566)
(118) (-949)
3
00029
00372
(328)
4
00032
00037 -00022 00019 -00016 -00172 00153 -00152 00692
(388)
(161) (-504)
(293)
(-102) (-601)
(139) (-935)
5
00015
00376
(168)
6
00018
00038 -00022 00020 -00016 -00155 00157 -00152 00691
(213)
(166) (-507)
(322)
(-102) (-558)
(142) (-939)
7
00016
00373
(164)
8
00014 00038 -00022 00019 -00015 -00171 00160 -00150 00693
(150) (165) (-501)
(303)
(-099) (-592)
(144) (-925)
Description This table presents estimation results for univariate and multivariate Fama-MacBeth regressions (after
controlling for industry effect) of monthly cash flow news adjusted excess returns on alternative conditional
conservatism measures extending the measurement in Basu (1997) Construction of Basu-based conditional
Applied Finance and Accounting Vol 2 No 1 2016
84
conservatism measures are detailed in Section 5 Definitions of other variables are the same as in Tables 3 and
6 Reported t-statistics are calculated from Newey and West (1987) standard errors
52 Alternative Cost of Capital Measures
For alternative measures of the cost of equity we extend Botosan et al (2011) and use the analyst forecast error as an
approximation for cash flow news which is computed as the difference between the reported annual earnings per share
less its analyst forecast deflated by the stock price Using the newly constructed cost of equity measure we find that the
baseline results are similar to the reported
53 Alternative Measures for Information Precision and Information Asymmetry
We also use the following alternative measures for information asymmetry (i) the annual average of daily high and low
spread over the 12 months prior to the current fiscal year-end HLSpread calculated following Corwin and Schultz
(2011) and (ii) private information trading Itrade calculated following Llorente et al (2002) and Ferreira and Laux
(2007) These treatments do not qualitatively change the estimation results For alternative earnings downside risk
proxies that reflect the information precision effect we further adopt earnings volatility and the root lower partial
moment of ROA AERisk as substitute measures When these proxies are used results are consistent with those reported
in the main tests
54 Alternative Estimation Methods
In alternative asset pricing tests we used pooled OLS regressions instead of the Fama-MacBeth method We also follow
McInnis (2010) and drop all return-months in which a firm announces quarterly earnings to reduce the possibility that
improper adjustments for cash flow news may bias the results We further add the liquidity beta as a control for the
liquidity effect All these schemes deliver findings that are qualitatively similar to the reported Finally to address the
concern that the results for the post-SOX period are driven by the price plump and liquidity depletion during the 2007 to
2008 financial crisis we drop the years of 2007 and 2008 from our post-SOX sample period replicate Panel B of Table
6 and achieve qualitatively unchanged results
6 Conclusion
Prior studies examine the effect of conditional conservatism on the cost of equity mainly based on the theory that
improved information quality reduces covariance between a firmrsquos stock return and the market return thus decreasing
the cost of equity The empirical evidence however is mixed and not consistent In this study we propose that
improved information quality regarding bad earnings news as induced by conditional conservatism entails two
informational consequences more precise information about negative earnings shocks and heightened information
asymmetry both of which may generate economy-wide or market-wide effects and increase the cost of equity Using
accounting-based conditional conservatism measures and the cash flow news adjusted stock returns as the proxy for the
cost of equity we find a significantly positive relation between conditional conservatism and the cost of equity capital
and document evidence that such positive relation (at least partially) operates via the effects of information asymmetry
and information precision about negative earnings shocks We also find that the positive association between
conditional conservatism and the cost of equity disappears in the post-SOX period consistent with the mitigated
cross-sectional power of the information precision and information asymmetry effects of conditional conservatism
engendered by the nationwide improved information quality after SOX
This study supplements prior literature that documents an insignificant or negative relation between conditional
conservatism and the cost of equity Our findings also augment the SOX literature by documenting a diminution of the
influence of conditional conservatism in the direction of increasing the cost of capital after the implementation of SOX
and connote the importance of considering regulation-induced economy-wide effects Moreover the evidence holds
implications for ongoing deliberations regarding the costs and benefits of conservatism and further implies that
conditional conservatism imposes costs on both equity investors and managers thus pointing to a legitimate rationale
for managers to disfavor conditional conservatism which is largely neglected in the literature
Acknowledgements
We are grateful for the comments and advices from Pingyang Gao Chaoli Guo Tao Lin Yan Luo Xingrong Qiang
Tony Jun Ruan Jing Wang Yanyan Wang participants and discussants at the 2011 Canadian Academic Accounting
Association Annual Meetings the 2011 Asian Academic Accounting Association Annual Meetings and the 2011
International Symposium on Empirical Accounting Research We appreciate research assistance from Chen Chen and
Ariel Liao
References
Accounting Principles Board (1970) Statement No 4 Basic concepts and accounting principles underlying financial
statements of business enterprises Stamford CT Financial Accounting Standards Board [FASB]
Applied Finance and Accounting Vol 2 No 1 2016
85
Akins B Ng J amp Verdi R (2012) Investor competition over information and the pricing of information asymmetry
The Accounting Review 87(1) 35-58
Armstrong C Guay W amp Weber J (2010) The role of information and financial reporting in corporate governance
and debt contracting Journal of Accounting and Economics 50(2-3) 179-234
Armstrong C Core J Taylor D amp Verrecchia V (2011) When does information asymmetry affect the cost of
capital Journal of Accounting Research 49(1) 1-40
Amir E Guan Y amp Livne G (2010) Auditor independence and the cost of capital before and after Sarbanes-Oxley
The case of newly issued public debt European Accounting Review 19(4) 633-664
Ball R Jayaraman S amp Shivakumar L (2012) Mark-to-market accounting and information asymmetry in banks
Working paper University of Chicago
Basu S (1995) Conservatism and the asymmetric timeliness of earnings (Doctoral dissertation) University of
Rochester New York USA
Basu S (1997) The conservatism principle and the asymmetric timeliness of earnings Journal of Accounting and
Economics 24(1) 3-37
Botosan C Plumlee M amp Wen H (2011) The relation between expected returns realized returns and firm risk
characteristics Contemporary Accounting Research 28(4) 1085-1122
Callen J Segal D amp Hope O-K 2010 The pricing of conservative accounting and the measurement of conservatism
at the firm-year level Review of Accounting Studies 15(1) 145-178
Carhart M (1997) On the persistence of mutual fund performance Journal of Finance 52(1) 57-82
Caskey J amp Peterson K (2009) On the estimation of the asymmetric timeliness of earnings Inference and bias
corrections Working Paper University of California at Los Angeles
Chang H Fernando G amp Liao L (2009) Sarbanes-Oxley act perceived earnings quality and cost of capital Review
of Accounting and Finance 8(3) 216-231
Chen Q Hemmer T amp Zhang Y (2007) On the relation between conservatism in accounting standards and
incentives for earnings management Journal of Accounting Research 45(3) 541-565
Corwin S amp Schultz P (2011) A Simple way to estimate bid-ask spreads from daily high and low prices Journal of
Finance 67(2) 719ndash760
Crawley M (2012) Macroeconomic consequences of accounting The effect of accounting conservatism on
macroeconomic indicators and the money supply Working paper Indiana University
Demski J amp Feltham G (1994) Market response to financial reports Journal of Accounting and Economics 17(1-2)
3-40
Diamond D amp Verrecchia R (1991) Disclosure liquidity and the cost of capital Journal of Finance 46(4)
1325-1359
Easley D Hvidkjaer S amp OrsquoHara M (2002) Is information risk a determinant of asset returns Journal of Finance
57(5) 2185-2221
Easley D amp OrsquoHara M (2004) Information and the cost of capital Journal of Finance 59(4) 1553ndash1583
Fama E amp French K (1992) The cross-section of expected stock returns Journal of Finance 47(2) 427-465
Fama E amp French K (1993) Common risk factors in the returns on stocks and bonds Journal of Financial
Economics 33(1) 3-56
Fama E amp French K (1997) Industry cost of equity Journal of Financial Economics 43(2) 153-193
Fama E amp MacBeth J (1973) Risk return and equilibrium Empirical tests Journal of Political Economy 81(3)
607-636
Fan Q amp Zhang X (2012) Accounting conservatism aggregation and information quality Contemporary
Accounting Research 29(1) 38-56
Ferreira M amp Laux P (2007) Corporate governance idiosyncratic risk and information flow Journal of Finance
62(2) 951-989
Financial Accounting Standards Board (1980) Statement of financial accounting concepts No 2 Qualitative
characteristics of accounting information Stamford CT Financial Accounting Standards Board [FASB]
Applied Finance and Accounting Vol 2 No 1 2016
86
Francis J LaFond R Olsson P amp Schipper K (2004) Cost of equity and earnings attributes The Accounting
Review 79(4) 967-1010
Gao P (2011) A contracting approach to conservatism and earnings management Working paper University of
Chicago
Gao P amp Liang P (2011) Informational feedback effect adverse selection and the optimal disclosure policy Working
paper University of Chicago
Garcia Lara J Garcia Osma B amp Penalva F (2011) Conditional conservatism and cost of capital Review of
Accounting Studies 16(2) 247-271
Gigler F Kanodia C Sapra H amp Venugopalan R (2009) Accounting conservatism and the efficiency of debt
contracts Journal of Accounting Research 47(3) 767-97
Givoly D amp Hayn C (2000) The changing time-series properties of earnings cash flows and accruals Has financial
reporting become more conservative Journal of Accounting and Economics 29(3) 287-320
Gox R amp Wagenhofer A (2009) Optimal impairment rules Journal of Accounting and Economics 48(1) 2-16
Gow I Taylor D amp Verrecchia R (2011) Earnings precision information asymmetry and the cost of capital
Evidence of information complementarities Working paper Harvard University
Guay W amp Verrecchia R (2007) Conservative disclosure Working paper University of Pennsylvania
Hughes J Liu J amp Liu J (2007) Information asymmetry diversification and cost of capital The Accounting Review
82(3) 705-730
Jorgensen B Li J amp Sadkay G (2012) Earnings dispersion and aggregate stock returns Journal of Accounting and
Economics 53(1-2) 1-20
Johnstone D (In Press) The effect of information on uncertainty and the cost of capital Contemporaneous Accounting
Research
Khan M (2008) Are accruals mispriced Evidence from tests of an intertemporal capital asset pricing model Journal
of Accounting and Economics 45(1) 55-77
Khan M amp Watts R (2009) Estimation and empirical properties of a firm-year measure of accounting conservatism
Journal of Accounting and Economics 48(2-3) 131-150
Kim B amp Pevzner M (2010) Conditional accounting conservatism and future negative surprises An empirical
investigation Journal of Accounting Public Policy 29(4) 311-329
Kim D amp Qi Y (2010) Accruals quality stock returns and macroeconomic conditions The Accounting Review 85(3)
937ndash978
Kim O amp Verrecchia R (1991) Market reaction to anticipated announcements Journal of Financial Economics
30(2) 273-309
Kothari S Shu S amp Wysocki P (2009) Do managers withhold bad news Journal of Accounting Research 47(1)
241ndash276
LaFond R amp Roychowdhury S (2008) Managerial ownership and accounting conservatism Journal of Accounting
Research 46(1) 101-135
LaFond R amp Watts R (2008) The information role of conservatism The Accounting Review 83(2) 447-478
Lambert R Leuz C amp Verrecchia R (2007) Accounting information disclosure and the cost of capital Journal of
Accounting Research 45(2) 385-420
Lambert R Leuz C amp Verrecchia R (2012) Information asymmetry information precision and the cost of capital
Review of Finance 16(1) 1-29
Lewellen J Nagel S amp Shanken J (2010) A skeptical appraisal of asset pricing tests Journal of Financial
Economics 96(2) 175-194
Li X (2010) Accounting conservatism and cost of capital An international analysis Working paper Temple
University
Llorente G Michaely R Saar G amp Wang J (2002) Dynamic volume-return relation of individual stocks Review of
Financial Studies 15(4) 1005-1047
Lobo G amp Zhou J (2006) Did conservatism in financial reporting increase after the Sarbanes-Oxley Act Initial
evidence Accounting Horizons 20(1) 57-73
Applied Finance and Accounting Vol 2 No 1 2016
87
Louis H Lys T amp Sun A (2014) Conservatism and analyst earnings forecast bias Working paper Pennsylvania
State University
Luo Y Ma M amp Wu F (2014) Earnings downside risk Working paper Fudan University
McInnis J (2010) Earnings smoothness average returns and implied cost of equity capital The Accounting Review
85(1) 315-341
McNichols M amp Trueman B (1994) Public disclosures private information collection and short-term trading
Journal of Accounting and Economics 17(1-2) 69-94
Mensah Y Song X amp Ho S (2004) The effect of conservatism on analystsrsquo annual earnings forecast accuracy and
dispersion Journal of Accounting Auditing and Finance 19(2) 159-183
Nan L amp Wen X (2011) Conservatismrsquos effects on capital structure efficiency and information quality Working
paper University of Illinois at Chicago
Newey W amp West K (1987) A simple positive semi-definite heteroskedasticity and autocorrelation consistent
covariance matrix Econometrica 55(3) 703-708
Ogneva M (2012) Accrual quality realized returns and expected returns The importance of controlling for cash flow
shocks The Accounting Review 87(4) 1415-1444
Rogers J Skinner D amp Buskirk A (2009) Earnings guidance and market uncertainty Journal of Accounting and
Economics 48(1) 90-109
Ryan S (2006) Identifying conditional conservatism European Accounting Review 15(4) 511-525
Skaife H Collins D Kinney W amp LaFond R (2009) The effect of SOX internal control deficiencies on firm risk
and cost of equity Journal of Accounting Research 47(1) 1-43
Sloan R (1996) Do stock prices fully reflect information in accruals and cash flows about future earnings The
Accounting Review 71(3) 289-315
Srivastava T amp Sunder S (2011) Timely loss recognition and the early termination of unprofitable projects Working
paper Northwestern University
Verrecchia R (2001) Essays on disclosure Journal of Accounting and Economics 32(1-3) 97-180
Vuolteenaho T (2002) What drives firm-level stock returns Journal of Finance 57(1) 233-264
Watts R (2003) Conservatism in accounting Part I Explanations and implications Accounting Horizons 17(3)
207-221
Zhang J (2008) The contracting benefits of accounting conservatism to lenders and borrowers Journal of Accounting
and Economics 45(1) 27-54
Notes
Note 1 As guidance the Financial Accounting Standards Boardrsquos Statement of Financial Accounting Concepts No 2
(1980 para 95) intones that ldquoif two estimates of amounts to be received or paid in the future are about equally likely
conservatism dictates using the less optimistic estimaterdquo The Accounting Principles Board (Statement No 4 1970 para
171) observes that ldquomanagers investors and accountants have generally preferred that possible errors in measurement
be in the direction of understatement rather than overstatement of net income and net assets This has led to the
convention of conservatismrdquo
Note 2 In particular Caskey and Petersen (2009) argue that the Basu (1997) measure uses the ratio of slope coefficients
and thus may provide biased estimates because returns are impacted by expected future profits Other market-based
conditional conservatism measures such as the C-score in Khan and Watts (2009) also share a similar weakness
Note 3 Botosan et al (2011) and Ogneva (2012) argue that cash flow news does not cancel out in large samples and
therefore asset pricing tests may induce biases when future realized returns are used to proxy for expected returns
Note 4 Akins et al (2012) Armstrong et al (2011) and Gow et al (2011) also find that information asymmetry does
not affect the cost of equity incremental to market risk if firmsrsquo stocks are traded in highly liquid and competitive
markets
Note 5 Callen et al (2010) develop the CR ratio a market-based conservatism measure from the relation between
conditional conservatism and cash flow news
Note 6 Another measure for cash flow news is earnings forecast error (Botosan et al 2011 Ogneva 2012) which is
Applied Finance and Accounting Vol 2 No 1 2016
88
not used in our main tests since it introduces estimation bias However in robustness checks we use it as an alternative
proxy for cash flow news and obtain similar results
Note 7 We utilize accrual downside risk because it is the source of earnings downside risk and has better prediction
power for negative fundamental operational shocks (Luo et al 2014)
Note 8 Henceforth we use the term return or equity return to represent the excess returns adjusted for cash flow news
provided that no confusion arises
Note 9 TCAit = (ΔCAit - ΔCLit - ΔCashit + ΔSTDEBTit + ΔTPit - DPit)ATAit where ΔCAit is the one-year change in
current assets ΔCLit is the one-year change in current liabilities ΔCashit is the one-year change in cash ΔSTDEBTit is
the one-year change in current liabilities ΔTPit is the income tax payable DPit is the depreciation expense and ATAit is
the average total assets over t-1 t and t+1
Note 10 The accrual quality measure Acc is defined as the decile ranking of the ratio of the standard deviation of the
residual from the regression TCAit = αt + β0t ATAit + β1tOCFit-1 + β2tOCFit + β3tOCFit+1 + β4tΔREVit + β5tPPEit + εit
where TCAit is total current accruals for year t as defined above OCFit is operating cash flow for year t ΔREVit is the
one-year change in revenues and PPEit is the property plant and equipment for year t
Note 11 The mean (median) of total accruals TCA is 00099 (00080) which is higher than the documented negative
values in Sloan (1996) due to different sampling periods The sampling period in this study is from 1986 to 2008
whereas the period in Sloan (1996) is from 1962 to 1991 As we extend the sampling period back to 1962 the mean and
median of total accruals become negative in line with Sloanrsquos (1996) evidence
Note 12 Rigorously speaking model 1 in Panel B is not a univariate regression because it also includes industry
dummy variables We call it univariate for simplicity
Note 13 Chang et al (2009) report that SOX reduces the cost of equity capital in general by improving financial
reporting quality Skaife et al (2009) document that SOX reduces equity cost via mandatory disclosures of internal
control weaknesses Amir et al (2010) likewise argue that SOX enhances the negative relation between auditor
independence and the cost of debt capital proxied by bond ratings and yields
This work is licensed under a Creative Commons Attribution 30 License
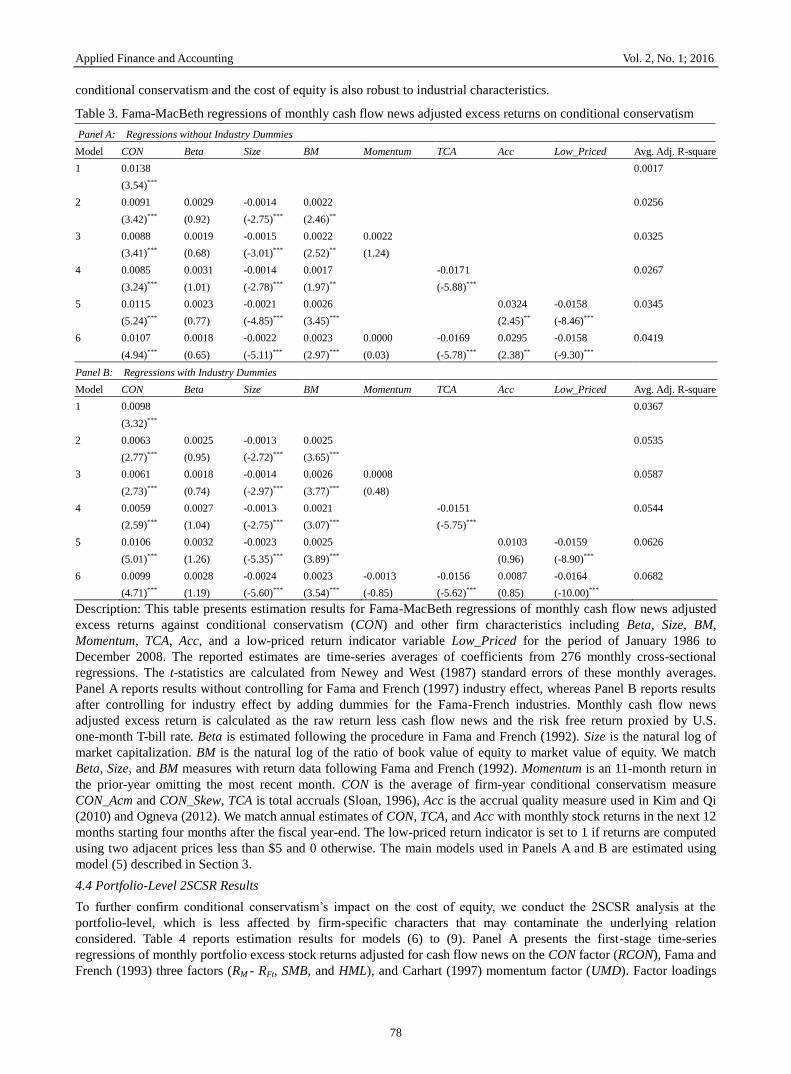
Applied Finance and Accounting Vol 2 No 1 2016
78
conditional conservatism and the cost of equity is also robust to industrial characteristics
Table 3 Fama-MacBeth regressions of monthly cash flow news adjusted excess returns on conditional conservatism
Panel A Regressions without Industry Dummies
Model CON Beta Size BM Momentum TCA Acc Low_Priced Avg Adj R-square
1 00138 00017
(354)
2 00091 00029 -00014 00022 00256
(342) (092) (-275) (246)
3 00088 00019 -00015 00022 00022 00325
(341) (068) (-301) (252) (124)
4 00085 00031 -00014 00017 -00171 00267
(324) (101) (-278) (197) (-588)
5 00115 00023 -00021 00026 00324 -00158 00345
(524) (077) (-485) (345) (245) (-846)
6 00107 00018 -00022 00023 00000 -00169 00295 -00158 00419
(494) (065) (-511) (297) (003) (-578) (238) (-930)
Panel B Regressions with Industry Dummies
Model CON Beta Size BM Momentum TCA Acc Low_Priced Avg Adj R-square
1 00098 00367
(332)
2 00063 00025 -00013 00025 00535
(277) (095) (-272) (365)
3 00061 00018 -00014 00026 00008 00587
(273) (074) (-297) (377) (048)
4 00059 00027 -00013 00021 -00151 00544
(259) (104) (-275) (307) (-575)
5 00106 00032 -00023 00025 00103 -00159 00626
(501) (126) (-535) (389) (096) (-890)
6 00099 00028 -00024 00023 -00013 -00156 00087 -00164 00682
(471) (119) (-560) (354) (-085) (-562) (085) (-1000)
Description This table presents estimation results for Fama-MacBeth regressions of monthly cash flow news adjusted
excess returns against conditional conservatism (CON) and other firm characteristics including Beta Size BM
Momentum TCA Acc and a low-priced return indicator variable Low_Priced for the period of January 1986 to
December 2008 The reported estimates are time-series averages of coefficients from 276 monthly cross-sectional
regressions The t-statistics are calculated from Newey and West (1987) standard errors of these monthly averages
Panel A reports results without controlling for Fama and French (1997) industry effect whereas Panel B reports results
after controlling for industry effect by adding dummies for the Fama-French industries Monthly cash flow news
adjusted excess return is calculated as the raw return less cash flow news and the risk free return proxied by US
one-month T-bill rate Beta is estimated following the procedure in Fama and French (1992) Size is the natural log of
market capitalization BM is the natural log of the ratio of book value of equity to market value of equity We match
Beta Size and BM measures with return data following Fama and French (1992) Momentum is an 11-month return in
the prior-year omitting the most recent month CON is the average of firm-year conditional conservatism measure
CON_Acm and CON_Skew TCA is total accruals (Sloan 1996) Acc is the accrual quality measure used in Kim and Qi
(2010) and Ogneva (2012) We match annual estimates of CON TCA and Acc with monthly stock returns in the next 12
months starting four months after the fiscal year-end The low-priced return indicator is set to 1 if returns are computed
using two adjacent prices less than $5 and 0 otherwise The main models used in Panels A and B are estimated using
model (5) described in Section 3
44 Portfolio-Level 2SCSR Results
To further confirm conditional conservatismrsquos impact on the cost of equity we conduct the 2SCSR analysis at the
portfolio-level which is less affected by firm-specific characters that may contaminate the underlying relation
considered Table 4 reports estimation results for models (6) to (9) Panel A presents the first-stage time-series
regressions of monthly portfolio excess stock returns adjusted for cash flow news on the CON factor (RCON) Fama and
French (1993) three factors (RM - RFt SMB and HML) and Carhart (1997) momentum factor (UMD) Factor loadings
Applied Finance and Accounting Vol 2 No 1 2016
79
on RCON are significantly positive with magnitudes (t-statistics) of 04725 (416) when the three Fama-French factors
are controlled and 03814 (341) when the momentum factor is further added
Panel B reports results for the second-stage cross-sectional regressions of mean cash flow news adjusted excess
portfolio returns on factor loadings estimated from the first stage The coefficients for the factor loadings on RCON
βRCON are significantly positive with magnitudes (t-statistics) of 00051 (342) and 00055 (349) when loadings on the
Fama and French (1993) three factors and Carhart (1997) four factors are controlled respectively The last column
indicates that when βRCON is included the average adjusted R2 jumps from 04170 to 07566 for the three-factor model
and from 04086 to 07530 for the four-factor model Therefore evidence from the 2SCSR analysis provides further
support for the enhancing effect of conditional conservatism on the cost of equity In the next section we explore the
proposed information precision and information asymmetry effects that contribute to the positive conditional
conservatism and cost of equity relation
Table 4 Portfolio-level two-stage cross-sectional regressions
Panel A First-stage Time-series Regressions of Portfolio Returns on Factor Returns
Model Intercept RM-RF SMB HML UMD RCON Adj R-square
1 00053 10925 08475 02868 07626
(454) (4225) (1183) (405)
2 00031 10292 07242 03330 04725 07857
(337) (3114) (1371) (492) (416)
3 00077 10457 08665 02272 -02305 07834
(638) (4116) (1196) (306) (-1126)
4 00056 10003 07647 02718 -02023 03814 08024
(674) (3052) (1438) (383) (-1170) (341)
Panel B Second-stage Cross-sectional Regressions of Portfolio Returns on Factor Loadings
Model Intercept βRM-RF βSMB βHML βUMD βRCON Adj R-square
1 00250 -00184 00061 00051 04170
(260) (-242) (221) (195)
2 00282 -00180 -00049 00091 00051 07566
(452) (-366) (182) (493) (342)
3 00263 -00214 00045 0007 -00090 04086
(268) (-253) (133) (198) (-061)
4 00275 -00159 -00044 00079 00050 00055 07530
(436) (-290) (-159) (345) (-051) (349)
Description This table shows results of Fama-French 25 portfolio-level two-stage cross-sectional regressions for a
sample over the 1986-2008 period Panel A reports average factor loadings and adjusted R2 of the first-stage time-series
regressions of monthly portfolio cash flow news adjusted excess returns against the three FamandashFrench factors a
momentum factor and a conservatism factor RCON using models (6) and (7) described in Section 3 We construct
RCON as the return on a zero-investment portfolio by buying the top 20 percent of firms and selling the bottom 20
percent of firms in terms of CON Panel B reports estimated coefficients for the second-stage cross-sectional regressions
of excess portfolio returns on portfolio factor loadings estimated from the first stage according to models (8) and (9) in
Section 3
45 Information Precision and Information Asymmetry Effects of Conditional Conservatism and Its Relation with the
Cost of Equity
We move on to investigate how conditional conservatism affects the cost of equity through its information precision
effect and information asymmetry effect We first employ a portfolio approach to examine how they mediate the relation
between conditional conservatism and the cost of equity Specifically we construct five CON-based portfolios and
check the levels of information asymmetry IRisk and information precision (about negative earnings shocks) ERisk in
each portfolio If high-CON portfolios on average have significantly higher IRisk andor ERisk then we can conclude
Applied Finance and Accounting Vol 2 No 1 2016
80
that conditional conservatism can generally elevate the information asymmetry andor information precision of negative
earnings shocks We then use the following Fama-MacBeth model and its simplified variations to investigate both
effects in multivariate regressions
Rit+1 - RFt+1 = α + β1CONit + β2Betait + β3Sizeit + β4BMit + β5IRiskit+ β6ERiskit (10)
+ sumIndustry_Dummies + μit+1
where Rit+1 RFt+1 Betait Sizeit and CONit are defined as in model (5) and Industry_Dummies represents the Fama and
French (1997) industry classifications If CON affects the cost of equity capital via information asymmetry andor
earnings downside risk then adding IRisk andor ERisk should weaken the relation as reflected in the magnitude and
significance level of the CON coefficient
Table 5 reports results from the portfolio analysis and Fama-MacBeth regressions for testing how conditional
conservatism affects the cost of equity through the information asymmetry and information precision effects Panel A
presents mean values of the information asymmetry measure IRisk and the measure for information precision of
negative earnings shocks ERisk in different CON-sorted portfolios with portfolio 1 (5) containing observations with the
smallest (largest) CON IRisk increases non-monotonically with CON revealing an asymmetric ldquoVrdquo pattern It falls
from 00303 in portfolio 1 to 00284 in portfolio 2 suggesting that conditional conservatism at lower levels serves to
reduce information asymmetry Then IRisk increases monotonically to 00350 in portfolio 5 implying that at higher
levels CON increases information asymmetry The mean difference of IRisk between portfolios 5 and 1 is 00047
statistically significant at the 1 confidence level Therefore CON is nonlinearly associated with information
asymmetry but on average a positive relation dominates suggesting that high conditional conservatism can in general
increase the cost of equity capital via enhancing information asymmetry as suggested by Gow et al (2011) and Lambert
et al (2012) The information precision of negative earnings shocks measure ERisk increases monotonically with CON
and the mean difference (t-statistic) between the top and bottom portfolios is 00567 (3895) suggesting that conditional
conservatism does increase the precision of information regarding negative earnings shocks Since earnings downside
risk induces a higher cost of equity (Luo et al 2014) this evidence suggests that conditional conservatism may increase
the cost of equity capital through enhancing the precision of negative earnings news
Panel B of Table 5 presents estimated results for the Fama-MacBeth regressions using model (10) with fixed industry
effects In all models the coefficients on conditional conservatism CON become much smaller than those in Panel B of
Table 3 where IRisk and ERisk are not controlled In particular the CON coefficients (t-statistics) drop to 00053 (213)
and 00049 (222) respectively after adding IRisk and ERisk as further controls compared with the figure of 00063
(277) in Panel B of Table 3 where only the three Fama-French factors are controlled for Importantly the CON
coefficient falls to 00041 when both IRisk and ERisk are controlled and it is only marginally significant with a
t-statistic of 168 Combined the findings indicate that information asymmetry and information precision of negative
earnings shocks partially account for the effect of conditional conservatism on the cost of equity and they subsume a
larger portion of loading on conditional conservatism when both are included in the regression model This evidence
lends support to the notion that the positive relation between conditional conservatism and the cost of equity operates
(at least partially) through the effects of information asymmetry and information precision of negative earnings shocks
Table 5 Conditional conservatism-sorted portfolio analysis and Fama-MacBeth regression of cash flow news adjusted
excess returns on conditional conservatism information asymmetry and information precision about negative earnings
shocks
Panel A Portfolio Analysis
Portfolio IRisk ERisk
1 00303 -00313
2 00284 -00109
3 00310 -00108
4 00341 -00063
5 00350 00254
(5-1) 00047 00567
t-statistic (2411) (3895)
Panel B Fama-MacBeth Regressions with Industry Dummies
Model CON Beta Size BM IRisk ERisk Avg Adj R-square
1 00053 00036 -00004 00022 01522 00545
(213) (129) (-065) (292) (413)
2 00049 00021 -00012 00025 00152 00555
(222) (080) (-273) (363) (510)
3 00041 00034 -00004 00024 01595 00145 00561
(168) (118) (-085) (301) (406) (432)
Applied Finance and Accounting Vol 2 No 1 2016
81
Description This table presents estimation results for testing the information asymmetry and information precision
effects on the conditional conservatism and cost of equity relation Panel A reports results from portfolio analyses for
information asymmetry proxy IRisk and earnings downside risk measure ERisk At the end of each month firm-month
observations are assigned into one of five portfolios based on a firmrsquos most recent CON known four months prior to the
current date Portfolio 1 (5) contains firms with the smallest (largest) CON Average differences in IRisk and ERisk
between the top and bottom portfolios are reported in row (5-1) The t-statistics for these differences are computed with
a Newey-West (1987) correction Panel B shows results for Fama-MacBeth regressions (model (10) of Section 4) of
future monthly cash flow news adjusted excess returns on CON IRisk ERisk and other firm characteristics (Beta Size
BM) The reported estimates are time-series averages of the coefficients on CON from 276 monthly cross-sectional
regressions Reported t-statistics are calculated from Newey and West (1987) standard errors of these monthly averages
46 SOX and the Relation between Conditional Conservatism and the Cost of Equity
Thus far we have examined how the effects of conditional conservatism on information asymmetry and precision of
negative earnings shocks affect its association with the cost of equity If these channels play a role then the passage of
SOX provides an ideal setting wherein their influences should change and thus induce alternation in the relation
between conditional conservatism and the cost of equity capital (Chang Fernando amp Liao 2009 Skaife Collins
Kinney amp LaFond 2009 Amir Guan amp Livne 2010) (Note 13) The SOX Act enacted in 2003 is a response to
allegations of accounting irregularities in Enron and other firms and it is intended in part to improve the overall
financial reporting quality of all public firms enhance information precision mitigate information asymmetry between
firms and investors and improve market efficiency Whereas several prior studies document increased conditional
conservatism in the post-SOX period (eg Lobo amp Zhou 2006) our design lends itself to further detecting potential
reductions in equity cost arising from reduced information asymmetry after SOX thus complementing prior findings
With regard to the information precision effect since SOX increases information transparency for all firms the
cross-sectional information precision effect of negative earnings shocks conveyed via conditional conservatism may be
weakened by the nationwide heightened information precision This connotes a reduced effect of conservatism on the
cost of equity in the post-SOX period ceteris paribus The SOX passage also decreases information asymmetry and
shrinks potential mispricing which further abates the potential information asymmetry effect of conditional
conservatism on the cost of equity Based on these arguments we expect a weakened association between conditional
conservatism and the cost of equity after the SOX enactment This serves to provide additional support for the
informational effects of conditional conservatism on increasing the cost of equity in the pre-SOX period
Figure 1 graphically presents the per-year average cash flow news adjusted excess returns to conditional
conservatism-sorted hedging portfolios A striking pattern is observed whereby hedging returns are consistently positive
for most years during the pre-SOX period from 1986 to 2002 The returns become negative from 2004 through 2008
the post-SOX period with generally smaller magnitudes and variability compared with the pre-SOX period The spike
in 2003 is consistent with enhanced revelations of bad news associated with the implementation of SOX
Figure 1 Mean differences in cash flow news adjusted excess return
for conditional conservatism-sorted hedging portfolios by year
To further examine the influence of SOX on the association between conditional conservatism and the cost of equity we
conduct firm-level Fama-MacBeth regressions of cash flow news adjusted excess returns on conditional conservatism
Applied Finance and Accounting Vol 2 No 1 2016
82
CON separately for the pre- and post-SOX periods We report results in Panels A and B of Table 6 To avoid possible
noises from transient market reactions to the SOX regulation we omit the years when SOX was passed (2002) and
implemented (2003) Panel A reveals that the positive relation between conditional conservatism and the cost of equity
is driven primarily by observations from the pre-SOX period In particular loadings on CON are positive and
significant in all regressions before the implementation of SOX Panel B indicates that CON coefficients are generally
negative andor insignificant in the post-SOX period consistent with Figure 1 In summary results in pre- and
post-SOX periods collectively corroborate the notion that the passage of SOX diminishes the information asymmetry
and information precision effects of conditional conservatism on the cross-section of stock returns resulting in a weak
relation between conditional conservatism and the cost of equity
Table 6 SOX and Fama-MacBeth regressions of cash flow news adjusted excess returns on conditional conservatism
and firm characteristics with industry dummies
Panel A Fama-MacBeth Regressions in the Pre-SOX Period before 2002 (198601-200112)
Model CON Beta Size BM Momentum TCA Acc Low_Priced IRisk ERisk Ave Adj R-square
1 00124 00334
(387)
2 00095 00032 -00011 00028 00505
(362) (110) (-180) (320)
3 00094 00023 -00013 00027 00030 00554
(363) (089) (-202) (317) (172)
4 00088 00035 -00012 00022 -00198 00515
(336) (119) (-182) (255) (-602)
5 00124 00032 -00020 00029 00230 -00154 00611
(506) (115) (-364) (351) (156) (-672)
6 00086 00046 -00002 00026 00816 00499
(293) (145) (-031) (275) (355)
7 00082 00028 -00011 00028 00207 00523
(324) (092) (-180) (314) (584)
8 00105 00061 -00013 00017 00004 -00207 00115 -00206 01434 00163 00684
(344) (218) (-194) (169) (020) (-480) (072) (-943) (547) (357)
Panel B Fama-MacBeth Regressions in the Post-SOX Period after 2003 (200401-200812)
Model CON Beta Size BM Momentum TCA Acc Low_Priced IRisk ERisk Ave Adj R-square
1 -00073 00449
(-131)
2 -00062 -00046 -00005 00011 00559
(-160) (-114) (-091) (096)
3 -00063 -00045 -00007 00012 -00009 00604
(-158) (-118) (-111) (105) (-031)
4 -00058 -00043 -00006 00011 -00012 00565
(-155) (-106) (-095) (099) (-028)
5 00046 -00025 -00022 00010 -00145 -00212 00599
(-119) (-063) (-435) (086) (-151) (-757)
6 -00068 -00043 00003 00007 03126 00595
(-171) (-109) (-057) (062) (233)
7 -00057 -00046 -00007 00010 -00002 00572
(-151) (-114) (-117) (083) (-004)
8 00027 -00014 -00004 00007 -00057 -00015 -00060 -00258 06457 00059 00714
(-071) (-038) (-073) (060) (-202) (-035) (-061) (-898) (436) (-089)
Description This table presents estimation results for Fama-MacBeth regressions of monthly cash flow news adjusted
excess returns on conditional conservatism (CON) total accruals (TCA) accrual quality (Acc) (along with a low-priced
return indicator variable Low_Priced) information asymmetry (IRisk) earnings downside risk (ERisk) and firm
characteristics including Beta Size and BM plus controls for dummies for Fama and French (1997) industries Panel A
reports average regression coefficients for the period of January 1986 to December 2001 a period before SOX Panel B
reports average coefficients for the period of January 2004 to December 2008 a period after SOX Reported t-statistics
are calculated from Newey and West (1987) standard errors of these monthly averages
Applied Finance and Accounting Vol 2 No 1 2016
83
5 Robustness Checks
51 Alternative Conditional Conservatism Measures
To check the robustness of our main findings we use several alternative measures for conditional conservatism We first
separately use CON_Skew CON_Acm and the ranking of CON with results qualitatively unchanged Then we use two
other conditional conservatism proxies Skew and CONA as introduced in Section 3 and also find qualitatively similar
results Nevertheless one may still be concerned about whether our results still hold when using the traditional
accounting-based conditional conservatism measures in Basu (1997) and doubt the validity of our findings To address
this issue we try the more classical measure based on the asymmetric persistence of net income in Basu (1997) We
have to make two extensions to the original measure in Basu (1997) to better fit in our research (i) to derive a pure
accounting-based conservatism measure we use total assets or sales as the deflator for net income instead of using stock
price and (ii) to avoid a potentially serious survival bias we estimate the model of net income changes or levels below
by quarterly data rather than annual data because at least 12 observations are needed to comparatively and accurately
estimate the model We use a rolling window of 16 quarterly observations to estimate models (11) and (12) below
∆NIit = β0 + β1DDit-1 + β2∆NIit-1 + β3DDit-1∆NIit-1 + εit+1 (11)
NIit = τ0 + τ1Dit-1 + τ2NIit-1 + τ3Dit-1NIit-1 + ϕit+1 (12)
where ∆NIit (NIit) refers to the ratio of quarterly net income changes (quarterly net income) to lagged corresponding
values in total assets ∆ROAit (ROAit) or the ratio of quarterly net income changes (quarterly net income) to lagged
corresponding values in sales ∆ROSit (ROSit) DDit-1 is the indicator for negative ∆NIit-1 while Dit-1 is the indicator for
negative NIit-1 We use the rankings of the estimated coefficients β3 or τ3 as the conditional conservatism measure
because using quarterly earnings data yields noisy coefficient estimations When ∆ROAit or ROAit is used the estimated
conditional conservatism measures from models (11) and (12) are denoted Basu_∆ROAit and Basu_ROAit respectively
When ∆ROSit or ROSit is used we denote the estimated conditional conservatism measures as Basu_∆ROSit and
Basu_ROSit respectively Table 7 reports the estimation results for our baseline Fama-MacBeth regression tests using
these alternative conservatism measures In all univariate and multivariate regressions Basu_∆ROAit Basu_∆ROSit
Basu_ROAit and Basu_ROSit are significantly positively associated with the cost of equity capital except for the last
model where Basu_ROSit is used in the multivariate regression Therefore our testing results are generally robust to the
classical accounting-based conditional conservatism measures based on the asymmetric earnings persistence
Table 7 Alternative conditional conservatism measures and Fama-MacBeth regression for the relation between
conditional conservatism and cash flow news adjusted excess returns
Model Basu_∆ROA Basu_∆ROS Basu_ROA Basu_ROS Beta Size BM Momentum TCA Acc Low_Priced Avg Adj R-square
1 00038
00378
(360)
2 00037
00037 -00022 00019 -00016 -00158 00127 -00153 00692
(399)
(161) (-515)
(300)
(-103) (-566)
(118) (-949)
3
00029
00372
(328)
4
00032
00037 -00022 00019 -00016 -00172 00153 -00152 00692
(388)
(161) (-504)
(293)
(-102) (-601)
(139) (-935)
5
00015
00376
(168)
6
00018
00038 -00022 00020 -00016 -00155 00157 -00152 00691
(213)
(166) (-507)
(322)
(-102) (-558)
(142) (-939)
7
00016
00373
(164)
8
00014 00038 -00022 00019 -00015 -00171 00160 -00150 00693
(150) (165) (-501)
(303)
(-099) (-592)
(144) (-925)
Description This table presents estimation results for univariate and multivariate Fama-MacBeth regressions (after
controlling for industry effect) of monthly cash flow news adjusted excess returns on alternative conditional
conservatism measures extending the measurement in Basu (1997) Construction of Basu-based conditional
Applied Finance and Accounting Vol 2 No 1 2016
84
conservatism measures are detailed in Section 5 Definitions of other variables are the same as in Tables 3 and
6 Reported t-statistics are calculated from Newey and West (1987) standard errors
52 Alternative Cost of Capital Measures
For alternative measures of the cost of equity we extend Botosan et al (2011) and use the analyst forecast error as an
approximation for cash flow news which is computed as the difference between the reported annual earnings per share
less its analyst forecast deflated by the stock price Using the newly constructed cost of equity measure we find that the
baseline results are similar to the reported
53 Alternative Measures for Information Precision and Information Asymmetry
We also use the following alternative measures for information asymmetry (i) the annual average of daily high and low
spread over the 12 months prior to the current fiscal year-end HLSpread calculated following Corwin and Schultz
(2011) and (ii) private information trading Itrade calculated following Llorente et al (2002) and Ferreira and Laux
(2007) These treatments do not qualitatively change the estimation results For alternative earnings downside risk
proxies that reflect the information precision effect we further adopt earnings volatility and the root lower partial
moment of ROA AERisk as substitute measures When these proxies are used results are consistent with those reported
in the main tests
54 Alternative Estimation Methods
In alternative asset pricing tests we used pooled OLS regressions instead of the Fama-MacBeth method We also follow
McInnis (2010) and drop all return-months in which a firm announces quarterly earnings to reduce the possibility that
improper adjustments for cash flow news may bias the results We further add the liquidity beta as a control for the
liquidity effect All these schemes deliver findings that are qualitatively similar to the reported Finally to address the
concern that the results for the post-SOX period are driven by the price plump and liquidity depletion during the 2007 to
2008 financial crisis we drop the years of 2007 and 2008 from our post-SOX sample period replicate Panel B of Table
6 and achieve qualitatively unchanged results
6 Conclusion
Prior studies examine the effect of conditional conservatism on the cost of equity mainly based on the theory that
improved information quality reduces covariance between a firmrsquos stock return and the market return thus decreasing
the cost of equity The empirical evidence however is mixed and not consistent In this study we propose that
improved information quality regarding bad earnings news as induced by conditional conservatism entails two
informational consequences more precise information about negative earnings shocks and heightened information
asymmetry both of which may generate economy-wide or market-wide effects and increase the cost of equity Using
accounting-based conditional conservatism measures and the cash flow news adjusted stock returns as the proxy for the
cost of equity we find a significantly positive relation between conditional conservatism and the cost of equity capital
and document evidence that such positive relation (at least partially) operates via the effects of information asymmetry
and information precision about negative earnings shocks We also find that the positive association between
conditional conservatism and the cost of equity disappears in the post-SOX period consistent with the mitigated
cross-sectional power of the information precision and information asymmetry effects of conditional conservatism
engendered by the nationwide improved information quality after SOX
This study supplements prior literature that documents an insignificant or negative relation between conditional
conservatism and the cost of equity Our findings also augment the SOX literature by documenting a diminution of the
influence of conditional conservatism in the direction of increasing the cost of capital after the implementation of SOX
and connote the importance of considering regulation-induced economy-wide effects Moreover the evidence holds
implications for ongoing deliberations regarding the costs and benefits of conservatism and further implies that
conditional conservatism imposes costs on both equity investors and managers thus pointing to a legitimate rationale
for managers to disfavor conditional conservatism which is largely neglected in the literature
Acknowledgements
We are grateful for the comments and advices from Pingyang Gao Chaoli Guo Tao Lin Yan Luo Xingrong Qiang
Tony Jun Ruan Jing Wang Yanyan Wang participants and discussants at the 2011 Canadian Academic Accounting
Association Annual Meetings the 2011 Asian Academic Accounting Association Annual Meetings and the 2011
International Symposium on Empirical Accounting Research We appreciate research assistance from Chen Chen and
Ariel Liao
References
Accounting Principles Board (1970) Statement No 4 Basic concepts and accounting principles underlying financial
statements of business enterprises Stamford CT Financial Accounting Standards Board [FASB]
Applied Finance and Accounting Vol 2 No 1 2016
85
Akins B Ng J amp Verdi R (2012) Investor competition over information and the pricing of information asymmetry
The Accounting Review 87(1) 35-58
Armstrong C Guay W amp Weber J (2010) The role of information and financial reporting in corporate governance
and debt contracting Journal of Accounting and Economics 50(2-3) 179-234
Armstrong C Core J Taylor D amp Verrecchia V (2011) When does information asymmetry affect the cost of
capital Journal of Accounting Research 49(1) 1-40
Amir E Guan Y amp Livne G (2010) Auditor independence and the cost of capital before and after Sarbanes-Oxley
The case of newly issued public debt European Accounting Review 19(4) 633-664
Ball R Jayaraman S amp Shivakumar L (2012) Mark-to-market accounting and information asymmetry in banks
Working paper University of Chicago
Basu S (1995) Conservatism and the asymmetric timeliness of earnings (Doctoral dissertation) University of
Rochester New York USA
Basu S (1997) The conservatism principle and the asymmetric timeliness of earnings Journal of Accounting and
Economics 24(1) 3-37
Botosan C Plumlee M amp Wen H (2011) The relation between expected returns realized returns and firm risk
characteristics Contemporary Accounting Research 28(4) 1085-1122
Callen J Segal D amp Hope O-K 2010 The pricing of conservative accounting and the measurement of conservatism
at the firm-year level Review of Accounting Studies 15(1) 145-178
Carhart M (1997) On the persistence of mutual fund performance Journal of Finance 52(1) 57-82
Caskey J amp Peterson K (2009) On the estimation of the asymmetric timeliness of earnings Inference and bias
corrections Working Paper University of California at Los Angeles
Chang H Fernando G amp Liao L (2009) Sarbanes-Oxley act perceived earnings quality and cost of capital Review
of Accounting and Finance 8(3) 216-231
Chen Q Hemmer T amp Zhang Y (2007) On the relation between conservatism in accounting standards and
incentives for earnings management Journal of Accounting Research 45(3) 541-565
Corwin S amp Schultz P (2011) A Simple way to estimate bid-ask spreads from daily high and low prices Journal of
Finance 67(2) 719ndash760
Crawley M (2012) Macroeconomic consequences of accounting The effect of accounting conservatism on
macroeconomic indicators and the money supply Working paper Indiana University
Demski J amp Feltham G (1994) Market response to financial reports Journal of Accounting and Economics 17(1-2)
3-40
Diamond D amp Verrecchia R (1991) Disclosure liquidity and the cost of capital Journal of Finance 46(4)
1325-1359
Easley D Hvidkjaer S amp OrsquoHara M (2002) Is information risk a determinant of asset returns Journal of Finance
57(5) 2185-2221
Easley D amp OrsquoHara M (2004) Information and the cost of capital Journal of Finance 59(4) 1553ndash1583
Fama E amp French K (1992) The cross-section of expected stock returns Journal of Finance 47(2) 427-465
Fama E amp French K (1993) Common risk factors in the returns on stocks and bonds Journal of Financial
Economics 33(1) 3-56
Fama E amp French K (1997) Industry cost of equity Journal of Financial Economics 43(2) 153-193
Fama E amp MacBeth J (1973) Risk return and equilibrium Empirical tests Journal of Political Economy 81(3)
607-636
Fan Q amp Zhang X (2012) Accounting conservatism aggregation and information quality Contemporary
Accounting Research 29(1) 38-56
Ferreira M amp Laux P (2007) Corporate governance idiosyncratic risk and information flow Journal of Finance
62(2) 951-989
Financial Accounting Standards Board (1980) Statement of financial accounting concepts No 2 Qualitative
characteristics of accounting information Stamford CT Financial Accounting Standards Board [FASB]
Applied Finance and Accounting Vol 2 No 1 2016
86
Francis J LaFond R Olsson P amp Schipper K (2004) Cost of equity and earnings attributes The Accounting
Review 79(4) 967-1010
Gao P (2011) A contracting approach to conservatism and earnings management Working paper University of
Chicago
Gao P amp Liang P (2011) Informational feedback effect adverse selection and the optimal disclosure policy Working
paper University of Chicago
Garcia Lara J Garcia Osma B amp Penalva F (2011) Conditional conservatism and cost of capital Review of
Accounting Studies 16(2) 247-271
Gigler F Kanodia C Sapra H amp Venugopalan R (2009) Accounting conservatism and the efficiency of debt
contracts Journal of Accounting Research 47(3) 767-97
Givoly D amp Hayn C (2000) The changing time-series properties of earnings cash flows and accruals Has financial
reporting become more conservative Journal of Accounting and Economics 29(3) 287-320
Gox R amp Wagenhofer A (2009) Optimal impairment rules Journal of Accounting and Economics 48(1) 2-16
Gow I Taylor D amp Verrecchia R (2011) Earnings precision information asymmetry and the cost of capital
Evidence of information complementarities Working paper Harvard University
Guay W amp Verrecchia R (2007) Conservative disclosure Working paper University of Pennsylvania
Hughes J Liu J amp Liu J (2007) Information asymmetry diversification and cost of capital The Accounting Review
82(3) 705-730
Jorgensen B Li J amp Sadkay G (2012) Earnings dispersion and aggregate stock returns Journal of Accounting and
Economics 53(1-2) 1-20
Johnstone D (In Press) The effect of information on uncertainty and the cost of capital Contemporaneous Accounting
Research
Khan M (2008) Are accruals mispriced Evidence from tests of an intertemporal capital asset pricing model Journal
of Accounting and Economics 45(1) 55-77
Khan M amp Watts R (2009) Estimation and empirical properties of a firm-year measure of accounting conservatism
Journal of Accounting and Economics 48(2-3) 131-150
Kim B amp Pevzner M (2010) Conditional accounting conservatism and future negative surprises An empirical
investigation Journal of Accounting Public Policy 29(4) 311-329
Kim D amp Qi Y (2010) Accruals quality stock returns and macroeconomic conditions The Accounting Review 85(3)
937ndash978
Kim O amp Verrecchia R (1991) Market reaction to anticipated announcements Journal of Financial Economics
30(2) 273-309
Kothari S Shu S amp Wysocki P (2009) Do managers withhold bad news Journal of Accounting Research 47(1)
241ndash276
LaFond R amp Roychowdhury S (2008) Managerial ownership and accounting conservatism Journal of Accounting
Research 46(1) 101-135
LaFond R amp Watts R (2008) The information role of conservatism The Accounting Review 83(2) 447-478
Lambert R Leuz C amp Verrecchia R (2007) Accounting information disclosure and the cost of capital Journal of
Accounting Research 45(2) 385-420
Lambert R Leuz C amp Verrecchia R (2012) Information asymmetry information precision and the cost of capital
Review of Finance 16(1) 1-29
Lewellen J Nagel S amp Shanken J (2010) A skeptical appraisal of asset pricing tests Journal of Financial
Economics 96(2) 175-194
Li X (2010) Accounting conservatism and cost of capital An international analysis Working paper Temple
University
Llorente G Michaely R Saar G amp Wang J (2002) Dynamic volume-return relation of individual stocks Review of
Financial Studies 15(4) 1005-1047
Lobo G amp Zhou J (2006) Did conservatism in financial reporting increase after the Sarbanes-Oxley Act Initial
evidence Accounting Horizons 20(1) 57-73
Applied Finance and Accounting Vol 2 No 1 2016
87
Louis H Lys T amp Sun A (2014) Conservatism and analyst earnings forecast bias Working paper Pennsylvania
State University
Luo Y Ma M amp Wu F (2014) Earnings downside risk Working paper Fudan University
McInnis J (2010) Earnings smoothness average returns and implied cost of equity capital The Accounting Review
85(1) 315-341
McNichols M amp Trueman B (1994) Public disclosures private information collection and short-term trading
Journal of Accounting and Economics 17(1-2) 69-94
Mensah Y Song X amp Ho S (2004) The effect of conservatism on analystsrsquo annual earnings forecast accuracy and
dispersion Journal of Accounting Auditing and Finance 19(2) 159-183
Nan L amp Wen X (2011) Conservatismrsquos effects on capital structure efficiency and information quality Working
paper University of Illinois at Chicago
Newey W amp West K (1987) A simple positive semi-definite heteroskedasticity and autocorrelation consistent
covariance matrix Econometrica 55(3) 703-708
Ogneva M (2012) Accrual quality realized returns and expected returns The importance of controlling for cash flow
shocks The Accounting Review 87(4) 1415-1444
Rogers J Skinner D amp Buskirk A (2009) Earnings guidance and market uncertainty Journal of Accounting and
Economics 48(1) 90-109
Ryan S (2006) Identifying conditional conservatism European Accounting Review 15(4) 511-525
Skaife H Collins D Kinney W amp LaFond R (2009) The effect of SOX internal control deficiencies on firm risk
and cost of equity Journal of Accounting Research 47(1) 1-43
Sloan R (1996) Do stock prices fully reflect information in accruals and cash flows about future earnings The
Accounting Review 71(3) 289-315
Srivastava T amp Sunder S (2011) Timely loss recognition and the early termination of unprofitable projects Working
paper Northwestern University
Verrecchia R (2001) Essays on disclosure Journal of Accounting and Economics 32(1-3) 97-180
Vuolteenaho T (2002) What drives firm-level stock returns Journal of Finance 57(1) 233-264
Watts R (2003) Conservatism in accounting Part I Explanations and implications Accounting Horizons 17(3)
207-221
Zhang J (2008) The contracting benefits of accounting conservatism to lenders and borrowers Journal of Accounting
and Economics 45(1) 27-54
Notes
Note 1 As guidance the Financial Accounting Standards Boardrsquos Statement of Financial Accounting Concepts No 2
(1980 para 95) intones that ldquoif two estimates of amounts to be received or paid in the future are about equally likely
conservatism dictates using the less optimistic estimaterdquo The Accounting Principles Board (Statement No 4 1970 para
171) observes that ldquomanagers investors and accountants have generally preferred that possible errors in measurement
be in the direction of understatement rather than overstatement of net income and net assets This has led to the
convention of conservatismrdquo
Note 2 In particular Caskey and Petersen (2009) argue that the Basu (1997) measure uses the ratio of slope coefficients
and thus may provide biased estimates because returns are impacted by expected future profits Other market-based
conditional conservatism measures such as the C-score in Khan and Watts (2009) also share a similar weakness
Note 3 Botosan et al (2011) and Ogneva (2012) argue that cash flow news does not cancel out in large samples and
therefore asset pricing tests may induce biases when future realized returns are used to proxy for expected returns
Note 4 Akins et al (2012) Armstrong et al (2011) and Gow et al (2011) also find that information asymmetry does
not affect the cost of equity incremental to market risk if firmsrsquo stocks are traded in highly liquid and competitive
markets
Note 5 Callen et al (2010) develop the CR ratio a market-based conservatism measure from the relation between
conditional conservatism and cash flow news
Note 6 Another measure for cash flow news is earnings forecast error (Botosan et al 2011 Ogneva 2012) which is
Applied Finance and Accounting Vol 2 No 1 2016
88
not used in our main tests since it introduces estimation bias However in robustness checks we use it as an alternative
proxy for cash flow news and obtain similar results
Note 7 We utilize accrual downside risk because it is the source of earnings downside risk and has better prediction
power for negative fundamental operational shocks (Luo et al 2014)
Note 8 Henceforth we use the term return or equity return to represent the excess returns adjusted for cash flow news
provided that no confusion arises
Note 9 TCAit = (ΔCAit - ΔCLit - ΔCashit + ΔSTDEBTit + ΔTPit - DPit)ATAit where ΔCAit is the one-year change in
current assets ΔCLit is the one-year change in current liabilities ΔCashit is the one-year change in cash ΔSTDEBTit is
the one-year change in current liabilities ΔTPit is the income tax payable DPit is the depreciation expense and ATAit is
the average total assets over t-1 t and t+1
Note 10 The accrual quality measure Acc is defined as the decile ranking of the ratio of the standard deviation of the
residual from the regression TCAit = αt + β0t ATAit + β1tOCFit-1 + β2tOCFit + β3tOCFit+1 + β4tΔREVit + β5tPPEit + εit
where TCAit is total current accruals for year t as defined above OCFit is operating cash flow for year t ΔREVit is the
one-year change in revenues and PPEit is the property plant and equipment for year t
Note 11 The mean (median) of total accruals TCA is 00099 (00080) which is higher than the documented negative
values in Sloan (1996) due to different sampling periods The sampling period in this study is from 1986 to 2008
whereas the period in Sloan (1996) is from 1962 to 1991 As we extend the sampling period back to 1962 the mean and
median of total accruals become negative in line with Sloanrsquos (1996) evidence
Note 12 Rigorously speaking model 1 in Panel B is not a univariate regression because it also includes industry
dummy variables We call it univariate for simplicity
Note 13 Chang et al (2009) report that SOX reduces the cost of equity capital in general by improving financial
reporting quality Skaife et al (2009) document that SOX reduces equity cost via mandatory disclosures of internal
control weaknesses Amir et al (2010) likewise argue that SOX enhances the negative relation between auditor
independence and the cost of debt capital proxied by bond ratings and yields
This work is licensed under a Creative Commons Attribution 30 License
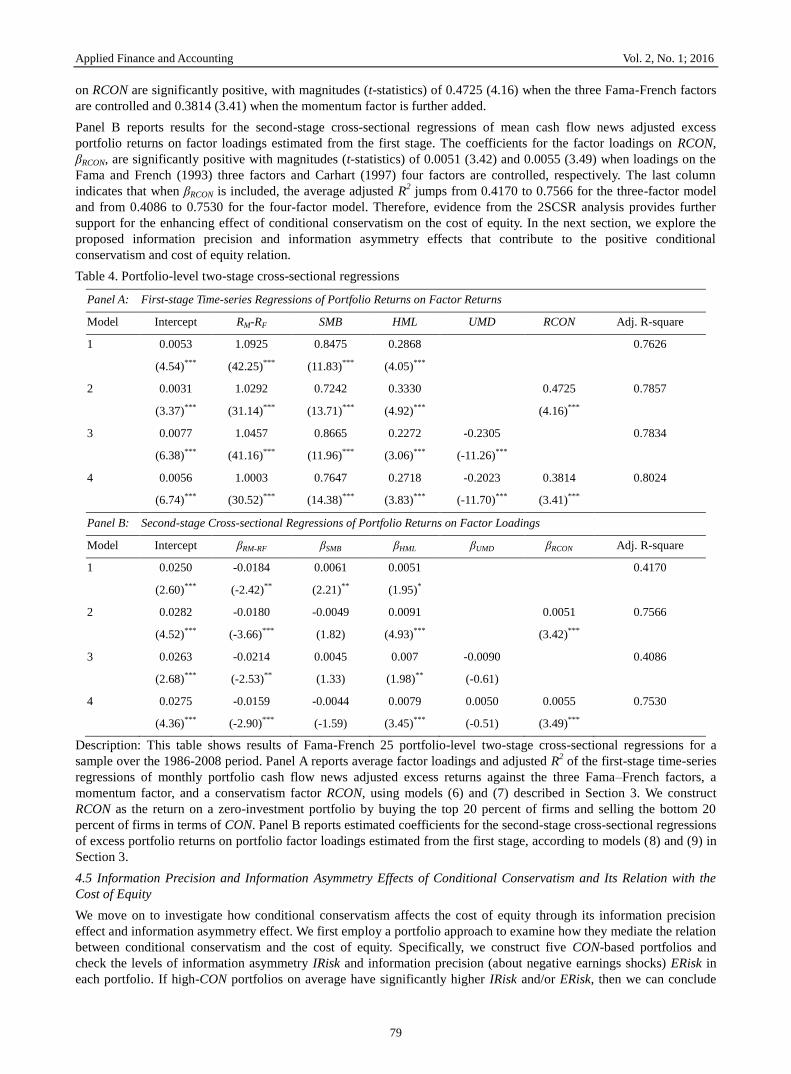
Applied Finance and Accounting Vol 2 No 1 2016
80
that conditional conservatism can generally elevate the information asymmetry andor information precision of negative
earnings shocks We then use the following Fama-MacBeth model and its simplified variations to investigate both
effects in multivariate regressions
Rit+1 - RFt+1 = α + β1CONit + β2Betait + β3Sizeit + β4BMit + β5IRiskit+ β6ERiskit (10)
+ sumIndustry_Dummies + μit+1
where Rit+1 RFt+1 Betait Sizeit and CONit are defined as in model (5) and Industry_Dummies represents the Fama and
French (1997) industry classifications If CON affects the cost of equity capital via information asymmetry andor
earnings downside risk then adding IRisk andor ERisk should weaken the relation as reflected in the magnitude and
significance level of the CON coefficient
Table 5 reports results from the portfolio analysis and Fama-MacBeth regressions for testing how conditional
conservatism affects the cost of equity through the information asymmetry and information precision effects Panel A
presents mean values of the information asymmetry measure IRisk and the measure for information precision of
negative earnings shocks ERisk in different CON-sorted portfolios with portfolio 1 (5) containing observations with the
smallest (largest) CON IRisk increases non-monotonically with CON revealing an asymmetric ldquoVrdquo pattern It falls
from 00303 in portfolio 1 to 00284 in portfolio 2 suggesting that conditional conservatism at lower levels serves to
reduce information asymmetry Then IRisk increases monotonically to 00350 in portfolio 5 implying that at higher
levels CON increases information asymmetry The mean difference of IRisk between portfolios 5 and 1 is 00047
statistically significant at the 1 confidence level Therefore CON is nonlinearly associated with information
asymmetry but on average a positive relation dominates suggesting that high conditional conservatism can in general
increase the cost of equity capital via enhancing information asymmetry as suggested by Gow et al (2011) and Lambert
et al (2012) The information precision of negative earnings shocks measure ERisk increases monotonically with CON
and the mean difference (t-statistic) between the top and bottom portfolios is 00567 (3895) suggesting that conditional
conservatism does increase the precision of information regarding negative earnings shocks Since earnings downside
risk induces a higher cost of equity (Luo et al 2014) this evidence suggests that conditional conservatism may increase
the cost of equity capital through enhancing the precision of negative earnings news
Panel B of Table 5 presents estimated results for the Fama-MacBeth regressions using model (10) with fixed industry
effects In all models the coefficients on conditional conservatism CON become much smaller than those in Panel B of
Table 3 where IRisk and ERisk are not controlled In particular the CON coefficients (t-statistics) drop to 00053 (213)
and 00049 (222) respectively after adding IRisk and ERisk as further controls compared with the figure of 00063
(277) in Panel B of Table 3 where only the three Fama-French factors are controlled for Importantly the CON
coefficient falls to 00041 when both IRisk and ERisk are controlled and it is only marginally significant with a
t-statistic of 168 Combined the findings indicate that information asymmetry and information precision of negative
earnings shocks partially account for the effect of conditional conservatism on the cost of equity and they subsume a
larger portion of loading on conditional conservatism when both are included in the regression model This evidence
lends support to the notion that the positive relation between conditional conservatism and the cost of equity operates
(at least partially) through the effects of information asymmetry and information precision of negative earnings shocks
Table 5 Conditional conservatism-sorted portfolio analysis and Fama-MacBeth regression of cash flow news adjusted
excess returns on conditional conservatism information asymmetry and information precision about negative earnings
shocks
Panel A Portfolio Analysis
Portfolio IRisk ERisk
1 00303 -00313
2 00284 -00109
3 00310 -00108
4 00341 -00063
5 00350 00254
(5-1) 00047 00567
t-statistic (2411) (3895)
Panel B Fama-MacBeth Regressions with Industry Dummies
Model CON Beta Size BM IRisk ERisk Avg Adj R-square
1 00053 00036 -00004 00022 01522 00545
(213) (129) (-065) (292) (413)
2 00049 00021 -00012 00025 00152 00555
(222) (080) (-273) (363) (510)
3 00041 00034 -00004 00024 01595 00145 00561
(168) (118) (-085) (301) (406) (432)
Applied Finance and Accounting Vol 2 No 1 2016
81
Description This table presents estimation results for testing the information asymmetry and information precision
effects on the conditional conservatism and cost of equity relation Panel A reports results from portfolio analyses for
information asymmetry proxy IRisk and earnings downside risk measure ERisk At the end of each month firm-month
observations are assigned into one of five portfolios based on a firmrsquos most recent CON known four months prior to the
current date Portfolio 1 (5) contains firms with the smallest (largest) CON Average differences in IRisk and ERisk
between the top and bottom portfolios are reported in row (5-1) The t-statistics for these differences are computed with
a Newey-West (1987) correction Panel B shows results for Fama-MacBeth regressions (model (10) of Section 4) of
future monthly cash flow news adjusted excess returns on CON IRisk ERisk and other firm characteristics (Beta Size
BM) The reported estimates are time-series averages of the coefficients on CON from 276 monthly cross-sectional
regressions Reported t-statistics are calculated from Newey and West (1987) standard errors of these monthly averages
46 SOX and the Relation between Conditional Conservatism and the Cost of Equity
Thus far we have examined how the effects of conditional conservatism on information asymmetry and precision of
negative earnings shocks affect its association with the cost of equity If these channels play a role then the passage of
SOX provides an ideal setting wherein their influences should change and thus induce alternation in the relation
between conditional conservatism and the cost of equity capital (Chang Fernando amp Liao 2009 Skaife Collins
Kinney amp LaFond 2009 Amir Guan amp Livne 2010) (Note 13) The SOX Act enacted in 2003 is a response to
allegations of accounting irregularities in Enron and other firms and it is intended in part to improve the overall
financial reporting quality of all public firms enhance information precision mitigate information asymmetry between
firms and investors and improve market efficiency Whereas several prior studies document increased conditional
conservatism in the post-SOX period (eg Lobo amp Zhou 2006) our design lends itself to further detecting potential
reductions in equity cost arising from reduced information asymmetry after SOX thus complementing prior findings
With regard to the information precision effect since SOX increases information transparency for all firms the
cross-sectional information precision effect of negative earnings shocks conveyed via conditional conservatism may be
weakened by the nationwide heightened information precision This connotes a reduced effect of conservatism on the
cost of equity in the post-SOX period ceteris paribus The SOX passage also decreases information asymmetry and
shrinks potential mispricing which further abates the potential information asymmetry effect of conditional
conservatism on the cost of equity Based on these arguments we expect a weakened association between conditional
conservatism and the cost of equity after the SOX enactment This serves to provide additional support for the
informational effects of conditional conservatism on increasing the cost of equity in the pre-SOX period
Figure 1 graphically presents the per-year average cash flow news adjusted excess returns to conditional
conservatism-sorted hedging portfolios A striking pattern is observed whereby hedging returns are consistently positive
for most years during the pre-SOX period from 1986 to 2002 The returns become negative from 2004 through 2008
the post-SOX period with generally smaller magnitudes and variability compared with the pre-SOX period The spike
in 2003 is consistent with enhanced revelations of bad news associated with the implementation of SOX
Figure 1 Mean differences in cash flow news adjusted excess return
for conditional conservatism-sorted hedging portfolios by year
To further examine the influence of SOX on the association between conditional conservatism and the cost of equity we
conduct firm-level Fama-MacBeth regressions of cash flow news adjusted excess returns on conditional conservatism
Applied Finance and Accounting Vol 2 No 1 2016
82
CON separately for the pre- and post-SOX periods We report results in Panels A and B of Table 6 To avoid possible
noises from transient market reactions to the SOX regulation we omit the years when SOX was passed (2002) and
implemented (2003) Panel A reveals that the positive relation between conditional conservatism and the cost of equity
is driven primarily by observations from the pre-SOX period In particular loadings on CON are positive and
significant in all regressions before the implementation of SOX Panel B indicates that CON coefficients are generally
negative andor insignificant in the post-SOX period consistent with Figure 1 In summary results in pre- and
post-SOX periods collectively corroborate the notion that the passage of SOX diminishes the information asymmetry
and information precision effects of conditional conservatism on the cross-section of stock returns resulting in a weak
relation between conditional conservatism and the cost of equity
Table 6 SOX and Fama-MacBeth regressions of cash flow news adjusted excess returns on conditional conservatism
and firm characteristics with industry dummies
Panel A Fama-MacBeth Regressions in the Pre-SOX Period before 2002 (198601-200112)
Model CON Beta Size BM Momentum TCA Acc Low_Priced IRisk ERisk Ave Adj R-square
1 00124 00334
(387)
2 00095 00032 -00011 00028 00505
(362) (110) (-180) (320)
3 00094 00023 -00013 00027 00030 00554
(363) (089) (-202) (317) (172)
4 00088 00035 -00012 00022 -00198 00515
(336) (119) (-182) (255) (-602)
5 00124 00032 -00020 00029 00230 -00154 00611
(506) (115) (-364) (351) (156) (-672)
6 00086 00046 -00002 00026 00816 00499
(293) (145) (-031) (275) (355)
7 00082 00028 -00011 00028 00207 00523
(324) (092) (-180) (314) (584)
8 00105 00061 -00013 00017 00004 -00207 00115 -00206 01434 00163 00684
(344) (218) (-194) (169) (020) (-480) (072) (-943) (547) (357)
Panel B Fama-MacBeth Regressions in the Post-SOX Period after 2003 (200401-200812)
Model CON Beta Size BM Momentum TCA Acc Low_Priced IRisk ERisk Ave Adj R-square
1 -00073 00449
(-131)
2 -00062 -00046 -00005 00011 00559
(-160) (-114) (-091) (096)
3 -00063 -00045 -00007 00012 -00009 00604
(-158) (-118) (-111) (105) (-031)
4 -00058 -00043 -00006 00011 -00012 00565
(-155) (-106) (-095) (099) (-028)
5 00046 -00025 -00022 00010 -00145 -00212 00599
(-119) (-063) (-435) (086) (-151) (-757)
6 -00068 -00043 00003 00007 03126 00595
(-171) (-109) (-057) (062) (233)
7 -00057 -00046 -00007 00010 -00002 00572
(-151) (-114) (-117) (083) (-004)
8 00027 -00014 -00004 00007 -00057 -00015 -00060 -00258 06457 00059 00714
(-071) (-038) (-073) (060) (-202) (-035) (-061) (-898) (436) (-089)
Description This table presents estimation results for Fama-MacBeth regressions of monthly cash flow news adjusted
excess returns on conditional conservatism (CON) total accruals (TCA) accrual quality (Acc) (along with a low-priced
return indicator variable Low_Priced) information asymmetry (IRisk) earnings downside risk (ERisk) and firm
characteristics including Beta Size and BM plus controls for dummies for Fama and French (1997) industries Panel A
reports average regression coefficients for the period of January 1986 to December 2001 a period before SOX Panel B
reports average coefficients for the period of January 2004 to December 2008 a period after SOX Reported t-statistics
are calculated from Newey and West (1987) standard errors of these monthly averages
Applied Finance and Accounting Vol 2 No 1 2016
83
5 Robustness Checks
51 Alternative Conditional Conservatism Measures
To check the robustness of our main findings we use several alternative measures for conditional conservatism We first
separately use CON_Skew CON_Acm and the ranking of CON with results qualitatively unchanged Then we use two
other conditional conservatism proxies Skew and CONA as introduced in Section 3 and also find qualitatively similar
results Nevertheless one may still be concerned about whether our results still hold when using the traditional
accounting-based conditional conservatism measures in Basu (1997) and doubt the validity of our findings To address
this issue we try the more classical measure based on the asymmetric persistence of net income in Basu (1997) We
have to make two extensions to the original measure in Basu (1997) to better fit in our research (i) to derive a pure
accounting-based conservatism measure we use total assets or sales as the deflator for net income instead of using stock
price and (ii) to avoid a potentially serious survival bias we estimate the model of net income changes or levels below
by quarterly data rather than annual data because at least 12 observations are needed to comparatively and accurately
estimate the model We use a rolling window of 16 quarterly observations to estimate models (11) and (12) below
∆NIit = β0 + β1DDit-1 + β2∆NIit-1 + β3DDit-1∆NIit-1 + εit+1 (11)
NIit = τ0 + τ1Dit-1 + τ2NIit-1 + τ3Dit-1NIit-1 + ϕit+1 (12)
where ∆NIit (NIit) refers to the ratio of quarterly net income changes (quarterly net income) to lagged corresponding
values in total assets ∆ROAit (ROAit) or the ratio of quarterly net income changes (quarterly net income) to lagged
corresponding values in sales ∆ROSit (ROSit) DDit-1 is the indicator for negative ∆NIit-1 while Dit-1 is the indicator for
negative NIit-1 We use the rankings of the estimated coefficients β3 or τ3 as the conditional conservatism measure
because using quarterly earnings data yields noisy coefficient estimations When ∆ROAit or ROAit is used the estimated
conditional conservatism measures from models (11) and (12) are denoted Basu_∆ROAit and Basu_ROAit respectively
When ∆ROSit or ROSit is used we denote the estimated conditional conservatism measures as Basu_∆ROSit and
Basu_ROSit respectively Table 7 reports the estimation results for our baseline Fama-MacBeth regression tests using
these alternative conservatism measures In all univariate and multivariate regressions Basu_∆ROAit Basu_∆ROSit
Basu_ROAit and Basu_ROSit are significantly positively associated with the cost of equity capital except for the last
model where Basu_ROSit is used in the multivariate regression Therefore our testing results are generally robust to the
classical accounting-based conditional conservatism measures based on the asymmetric earnings persistence
Table 7 Alternative conditional conservatism measures and Fama-MacBeth regression for the relation between
conditional conservatism and cash flow news adjusted excess returns
Model Basu_∆ROA Basu_∆ROS Basu_ROA Basu_ROS Beta Size BM Momentum TCA Acc Low_Priced Avg Adj R-square
1 00038
00378
(360)
2 00037
00037 -00022 00019 -00016 -00158 00127 -00153 00692
(399)
(161) (-515)
(300)
(-103) (-566)
(118) (-949)
3
00029
00372
(328)
4
00032
00037 -00022 00019 -00016 -00172 00153 -00152 00692
(388)
(161) (-504)
(293)
(-102) (-601)
(139) (-935)
5
00015
00376
(168)
6
00018
00038 -00022 00020 -00016 -00155 00157 -00152 00691
(213)
(166) (-507)
(322)
(-102) (-558)
(142) (-939)
7
00016
00373
(164)
8
00014 00038 -00022 00019 -00015 -00171 00160 -00150 00693
(150) (165) (-501)
(303)
(-099) (-592)
(144) (-925)
Description This table presents estimation results for univariate and multivariate Fama-MacBeth regressions (after
controlling for industry effect) of monthly cash flow news adjusted excess returns on alternative conditional
conservatism measures extending the measurement in Basu (1997) Construction of Basu-based conditional
Applied Finance and Accounting Vol 2 No 1 2016
84
conservatism measures are detailed in Section 5 Definitions of other variables are the same as in Tables 3 and
6 Reported t-statistics are calculated from Newey and West (1987) standard errors
52 Alternative Cost of Capital Measures
For alternative measures of the cost of equity we extend Botosan et al (2011) and use the analyst forecast error as an
approximation for cash flow news which is computed as the difference between the reported annual earnings per share
less its analyst forecast deflated by the stock price Using the newly constructed cost of equity measure we find that the
baseline results are similar to the reported
53 Alternative Measures for Information Precision and Information Asymmetry
We also use the following alternative measures for information asymmetry (i) the annual average of daily high and low
spread over the 12 months prior to the current fiscal year-end HLSpread calculated following Corwin and Schultz
(2011) and (ii) private information trading Itrade calculated following Llorente et al (2002) and Ferreira and Laux
(2007) These treatments do not qualitatively change the estimation results For alternative earnings downside risk
proxies that reflect the information precision effect we further adopt earnings volatility and the root lower partial
moment of ROA AERisk as substitute measures When these proxies are used results are consistent with those reported
in the main tests
54 Alternative Estimation Methods
In alternative asset pricing tests we used pooled OLS regressions instead of the Fama-MacBeth method We also follow
McInnis (2010) and drop all return-months in which a firm announces quarterly earnings to reduce the possibility that
improper adjustments for cash flow news may bias the results We further add the liquidity beta as a control for the
liquidity effect All these schemes deliver findings that are qualitatively similar to the reported Finally to address the
concern that the results for the post-SOX period are driven by the price plump and liquidity depletion during the 2007 to
2008 financial crisis we drop the years of 2007 and 2008 from our post-SOX sample period replicate Panel B of Table
6 and achieve qualitatively unchanged results
6 Conclusion
Prior studies examine the effect of conditional conservatism on the cost of equity mainly based on the theory that
improved information quality reduces covariance between a firmrsquos stock return and the market return thus decreasing
the cost of equity The empirical evidence however is mixed and not consistent In this study we propose that
improved information quality regarding bad earnings news as induced by conditional conservatism entails two
informational consequences more precise information about negative earnings shocks and heightened information
asymmetry both of which may generate economy-wide or market-wide effects and increase the cost of equity Using
accounting-based conditional conservatism measures and the cash flow news adjusted stock returns as the proxy for the
cost of equity we find a significantly positive relation between conditional conservatism and the cost of equity capital
and document evidence that such positive relation (at least partially) operates via the effects of information asymmetry
and information precision about negative earnings shocks We also find that the positive association between
conditional conservatism and the cost of equity disappears in the post-SOX period consistent with the mitigated
cross-sectional power of the information precision and information asymmetry effects of conditional conservatism
engendered by the nationwide improved information quality after SOX
This study supplements prior literature that documents an insignificant or negative relation between conditional
conservatism and the cost of equity Our findings also augment the SOX literature by documenting a diminution of the
influence of conditional conservatism in the direction of increasing the cost of capital after the implementation of SOX
and connote the importance of considering regulation-induced economy-wide effects Moreover the evidence holds
implications for ongoing deliberations regarding the costs and benefits of conservatism and further implies that
conditional conservatism imposes costs on both equity investors and managers thus pointing to a legitimate rationale
for managers to disfavor conditional conservatism which is largely neglected in the literature
Acknowledgements
We are grateful for the comments and advices from Pingyang Gao Chaoli Guo Tao Lin Yan Luo Xingrong Qiang
Tony Jun Ruan Jing Wang Yanyan Wang participants and discussants at the 2011 Canadian Academic Accounting
Association Annual Meetings the 2011 Asian Academic Accounting Association Annual Meetings and the 2011
International Symposium on Empirical Accounting Research We appreciate research assistance from Chen Chen and
Ariel Liao
References
Accounting Principles Board (1970) Statement No 4 Basic concepts and accounting principles underlying financial
statements of business enterprises Stamford CT Financial Accounting Standards Board [FASB]
Applied Finance and Accounting Vol 2 No 1 2016
85
Akins B Ng J amp Verdi R (2012) Investor competition over information and the pricing of information asymmetry
The Accounting Review 87(1) 35-58
Armstrong C Guay W amp Weber J (2010) The role of information and financial reporting in corporate governance
and debt contracting Journal of Accounting and Economics 50(2-3) 179-234
Armstrong C Core J Taylor D amp Verrecchia V (2011) When does information asymmetry affect the cost of
capital Journal of Accounting Research 49(1) 1-40
Amir E Guan Y amp Livne G (2010) Auditor independence and the cost of capital before and after Sarbanes-Oxley
The case of newly issued public debt European Accounting Review 19(4) 633-664
Ball R Jayaraman S amp Shivakumar L (2012) Mark-to-market accounting and information asymmetry in banks
Working paper University of Chicago
Basu S (1995) Conservatism and the asymmetric timeliness of earnings (Doctoral dissertation) University of
Rochester New York USA
Basu S (1997) The conservatism principle and the asymmetric timeliness of earnings Journal of Accounting and
Economics 24(1) 3-37
Botosan C Plumlee M amp Wen H (2011) The relation between expected returns realized returns and firm risk
characteristics Contemporary Accounting Research 28(4) 1085-1122
Callen J Segal D amp Hope O-K 2010 The pricing of conservative accounting and the measurement of conservatism
at the firm-year level Review of Accounting Studies 15(1) 145-178
Carhart M (1997) On the persistence of mutual fund performance Journal of Finance 52(1) 57-82
Caskey J amp Peterson K (2009) On the estimation of the asymmetric timeliness of earnings Inference and bias
corrections Working Paper University of California at Los Angeles
Chang H Fernando G amp Liao L (2009) Sarbanes-Oxley act perceived earnings quality and cost of capital Review
of Accounting and Finance 8(3) 216-231
Chen Q Hemmer T amp Zhang Y (2007) On the relation between conservatism in accounting standards and
incentives for earnings management Journal of Accounting Research 45(3) 541-565
Corwin S amp Schultz P (2011) A Simple way to estimate bid-ask spreads from daily high and low prices Journal of
Finance 67(2) 719ndash760
Crawley M (2012) Macroeconomic consequences of accounting The effect of accounting conservatism on
macroeconomic indicators and the money supply Working paper Indiana University
Demski J amp Feltham G (1994) Market response to financial reports Journal of Accounting and Economics 17(1-2)
3-40
Diamond D amp Verrecchia R (1991) Disclosure liquidity and the cost of capital Journal of Finance 46(4)
1325-1359
Easley D Hvidkjaer S amp OrsquoHara M (2002) Is information risk a determinant of asset returns Journal of Finance
57(5) 2185-2221
Easley D amp OrsquoHara M (2004) Information and the cost of capital Journal of Finance 59(4) 1553ndash1583
Fama E amp French K (1992) The cross-section of expected stock returns Journal of Finance 47(2) 427-465
Fama E amp French K (1993) Common risk factors in the returns on stocks and bonds Journal of Financial
Economics 33(1) 3-56
Fama E amp French K (1997) Industry cost of equity Journal of Financial Economics 43(2) 153-193
Fama E amp MacBeth J (1973) Risk return and equilibrium Empirical tests Journal of Political Economy 81(3)
607-636
Fan Q amp Zhang X (2012) Accounting conservatism aggregation and information quality Contemporary
Accounting Research 29(1) 38-56
Ferreira M amp Laux P (2007) Corporate governance idiosyncratic risk and information flow Journal of Finance
62(2) 951-989
Financial Accounting Standards Board (1980) Statement of financial accounting concepts No 2 Qualitative
characteristics of accounting information Stamford CT Financial Accounting Standards Board [FASB]
Applied Finance and Accounting Vol 2 No 1 2016
86
Francis J LaFond R Olsson P amp Schipper K (2004) Cost of equity and earnings attributes The Accounting
Review 79(4) 967-1010
Gao P (2011) A contracting approach to conservatism and earnings management Working paper University of
Chicago
Gao P amp Liang P (2011) Informational feedback effect adverse selection and the optimal disclosure policy Working
paper University of Chicago
Garcia Lara J Garcia Osma B amp Penalva F (2011) Conditional conservatism and cost of capital Review of
Accounting Studies 16(2) 247-271
Gigler F Kanodia C Sapra H amp Venugopalan R (2009) Accounting conservatism and the efficiency of debt
contracts Journal of Accounting Research 47(3) 767-97
Givoly D amp Hayn C (2000) The changing time-series properties of earnings cash flows and accruals Has financial
reporting become more conservative Journal of Accounting and Economics 29(3) 287-320
Gox R amp Wagenhofer A (2009) Optimal impairment rules Journal of Accounting and Economics 48(1) 2-16
Gow I Taylor D amp Verrecchia R (2011) Earnings precision information asymmetry and the cost of capital
Evidence of information complementarities Working paper Harvard University
Guay W amp Verrecchia R (2007) Conservative disclosure Working paper University of Pennsylvania
Hughes J Liu J amp Liu J (2007) Information asymmetry diversification and cost of capital The Accounting Review
82(3) 705-730
Jorgensen B Li J amp Sadkay G (2012) Earnings dispersion and aggregate stock returns Journal of Accounting and
Economics 53(1-2) 1-20
Johnstone D (In Press) The effect of information on uncertainty and the cost of capital Contemporaneous Accounting
Research
Khan M (2008) Are accruals mispriced Evidence from tests of an intertemporal capital asset pricing model Journal
of Accounting and Economics 45(1) 55-77
Khan M amp Watts R (2009) Estimation and empirical properties of a firm-year measure of accounting conservatism
Journal of Accounting and Economics 48(2-3) 131-150
Kim B amp Pevzner M (2010) Conditional accounting conservatism and future negative surprises An empirical
investigation Journal of Accounting Public Policy 29(4) 311-329
Kim D amp Qi Y (2010) Accruals quality stock returns and macroeconomic conditions The Accounting Review 85(3)
937ndash978
Kim O amp Verrecchia R (1991) Market reaction to anticipated announcements Journal of Financial Economics
30(2) 273-309
Kothari S Shu S amp Wysocki P (2009) Do managers withhold bad news Journal of Accounting Research 47(1)
241ndash276
LaFond R amp Roychowdhury S (2008) Managerial ownership and accounting conservatism Journal of Accounting
Research 46(1) 101-135
LaFond R amp Watts R (2008) The information role of conservatism The Accounting Review 83(2) 447-478
Lambert R Leuz C amp Verrecchia R (2007) Accounting information disclosure and the cost of capital Journal of
Accounting Research 45(2) 385-420
Lambert R Leuz C amp Verrecchia R (2012) Information asymmetry information precision and the cost of capital
Review of Finance 16(1) 1-29
Lewellen J Nagel S amp Shanken J (2010) A skeptical appraisal of asset pricing tests Journal of Financial
Economics 96(2) 175-194
Li X (2010) Accounting conservatism and cost of capital An international analysis Working paper Temple
University
Llorente G Michaely R Saar G amp Wang J (2002) Dynamic volume-return relation of individual stocks Review of
Financial Studies 15(4) 1005-1047
Lobo G amp Zhou J (2006) Did conservatism in financial reporting increase after the Sarbanes-Oxley Act Initial
evidence Accounting Horizons 20(1) 57-73
Applied Finance and Accounting Vol 2 No 1 2016
87
Louis H Lys T amp Sun A (2014) Conservatism and analyst earnings forecast bias Working paper Pennsylvania
State University
Luo Y Ma M amp Wu F (2014) Earnings downside risk Working paper Fudan University
McInnis J (2010) Earnings smoothness average returns and implied cost of equity capital The Accounting Review
85(1) 315-341
McNichols M amp Trueman B (1994) Public disclosures private information collection and short-term trading
Journal of Accounting and Economics 17(1-2) 69-94
Mensah Y Song X amp Ho S (2004) The effect of conservatism on analystsrsquo annual earnings forecast accuracy and
dispersion Journal of Accounting Auditing and Finance 19(2) 159-183
Nan L amp Wen X (2011) Conservatismrsquos effects on capital structure efficiency and information quality Working
paper University of Illinois at Chicago
Newey W amp West K (1987) A simple positive semi-definite heteroskedasticity and autocorrelation consistent
covariance matrix Econometrica 55(3) 703-708
Ogneva M (2012) Accrual quality realized returns and expected returns The importance of controlling for cash flow
shocks The Accounting Review 87(4) 1415-1444
Rogers J Skinner D amp Buskirk A (2009) Earnings guidance and market uncertainty Journal of Accounting and
Economics 48(1) 90-109
Ryan S (2006) Identifying conditional conservatism European Accounting Review 15(4) 511-525
Skaife H Collins D Kinney W amp LaFond R (2009) The effect of SOX internal control deficiencies on firm risk
and cost of equity Journal of Accounting Research 47(1) 1-43
Sloan R (1996) Do stock prices fully reflect information in accruals and cash flows about future earnings The
Accounting Review 71(3) 289-315
Srivastava T amp Sunder S (2011) Timely loss recognition and the early termination of unprofitable projects Working
paper Northwestern University
Verrecchia R (2001) Essays on disclosure Journal of Accounting and Economics 32(1-3) 97-180
Vuolteenaho T (2002) What drives firm-level stock returns Journal of Finance 57(1) 233-264
Watts R (2003) Conservatism in accounting Part I Explanations and implications Accounting Horizons 17(3)
207-221
Zhang J (2008) The contracting benefits of accounting conservatism to lenders and borrowers Journal of Accounting
and Economics 45(1) 27-54
Notes
Note 1 As guidance the Financial Accounting Standards Boardrsquos Statement of Financial Accounting Concepts No 2
(1980 para 95) intones that ldquoif two estimates of amounts to be received or paid in the future are about equally likely
conservatism dictates using the less optimistic estimaterdquo The Accounting Principles Board (Statement No 4 1970 para
171) observes that ldquomanagers investors and accountants have generally preferred that possible errors in measurement
be in the direction of understatement rather than overstatement of net income and net assets This has led to the
convention of conservatismrdquo
Note 2 In particular Caskey and Petersen (2009) argue that the Basu (1997) measure uses the ratio of slope coefficients
and thus may provide biased estimates because returns are impacted by expected future profits Other market-based
conditional conservatism measures such as the C-score in Khan and Watts (2009) also share a similar weakness
Note 3 Botosan et al (2011) and Ogneva (2012) argue that cash flow news does not cancel out in large samples and
therefore asset pricing tests may induce biases when future realized returns are used to proxy for expected returns
Note 4 Akins et al (2012) Armstrong et al (2011) and Gow et al (2011) also find that information asymmetry does
not affect the cost of equity incremental to market risk if firmsrsquo stocks are traded in highly liquid and competitive
markets
Note 5 Callen et al (2010) develop the CR ratio a market-based conservatism measure from the relation between
conditional conservatism and cash flow news
Note 6 Another measure for cash flow news is earnings forecast error (Botosan et al 2011 Ogneva 2012) which is
Applied Finance and Accounting Vol 2 No 1 2016
88
not used in our main tests since it introduces estimation bias However in robustness checks we use it as an alternative
proxy for cash flow news and obtain similar results
Note 7 We utilize accrual downside risk because it is the source of earnings downside risk and has better prediction
power for negative fundamental operational shocks (Luo et al 2014)
Note 8 Henceforth we use the term return or equity return to represent the excess returns adjusted for cash flow news
provided that no confusion arises
Note 9 TCAit = (ΔCAit - ΔCLit - ΔCashit + ΔSTDEBTit + ΔTPit - DPit)ATAit where ΔCAit is the one-year change in
current assets ΔCLit is the one-year change in current liabilities ΔCashit is the one-year change in cash ΔSTDEBTit is
the one-year change in current liabilities ΔTPit is the income tax payable DPit is the depreciation expense and ATAit is
the average total assets over t-1 t and t+1
Note 10 The accrual quality measure Acc is defined as the decile ranking of the ratio of the standard deviation of the
residual from the regression TCAit = αt + β0t ATAit + β1tOCFit-1 + β2tOCFit + β3tOCFit+1 + β4tΔREVit + β5tPPEit + εit
where TCAit is total current accruals for year t as defined above OCFit is operating cash flow for year t ΔREVit is the
one-year change in revenues and PPEit is the property plant and equipment for year t
Note 11 The mean (median) of total accruals TCA is 00099 (00080) which is higher than the documented negative
values in Sloan (1996) due to different sampling periods The sampling period in this study is from 1986 to 2008
whereas the period in Sloan (1996) is from 1962 to 1991 As we extend the sampling period back to 1962 the mean and
median of total accruals become negative in line with Sloanrsquos (1996) evidence
Note 12 Rigorously speaking model 1 in Panel B is not a univariate regression because it also includes industry
dummy variables We call it univariate for simplicity
Note 13 Chang et al (2009) report that SOX reduces the cost of equity capital in general by improving financial
reporting quality Skaife et al (2009) document that SOX reduces equity cost via mandatory disclosures of internal
control weaknesses Amir et al (2010) likewise argue that SOX enhances the negative relation between auditor
independence and the cost of debt capital proxied by bond ratings and yields
This work is licensed under a Creative Commons Attribution 30 License
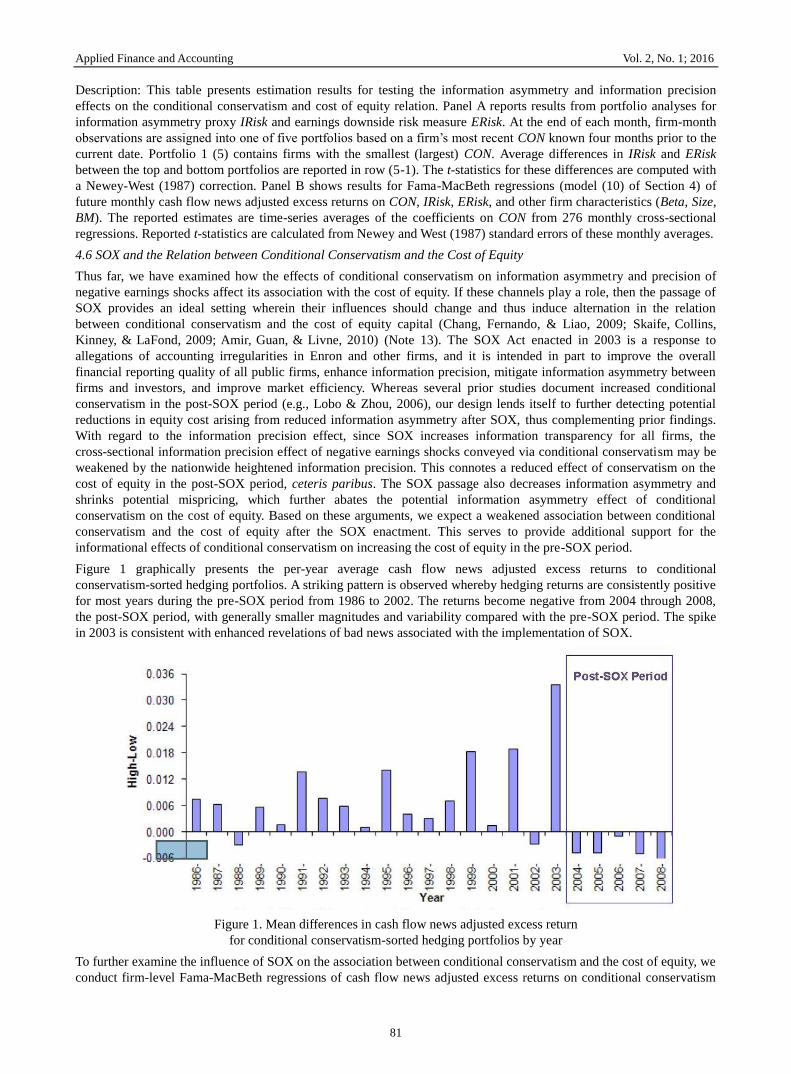
Applied Finance and Accounting Vol 2 No 1 2016
84
conservatism measures are detailed in Section 5 Definitions of other variables are the same as in Tables 3 and
6 Reported t-statistics are calculated from Newey and West (1987) standard errors
52 Alternative Cost of Capital Measures
For alternative measures of the cost of equity we extend Botosan et al (2011) and use the analyst forecast error as an
approximation for cash flow news which is computed as the difference between the reported annual earnings per share
less its analyst forecast deflated by the stock price Using the newly constructed cost of equity measure we find that the
baseline results are similar to the reported
53 Alternative Measures for Information Precision and Information Asymmetry
We also use the following alternative measures for information asymmetry (i) the annual average of daily high and low
spread over the 12 months prior to the current fiscal year-end HLSpread calculated following Corwin and Schultz
(2011) and (ii) private information trading Itrade calculated following Llorente et al (2002) and Ferreira and Laux
(2007) These treatments do not qualitatively change the estimation results For alternative earnings downside risk
proxies that reflect the information precision effect we further adopt earnings volatility and the root lower partial
moment of ROA AERisk as substitute measures When these proxies are used results are consistent with those reported
in the main tests
54 Alternative Estimation Methods
In alternative asset pricing tests we used pooled OLS regressions instead of the Fama-MacBeth method We also follow
McInnis (2010) and drop all return-months in which a firm announces quarterly earnings to reduce the possibility that
improper adjustments for cash flow news may bias the results We further add the liquidity beta as a control for the
liquidity effect All these schemes deliver findings that are qualitatively similar to the reported Finally to address the
concern that the results for the post-SOX period are driven by the price plump and liquidity depletion during the 2007 to
2008 financial crisis we drop the years of 2007 and 2008 from our post-SOX sample period replicate Panel B of Table
6 and achieve qualitatively unchanged results
6 Conclusion
Prior studies examine the effect of conditional conservatism on the cost of equity mainly based on the theory that
improved information quality reduces covariance between a firmrsquos stock return and the market return thus decreasing
the cost of equity The empirical evidence however is mixed and not consistent In this study we propose that
improved information quality regarding bad earnings news as induced by conditional conservatism entails two
informational consequences more precise information about negative earnings shocks and heightened information
asymmetry both of which may generate economy-wide or market-wide effects and increase the cost of equity Using
accounting-based conditional conservatism measures and the cash flow news adjusted stock returns as the proxy for the
cost of equity we find a significantly positive relation between conditional conservatism and the cost of equity capital
and document evidence that such positive relation (at least partially) operates via the effects of information asymmetry
and information precision about negative earnings shocks We also find that the positive association between
conditional conservatism and the cost of equity disappears in the post-SOX period consistent with the mitigated
cross-sectional power of the information precision and information asymmetry effects of conditional conservatism
engendered by the nationwide improved information quality after SOX
This study supplements prior literature that documents an insignificant or negative relation between conditional
conservatism and the cost of equity Our findings also augment the SOX literature by documenting a diminution of the
influence of conditional conservatism in the direction of increasing the cost of capital after the implementation of SOX
and connote the importance of considering regulation-induced economy-wide effects Moreover the evidence holds
implications for ongoing deliberations regarding the costs and benefits of conservatism and further implies that
conditional conservatism imposes costs on both equity investors and managers thus pointing to a legitimate rationale
for managers to disfavor conditional conservatism which is largely neglected in the literature
Acknowledgements
We are grateful for the comments and advices from Pingyang Gao Chaoli Guo Tao Lin Yan Luo Xingrong Qiang
Tony Jun Ruan Jing Wang Yanyan Wang participants and discussants at the 2011 Canadian Academic Accounting
Association Annual Meetings the 2011 Asian Academic Accounting Association Annual Meetings and the 2011
International Symposium on Empirical Accounting Research We appreciate research assistance from Chen Chen and
Ariel Liao
References
Accounting Principles Board (1970) Statement No 4 Basic concepts and accounting principles underlying financial
statements of business enterprises Stamford CT Financial Accounting Standards Board [FASB]
Applied Finance and Accounting Vol 2 No 1 2016
85
Akins B Ng J amp Verdi R (2012) Investor competition over information and the pricing of information asymmetry
The Accounting Review 87(1) 35-58
Armstrong C Guay W amp Weber J (2010) The role of information and financial reporting in corporate governance
and debt contracting Journal of Accounting and Economics 50(2-3) 179-234
Armstrong C Core J Taylor D amp Verrecchia V (2011) When does information asymmetry affect the cost of
capital Journal of Accounting Research 49(1) 1-40
Amir E Guan Y amp Livne G (2010) Auditor independence and the cost of capital before and after Sarbanes-Oxley
The case of newly issued public debt European Accounting Review 19(4) 633-664
Ball R Jayaraman S amp Shivakumar L (2012) Mark-to-market accounting and information asymmetry in banks
Working paper University of Chicago
Basu S (1995) Conservatism and the asymmetric timeliness of earnings (Doctoral dissertation) University of
Rochester New York USA
Basu S (1997) The conservatism principle and the asymmetric timeliness of earnings Journal of Accounting and
Economics 24(1) 3-37
Botosan C Plumlee M amp Wen H (2011) The relation between expected returns realized returns and firm risk
characteristics Contemporary Accounting Research 28(4) 1085-1122
Callen J Segal D amp Hope O-K 2010 The pricing of conservative accounting and the measurement of conservatism
at the firm-year level Review of Accounting Studies 15(1) 145-178
Carhart M (1997) On the persistence of mutual fund performance Journal of Finance 52(1) 57-82
Caskey J amp Peterson K (2009) On the estimation of the asymmetric timeliness of earnings Inference and bias
corrections Working Paper University of California at Los Angeles
Chang H Fernando G amp Liao L (2009) Sarbanes-Oxley act perceived earnings quality and cost of capital Review
of Accounting and Finance 8(3) 216-231
Chen Q Hemmer T amp Zhang Y (2007) On the relation between conservatism in accounting standards and
incentives for earnings management Journal of Accounting Research 45(3) 541-565
Corwin S amp Schultz P (2011) A Simple way to estimate bid-ask spreads from daily high and low prices Journal of
Finance 67(2) 719ndash760
Crawley M (2012) Macroeconomic consequences of accounting The effect of accounting conservatism on
macroeconomic indicators and the money supply Working paper Indiana University
Demski J amp Feltham G (1994) Market response to financial reports Journal of Accounting and Economics 17(1-2)
3-40
Diamond D amp Verrecchia R (1991) Disclosure liquidity and the cost of capital Journal of Finance 46(4)
1325-1359
Easley D Hvidkjaer S amp OrsquoHara M (2002) Is information risk a determinant of asset returns Journal of Finance
57(5) 2185-2221
Easley D amp OrsquoHara M (2004) Information and the cost of capital Journal of Finance 59(4) 1553ndash1583
Fama E amp French K (1992) The cross-section of expected stock returns Journal of Finance 47(2) 427-465
Fama E amp French K (1993) Common risk factors in the returns on stocks and bonds Journal of Financial
Economics 33(1) 3-56
Fama E amp French K (1997) Industry cost of equity Journal of Financial Economics 43(2) 153-193
Fama E amp MacBeth J (1973) Risk return and equilibrium Empirical tests Journal of Political Economy 81(3)
607-636
Fan Q amp Zhang X (2012) Accounting conservatism aggregation and information quality Contemporary
Accounting Research 29(1) 38-56
Ferreira M amp Laux P (2007) Corporate governance idiosyncratic risk and information flow Journal of Finance
62(2) 951-989
Financial Accounting Standards Board (1980) Statement of financial accounting concepts No 2 Qualitative
characteristics of accounting information Stamford CT Financial Accounting Standards Board [FASB]
Applied Finance and Accounting Vol 2 No 1 2016
86
Francis J LaFond R Olsson P amp Schipper K (2004) Cost of equity and earnings attributes The Accounting
Review 79(4) 967-1010
Gao P (2011) A contracting approach to conservatism and earnings management Working paper University of
Chicago
Gao P amp Liang P (2011) Informational feedback effect adverse selection and the optimal disclosure policy Working
paper University of Chicago
Garcia Lara J Garcia Osma B amp Penalva F (2011) Conditional conservatism and cost of capital Review of
Accounting Studies 16(2) 247-271
Gigler F Kanodia C Sapra H amp Venugopalan R (2009) Accounting conservatism and the efficiency of debt
contracts Journal of Accounting Research 47(3) 767-97
Givoly D amp Hayn C (2000) The changing time-series properties of earnings cash flows and accruals Has financial
reporting become more conservative Journal of Accounting and Economics 29(3) 287-320
Gox R amp Wagenhofer A (2009) Optimal impairment rules Journal of Accounting and Economics 48(1) 2-16
Gow I Taylor D amp Verrecchia R (2011) Earnings precision information asymmetry and the cost of capital
Evidence of information complementarities Working paper Harvard University
Guay W amp Verrecchia R (2007) Conservative disclosure Working paper University of Pennsylvania
Hughes J Liu J amp Liu J (2007) Information asymmetry diversification and cost of capital The Accounting Review
82(3) 705-730
Jorgensen B Li J amp Sadkay G (2012) Earnings dispersion and aggregate stock returns Journal of Accounting and
Economics 53(1-2) 1-20
Johnstone D (In Press) The effect of information on uncertainty and the cost of capital Contemporaneous Accounting
Research
Khan M (2008) Are accruals mispriced Evidence from tests of an intertemporal capital asset pricing model Journal
of Accounting and Economics 45(1) 55-77
Khan M amp Watts R (2009) Estimation and empirical properties of a firm-year measure of accounting conservatism
Journal of Accounting and Economics 48(2-3) 131-150
Kim B amp Pevzner M (2010) Conditional accounting conservatism and future negative surprises An empirical
investigation Journal of Accounting Public Policy 29(4) 311-329
Kim D amp Qi Y (2010) Accruals quality stock returns and macroeconomic conditions The Accounting Review 85(3)
937ndash978
Kim O amp Verrecchia R (1991) Market reaction to anticipated announcements Journal of Financial Economics
30(2) 273-309
Kothari S Shu S amp Wysocki P (2009) Do managers withhold bad news Journal of Accounting Research 47(1)
241ndash276
LaFond R amp Roychowdhury S (2008) Managerial ownership and accounting conservatism Journal of Accounting
Research 46(1) 101-135
LaFond R amp Watts R (2008) The information role of conservatism The Accounting Review 83(2) 447-478
Lambert R Leuz C amp Verrecchia R (2007) Accounting information disclosure and the cost of capital Journal of
Accounting Research 45(2) 385-420
Lambert R Leuz C amp Verrecchia R (2012) Information asymmetry information precision and the cost of capital
Review of Finance 16(1) 1-29
Lewellen J Nagel S amp Shanken J (2010) A skeptical appraisal of asset pricing tests Journal of Financial
Economics 96(2) 175-194
Li X (2010) Accounting conservatism and cost of capital An international analysis Working paper Temple
University
Llorente G Michaely R Saar G amp Wang J (2002) Dynamic volume-return relation of individual stocks Review of
Financial Studies 15(4) 1005-1047
Lobo G amp Zhou J (2006) Did conservatism in financial reporting increase after the Sarbanes-Oxley Act Initial
evidence Accounting Horizons 20(1) 57-73
Applied Finance and Accounting Vol 2 No 1 2016
87
Louis H Lys T amp Sun A (2014) Conservatism and analyst earnings forecast bias Working paper Pennsylvania
State University
Luo Y Ma M amp Wu F (2014) Earnings downside risk Working paper Fudan University
McInnis J (2010) Earnings smoothness average returns and implied cost of equity capital The Accounting Review
85(1) 315-341
McNichols M amp Trueman B (1994) Public disclosures private information collection and short-term trading
Journal of Accounting and Economics 17(1-2) 69-94
Mensah Y Song X amp Ho S (2004) The effect of conservatism on analystsrsquo annual earnings forecast accuracy and
dispersion Journal of Accounting Auditing and Finance 19(2) 159-183
Nan L amp Wen X (2011) Conservatismrsquos effects on capital structure efficiency and information quality Working
paper University of Illinois at Chicago
Newey W amp West K (1987) A simple positive semi-definite heteroskedasticity and autocorrelation consistent
covariance matrix Econometrica 55(3) 703-708
Ogneva M (2012) Accrual quality realized returns and expected returns The importance of controlling for cash flow
shocks The Accounting Review 87(4) 1415-1444
Rogers J Skinner D amp Buskirk A (2009) Earnings guidance and market uncertainty Journal of Accounting and
Economics 48(1) 90-109
Ryan S (2006) Identifying conditional conservatism European Accounting Review 15(4) 511-525
Skaife H Collins D Kinney W amp LaFond R (2009) The effect of SOX internal control deficiencies on firm risk
and cost of equity Journal of Accounting Research 47(1) 1-43
Sloan R (1996) Do stock prices fully reflect information in accruals and cash flows about future earnings The
Accounting Review 71(3) 289-315
Srivastava T amp Sunder S (2011) Timely loss recognition and the early termination of unprofitable projects Working
paper Northwestern University
Verrecchia R (2001) Essays on disclosure Journal of Accounting and Economics 32(1-3) 97-180
Vuolteenaho T (2002) What drives firm-level stock returns Journal of Finance 57(1) 233-264
Watts R (2003) Conservatism in accounting Part I Explanations and implications Accounting Horizons 17(3)
207-221
Zhang J (2008) The contracting benefits of accounting conservatism to lenders and borrowers Journal of Accounting
and Economics 45(1) 27-54
Notes
Note 1 As guidance the Financial Accounting Standards Boardrsquos Statement of Financial Accounting Concepts No 2
(1980 para 95) intones that ldquoif two estimates of amounts to be received or paid in the future are about equally likely
conservatism dictates using the less optimistic estimaterdquo The Accounting Principles Board (Statement No 4 1970 para
171) observes that ldquomanagers investors and accountants have generally preferred that possible errors in measurement
be in the direction of understatement rather than overstatement of net income and net assets This has led to the
convention of conservatismrdquo
Note 2 In particular Caskey and Petersen (2009) argue that the Basu (1997) measure uses the ratio of slope coefficients
and thus may provide biased estimates because returns are impacted by expected future profits Other market-based
conditional conservatism measures such as the C-score in Khan and Watts (2009) also share a similar weakness
Note 3 Botosan et al (2011) and Ogneva (2012) argue that cash flow news does not cancel out in large samples and
therefore asset pricing tests may induce biases when future realized returns are used to proxy for expected returns
Note 4 Akins et al (2012) Armstrong et al (2011) and Gow et al (2011) also find that information asymmetry does
not affect the cost of equity incremental to market risk if firmsrsquo stocks are traded in highly liquid and competitive
markets
Note 5 Callen et al (2010) develop the CR ratio a market-based conservatism measure from the relation between
conditional conservatism and cash flow news
Note 6 Another measure for cash flow news is earnings forecast error (Botosan et al 2011 Ogneva 2012) which is
Applied Finance and Accounting Vol 2 No 1 2016
88
not used in our main tests since it introduces estimation bias However in robustness checks we use it as an alternative
proxy for cash flow news and obtain similar results
Note 7 We utilize accrual downside risk because it is the source of earnings downside risk and has better prediction
power for negative fundamental operational shocks (Luo et al 2014)
Note 8 Henceforth we use the term return or equity return to represent the excess returns adjusted for cash flow news
provided that no confusion arises
Note 9 TCAit = (ΔCAit - ΔCLit - ΔCashit + ΔSTDEBTit + ΔTPit - DPit)ATAit where ΔCAit is the one-year change in
current assets ΔCLit is the one-year change in current liabilities ΔCashit is the one-year change in cash ΔSTDEBTit is
the one-year change in current liabilities ΔTPit is the income tax payable DPit is the depreciation expense and ATAit is
the average total assets over t-1 t and t+1
Note 10 The accrual quality measure Acc is defined as the decile ranking of the ratio of the standard deviation of the
residual from the regression TCAit = αt + β0t ATAit + β1tOCFit-1 + β2tOCFit + β3tOCFit+1 + β4tΔREVit + β5tPPEit + εit
where TCAit is total current accruals for year t as defined above OCFit is operating cash flow for year t ΔREVit is the
one-year change in revenues and PPEit is the property plant and equipment for year t
Note 11 The mean (median) of total accruals TCA is 00099 (00080) which is higher than the documented negative
values in Sloan (1996) due to different sampling periods The sampling period in this study is from 1986 to 2008
whereas the period in Sloan (1996) is from 1962 to 1991 As we extend the sampling period back to 1962 the mean and
median of total accruals become negative in line with Sloanrsquos (1996) evidence
Note 12 Rigorously speaking model 1 in Panel B is not a univariate regression because it also includes industry
dummy variables We call it univariate for simplicity
Note 13 Chang et al (2009) report that SOX reduces the cost of equity capital in general by improving financial
reporting quality Skaife et al (2009) document that SOX reduces equity cost via mandatory disclosures of internal
control weaknesses Amir et al (2010) likewise argue that SOX enhances the negative relation between auditor
independence and the cost of debt capital proxied by bond ratings and yields
This work is licensed under a Creative Commons Attribution 30 License
Applied Finance and Accounting Vol 2 No 1 2016
85
Akins B Ng J amp Verdi R (2012) Investor competition over information and the pricing of information asymmetry
The Accounting Review 87(1) 35-58
Armstrong C Guay W amp Weber J (2010) The role of information and financial reporting in corporate governance
and debt contracting Journal of Accounting and Economics 50(2-3) 179-234
Armstrong C Core J Taylor D amp Verrecchia V (2011) When does information asymmetry affect the cost of
capital Journal of Accounting Research 49(1) 1-40
Amir E Guan Y amp Livne G (2010) Auditor independence and the cost of capital before and after Sarbanes-Oxley
The case of newly issued public debt European Accounting Review 19(4) 633-664
Ball R Jayaraman S amp Shivakumar L (2012) Mark-to-market accounting and information asymmetry in banks
Working paper University of Chicago
Basu S (1995) Conservatism and the asymmetric timeliness of earnings (Doctoral dissertation) University of
Rochester New York USA
Basu S (1997) The conservatism principle and the asymmetric timeliness of earnings Journal of Accounting and
Economics 24(1) 3-37
Botosan C Plumlee M amp Wen H (2011) The relation between expected returns realized returns and firm risk
characteristics Contemporary Accounting Research 28(4) 1085-1122
Callen J Segal D amp Hope O-K 2010 The pricing of conservative accounting and the measurement of conservatism
at the firm-year level Review of Accounting Studies 15(1) 145-178
Carhart M (1997) On the persistence of mutual fund performance Journal of Finance 52(1) 57-82
Caskey J amp Peterson K (2009) On the estimation of the asymmetric timeliness of earnings Inference and bias
corrections Working Paper University of California at Los Angeles
Chang H Fernando G amp Liao L (2009) Sarbanes-Oxley act perceived earnings quality and cost of capital Review
of Accounting and Finance 8(3) 216-231
Chen Q Hemmer T amp Zhang Y (2007) On the relation between conservatism in accounting standards and
incentives for earnings management Journal of Accounting Research 45(3) 541-565
Corwin S amp Schultz P (2011) A Simple way to estimate bid-ask spreads from daily high and low prices Journal of
Finance 67(2) 719ndash760
Crawley M (2012) Macroeconomic consequences of accounting The effect of accounting conservatism on
macroeconomic indicators and the money supply Working paper Indiana University
Demski J amp Feltham G (1994) Market response to financial reports Journal of Accounting and Economics 17(1-2)
3-40
Diamond D amp Verrecchia R (1991) Disclosure liquidity and the cost of capital Journal of Finance 46(4)
1325-1359
Easley D Hvidkjaer S amp OrsquoHara M (2002) Is information risk a determinant of asset returns Journal of Finance
57(5) 2185-2221
Easley D amp OrsquoHara M (2004) Information and the cost of capital Journal of Finance 59(4) 1553ndash1583
Fama E amp French K (1992) The cross-section of expected stock returns Journal of Finance 47(2) 427-465
Fama E amp French K (1993) Common risk factors in the returns on stocks and bonds Journal of Financial
Economics 33(1) 3-56
Fama E amp French K (1997) Industry cost of equity Journal of Financial Economics 43(2) 153-193
Fama E amp MacBeth J (1973) Risk return and equilibrium Empirical tests Journal of Political Economy 81(3)
607-636
Fan Q amp Zhang X (2012) Accounting conservatism aggregation and information quality Contemporary
Accounting Research 29(1) 38-56
Ferreira M amp Laux P (2007) Corporate governance idiosyncratic risk and information flow Journal of Finance
62(2) 951-989
Financial Accounting Standards Board (1980) Statement of financial accounting concepts No 2 Qualitative
characteristics of accounting information Stamford CT Financial Accounting Standards Board [FASB]
Applied Finance and Accounting Vol 2 No 1 2016
86
Francis J LaFond R Olsson P amp Schipper K (2004) Cost of equity and earnings attributes The Accounting
Review 79(4) 967-1010
Gao P (2011) A contracting approach to conservatism and earnings management Working paper University of
Chicago
Gao P amp Liang P (2011) Informational feedback effect adverse selection and the optimal disclosure policy Working
paper University of Chicago
Garcia Lara J Garcia Osma B amp Penalva F (2011) Conditional conservatism and cost of capital Review of
Accounting Studies 16(2) 247-271
Gigler F Kanodia C Sapra H amp Venugopalan R (2009) Accounting conservatism and the efficiency of debt
contracts Journal of Accounting Research 47(3) 767-97
Givoly D amp Hayn C (2000) The changing time-series properties of earnings cash flows and accruals Has financial
reporting become more conservative Journal of Accounting and Economics 29(3) 287-320
Gox R amp Wagenhofer A (2009) Optimal impairment rules Journal of Accounting and Economics 48(1) 2-16
Gow I Taylor D amp Verrecchia R (2011) Earnings precision information asymmetry and the cost of capital
Evidence of information complementarities Working paper Harvard University
Guay W amp Verrecchia R (2007) Conservative disclosure Working paper University of Pennsylvania
Hughes J Liu J amp Liu J (2007) Information asymmetry diversification and cost of capital The Accounting Review
82(3) 705-730
Jorgensen B Li J amp Sadkay G (2012) Earnings dispersion and aggregate stock returns Journal of Accounting and
Economics 53(1-2) 1-20
Johnstone D (In Press) The effect of information on uncertainty and the cost of capital Contemporaneous Accounting
Research
Khan M (2008) Are accruals mispriced Evidence from tests of an intertemporal capital asset pricing model Journal
of Accounting and Economics 45(1) 55-77
Khan M amp Watts R (2009) Estimation and empirical properties of a firm-year measure of accounting conservatism
Journal of Accounting and Economics 48(2-3) 131-150
Kim B amp Pevzner M (2010) Conditional accounting conservatism and future negative surprises An empirical
investigation Journal of Accounting Public Policy 29(4) 311-329
Kim D amp Qi Y (2010) Accruals quality stock returns and macroeconomic conditions The Accounting Review 85(3)
937ndash978
Kim O amp Verrecchia R (1991) Market reaction to anticipated announcements Journal of Financial Economics
30(2) 273-309
Kothari S Shu S amp Wysocki P (2009) Do managers withhold bad news Journal of Accounting Research 47(1)
241ndash276
LaFond R amp Roychowdhury S (2008) Managerial ownership and accounting conservatism Journal of Accounting
Research 46(1) 101-135
LaFond R amp Watts R (2008) The information role of conservatism The Accounting Review 83(2) 447-478
Lambert R Leuz C amp Verrecchia R (2007) Accounting information disclosure and the cost of capital Journal of
Accounting Research 45(2) 385-420
Lambert R Leuz C amp Verrecchia R (2012) Information asymmetry information precision and the cost of capital
Review of Finance 16(1) 1-29
Lewellen J Nagel S amp Shanken J (2010) A skeptical appraisal of asset pricing tests Journal of Financial
Economics 96(2) 175-194
Li X (2010) Accounting conservatism and cost of capital An international analysis Working paper Temple
University
Llorente G Michaely R Saar G amp Wang J (2002) Dynamic volume-return relation of individual stocks Review of
Financial Studies 15(4) 1005-1047
Lobo G amp Zhou J (2006) Did conservatism in financial reporting increase after the Sarbanes-Oxley Act Initial
evidence Accounting Horizons 20(1) 57-73
Applied Finance and Accounting Vol 2 No 1 2016
87
Louis H Lys T amp Sun A (2014) Conservatism and analyst earnings forecast bias Working paper Pennsylvania
State University
Luo Y Ma M amp Wu F (2014) Earnings downside risk Working paper Fudan University
McInnis J (2010) Earnings smoothness average returns and implied cost of equity capital The Accounting Review
85(1) 315-341
McNichols M amp Trueman B (1994) Public disclosures private information collection and short-term trading
Journal of Accounting and Economics 17(1-2) 69-94
Mensah Y Song X amp Ho S (2004) The effect of conservatism on analystsrsquo annual earnings forecast accuracy and
dispersion Journal of Accounting Auditing and Finance 19(2) 159-183
Nan L amp Wen X (2011) Conservatismrsquos effects on capital structure efficiency and information quality Working
paper University of Illinois at Chicago
Newey W amp West K (1987) A simple positive semi-definite heteroskedasticity and autocorrelation consistent
covariance matrix Econometrica 55(3) 703-708
Ogneva M (2012) Accrual quality realized returns and expected returns The importance of controlling for cash flow
shocks The Accounting Review 87(4) 1415-1444
Rogers J Skinner D amp Buskirk A (2009) Earnings guidance and market uncertainty Journal of Accounting and
Economics 48(1) 90-109
Ryan S (2006) Identifying conditional conservatism European Accounting Review 15(4) 511-525
Skaife H Collins D Kinney W amp LaFond R (2009) The effect of SOX internal control deficiencies on firm risk
and cost of equity Journal of Accounting Research 47(1) 1-43
Sloan R (1996) Do stock prices fully reflect information in accruals and cash flows about future earnings The
Accounting Review 71(3) 289-315
Srivastava T amp Sunder S (2011) Timely loss recognition and the early termination of unprofitable projects Working
paper Northwestern University
Verrecchia R (2001) Essays on disclosure Journal of Accounting and Economics 32(1-3) 97-180
Vuolteenaho T (2002) What drives firm-level stock returns Journal of Finance 57(1) 233-264
Watts R (2003) Conservatism in accounting Part I Explanations and implications Accounting Horizons 17(3)
207-221
Zhang J (2008) The contracting benefits of accounting conservatism to lenders and borrowers Journal of Accounting
and Economics 45(1) 27-54
Notes
Note 1 As guidance the Financial Accounting Standards Boardrsquos Statement of Financial Accounting Concepts No 2
(1980 para 95) intones that ldquoif two estimates of amounts to be received or paid in the future are about equally likely
conservatism dictates using the less optimistic estimaterdquo The Accounting Principles Board (Statement No 4 1970 para
171) observes that ldquomanagers investors and accountants have generally preferred that possible errors in measurement
be in the direction of understatement rather than overstatement of net income and net assets This has led to the
convention of conservatismrdquo
Note 2 In particular Caskey and Petersen (2009) argue that the Basu (1997) measure uses the ratio of slope coefficients
and thus may provide biased estimates because returns are impacted by expected future profits Other market-based
conditional conservatism measures such as the C-score in Khan and Watts (2009) also share a similar weakness
Note 3 Botosan et al (2011) and Ogneva (2012) argue that cash flow news does not cancel out in large samples and
therefore asset pricing tests may induce biases when future realized returns are used to proxy for expected returns
Note 4 Akins et al (2012) Armstrong et al (2011) and Gow et al (2011) also find that information asymmetry does
not affect the cost of equity incremental to market risk if firmsrsquo stocks are traded in highly liquid and competitive
markets
Note 5 Callen et al (2010) develop the CR ratio a market-based conservatism measure from the relation between
conditional conservatism and cash flow news
Note 6 Another measure for cash flow news is earnings forecast error (Botosan et al 2011 Ogneva 2012) which is
Applied Finance and Accounting Vol 2 No 1 2016
88
not used in our main tests since it introduces estimation bias However in robustness checks we use it as an alternative
proxy for cash flow news and obtain similar results
Note 7 We utilize accrual downside risk because it is the source of earnings downside risk and has better prediction
power for negative fundamental operational shocks (Luo et al 2014)
Note 8 Henceforth we use the term return or equity return to represent the excess returns adjusted for cash flow news
provided that no confusion arises
Note 9 TCAit = (ΔCAit - ΔCLit - ΔCashit + ΔSTDEBTit + ΔTPit - DPit)ATAit where ΔCAit is the one-year change in
current assets ΔCLit is the one-year change in current liabilities ΔCashit is the one-year change in cash ΔSTDEBTit is
the one-year change in current liabilities ΔTPit is the income tax payable DPit is the depreciation expense and ATAit is
the average total assets over t-1 t and t+1
Note 10 The accrual quality measure Acc is defined as the decile ranking of the ratio of the standard deviation of the
residual from the regression TCAit = αt + β0t ATAit + β1tOCFit-1 + β2tOCFit + β3tOCFit+1 + β4tΔREVit + β5tPPEit + εit
where TCAit is total current accruals for year t as defined above OCFit is operating cash flow for year t ΔREVit is the
one-year change in revenues and PPEit is the property plant and equipment for year t
Note 11 The mean (median) of total accruals TCA is 00099 (00080) which is higher than the documented negative
values in Sloan (1996) due to different sampling periods The sampling period in this study is from 1986 to 2008
whereas the period in Sloan (1996) is from 1962 to 1991 As we extend the sampling period back to 1962 the mean and
median of total accruals become negative in line with Sloanrsquos (1996) evidence
Note 12 Rigorously speaking model 1 in Panel B is not a univariate regression because it also includes industry
dummy variables We call it univariate for simplicity
Note 13 Chang et al (2009) report that SOX reduces the cost of equity capital in general by improving financial
reporting quality Skaife et al (2009) document that SOX reduces equity cost via mandatory disclosures of internal
control weaknesses Amir et al (2010) likewise argue that SOX enhances the negative relation between auditor
independence and the cost of debt capital proxied by bond ratings and yields
This work is licensed under a Creative Commons Attribution 30 License

Applied Finance and Accounting Vol 2 No 1 2016
88
not used in our main tests since it introduces estimation bias However in robustness checks we use it as an alternative
proxy for cash flow news and obtain similar results
Note 7 We utilize accrual downside risk because it is the source of earnings downside risk and has better prediction
power for negative fundamental operational shocks (Luo et al 2014)
Note 8 Henceforth we use the term return or equity return to represent the excess returns adjusted for cash flow news
provided that no confusion arises
Note 9 TCAit = (ΔCAit - ΔCLit - ΔCashit + ΔSTDEBTit + ΔTPit - DPit)ATAit where ΔCAit is the one-year change in
current assets ΔCLit is the one-year change in current liabilities ΔCashit is the one-year change in cash ΔSTDEBTit is
the one-year change in current liabilities ΔTPit is the income tax payable DPit is the depreciation expense and ATAit is
the average total assets over t-1 t and t+1
Note 10 The accrual quality measure Acc is defined as the decile ranking of the ratio of the standard deviation of the
residual from the regression TCAit = αt + β0t ATAit + β1tOCFit-1 + β2tOCFit + β3tOCFit+1 + β4tΔREVit + β5tPPEit + εit
where TCAit is total current accruals for year t as defined above OCFit is operating cash flow for year t ΔREVit is the
one-year change in revenues and PPEit is the property plant and equipment for year t
Note 11 The mean (median) of total accruals TCA is 00099 (00080) which is higher than the documented negative
values in Sloan (1996) due to different sampling periods The sampling period in this study is from 1986 to 2008
whereas the period in Sloan (1996) is from 1962 to 1991 As we extend the sampling period back to 1962 the mean and
median of total accruals become negative in line with Sloanrsquos (1996) evidence
Note 12 Rigorously speaking model 1 in Panel B is not a univariate regression because it also includes industry
dummy variables We call it univariate for simplicity
Note 13 Chang et al (2009) report that SOX reduces the cost of equity capital in general by improving financial
reporting quality Skaife et al (2009) document that SOX reduces equity cost via mandatory disclosures of internal
control weaknesses Amir et al (2010) likewise argue that SOX enhances the negative relation between auditor
independence and the cost of debt capital proxied by bond ratings and yields
This work is licensed under a Creative Commons Attribution 30 License
![Biases in market-based measure of the conditional conservatism€¦ · conservatism is an intrinsic characteristic of accounting. In this sense, Sterling [54] claims that conservatism](https://static.fdocuments.in/doc/165x107/5f7dcb3a83aaec748a1f97a1/biases-in-market-based-measure-of-the-conditional-conservatism-conservatism-is-an.jpg)