CONDENSED INTERIM CONSOLIDATED REPORT AT 30 … · Giorgio Sangiorgio General Management General...
155
Credito Valtellinese S.p.A. Credito Valtellinese S.p.A. Credito Valtellinese S.p.A. Credito Valtellinese S.p.A. Registered Offices in Piazza Quadrivio 8 - Sondrio, Italy Tax code and Sondrio Company Registration No. 00043260140 - Register of Banks No. 489 Parent of the Credito Valtellinese Banking Group - Register of Banking Groups No. 5216.7 Website: http://www.creval.it E-mail: [email protected] Data at 30 June 2018: Share Capital EUR 1,916,782,886.55 Member of the Interbank Guarantee Fund CONDENSED INTERIM CONSOLIDATED REPORT AT 30 JUNE 2018
Transcript of CONDENSED INTERIM CONSOLIDATED REPORT AT 30 … · Giorgio Sangiorgio General Management General...

Credito Valtellinese S.p.A.Credito Valtellinese S.p.A.Credito Valtellinese S.p.A.Credito Valtellinese S.p.A. Registered Offices in Piazza Quadrivio 8 - Sondrio, Italy
Tax code and Sondrio Company Registration No. 00043260140 - Register of Banks No. 489 Parent of the Credito Valtellinese Banking Group - Register of Banking Groups No. 5216.7
Website: http://www.creval.it E-mail: [email protected] Data at 30 June 2018: Share Capital EUR 1,916,782,886.55
Member of the Interbank Guarantee Fund
CONDENSED INTERIM CONSOLIDATED REPORT AT 30 JUNE 2018

2
COMPANY OFFICERS OF CREDITO VALTELLINESE
in office at 9 August 2018
Board of Directors
Chairman Miro Fiordi
Deputy Chairman Michele Colombo
Managing Director Mauro Selvetti
Directors Elena Beccalli
Mariarosa Borroni
Gabriele Cogliati
Giovanni De Censi
Flavio Ferrari
Maria Elena Galbiati
Paolo Stefano Giudici
Gionni Gritti
Livia Martinelli
Tiziana Mevio
Paolo Scarallo
Alberto Sciumè
Mauro Selvetti
Board of Statutory Auditors Chairman Angelo Garavaglia
Standing Auditors Giuliana Pedranzini
Luca Francesco Franceschi
Substitute Auditors Edoardo Della Cagnoletta
Giorgio Sangiorgio
General Management General Manager Mauro Selvetti
Substitute Deputy General Manager Umberto Colli
Deputy General Managers Saverio Continella
Vittorio Pellegatta
Enzo Rocca
Heads of the Main Corporate Functions
Chief Risk Officer (CRO) Fabio Salis
Chief Operating Officer (COO) Umberto Colli
Chief Lending Officer (CLO) Vittorio Pellegatta
Chief Financial Officer (CFO) Ugo Colombo
Chief Commercial Officer (CCO) Roberto Tarricone
Manager in charge of financial reporting Simona Orietti
Audit Company KPMG S.p.A.

3
Contents COMPANY OFFICERS OF CREDITO VALTELLINESE ........................................................................... 2
CONSOLIDATED HIGHLIGHTS AND ALTERNATIVE PERFORMANCE INDICATORS AT 30 JUNE
2018 ........................................................................................................... 4
ORGANISATIONAL MODEL AND BREAKDOWN OF THE CREDITO VALTELLINESE BANKING
GROUP .......................................................................................................... 6
REPORT ON OPERATIONS .................................................................................... 8 Events of bank operations during the first half of the year ........................................................................... 11
Information on the main statement of financial position items and on consolidated income statement figures .................................................................................................................................................. 15
Events after the close of the half-year .......................................................................................................... 29
Current-year outlook ................................................................................................................................... 31
CONDENSED INTERIM CONSOLIDATED FINANCIAL STATEMENTS .................................. 33
Condensed interim consolidated financial statements ...................................................... 34 Notes to the condensed interim consolidated financial statements .................................... 41
CERTIFICATION OF THE CONDENSED INTERIM CONSOLIDATED FINANCIAL STATEMENTS
PURSUANT TO ARTICLE 81-TER OF CONSOB REGULATION NO. 11971/99.................. 153REPORT OF THE AUDITORS ................................................................................ 154

4
CONSOLIDATED HIGHLIGHTS AND ALTERNATIVE
PERFORMANCE INDICATORS AT 30 JUNE 2018
STATEMENT OF FINANCIAL POSITION DATA 30/06/2018 31/12/2017 Change
(in thousands of EUR)
Loans and receivables with customers 21,434,668 16,680,944 28.50%
Financial assets and liabilities at fair value 2,134,033 4,300,828 -50.38%
Non-current assets held for sale and disposal groups 89,471 3,955 n.s.
Total assets 26,033,597 24,956,824 4.31%
Direct funding from customers 20,414,126 19,631,283 3.99%
Indirect funding from customers 10,437,811 11,273,213 -7.41%
of which:
- Managed funds 7,331,272 7,801,592 -6.03%
Total funding 30,851,937 30,904,496 -0.17%
Equity 1,493,059 1,442,094 3.53%
SOLVENCY RATIOS 30/06/2018 31/12/2017
Common Equity Tier 1 capital / Risk-weighted assets (CET1 capital ratio) 14.0% 10.6%
Tier 1 capital / Risk-weighted assets (Tier 1 capital ratio) 14.0% 10.6%
Total own funds / Risk-weighted assets (Total capital ratio) 15.5% 12.5%
FINANCIAL STATEMENT RATIOS 30/06/2018 31/12/2017
Indirect funding from customers / Total funding 33.8% 36.5%
Managed funds / Indirect funding from customers 70.2% 69.2%
Direct funding from customers / Total liabilities and equity 78.4% 78.7%
Loans and receivables with customers / Direct funding from customers 105.0% 85.0%
Loans and receivables with customers / Total assets 82.3% 66.8%
CREDIT RISK 30/06/2018 31/12/2017 Change
Net bad loans (in thousands of EUR) 228,456 657,512 -65.25%
Other net doubtful loans (in thousands of EUR) 739,678 1,540,116 -51.97%
Net non-performing loans (in thousands of EUR) 968,134 2,197,628 -55.95%
Net bad loans / Loans and receivables with customers 1.1% 3.9%
Other net doubtful loans / Loans and receivables with customers 3.5% 9.2%
Net non-performing loans / Loans and receivables with customers 4.5% 13.2%
Coverage ratio of bad loans 71.5% 62.3%
Coverage ratio of other doubtful loans 36.7% 32.3%
Coverage ratio of non-performing loans 50.9% 45.3%
Loans and receivables with customers classified under assets held for sale are not included.

5
INCOME STATEMENT DATA 1st half of 2018
1st half of 2017
Change
(in thousands of EUR)
Net interest income 178,879 198,772 -10.01%
Operating income 340,979 379,043 -10.04%
Operating costs (306,956) (255,880) 19.96%
Operating profit 34,023 123,163 -72.38%
Pre-tax loss from continuing operations (28,232) (190,523) -85.18%
Post-tax profit (loss) from continuing operations 2,545 (193,000) -101.32%
Profit (loss) for the period 824 (194,828) -100.42%
ORGANISATIONAL DATA 30/06/2018 31/12/2017 Change
Number of employees 3,902 3,819 2.17%
Number of branches 363 412 -11.89%
OTHER FINANCIAL INFORMATION 1st half of
2018 1st half of
2017
Cost/Income ratio (*) 66.5% 66.9%
(*) Figure of the first half of 2018 calculated net of non-recurring expenses related to the implementation of the "Solidarity Fund" (EUR 66,497 thousand), of ordinary and extraordinary contributions paid to SRF (EUR 12,611 thousand) and of contributions for the DTA fee (EUR 1,078 thousand); figure of the first half of 2017 calculated net of ordinary contributions paid to SRF (EUR 7,922 thousand), DTA fee contributions (EUR 1,077 thousand) and non-operating income related to the implementation of the “2016 Solidarity Fund” (EUR 6,816 thousand) With reference to the financial highlights and alternative performance indicators represented above, the amounts used for their calculation, if not specified in the notes to the tables, are indicated in “Information on the main statement of financial position items and on consolidated income statement figures”. These indicators, prepared by the management, provide additional information to investors since they facilitate the understanding of statement of financial position and income statement, they should not be considered as a replacement of those required by IAS/IFRS and are not always comparable with those provided by other banks.

6
ORGANISATIONAL MODEL AND BREAKDOWN OF THE
CREDITO VALTELLINESE BANKING GROUP
The Credito Valtellinese Banking Group currently consists of the territorial bank Credito
Valtellinese, specialised companies and special purpose companies for the provision of
services - with a view to achieving synergies and economies of scale - to all the companies
of the Group. The current group structure is graphically represented below.
*Insurance companies subject to management and coordination by Credito Valtellinese pursuant to Articles 2497 et sequitur of the Italian Civil Code. At 30 June 2018, the Credito Valtellinese Group is present in Italy with a network of 363
Branches, in eleven regions, through the territorial bank characterising the “Market
Segment”:
- Credito Valtellinese S.p.A., the Parent, present with its own network of 363 branches,
most of which - 159 - are in Lombardia, as well as in Valle d'Aosta, Piemonte, Veneto,
Trentino Alto Adige, Emilia Romagna, Toscana, Lazio, Marche, Umbria and Sicilia.
The following companies characterise the “Specialised Companies Segment”:
- Global Assicurazioni S.p.A.1, a multifirm insurance agency specialised in the brokerage
and management of standard insurance policies in favour of individuals and household
customers.
- Global Broker S.p.A.2, insurance broker specialised in the brokerage and management
of insurance policies in favour of companies.
- Creval PiùFactor S.p.A., Group company exclusively dedicated to activities granting
loans to the public pursuant to Articles 106 et sequitur of Italian Legislative Decree no. 385
of 1 September 1993 (“Consolidated Banking Act”).
- Claris Factor S.p.A., Group company dedicated to the management of business loans
and other loans pursuant to Articles 106 et sequitur of Italian Legislative Decree no. 385 of
1 September 1993 (“Consolidated Banking Act”).
1 Company subject to management and coordination by Credito Valtellinese and therefore included in the consolidation scope, even if not included in the Banking Group, pursuant to the supervisory provisions, in that it carries out insurance activities. 2 See previous note.
Credito Valtellinese Creval Sistemi e Servizi
Stelline Real Estate
Global Assicurazioni*
Global Broker*
Creval PiùFactor
MARKET SPECIALISED COMPANIES CORPORATE CENTRE
Claris Factor

7
The companies providing services complementary to banking business characterising the
“Corporate Centre Segment” complete the Group:
- Creval Sistemi e Servizi S.c.p.A. company that manages and develops activities relating
to Information and Communication Technology (ICT), organisation, back office, real estate
services and support processes.
- Stelline Real Estate S.p.A., R.E.o.Co. (Real Estate Owned Company), Group
company exclusively dedicated to asset repossessing.

8
REPORT ON OPERATIONS
The general economic framework3
The global economy continues to grow at a good pace, but some risks are materialising.
The American economy is expanding at a high rate, supported by the significant tax
incentives introduced by the Trump administration and by a monetary policy that is still
easy-going.
Europe, although remaining in an expansive cyclical phase, started the year lower than
expected; China continues to grow at rates close to 6%, albeit slightly decreasing.
During the second quarter, three drivers gained strength, which were already weighted in
the framework outlined in Prometeia's Report in March. At present, these developments do
not constitute a significant deviation from what is included in the Bank's valuations.
The first factor to be taken into consideration is related to the gradual increase in oil prices
that began in the summer of 2017: it contributed to the strengthening of inflation indices
worldwide and to a prospective shift towards greater monetary restriction by central banks.
The second feared aspect in the publication of the Prometeia scenario in March, but which
became concrete with the publication of Eurostat data on GDP of the Eurozone, is that the
growth of the main countries in the area was surprisingly below expectations in the first
quarter. In part, the slowdown reflects a return of growth to a more sustainable pace after
the exceptional result in 2017, and in part, it reflects increased uncertainty about future
prospects. Prometeia forecasts indicate that growth will continue for the coming quarters at
the pace of the beginning of the year. Therefore, the growth forecast for 2018 in the
Eurozone was revised from +2.3% to +2.1% between March and July.
The third aspect concerns the exacerbation of tensions related to the protectionist policies
of the Trump Administration compared to the scenario formulated in March. To date,
Prometeia's baseline scenario does not foresee that this escalation will trigger a real trade
war. However, it should be noted that, in this context, uncertainty among operators has
increased and is reflected in the fall in share prices in the sectors most affected. The
macroeconomic risks related to the protectionist positions of the US Administration are
related to the reduction in trade, which in turn could affect the confidence and investment
plans of companies operating in international markets.
The Italian economic scenario shows continued growth, despite signs of a slowdown in
spring.
In the first three months of this year, Italy's GDP rose by 0.3%, a slight slowdown compared
to the last quarter of 2017. Growth forecasts for 2018 were revised downwards from 1.4%
to 1.2%. The Bank of Italy estimates (consistent with the Prometeia forecast) show in the
second quarter that GDP expansion would have continued at a rate just below that of the
previous period (0.2% compared to 0.3%). In June, the Ita-coin indicator developed by the
Bank of Italy continued to fall, recording a slowdown in industrial activity and the economic
cycle. The Purchasing Managers’ Indexes give slightly more favourable signals; the latest
improved measurements restore confidence at least in the stability of expansion also in the
third quarter of the year.
3 The incorporated scenario for the measurement of the financial statements consistent with the new international
standards (IFRS 9) is based on Prometeia's Forecast Report in March 2018. For a comprehensive description of the
economic, credit and financial situation, as of the date of this report, the following documentary sources have been
used: Prometeia - Forecast Report, March 2018; Prometeia - Forecast Report, July 2018. Bank of Italy Economic
Bulletin no. 3/2018.

9
The March baseline scenario for Italy, assumed in the internal models and still valid, includes
a slowdown in the tax consolidation process, in line with pre-election announcements. In
any case, given the envisaged macroeconomic scenario, the path would allow a moderate
decline in public debt in relation to output, a condition of primary importance for ensuring
the stability of the country.
Recent statements by some Government representatives indicated their intention to
manage public accounts prudently and within European rules. This reassured us about the
country's prospects but, as the prices of government bonds and banking sector shares show,
it did not completely dispel the uncertainties that arose during May.
Comparing the baseline scenario of March with that published by Prometeia in July, the
forecast horizon taken as a reference to 2020 shows the increase in inflation forecasts, an
improvement in real estate prices and an upward revision of short-term interest rate
expectations. The forecasts for the spread between the Italian and German ten-year
benchmarks were revised upwards in line with the phase of instability experienced in May
related to the formation of the new government.
The Italian banking system
In the banking scenario of March, Prometeia reported that “Credit will be able to grow at a
faster rate in the three-year forecast period”. This phrase was then re-adjusted in the July
2018 Report with “A difficult recovery for credit for businesses”, which indicates greater
caution in the forecast following the rise in the risk of trade war, accentuated by the actions
carried out and threatened by the US Administration. Even though the economy has been
growing for several quarters together with investment, the credit granted to businesses has
been modest in recent quarters. Loans to households was better, supported by good lending
conditions and the stabilisation of the real estate market.
In addition to the reasons listed above, from this year there is also the introduction of the
new accounting standard IFRS 9, which envisages higher provisions for performing but “high
risk” loans, and which therefore is likely to make banks even more careful in selecting the
companies to be granted loans.
The expected acceleration in the process of reducing non-performing loans, which will lead
to an improvement in asset quality, may help to offset this trend in the coming quarters. A
process that in turn generates a positive prospective contribution to profitability.
The most recent figures show that, in Italy, the trend in bank loans, adjusted for those
securitised or otherwise disposed of, strengthened in April (3.0% from 2.4% in March).
The sustained growth of loans to Italian households continued and, for almost two years,
has been in line with the average of the countries in the Eurozone (2.9% in April).
In April, loans to businesses grew by EUR 3 billion mainly on short maturities (2.2% per
year) and the first advances confirm an increase also in May. The flow of funds in the first
four months of the year was approximately 14 billion (-5.5 billion in the same period of
2017).
In April, loans to households increased by EUR 0.7 billion (more than EUR 5 billion from the
beginning of the year), with an annual growth of 2.9%, substantially confirmed in May and
in line with the EMU average. The increase concerned loans for purchasing homes and
consumer credit (8.6% and 1.9% per year).
The rate on new loans to businesses in April fell by 7bp. The economic trend of the rate on
new loans of less than EUR 1 million, mainly addressed to SMEs, is similar, whereas, if
considered compared to April 2017, the reduction is more significant, equal to 22bp. Interest
rates on loans to households for the purchase of homes also fell (-4bp).
Bank deposits in the first four months of the year fell by EUR 7 billion (-7.2% per year) as
a result of a reduction in internal funding of EUR 17 billion, entirely attributable to a
reduction in the stock of bonds issued, and a positive contribution of foreign funding of EUR

10
10 billion. The increase in total funding of EUR 1.6 billion was accompanied by an increase
in current accounts, mainly for households, whereas, with a reduction of more than 6 billion,
the process of accumulating liquidity recorded in recent years by businesses seems to have
been interrupted.
The financial market in Italy
After a good start, 2018 was characterised by a temporary return of volatility on the stock
markets between late January and February. In fact, at the end of January, fears of an
inflationary blaze in America triggered a sharp fall in share indices, up to over 10%, and a
sharp rebound in volatility to levels that had not been experienced in years.
The Italian stock market also suffered from the January sell-off, but then began to rise again
along with all the other indices regardless of the political uncertainty that was expected both
before and after the general elections in early March. To coincide with the new government
formed in May, the uncertainty of international investors on Italy materialised again with
the rise in the spread between Italian and German government bonds to close to 300 basis
points for the ten-year maturity. The interest rate curve was characterised by a strong
growth in short-term rates, even stronger than in long-term rates. Tensions were mostly
limited to the Italian market, in that there were limited contaminating effects on other
European countries. The spread on government bonds has partly recouped but remains
higher than the values prevailing at the beginning of May.
There was no rebound in the FTSE MIB or the banking sub-index, which is the one that
suffered the most, having lost about 20% of its value since mid-May.

11
Events of bank operations during the first half of the year
The most important events that characterised the management of the Creval Group during
the first half of 2018 and that, if necessary, were the subject-matter of specific disclosures
to markets are mentioned below.
2018-2020 Business Plan
In line with established times, activities aimed at achieving priority objectives set out in the
2018-2020 Business Plan, approved in November last year, continued.
Specifically:
Equity enhancement
On 20 March 2018, with the full subscription of the newly issued shares, without the
intervention of first-allocation sub-underwriters and the underwriting syndicate, the capital
increase (“Project Renaissance”) was concluded for a total amount (including share
premium) of EUR 699,660,561.30. The transaction, approved by the Extraordinary
Shareholders' Meeting of 19 December 2017, strengthened significantly the company's
equity condition.
De-risking and asset quality actions
An agreement was signed on 6 April 2018 for the sale of a portfolio of non-performing
secured loans - consisting of credit exposures mainly to real estate companies, mostly
classified as unlikely to pay (UTP) - for a gross book value (GBV) of more than EUR 245
million, at a price higher than 43% of the GBV.
An agreement was reached on 8 May 2018 for the sale to Credito Fondiario of a portfolio of
non-performing secured loans – consisting of credit exposures mainly to real estate
companies, classified as UTP and bad loans – for a GBV of EUR 222 million, at a price close
to 41% of the GBV.
The disposal through a securitisation of a portfolio of bad debts for a Gross Book Value
(“GBV”) of approximately EUR 1.6 billion at the cut-off date (31 December 2017) was
completed on 13 June 2018 (known as “Project Aragorn”), by transferring this portfolio
to a securitisation vehicle established pursuant to Italian Law 130/99, and this vehicle
issuing three different classes of ABS securities:
- a senior tranche of EUR 509.5 million, with expected rating in line with the requirements
of the regulations relating to the State guarantee (GACS),
- a mezzanine tranche with rating and a junior tranche of EUR 66.8 million and EUR 10
million, respectively.
The securities of the senior tranche – for which the State guarantee (GACS) was requested
– are fully considered by Credito Valtellinese, whereas the mezzanine and junior tranches
were placed by 95% with an institutional counterpart at the end of a competitive process.
The Aragorn portfolio was derecognised in accounting terms in June, whereas the prudent
derecognition is subject to obtaining GACS.
With these transactions, the objective defined in the Business Plan is almost completely
achieved especially with regard to the “deconsolidation of non-performing loans for an
equivalent amount up to EUR 2.1 billion, through a new securitisation transaction (“Project
Aragorn”), with possible use of the State guarantee (GACS) for a GBV of approximately
EUR 1.6 billion and further sales of non-performing loans of EUR 500 million at the end of a
competitive process (“Project Gimli”)”.

12
The decrease in non-performing loans during the half-year was accompanied by a
strengthening of the coverage levels that, partly as a result of the impact of the first-time
adoption of IFRS 9, had risen to 50.9% at 30 June 2018 compared to 45.3% at 31 December
2017. In particular, coverage for bad loans was 71.5% (62.3% at 31 December 2017),
among the highest in the Italian banking system.
At the same time, activities aimed at the adoption of advanced AIRB models for determining
prudential requirements continued, after receipt of the authorisations from the relevant
Supervisory Authorities. The inspection of Bank of Italy for the validation of the AIRB models
was completed in the half-year.
Operational efficiency and cost control
On 16 April, an agreement was signed with the trade unions for managing redundancies,
through the use of the Solidarity Fund for the credit sector. The agreement envisaged an
early retirement plan for at least 170 employees who would have met the pension
requirements by 31 December 2024 and who would have been able to access on a voluntary
basis the extraordinary benefits of the Solidarity Fund effective as from 1 July 2018. At the
end of the period, 219 applications were received, in addition to the objective set out in the
Business Plan, which was thus fully achieved, making use only of voluntary schemes. The
219 employees had access to the benefits of the Solidarity Fund effective as from 1 July
2018. The decrease in the workforce will cut personnel costs for about EUR 9 million in 2018
and about EUR 18 million per year as from 2019, against costs for implementing the Fund
totalling approximately EUR 66.5 million, fully recognised in the income statement in the
current year.
The operating network optimisation plan was defined, with the closure of a further 50
branches from 27 May 2018, and the transformation of 4 branches into branches of the
“Bancaperta” line. The total number of branches is therefore 363, in line with the target
structure of the operating network of 350 branches at the end of 2018 set out in the business
plan.
On 18 June, the deed of merger into Credito Valtellinese S.p.A. of Credito Siciliano S.p.A.
was signed (“Project One Bank”). The merger was legally effective as from 25 June 2018
as established in the deed of merger.
On 29 June 2018, the acquisition of 100% of the share capital of Claris Factor S.p.A. by
Veneto Banca S.p.A. in compulsory winding-up was completed for a consideration of EUR 5
million. The acquisition of Claris Factor will make it possible to achieve the development
targets for factoring operations more quickly and effectively, particularly once the merger
of Claris Factor S.p.A. and Creval PiùFactor S.p.A., a company of the Creval Group
specialising in the factoring sector, has been completed by the end of 2018.
The plan to merge CrevalPiù Factor into Claris Factor - which after the merger will be known
as CrevalPiù Factor - was approved by the Boards of Directors of the companies concerned
on 8 August 2018.
Development of the business model - Reorganisation of bancassurance activities
Still in line with the objectives set out in the 2018-2020 Strategic Plan, activities aimed at
defining a new operating model for the bancassurance business continued during the half-
year. These activities led to the definition of long-term strategic partnerships with Crédit
Agricole Assurances SA (“CAA”) in the Life segment and with the Insurance Group Ri-Fin
S.r.l. (“Rifin”) in the Non-Life segment, respectively.
For details of these agreements - signed on 24 July 2018, i.e. after the end of the half-year
- please refer to the specific section of this report.

13
The operational structure, the customers and the commercial
performance indicators
The territorial network
At 30 June 2018, the branches forming the territorial network of Credito Valtellinese are
363 as represented below.
Other distribution channels
The following other distribution channels complete the operational structure:
ORGANISATIONAL DATA 30/06/2018 31/12/2017 Change
Number of ATMs 534 558 -4.30%
Number of POS 26,711 27,162 -1.66%
Bancaperta line users 291,998 283,864 2.87%
Interbank Corporate Banking contracts 17,932 17,836 0.54%
At the end of June 2018, “active” Internet users in the Creval Group - customers who have
performed at least one transaction in the last six months - total 291,998, compared to
283,864 at the end of December of the prior year, with an increase of 2.87%.
CREDITO
VALTELLINESE 363
159 BRANCHES 8 BRANCHES
12 BRANCHES
6 BRANCHES
25 BRANCHES
2 BRANCHES
94 BRANCHES
30 BRANCHES
8 BRANCHES
18 BRANCHES
1 BRANCH

14
Commercial performance indicators
At 30 June 2018, the retention rate is equal to approximately 95.29%, whereas the cross-
selling indicator - equal to 3.91 products on average per customer (calculated on the basis
of the “ABI method”), attests also a high degree of optimisation of commercial relations.
The personnel
At the end of June 2018, the registered workforce of the companies included in the
consolidation scope of the Group consisted of 3,894 collaborators (compared to 3,957
resources at the end of 2017). These include 13 collaborators employed by companies or
entities outside the Group, among them Fondazione Gruppo Credito Valtellinese, Global
Assistance, the Pension Fund for the Employees of the Credito Valtellinese Group and Cerved
Group.
In terms of professional categories, the total workforce of 3,894 can be broken down as
follows:
- 50 executives;
- 1,501 middle managers;
- 2,343 workers in other professional categories.
Workforce by contract category at 30 June 2018
EXECUTIVES
1.3%
MIDDLE MANAGERS
38.5%
PROFESSIONAL
CATEGORIES
60.2%
EXECUTIVES
MIDDLE MANAGERS
PROFESSIONAL CATEGORIES

15
Information on the main statement of financial position items and on consolidated income
statement figures
The interim results are commented upon in summary format, drawn up on a consolidated
basis, reclassified according to the presentation criteria considered most appropriate for
presenting a fair view of the Group's operating performance.
The aggregates and reclassifications regarding items of the financial statements as
envisaged in Bank of Italy Circular no. 262/05 as amended are detailed in the Notes to the
financial statements.
The period of comparison, referring to the 2017 financial year, has been restated in a
reclassified form based on the new financial statements included the 5th update of Bank of
Italy Circular no. 262/05 that implements IFRS 9 with the consequent changes introduced
in other international accounting standards, and considers the new international accounting
standard IFRS 15 “Revenue from Contracts with Customers”. The accounting balances at 31
December 2017 were reclassified to the new accounting items without applying the new
classification and measurement criteria. The notes to the financial statements show the
effects of the first-time adoption of IFRS 9 and contain reconciliation statements.
The reclassified consolidated statement of financial position is shown below. (in thousands of EUR)
ASSETS 30/06/2018 31/12/2017 Change
Cash and cash equivalents 150,237 197,829 -24.06%
Financial assets at fair value through profit or loss 243,265 20,681 n.s.
Financial assets at fair value through other comprehensive income
2,026,565
4,419,352
-54.14%
Loans and receivables with banks 596,586 2,033,413 -70.66%
Loans and receivables with customers 21,434,668 16,680,944 28.50%
Hedging derivatives - 199 -100.00%
Equity investments 25,167 24,371 3.27%
Property, equipment and investment property and intangible assets (1)
487,760 486,524 0.25%
Non-current assets held for sale and disposal groups 89,471 3,955 n.s.
Other assets (2) 979,878 1,089,556 -10.07%
Total assets 26,033,597 24,956,824 4.31%
(1) Include the items "90. Property, equipment and investment property" and "100. Intangible assets" (2) Include the items “110. Tax assets” and “130. Other assets"

16
(in thousands of EUR)
LIABILITIES 30/06/2018 31/12/2017 Change
Due to banks 3,124,573 3,143,189 -0.59%
Direct funding from customers (1) 20,414,126 19,631,283 3.99%
Financial liabilities held for trading 198 713 -72.23%
Hedging derivatives 135,599 138,691 -2.23%
Other liabilities 622,929 421,399 47.82%
Provisions for specific purpose (2) 242,602 174,103 39.34%
Equity attributable to non-controlling interests 511 5,352 -90.45%
Equity (3) 1,493,059 1,442,094 3.53%
Total liabilities and equity 26,033,597 24,956,824 4.31%
(1) Includes items "10. Financial liabilities at amortised cost: b) Due to customers; c) Securities issued". (2) Includes items "60. Tax liabilities, “90. Post-employment benefits" and "100. Provisions for risks and charges" (3) Includes items "120. Valuation reserves", "150. Reserves", "160. Share premium reserve", "170. Share capital", "180. Treasury shares", and "200. Profit (loss) for the period".
Loans and receivables with customers
At 30 June 2018, loans and receivables with customers amounted to EUR 21.4 billion
(of which EUR 4.9 billion in government bonds) compared to EUR 16.7 billion at 31
December 2017. Excluding government bonds and adjustments made at the time of FTA of
IFRS 9, the aggregate increased by 2.8%, mainly as a result of the increase in new
disbursements in the half-year, which totalled EUR 1.2 billion, up 13% year-on-year (of
which EUR 712 million in the second quarter, up by more than 40% compared to the
previous quarter), confirming the ongoing recovery of commercial activity. Credit quality
also improved: EL “expected loss” equal to 34bp for the “individuals” segment and 29bp for
the “SME and corporate” segment.
(in thousands of EUR) 30/06/2018 31/12/2017 Change
Current accounts 2,230,798 2,022,049 10.32%
Reverse repurchase agreements 307,479 712,064 -56.82%
Mortgages 9,422,792 9,309,630 1.22%
Credit cards, personal loans and salary-backed loans 221,013 264,821 -16.54%
Finance leases 350,208 377,218 -7.16%
Factoring 145,088 - -
Other loans 1,891,453 1,319,920 43.30%
Debt instruments 5,897,703 477,614 n.s.
Total net performing loans and receivables 20,466,534 14,483,316 41.31%
Bad loans 228,456 657,512 -65.25%
Unlikely to pay 642,410 1,436,787 -55.29%
Past due non-performing loans 97,268 103,329 -5.87%
Total net non-performing loans and receivables 968,134 2,197,628 -55.95%
Total net loans and receivables 21,434,668 16,680,944 28.50%

17
Net non-performing loans not reclassified to assets held for sale (Non-Performing Exposure,
NPE) totalled EUR 968 million at the end of the period, down by EUR 1.2 billion (-56%)
compared to EUR 2.2 billion at the end of December 2017. The decrease is due to the sale
of non-performing loans during the half-year and to the adjustments made at the time of
FTA of IFRS 9.
In detail, net bad loans amounted to EUR 228.5 million, down by 65% from EUR 657.5
million at the end of 2017; net unlikely to pay reached EUR 642.4 million, down by 55%
from EUR 1,436.8 million at the end of 2017; net past due non-performing loans reached
EUR 97.3 million, down by 6% from EUR 103.2 million at the end of 2017. The coverage
ratio of non-performing loans (excluding those reclassified to discontinued operations) stood
at 50.9%, up compared to 45.3% of 31 December 2017 despite the disposals made. If we
also include removals, the total coverage ratio rises to 53.8%.
(in thousands of EUR)
30/06/2018 31/12/2017
Gross amount
Impairment losses
Carrying amount
coverage % Gross
amount Impairment
losses Carrying amount
coverage %
Non-performing loans
Bad loans 801,812 -573,356 228,456 71.5% 1,745,548 -1,088,036 657,512 62.3%
Unlikely to pay 1,054,153 -411,743 642,410 39.1% 2,162,940 -726,153 1,436,787 33.6%
Past due non-performing loans 114,393 -17,125 97,268 15.0% 112,347 -9,018 103,329 8.0%
Total non-performing loans 1,970,358 -1,002,224 968,134 50.9% 4,020,835 -1,823,207 2,197,628 45.3%
Performing loans - stage 1 18,641,418 -31,986 18,609,432 0.17% 14,545,619 -62,303 14,483,316 0.43%
Performing loans - stage 2 1,943,891 -86,789 1,857,102 4.46% - - -
Total loans and receivables with customers
22,555,667 -1,120,999 21,434,668 18,566,454 -1,885,510 16,680,944
The coverage ratio is calculated as the ratio between impairment losses and the gross amount.
Loans and receivables with customers classified under assets held for sale are not included.
Assets held for sale, equal to EUR 89 million, are mainly represented by non-performing exposures held for sale (known as “Project Gimli 2”).
The coverage ratio of performing loans and receivables with customers is 0.75% excluding government bonds.
Funding from customers
Direct funding amounted to EUR 20.4 billion, recording an increase of 4.0% compared to
31 December 2017 and 3.1% compared to 31 March 2018. Specifically, there was an
increase in the current accounts and deposit accounts component and an increase in
deposits with central counterparties (Cassa Compensazione e Garanzia); the decline in the
retail and institutional bond component continued in line with the policy of reducing the
most expensive forms of funding.
(in thousands of EUR) 30/06/2018 31/12/2017 Change
Current accounts and sight deposits 12,513,006 12,273,362 1.95%
Reverse repurchase agreements 4,457,886 3,129,229 42.46%
Term deposits 841,816 808,772 4.09%
Other 544,677 630,238 -13.58%
Due to customers 18,357,385 16,841,601 9.00%
Securities issued 2,056,741 2,789,682 -26.27%
Total direct funding from customers 20,414,126 19,631,283 3.99%

18
Indirect funding amounted to EUR 10.4 billion compared to EUR 11.3 billion at the end of
December 2017. The negative trend of the markets had an impact on the aggregate,
especially in the second quarter of the year, which affected both managed and administered
components.
(in thousands of EUR) 30/06/2018 31/12/2017 Change
Asset management 1,350,383 1,821,728 -25.87%
Mutual funds 3,250,892 3,229,276 0.67%
Insurance funds 2,729,997 2,750,588 -0.75%
Total Managed funds 7,331,272 7,801,592 -6.03%
Assets under administration 3,106,539 3,471,621 -10.52%
Total indirect funding 10,437,811 11,273,213 -7.41%
Financial assets and liabilities at fair value
Financial assets at fair value amounted to EUR 2.1 billion. Of these, EUR 1.9 billion were
represented by Italian government bonds, mainly recognised in the portfolio of Financial
assets at fair value through other comprehensive income. The valuation reserve on
securities recognised as financial assets at fair value through other comprehensive income,
recorded among equity items net of tax effects, was negative for EUR 35.9 million and
almost entirely related to government bonds.
(in thousands of EUR) 30/06/2018 31/12/2017 Change
Financial assets and liabilities at fair value through profit or loss
Debt instruments 13,162 15,716 -16.25%
Equity instruments and OEIC units. 229,529 4,447 n.s.
Derivative financial instruments with positive fair value 574 518 10.81%
Total assets 243,265 20,681 n.s.
Derivative financial instruments with negative fair value -198 -713 -72.23%
Total assets and liabilities 243,067 19,968 n.s.
Financial assets at fair value through other comprehensive income
Debt instruments 1,961,769 4,170,863 -52.96%
Equity instruments 64,796 248,489 -73.92%
Total 2,026,565 4,419,352 -54.14%
Hedging derivatives -135,599 -138,492 -2.09%
Financial assets and liabilities 2,134,033 4,300,828 -50.38%
The liquidity position
The counterbalancing capacity at 3 months on 8 August 2018 amounted to EUR 5.4 billion
(of which EUR 3.1 billion unencumbered), an increase compared to the figure at 31 March
2018 of EUR 4.3 billion, thanks to the securitisation of performing mortgage and unsecured
loans granted to small and medium-sized enterprises, which was completed on 30 July, for
a total amount of EUR 1.5 billion.

19
Equity investments
The total carrying amount of equity investments at 30 June 2018, accounted at equity, was
EUR 25 million.
The portfolio represents only equity investments in companies subject to joint control and
to significant influence - companies in which Credito Valtellinese has a direct or indirect
holding of at least 20% of voting rights, “potential” voting rights or, albeit with a lower
percentage, has the power to influence financial and management policy through specific
legal positions.
The main equity investments are summarised below.
% equity investment
30/06/2018 31/12/2017
Carrying amount (thousands of EUR)
Generalfinance S.p.A. 46.81% 16,005 15,906
Global Assistance S.p.A. 40.00% 5,073 4,734
Creset - Crediti, Servizi e Tecnologie S.p.A. 40.00% 2,561 2,508
Other 1,528 1,223
Total 25,167 24,371

20
Equity attributable to the owners of the parent
The equity attributable to the owners of the parent at 30 June 2018 amounted to EUR 1,493
million compared to EUR 1,442 million at 31 December 2017. The tangible equity
attributable to the owners of the parent at 30 June 2018 amounted to EUR 1,448 million
compared to EUR 1,398 million at 31 December 2017.
The statement of reconciliation between the Parent's equity and profit (loss) for the period
and the corresponding amounts resulting from the consolidated financial statements at the
same date, is illustrated below.
(in thousands of EUR)
30/06/2018 31/12/2017
Equity
of which: profit
(loss) for the period
Equity of which:
profit (loss) for the year
Balances as per parent financial statements 1,511,525 (9,957) 1,469,702 (325,468)
Investee results as per Separate financial statements:
- consolidated on a line-by-line basis 16,097 16,097 (706) (40,706)
- equity accounted 1,299 1,299 1,279 1,279
Amortisation of positive differences:
- past years (491) - (491) -
Differences compared to carrying amounts for:
- companies consolidated on a line-by-line basis (37,565) - (68,217) -
- equity investment impairment reversal - - 40,000 40,000
- equity-accounted companies 2,352 - 1,669 -
Adjustment to dividends collected during the period:
- on retained earnings - (6,961) - (7,263)
Other consolidation adjustments:
- elimination of intra-group profit and loss 344 751 (1,100) 2
- other adjustments (502) (405) (42) 307
Balances as per Consolidated financial statements 1,493,059 824 1,442,094 (331,849)

21
Own funds and capital ratios
In pursuance of the transitional regime (“phased in”), Common Equity Tier 1 (CET1) was
equal to EUR 1,939 million, against risk-weighted assets (RWAs), calculated with the
standard method, of EUR 13,892 million. Total own funds amounted to EUR 2,158 million.
The phased-in capital ratios amounted to:
- 14.0% for CET1 ratio
- 14.0% for Tier 1 ratio
- 15.5% for Total Capital ratio.
Those requirements were well above the SREP minimum levels envisaged for 2018:
- 7.075% for CET1 ratio,
- 8.813% for Tier 1 ratio,
- 11.125% for Total Capital ratio.
The fully loaded CET1 ratio coefficient at 30 June 2018 was 10.2%.
(in thousands of EUR) 30/06/2018 31/12/2017
Common Equity Tier 1 capital (CET1) 1,939,044 1,374,187
Tier 1 Capital 1,939,044 1,374,187
Total Own Funds 2,157,913 1,623,293
Credit risk and counterparty risk 989,681 927,007
Credit valuation adjustment risk 1,010 1,072
Settlement risks - -
Market risks 12,967 987
Operational risk 107,663 106,436
Other calculation elements - -
Total capital requirements 1,111,321 1,035,502
Risk-weighted assets 13,891,518 12,943,781
Common Equity Tier 1 capital / Risk-weighted assets (CET1 capital ratio) 13.96% 10.62%
Tier 1 capital / Risk-weighted assets (Tier 1 capital ratio) 13.96% 10.62%
Total own funds / Risk-weighted assets (Total capital ratio) 15.53% 12.54%

22
Income statement
The reclassified consolidated income statement is shown below.
(in thousands of EUR)
ITEMS 1st half of
2018 1st half of
2017 Change
Net interest income 178,879 198,772 -10.01%
Net fee and commission income 139,422 142,316 -2.03%
Dividends and similar income 1,867 2,876 -35.08%
Profit (loss) of equity-accounted investments (1) 1,299 158 n.s.
Net trading and hedging income (expense) and profit (loss) on sales/repurchases (2) 16,473 24,221 -31.99%
Other operating net income (3) 3,039 10,700 -71.60%
Operating income 340,979 379,043 -10.04%
Personnel expenses (193,432) (134,315) 44.01%
Other administrative expenses (4) (100,957) (107,711) -6.27%
Depreciations/amortisations and net impairment losses on property, equipment and investment property and intangible assets (5)
(12,567) (13,854) -9.29%
Operating costs (306,956) (255,880) 19.96%
Net operating profit 34,023 123,163 -72.38%
Net impairment losses for credit risk and gains/losses from amendments to contracts (6)
22,202 (328,562)
-106.76%
Losses on sale/repurchase of financial assets at amortised cost (7)
(95,220) (13,411)
n.s.
Net accruals to provisions for risks and charges (4,575) (40,493) -88.70%
Net gains/losses on sales of investments and property, equipment and investment property measured at fair value (8)
(19)
68,780 -100.03%
Badwill (9) 15,357 - n.s
Pre-tax loss from continuing operations (28,232) (190,523) -85.18%
Income taxes 30,777 (2,477) n.s.
Post-tax profit (loss) from continuing operations 2,545 (193,000) -101.32%
Profit for the period attributable to non-controlling interests (1,721) (1,828) -5.85%
Profit (loss) for the period 824 (194,828) -100.42%
(1) Profit of equity-accounted investments include profit (losses) of equity-accounted investments included in item 250 “Net gains (losses) on equity investments”; the residual amount of that item is included in gains on sales of investments, together with item 280 “Net gains (losses) on sales of investments" (2) Includes item “80. Profits (Losses) on trading”, “90. Net hedging income (expense)”, “100. Profits (losses) on sale or repurchase of: b) financial assets at fair value through other comprehensive income; c) financial liabilities” and “110. Profits (Losses) on other assets and liabilities at fair value through profit or loss: a) financial assets and liabilities at fair value; b) other financial assets mandatorily measured at fair value through profit or loss” (3) Other income and costs correspond to item “230. Other operating net income” net of the following reclassifications (4) Other administrative expenses include recoveries of taxes and other recoveries recognised in item "230. Other operating net income" (EUR 21,686 thousand in the first half of 2018 and EUR 25,718 thousand in the first half of 2017) (5) Depreciation/amortisation and net impairment losses on property, equipment and investment property and intangible assets include items "210. Depreciation and net impairment losses on property, equipment and investment property", "220. Amortisation and net impairment losses on intangible assets" and the accumulated depreciation of costs incurred for leasehold improvements included in item "230. Other operating net income" (EUR 500 thousand in the first half of 2018 and EUR 688 thousand in the first half of 2017) (6) Include items “130. Net impairment losses for credit risk relating to: a) financial assets at amortised cost; b) financial assets at fair value through other comprehensive income” and “140. Gains/losses from amendments to contracts without derecognition” (7) Includes item "100. Profit (Loss) on sale or repurchase of: a) financial assets at amortised cost" (8) Includes the residual amount of item "250. Net gains on sales of investments" not included among profit (losses) of equity-accounted investments together with item "280. Net gains (losses) on sales of investments" and item "260. Net result of property, equipment and investment property and intangible assets at fair value" (9) Includes the badwill recognised in item "230. Other operating net income"

23
In the first half of 2018, net interest income reached EUR 178.9 million, compared to EUR
198.8 million in the first half of 2017. The figures are not fully comparable as a result of the
application of IFRS 9 and the impact of the transfers of bad loans and unlikely to pay (UTP)
portfolio.
Net fee and commission income amounted to EUR 139.4 million, down year-on-year
(-2.0%) mainly due to the decrease in components relating to current accounts and
collection and payment services, partially offset by the increase in management, trading
and consulting fees (+3.7% year-on-year).
Net trading and hedging income (expense) and profit (loss) on sales/repurchases
stood at EUR 16.5 million.
Operating income reached EUR 341 million compared to EUR 379 million of the same
corresponding period.
Operating costs stood at EUR 307 million compared to EUR 256 million of 2017.
Personnel expenses amounted to EUR 193.4 and include EUR 63.5 million of extraordinary
expenses relating to early retirement plan set forth in the trade-union agreement signed on
16 April. The first half of 2017 benefited from a positive component of EUR 7.5 million
(“NASPI” - Nuova Assicurazione Sociale per l’Impiego contribution). Net of these
components, personnel expenses decreased by 9.5% year-on-year, incorporating savings
related to voluntary redundancies through the sector’s Solidarity Fund last year. Other
administrative expenses amounted to EUR 101 million and included extraordinary
expenses for a total of EUR 9.5 million recognised in the second quarter, of which EUR 3.4
million relating to the extraordinary contribution paid to the Single Resolution Fund and EUR
6.1 million relating to the securitisation of non-performing loans (ARAGORN Project). Net of
these extraordinary items, other administrative expenses fell by 11.0%.
The net operating profit reached EUR 34 million.
The item net impairment losses for credit risk (determined on the basis of IFRS 9 and
positive for EUR 22.2 million, including reversals of impairment losses relating to non-
performing loans not subject to transfer) together with Profit (loss) on sale/repurchase
of financial assets at amortised cost (negative for EUR 95.2 million and referring to the
sale of non-performing loans during the half-year) resulted in a negative value of EUR 73
million, of which EUR 57 million refer to adjustments to ordinary loans that express an
annualised cost of credit of 69bps (excluding government bonds from loans and receivables
with customers).
Badwill of EUR 15.4 million refers to the result of the purchase price allocation relating to
the acquisition of Claris Factor completed on 29 June.
Taking into account net accruals to provisions for risks and charges of EUR 4.6 million, the
pre-tax loss from continuing operations is negative for EUR 28.2 million.
Income taxes were positive for EUR 30.8 million and include EUR 12.6 million relating to the
recognition of previously unrecognised DTAs, against the probability test carried out on the
approval of the results at 30 June 2018. After deducting the profit attributable to non-
controlling interests, net profit for the period was EUR 0.8 million. ROA stood at 0.01%.

24
Related party transactions, risks and going concern prospects
Related party and intra-group transactions
The matter is mainly regulated:
- by Article 2391-bis of the Italian Civil Code, whereby the governing bodies of companies
resorting to the equity market adopt, according to general principles indicated by
Consob, rules that assure “the transparency and substantial and procedural correctness
of related party transactions” carried out directly or through subsidiaries;
- by the “Related Party Transaction Regulation” adopted by Consob with resolution no.
17221 of 12 March 2010, as amended, (hereinafter also the “Consob Regulation”),
implementing the delegation contained in Article 2391-bis of the Italian Civil Code, as
well as, in relation to the specific business;
- by the provisions of Article 136 of the Consolidated Banking Act - as amended by Italian
Legislative Decree no. 72 of 12 May 2015 - on obligations of banking representatives;
- by the supervisory provisions issued by the Bank of Italy on December 2011 on risk
assets and conflicts of interest of banks and banking groups with respect to “Associated
Parties” (9th update to Circular 263 of 27 December 2006 - hereinafter also referred to
as the “Bank of Italy Regulation”), provisions that complement what is provided by the
Consob regulation.
In compliance with the combined provision of the above-mentioned regulations, the Board
of Directors approved the “Procedures concerning Related Party Transactions and Associated
parties” (hereinafter also the “RPT Creval Procedures”), in the last updated version, effective
as from 27 November 2017. The RPT Creval Procedures establish the procedures and rules
for ensuring transparency and substantive and procedural correctness in related party
transactions carried out directly by Credito Valtellinese or by means of its subsidiaries. They
also comply with the applicable regulations of the Bank of Italy on risk assets and conflicts
of interest towards associated parties.
In accordance with current regulations, the document is published on the website,
http://www.gruppocreval.com – Corporate Governance section – Corporate documents.
Still on the basis of the provisions of the Bank of Italy Regulation, the Board of Directors of
the Parent approved the “Policy regarding controls on risk activities and on conflicts of
interest towards associated parties” (hereinafter also the “Policy”), document that defines
the internal policies regarding controls on risk activities and on conflicts of interest towards
associated parties, and was made known to the Ordinary Shareholders' Meeting held on 27
April 2013, subsequently amended with Board resolution of 9 December 2015.
The Policy describes, in relation to the operational features and the strategies of the Bank
and of the Group, the business segments and the types of business relations, also other
than those implying the assumption of risk assets, in relation to which conflicts of interest
may arise, as well as the safeguards inserted in the organisational structures and in the
internal control system to ensure constant compliance with prudential limits and the above
decision-making procedures. The document also summarises the principles and rules
applicable to transactions with associated parties that were used for the preparation of the
relevant Procedures.
With reference to intra-group transactions, relations with companies in the Credito
Valtellinese Banking Group were established within an organisational model - as widely
illustrated in this report – based on which each legal entity focuses only on its own core

25
business, in an industrial framework that offers effective and efficient management of
overall Group resources.
This approach aims to achieve any form of synergy among the companies of the Group,
assures to all members the access to specialised high-quality services and makes it possible
to achieve significant economies of scale to reduce operating costs relating to activities and
common services.
The common focus of activities and specialist services is regulated on the basis of
appropriate intra-group contractual agreements, which concern in particular the provision
of services by the parent to the subsidiary companies in the sector of finance, insurance,
legal and corporate affairs, administrative, accounting and management, internal auditing,
risk management and compliance, management and administration of the Personnel. The
contracts between specialised and complementary companies and the other companies of
the Group concern the management of the information system, the organisational and back
office services, the payment systems in Italy and abroad, the management of real estate
assets, the design and construction of real estate works, and the technical support to the
disbursement of credit and leasing.
The financial effects are regulated on the basis of specific contractual agreements that, with
the main objective of optimising synergies and economies of scale and purpose at the Group
level, refer to long-term objective and constant parameters, distinguished by material
transparency and fairness. The quantification of the expected fees for services was defined
and formalised according to tested parameters that take into account actual utilisation by
each user company.
The Board of Directors is exclusively responsible for the definition of intra-group contractual
agreements and approval and possible amendment of the related economic conditions.
No atypical or unusual transactions, with Group companies or related parties - as defined
by Article 2427, second paragraph, of the Italian Civil Code, or according to the IFRS
endorsed by the European Union - that impacted significantly on the financial position or
results of operations of the company has taken place during the financial year.
Detailed information on intra-group and related party transactions, including information on
the effects of transactions or existing positions with such counterparties on the statement
of financial position and on the income statement, accompanied by summary tables of such
effects, are contained in the Notes to the condensed interim consolidated financial
statements.

26
Risk management
In accordance with the Supervisory provisions, the Credito Valtellinese Group adopted a
detailed and strong internal control system (consisting of rules, functions, structures,
resources, processes and procedures) the aims of which are reducing the risk within the
limits indicated in the framework of reference for determining the risk appetite (RAF),
prevention of the risk that the Banks of the Group are involved, even unintentionally, in
illegal activities (such as money laundering, usury and terrorist financing) and compliance
of the transactions with the law and supervisory regulations, as well as with policies,
regulations and internal procedures.
The internal control and risk management system, regulated by the prudential supervisory
regulations and by the company policy defined in the “Control coordination document”, is
broken down in the company's control functions set up with the Parent and based in the
following functions:
- compliance and anti-money laundering;
- risk control and validation;
- internal revision.
In order to maintain adequacy over time, the risk control units as a whole are assessed and
checked in terms of completeness, adequacy, functionality and reliability by the indicated
functions. The appropriate development and corrective actions of any deficiency are
identified and planned at the management level, discussed and screened in the Risk
Committee and submitted to Corporate Bodies responsible for strategy, management and
control. Overall, the coordinated action of governance, organisation, risk management and
internal control system make it possible to obtain a full picture and an adequate
management of the assumed risk and the awareness, looking ahead, of the expected risk.
As part of the internal control system, the Group developed and standardised specific
controls, including in particular:
- the “RAF”, which consists of “the reference framework that establishes - consistent with
the maximum risk that can be undertaken, the business model and the strategic plan -
the risk appetite, the tolerance thresholds, the risk limits, the risk governance policies,
the reference processes needed to define and implement them”. At the same time, it is
a management tool that supports the achievement of the set objectives and is integrated
with strategic and operational planning, and a tool for control that identifies any overruns
of the set limits;
- the risk management process, defined in compliance with RAF and intended as “all the
rules, procedures, resources (human, technological and organisational) and control
activities for identifying, measuring or assessing, monitoring, preventing or mitigating
as well as notifying the suitable superiors of all risks assumed or which may be assumed
in the various segments, at company and group portfolio level, applying integrated logic,
also mutual inter-relations and the development of the external scenario”. The
operational limits to the assumption of various types of risk and the related reporting
processes are consistent with the risk appetite defined within the Risk Appetite
Statement and with the development of the economic scenario;
- the Internal Capital Adequacy Assessment Process (ICAAP) and Internal Liquidity
Adequacy Assessment Process (ILAAP), the results of which are summarised in this
Report that represents, on the one hand, the point of convergence and synthesis of the
equity, economic and financial plans of the risk management, capital management and
liquidity management and that, on the other hand, is an essential instrument supporting
strategic planning and the implementation of the corporate decisions;

27
- the Contingency Funding and Recovery Plan (CFRP), which describes the procedures to
be followed and the actions to be taken in the event of situations of severe stress or
significant deterioration of the liquidity profile, or the possibility of such situations
occurring. This framework envisages the activation of an intervention plan, according to
two critical levels, following an evaluation and escalation process starting from a set of
systemic and intolerant indicators; funding sources are also identified and the
management levers that the Bodies designated to govern the crisis can activate in order
to restore a normal liquidity position. The aim of CFRP is to manage a short-term liquidity
crisis limited to this profile. The Restructuring plan, on the other hand, supervises
situations of significant deterioration in the economic sustainability and financial
situation of the Group.
Detailed information on the general characteristics of the control systems, the risk
management, measurement and control policies are contained in the Notes to the 2017
Consolidated Financial Statements (Part E – Information on risks and hedging policies) and
in the informative report on the third pillar at 31 December 2017 made available on the
Group's website at www.gruppocreval.com.
Information on main risks and uncertainties to which the Group is exposed
Strategic decisions regarding risk management at Group level are taken by the Parent's
corporate bodies, taking account of the specific operations and related risk profiles of each
Bank/Company of the Group, in order to implement an integrated and consistent risk
management policy. In this context, the Parent defines and approves the Group Risk
Appetite Framework (RAF) and Risk Appetite Statement (RAS), in application of Bank of
Italy Circular no. 285/2013, Part I, Title IV, Chapter 3.
At 30 June 2018, the Group's exposure to risks was consistent with the risk appetite.
For detailed information on the Group's exposure to risks, please refer to the section
Information on risks and related hedging policies.

28
Information on disputes
For detailed information on disputes, tax or otherwise, and on the main pending legal
actions, please refer to the Notes to the condensed interim consolidated financial
statements.
Information on business outlook, with a special reference to going concern
assumptions
With regard to the going concern assumption, the Board of Directors confirms its reasonable
expectations that the company and the Group will remain a going concern in the foreseeable
future and, consequently, confirms that the condensed interim consolidated report was
prepared on a going concern basis.
As regards the requirements relating to impairment testing and uncertainties in the use of
estimates, please refer to the information provided in the special sections in the Notes to
the condensed interim consolidated financial statements.

29
Events after the close of the half-year
Reorganisation of Bancassurance activities
In line with the objectives set out in the 2018-2020 Strategic Plan, the bank redefined its
operating model for the bancassurance business, signing long-term strategic partnerships
with Crédit Agricole Assurances SA (“CAA”) in the Life segment and with the Insurance
Group Ri-Fin S.r.l. (“Rifin”) in the Non-Life segment.
In this regard, note that the following were signed on 24 July 2018:
- the Framework Agreement between Creval and Rifin aimed at restructuring the existing
agreements, reorganising the co-equity investments held by Creval and Rifin in the
companies Global Assicurazioni, Global Assistance S.p.A. (“Global Assistance”) and Global
Broker S.p.A. (“Global Broker”), as well defining two new distribution agreements with the
aforesaid insurance companies of the Rifin Group, relating to the Non-Life bancassurance
business, and to the insurance brokerage activity on Creval customers (the “CV/Rifin
Agreement”), both exclusively and for a duration of 15 years.
Upon completion of the CV/Refin Agreement, against a total disbursement of EUR 34 million
to Rifin, in relation to the purchase and sale of the equity investments, Creval will hold: i)
100% of the share capital of Global Assicurazioni and ii) 30% of the share capital of Global
Broker. The Rifin Insurance Group will hold: i) 100% of the insurance company Global
Assistance, specialised in non-life bancassurance products in particular, ii) 100% of the
multifirm agency (Nuova) Global Assicurazioni S.p.A., which was set up following the
demerger of the business unit of Global Assicurazioni and specialised in non-life
bancassurance processes and products, and iii) 70% of Global Broker, an insurance
brokerage company with a special focus on SME, private and public customers.
The closing of the transaction is expected by the end of 2018 and is subject to the
authorisations of the competent Supervisory Authorities (IVASS and Antitrust Authority).
- the Framework Agreement between CreVal and Crédit Agricole Assurances SA (“CAA”) for
the launch of an exclusive long-term partnership in the life insurance business (“CV/CAA
Agreement”). The partnership will provide CAA, through its Italian subsidiary Crédit Agricole
Vita S.p.A. (“CA Vita”), with access to CreVal's network for the distribution of all savings
and investment insurance products as well as certain protection segment products for a
duration of up to 15 years. As part of the transaction, CAA will purchase 100% of the share
capital of Global Assicurazioni S.p.A. (“GA”), a company that, following the restructuring by
the current shareholders (Creval and Rifin) as detailed above, at the closing date will be
wholly owned by CreVal and will exclusively include the business related to the life insurance
policies distributed on the CreVal network.
The total consideration paid by CAA for the acquisition of GA will be EUR 80 million, of which
EUR 70 million paid by CAA at the closing and EUR 10 million deferred, payable at the end
of the fifth year subject to the achievement of previously agreed objectives.
In order to strengthen the long-term strategic partnership, the agreement provides for CAA
to purchase a non-controlling interest in CreVal of 5%. Moreover, the parties agreed that
they will consider, in the medium term, the possibility of extending the partnership between
the CASA Group and CreVal to other business areas. In this situation, the CASA Group could
consider increasing its share in CreVal to 9.9%.
As a result of the CV/CAA Agreement and the CV/Rifin Agreement, the performance of which
remains subject to completion, among other things, of the authorisations of the competent

30
Supervisory Authorities, Global Assicurazioni and Global Broker will leave the Creval Group's
scope of consolidation.
For the sake of full disclosure, on 27 July 2018 CAA announced that it had completed the
acquisition of the 5% equity investment in Creval.
Merger by incorporation of the subsidiary Creval Sistemi e Servizi into Credito
Valtellinese
On 26 July 2018, the Board of Directors of Creval and of the subsidiary Creval Sistemi e
Servizi (“CSS”) resolved to carry out the merger by incorporation of CSS into Credito
Valtellinese S.p.A.
The Merger is part of the 2018-2020 Strategic Plan, as part of the objectives for simplifying
the corporate structure and optimising the cost structure. The Transaction follows on from
the merger of Credito Siciliano into the Parent, which was finally completed (effective as
from 25 June 2018), as well as from the previous mergers of the other territorial banks of
the Group, in line with the creation of the so-called “single bank”. Following the mergers
mentioned above, the consortium company CSS now provides almost all of its services to
the Parent and is 99.08% owned directly and indirectly by it. Therefore, in this context, the
Merger will allow benefits to be achieved in terms of cost synergies and organisational
streamlining, as well as greater coordination between IT and business areas.
The merger is to be implemented through the simplified system set forth in Article 2505 of
the Italian Civil Code on the assumption that, at the date of effectiveness of the Merger, all
CSS shares, i.e. 100% of the share capital of CSS, are owned by Creval. The transfer of
CSS shares to Credito Valtellinese will take place on the basis of the pro-rata book equity
of CSS, in accordance with its articles of association.
Once the Authorisation has been obtained and the statutory procedure has been completed,
the merger is expected to become effective by the end of the current financial year.
Industrial partnership as part of the activities relating to loans against pledges in
Italy
On 9 August 2018, Credito Valtellinese S.p.A., Dorotheum Beteiligungs GmbH
(“Dorotheum”) and the company indirectly controlled by the latter Custodia Valore - Credito
su Pegno S.p.A. (“Custodia Valore”) announced that they have signed an agreement for the
creation of an industrial partnership as part of the activities relating to loans against pledges
in Italy.
The partnership will be implemented by means of Custodia Valore, company created through
the acquisition by Dorotheum of the business dedicated to loans against pledges of the
UniCredit Group.
In particular, the Transaction envisages (i) a capital increase of Custodia Valore, with the
exclusion of the right of option reserved to Creval, to be released through the contribution
of the Creval business unit dedicated to loans against pledges, in exchange for a non-
controlling interest equal to 22% of the share capital of Custodia Valore and (ii) the provision
by Creval of information technology and support services to Custodia Valore.
Therefore, at the end of the Transaction, the share capital of Custodia Valore will be held by
the Dorotheum Group (78%) and Creval (22%).

31
Creval undertook to grant credit facilities to Custodia Valore to support ordinary activities,
its business growth as well as to support the acquisition, by Custodia Valore, of some
instrumental properties included in the scope. For Creval, the Transaction will allow it to
enter into a partnership with one of the main European leaders in the market of loans against
pledges and is part of the initiatives envisaged by the 2018-2020 Strategic Plan for the
valuation of non-core assets aimed at increasing the bank's comprehensive income and
further strengthening the capital ratios. In fact, the partnership will allow to make a net
capital gain estimated to date in EUR 44.5 million with a positive impact on the Group CET1
capital ratio estimated in about 5 basis points.
Industrial partnership in the salary-backed loan market
On 9 August 2018, Creval, Cassa di Risparmio di Asti S.p.A. (“CR Asti”) and Bonino 1934
s.r.l. (“Bonino”) signed a Term sheet concerning the essential terms and conditions that will
regulate: (i) the purchase by Creval of a 9.9% equity investment in the share capital of
Pitagora S.p.A. (“Pitagora”); by signing at the same time the shareholders' agreements that
will envisage, among other things, the representation of Creval in the Board of Directors of
Pitagora, as well as (ii) the revision and renewal for five years of the existing sales
agreement by and between Pitagora and Creval for the promotion of salary-backed loan
agreements (“CQS”), with important objectives of disbursement on the Creval network.
The purchase of the Equity investment and the signing of the Sales Agreement represent,
as a whole, an important opportunity for Creval to increase its exposure to the CQS market,
a growing market that could also benefit, in the future, from a significant revision - in a
favourable sense - of the levels of capital absorption. The increase in Creval's exposure will
take place through: (i) the acquisition of an equity investment in the share capital of a
leading operator in the sector, with the consequent expected return also in the light of the
business plan of Pitagora. (ii) the expected increase of the disbursed CQS through the Creval
branches, thanks also to the commercial support provided by Pitagora, and (iii) the granting
of funding lines that may be granted to Pitagora, contributing to the recovery of net interest
income at the end of the de-risking process carried out by Creval.
Therefore, for Creval, the Transaction is part of the progressive strengthening and expansion
of the offer dedicated to retail customers and - in line with the provisions of the 2018-2020
Strategic Plan - may lead to an increase in comprehensive income to be achieved in
particular through the development of Creval's penetration in the consumer credit market
and the consequent increase in the capacity to generate fees and commissions.
Subject to the completion of the usual due diligence activities and the definition of final
agreements in the light of what has already been agreed in the Term Sheet, the closing of
the Transaction is expected by November 2018.
The acquisition of the Equity investment will have negligible effects (approximately 1bp) on
the level of Creval's fully loaded CET1 ratio at 31 March 2018.
Current-year outlook
Globally, there are still favourable prospects for the continuation of the current expansionary
phase despite the slowdown in the first quarter of this year. The Eurozone economy is
expected to continue to grow, although downside risks remain, notably from global
protectionist measures that could affect the growth in exports. The outlook for the Italian
economy remains positive, supported by an expected improvement in the labour market

32
and an increase in household spending, which, however, is estimated to be slightly slowing
down. As far as manufacturing is concerned, the weak phase continues, accompanied by a
drop in orders and exports, which is more widespread in the non-EU area.
With reference to the Italian banking market, lending to SMEs and households increased,
albeit at a modest pace, favoured by low interest rates and the prospects of the real estate
market. The improvement in the quality of the loan portfolio continued, favoured by the
expansionary economic phase underway and by the financial statement cleaning operations
put in place by the banks.
In this context, during the year Creval will continue to implement all the activities aimed at
achieving the Plan objectives set for 2018, focusing in particular on the growth of
commercial activity and the recovery of the profitability of the core business.
Sondrio, 9 August 2018
The Board of Directors

33
CONDENSED INTERIM CONSOLIDATED FINANCIAL STATEMENTS
As shown in the Notes to the condensed interim consolidated financial statements, the
financial statements were presented based on the 5th update of Circular 262 “Banking
Financial Statements: formats and guidelines” that implements IFRS 9. The corresponding
periods have been restated consistently with those published in 2017

34
Condensed interim consolidated financial statements
Consolidated statement of financial position
(in thousands of EUR)
ASSETS 30/06/2018 31/12/2017
10. Cash and cash equivalents 150,237 197,829
20. Financial assets at fair value through profit or loss
243,265
20,681
a) financial assets held for trading 58,884 20,681
c) other financial assets mandatorily measured at fair value 184,381 -
30. Financial assets at fair value through other comprehensive income 2,026,565 4,419,352
40. Financial assets at amortised cost 22,031,254 18,714,357
a) loans and receivables with banks 596,586 2,033,413
b) loans and receivables with customers 21,434,668 16,680,944
50. Hedging derivatives - 199
70. Equity investments 25,167 24,371
90. Property, equipment and investment property 442,875 441,933
100. Intangible assets 44,885 44,591
of which:
- goodwill 30,385 30,385
110. Tax assets 686,172 676,630
a) current 109,156 80,987
b) deferred 577,016 595,643
120. Non-current assets held for sale and disposal groups 89,471 3,955
130. Other assets 293,706 412,926
Total assets 26,033,597 24,956,824
LIABILITIES AND EQUITY 30/06/2018 31/12/2017
10. Financial liabilities at amortised cost 23,538,699 22,774,472
a) due to banks 3,124,573 3,143,189
b) due to customers 18,357,385 16,841,601
c) securities issued 2,056,741 2,789,682
20. Financial liabilities held for trading 198 713
40. Hedging derivatives 135,599 138,691
60. Tax liabilities 2,925 2,363
a) current 2,159 2,184
b) deferred 766 179
80. Other liabilities 622,929 421,399
90. Post-employment benefits 47,046 46,546
100. Provisions for risks and charges: 192,631 125,194
a) commitments and guarantees issued 12,083 9,931
b) pension and similar obligations 36,902 33,520
c) other provisions for risks and charges 143,646 81,743
120. Valuation reserves -45,089 -12,145
150. Reserves -1,018,026 -60,629
160. Share premium reserve 638,667 -
170. Share capital 1,916,783 1,846,817
180. Treasury shares (-) -100 -100
190. Equity attributable to non-controlling interests (+/-) 511 5,352
200. Profit (loss) for the period (+/-) 824 -331,849
Total liabilities and equity 26,033,597 24,956,824

35
Consolidated Income Statement
(in thousands of EUR)
ITEMS 1st half of 2018 1st half of 2017
10. Interest and similar income 235,370 268,431
20. Interest and similar expense (56,491) (69,659)
30. Net interest income 178,879 198,772
40. Fee and commission income 154,195 156,498
50. Fee and commission expense (14,773) (14,182)
60. Net fee and commission income 139,422 142,316
70. Dividends and similar income 1,867 2,876
80. Profits (Losses) on trading 1,033 2,882
90. Net hedging expense (50) (49)
100. Profit (Loss) on sale or repurchase of: (77,689) 7,977
a) financial assets at amortised cost (95,220) (13,411)
b) financial assets at fair value through other comprehensive income 17,460 21,879
c) financial liabilities 71 (491)
110. Profits (losses) on other assets and liabilities at fair value through profit or loss
(2,041) -
b) other financial assets mandatorily measured at fair value (2,041) -
120. Total income 241,421 354,774
130. Net impairment losses for credit risk on: 22,860 (328,562)
a) financial assets at amortised cost 24,318 (293,396)
b) financial assets at fair value through other comprehensive income (1,458) (35,166)
140. Gains/losses from amendments to contracts without derecognition (658) -
150. Net financial income 263,623 26,212
190. Administrative expenses: (316,075) (267,744)
a) personnel expenses (193,432) (134,315)
b) other administrative expenses (122,643) (133,429)
200. Net accruals to provisions for risks and charges (4,575) (40,493)
a) commitments and guarantees issued 3,312 (40,451)
b) other net accruals (7,887) (42)
210. Depreciation and net impairment losses on property, equipment and investment property
(8,646) (9,155)
220. Amortisation and net impairment losses on intangible assets (3,421) (4,011)
230. Other operating net income 39,582 35,730
240. Operating costs (293,135) (285,673)
250. Net gains (losses) on equity investments 1,299 158
260. Net result of property, equipment and investment property and intangible assets at fair value
-
(1,146)
280. Net gains (losses) on sales of investments (19) 69,926
290. Pre-tax loss from continuing operations (28,232) (190,523)
300. Income taxes 30,777 (2,477)
330. Profit (loss) for the period 2,545 (193,000)
340. Profit for the period attributable to non-controlling interests (1,721) (1,828)
350. Profit (loss) for the period attributable to owners of the parent 824 (194,828)
Basic earnings (loss) per share - in EUR 0.0002 (17.571)
Diluted earnings (loss) per share - in EUR 0.0002 (17.571)

36
Consolidated statement of comprehensive income
(in thousands of EUR)
Items 1st half of
2018 1st half of 2017
10. Profit (loss) for the period 2,545 (193,000)
Other comprehensive income net of income taxes without reclassification to profit or loss
(6,905) 14,486
20. Equity instruments at fair value through other comprehensive income (2,829) -
30. Financial liabilities at fair value through profit or loss (changes in creditworthiness)
-
-
40. Coverage of equity instruments at fair value through other comprehensive income
- -
50. Property, equipment and investment property - 11,522
60. Intangible assets - -
70. Defined-benefit plans (4,048) 2,959
80. Non-current assets held for sale and disposal groups - -
90. Portion of valuation reserves of equity-accounted investments (28)
5
Other comprehensive income net of income taxes with reclassification to profit or loss
(30,378) (22,933)
100. Hedging of investments in foreign operations - -
110. Exchange rate differences - -
120. Cash flow hedges - -
130. Hedging instruments (elements not designated) - -
140. Financial assets (other than equity instruments) at fair value through other comprehensive income
(30,279) (23,047)
150. Non-current assets held for sale and disposal groups - 184
160. Portion of valuation reserves of equity-accounted investments (99) (70)
170. Total other comprehensive income net of income taxes (37,283) (8,447)
180. Comprehensive income (Item 10+170) (34,738) (201,447)
190. Consolidated comprehensive income attributable to non-controlling interests (1,706) (1,858)
200. Consolidated comprehensive income attributable to owners of the parent (36,444) (203,305)

37
Statement of changes in consolidated equity
(in thousands of EUR)
Equity Balance at
31/12/2017
Change in opening balances
Balance at 1/1/2018
Allocation of prior year profit
Changes during the year Equity attributable to owners of the parent at 30/06/2018
Equity attributable to non-controlling interests at 30/06/2018
Changes in reserves
Equity transactions Comprehensive income 30/06/2018
Reserves
Dividends and other allocations
Issue of new shares
Purchase of treasury shares
Extraordinary dividend distribution
Change in equity instruments
Derivatives on treasury shares
Stock options
Changes in equity investments
Share capital:
a) ordinary shares 1,849,588
1,849,588
69,966
-2,497
1,916,783
274
b) other shares
Share premium reserve 56 56 638,667 -51 638,667 5
Reserves:
a) income related -1,087
-1,411
-2,498
-695
424
2,078
-337
435
-1,463
b) other -60,629
-587,806
-648,435
-331,849
-1,323
-36,854
-1,018,461
Valuation reserves -12,183 4,317 -7,866 34 -37,283 -45,089 -26
Equity instruments
Treasury shares -100
-100
-100
Profit (loss) for the period -328,199 -328,199 332,544 -4,345 2,545 824 1,721
Equity attributable to owners of the parent 1,442,094 -583,489 858,605 -888 671,779 7 -36,444 1,493,059
Equity attributable to non-controlling interests 5,352 -1,411 3,941 -4,345 -11 2,078 -2,858 1,706 511

38
Equity Balance at
31/12/2016
Change in opening balances
Balance at 1/1/2017
Allocation of prior year profit
Changes during the year Equity attributable to owners of the parent at 30/06/2017
Equity attributable to non-controlling interests at 30/06/2017
Changes in reserves
Equity transactions Comprehensive income 30/06/2017
Reserves
Dividends and other allocations
Issue of new shares
Purchase of treasury shares
Extraordinary dividend distribution
Change in equity instruments
Derivatives on treasury shares
Stock options
Changes in equity investments
Share capital:
a) ordinary shares 1,849,672 1,849,672 -8 1,846,817 2,847
b) othershares
Share premium reserve 39,343 39,343 -39,292 51
Reserves:
a) income related 230,761 230,761 -234,108 4 2,042 -1,301
b) other -59,890 -1,587 -61,477
Valuation reserves -33,474 -33,474 -8,447 -41,874 -47
Equity instruments
Treasury shares -100 -100 -100
Profit (loss) for the period -328,732 -328,732 333,290 -4,558 -193,000 -194,828 1,828
Equity attributable to owners of the parent 1,753,430 1,753,430 -1,587 -203,305 1,548,538
Equity attributable to non-controlling interests 4,040 4,040 -4,558 4 2,042 -8 1,858 3,378
The item “Reserves - other” conventionally includes the losses carried forward.

39
Consolidated Statement of cash flows – Direct method (in thousands of EUR)
1st half of 2018 1st half of 2017
A. OPERATING ACTIVITIES
1. Cash flow from operating activities 184,679 190,481
- interest income received (+) 292,726 235,379
- interest expense paid (-) -52,988 -58,954
- dividends and similar income (+) 1,867 2,212
- net fee and commission income (+/-) 147,836 142,655
- personnel expenses (-) -138,955 -147,868
- other costs (-) -111,062 -97,485
- other revenue (+) 55,765 126,889
- taxes (-) -10,510 -12,347
2. Cash flow generated/used by financial assets -1,712,767 -332,133
- financial assets held for trading -40,284 -1,762
- financial assets mandatorily measured at fair value -39 -
- financial assets at fair value through other comprehensive income 1,591,421 830,361
- financial assets at amortised cost -3,383,507 -1,091,370
- other assets 119,642 -69,362
3. Cash flow generated/used by financial liabilities 844,016 122,199
- financial liabilities at amortised cost 635,936 117,099
- financial liabilities held for trading -1,580 -624
- other liabilities 209,660 5,724
Cash flow from (used in) operating activities -684,072 -19,453
B. INVESTING ACTIVITIES
1. Cash flow generated by 1,408 36,843
- dividends from equity investments 671 664
- sales of property, equipment and investment property 737 36,179
2. Cash flow used for -18,383 -27,182
- purchases of equity investments - -11,000
- purchases of property, equipment and investment property -9,877 -11,238
- purchases of intangible assets -3,506 -4,944
- purchases of subsidiaries and business units -5,000 -
Cash flow from (used in) investing activities -16,975 9,661
C. FINANCING ACTIVITIES
- issue/repurchase of treasury shares 657,800 -
- dividend distribution and other -4,345 -4,558
- sale/purchase of third-party control - -
Cash flow from (used in) financing activities 653,455 -4,558
NET CASH FLOW GENERATED/USED DURING THE PERIOD -47,592 -14,350
Key: (+) generated (-) used

40
Reconciliation
Financial statement items 1st half of
2018 1st half of
2017
Cash and cash equivalents at the beginning of the period 197,829 170,735
Net liquidity generated/used during the period -47,592 -14,350
Cash and cash equivalents at the end of the period 150,237 156,385
Key: (+) generated (-) used

41
Notes to the condensed interim consolidated financial statements
Accounting Policies
General part
The condensed interim consolidated report of the Credito Valtellinese Group is prepared in
consolidated format as prescribed by Article 154-ter, Italian Legislative Decree no. 58 of 24
February 1998 (the Consolidated Finance Act) and in compliance with IFRS issued by IASB (the
International Accounting Standards Board) endorsed by the European Union, whose application
was compulsory at the date of preparation of the condensed interim consolidated report according
to IAS 34 – Interim Financial Reporting in condensed form.
The Group accounting policies used for preparing the condensed interim consolidated report, with
reference to classification, recognition, measurement and derecognition criteria for each asset
and liability item, as with the recognition methods for revenue and costs, have changed with
respect to those used for the Consolidated Financial Statements at 31 December 2017, mainly as
a result of the compulsory application of the following international accounting standards as from
1 January 2018:
- IFRS 9 “Financial Instruments”, issued by the IASB in July 2014 and approved by the
European Commission with Regulation (EU) 2067/2016, which replaced IAS 39 with regard
to the regulation of classification and measurement of financial instruments, as well as the
related impairment process;
- IFRS 15 “Revenue from Contracts with Customers”, approved by the European
Commission with Regulation (EU) 1905/2016, which led to the cancellation and
replacement of IAS 18 “Revenue” and IAS 11 “Construction Contracts”.
The effects of the first-time adoption of these standards are summarised below.
First-time adoption of IFRS 9 - Financial Instruments
IFRS 9 “Financial Instruments” replaces from 1 January 2018 IAS 39 “Financial Instruments:
Recognition and Measurement” and redefines the requirements for recognition and measurement,
impairment, derecognition and general hedge accounting.
With reference to the “Classification and measurement” of the financial assets, the standard
introduces a business Model and contractual cash flow characteristics of the financial instrument
to be tested by means of a specific process.
The standard proposes three ways of classifying the financial assets to which their measurement
approaches are related: Financial assets at amortised cost, Financial assets at fair value through
other comprehensive income, and Financial assets at fair value through profit or loss. The
application of the classification and measurement approaches linked to it depends on the business
model on the basis of which the financial instruments and characteristics relating to contractual
cash flows of the instrument are managed. In particular, financial assets may be registered in the
first two categories only if they give rise to cash flows that are solely payment of principal and
interest (“SPPI test”). Equity instruments not held for purposes of trading are always registered
in the third category and measured at fair value through profit or loss, unless the bank chooses
to classify them in the financial assets at fair value through other comprehensive income; in this
case, the changes in value are recognised in an equity reserve, which will never be transferred to
the income statement, not even if the financial instrument is sold. This choice is made at the time
of initial recognition and is not revocable.
The classification and measurement rules for financial liabilities set by IFRS 9 do not make any
major changes compared to the requirements of 39, except for the accounting processing of

42
cumulative fair value changes linked to one's own credit risk in the event of financial liabilities
designated at fair value.
With reference to the impairment of financial assets, the accounting standard requires that, for
financial assets not measured at fair value through profit or loss, impairment losses must be
determined based on the 12 month expected credit loss and, if there is a significant increase in
credit risk compared to the initial recognition date, impairment losses must be calculated based
on the lifetime expected credit loss of the financial instrument. Thus, a model based on the
concept of expected loss replacing the “incurred loss” required by the IAS 39 is introduced.
Financial instruments are classified into three separate stages:
• stage 1 includes performing financial instruments for which a significant increase in the
credit risk compared to the initial recognition date was not observed. The impairment is
collectively determined based on 12 month expected credit loss;
• stage 2 includes performing financial instruments for which a significant increase in the
credit risk compared to the initial recognition date was observed. The impairment is
collectively determined based on lifetime expected credit loss;
• stage 3 includes non-performing financial instruments. The impairment is analytically
determined based on lifetime expected credit loss.
The introduction of the new impairment rules also entails the inclusion, in the calculation of
expected losses, of forward looking information linked, among other things, to changes in the
macroeconomic scenario.
With reference to hedge accounting, the new model relating to hedging aligns the accounting
representation with the typical activity of risk management and strengthens the disclosure of risk
management activities. The standard envisages the possibility of maintaining the rules set out in
IAS 39 for hedge accounting.
The main areas of impact deriving from the first-time adoption of IFRS 9 are shown below.
Classification and Measurement
With regard to “Classification and Measurement” of financial assets, the redefinition of the
business model upon first-time adoption (FTA) led to the transfer of some securities classified at
31 December 2017 as available-for-sale financial assets to financial assets at amortised cost.
For the definition of the portfolio of financial assets at amortised cost, the thresholds have been
defined for considering frequent but non-significant sales or infrequent sales, even if of a
significant amount, as admitted.
With regard to equity instruments, securities classified in the category of financial assets available
for sale as set forth in IAS 39 were identified for which to exercise the option of classification at
fair value through other comprehensive income (without reversal to the income statement even
if the instrument is sold).
With regard to the SPPI test, the Group set out the method to be used for carrying out the test,
and the testing activities on the loans and receivables and securities portfolio were completed in
order to identify the correct classification upon first-time adoption of the new standard. In relation
to the loans and receivables portfolio, the analyses carried out were differentiated by types of
loans and receivables and by class of product. The results may be deemed in line with those
deriving from the application of IAS 39. With regard to the securities sector, the failure of the
SPPI test entailed reclassification of certain financial instruments, previously classified as loans
and receivables with customers, in the category of financial assets at fair value through profit or
loss for a not very significant percentage compared to the overall portfolio. Based on the recent
clarifications provided by IFRIC, it should be noted, however, that investment funds classified at

43
31 December 2017 as available-for-sale financial assets mandatorily measured at fair value
through profit or loss. The application of IFRS 9 had no impact on the financial liabilities sector.
Impairment
In this area, specific analyses were carried out for operations in loans and securities. The
application of the IFRS 9 framework required the need to define the risk metrics against a lifetime
horizon conditional to expectations on future macroeconomic scenarios. To this end, the group
defined new parameters and saw to their implementation. The main elements of the transition
from the first to the second stage have been identified; in particular, reference will be made to
the change in the default lifetime probabilities as compared to the initial recognition of the
financial instrument determined by the credit quality of each individual relation on each
measurement date; moreover, the possible presence of a past due of at least 30 days and/or of
forbearance measures were considered, presumptively, to be indicative of a significant increase
in credit risk and involve the transition to the second stage. Models including forward-looking
information were carried out for calculating the 12 month expected credit loss and the lifetime
expected credit loss.
In particular, the development of the model for defining the stage to which it belongs with
reference to the use of the change in lifetime PD as the main indicator of impairment (in particular,
the estimate of the significance thresholds of the increase in credit risk - with the inclusion of the
change in lifetime PD - and the method of inclusion of the scenarios) and the development of the
methods for including macroeconomic scenarios (for the purposes of staging and calculating the
expected credit loss) were considered. With reference to this last aspect, alternative methods
were analysed, and also in consideration of the proportionality criterion, the Group will use the
approach known as “Most likely scenario+add on”. This approach envisages determining the
expected loss in the baseline scenario considered the most probable and used for other purposes
(for example, for budget and planning purposes) to which an add on was added to reflect the
effects of the possible non-consistency of the expected credit loss compared to macro-economic
scenarios.
With reference to securities, external providers were used to determine the expected credit loss.
The first-in-first-out or FIFO method was used to calculate the reversal to the income statement
of the expected loss recorded in case of sales.
For some categories of residual loans, the low credit risk redemption was used; based on this,
the loans in question were deemed in stage 1, since as of the date of transition they had a rating
equal to or greater than the investment grade.
There were no changes in the classification criteria for non-performing loans in the third stage
considering the alignment of the already existing accounting and regulatory default definitions.
The activities for analysing the recognition of the impacts of including forward-looking factors that
adapt the weighed-up probabilities of occurrence of the different future scenarios in measuring
exposures classified in the third stage were carried out. Specifically, alternative recovery scenarios
were considered like the sale of portfolios of non-performing loans in relation to the corporate
objectives to reduce the non-performing financial assets in the 2018-2020 Business Plan, to which
a realisation probability must be attributed, to be considered in the overall measurement.
Hedge Accounting
With regard to hedge accounting, the Standard was examined by identifying the main changes
and analysing the possibility of continuing to use the provisions of IAS 39 (opt-in/opt-out option
envisaged by the Accounting Standard). Based on these analyses and the operations in place on
first-time adoption of IFRS 9, the group exercised the opt-out option. Therefore, hedging
transactions will continue to be managed in compliance with IAS 39.

44
Other information
Also, the group uses the exemption from the obligation to restate the comparative figures on a
like-for-like basis in the financial statements of first-time adoption of the new standard envisaged
by IFRS 9 par. 7.2.15 and by paragraphs E1 and E2 of IFRS 1. The Bank of Italy issued the 5th
update of Circular 262 “Banking Financial Statements: formats and guidelines” that implements
IFRS 9 with the consequent changes introduced in other international accounting standards,
including IFRS 7 “Financial Instruments: Disclosures”, and also considers the new international
accounting standard IFRS 15 “Revenue from Contracts with Customers”. Upon issuing this update,
banks using the exemption from the obligation to restate the comparative values must include -
in the first financial statements drawn up on the basis of this update - a reconciliation statement
showing the methods used and providing a reconciliation between the data of the last approved
financial statements and the first financial statements drawn up based on the new provisions. The
form and content of this information are up to the competent corporate bodies.
Reconciliation statements
A statement of reconciliation between the Consolidated Statement of Financial Position included
in the Consolidated Financial Statements at 31 December 2017 and the Consolidated Statement
of Financial Position introduced by the 5th update of Bank of Italy Circular no. 262/05, which
implements the adoption of IFRS 9, is shown below. In this statement, the accounting balances
at 31 December 2017 determined in accordance with IAS 39 are traced back to the new
accounting items without applying the new classification and measurement criteria.

45
(in thousands of EUR)
Statement of Financial Position Items included in the 2017 Financial Statements - Assets
“5th update of Circular no. 262/05” Statement of Financial Position Items - Assets
31/12/2017
10. Cash and cash equivalents 197,829
10. Cash and cash equivalents 197,829
20. Financial assets held for trading 20,681
20. Financial assets at fair value through profit or loss a) financial assets held for trading 20,681
40. Available-for-sale financial assets 4,419,352
30. Financial assets at fair value through other comprehensive income 4,419,352
60. Loans and receivables with banks 2,033,413
40. Financial assets at amortised cost a) loans and receivables with banks 2,033,413
70. Loans and receivables with customers 16,680,944
40. Financial Assets at amortised cost a) loans and receivables with customers 16,680,944
80. Hedging derivatives 199
50. Hedging derivatives 199
100. Equity investments 24,371
70. Equity investments 24,371
120. Property, equipment and investment property 395,251
90. Property, equipment and investment property 395,251
130. Intangible assets 44,591
100. Intangible assets 44,591
140. Tax assets: a) current 80,987
110. Tax assets: a) current 80,987
140. Tax assets: b) deferred 595,643
110. Tax assets: b) deferred 595,643
150. Non-current assets held for sale and disposal groups 3,955
120. Non-current assets held for sale and disposal groups 3,955
160. Other assets 459,608
130. Other assets 412,926
90. Property, equipment and investment property 46,682
Total assets Total assets 24,956,824

46
(in thousands of EUR)
Statement of Financial Position Items included in the 2017 Financial Statements -Liabilities
“5th update of Circular no. 262/05” Statement of Financial Position Items - Liabilities 31/12/2017
10. Due to banks 3,143,189
10. Financial liabilities at amortised cost a) due to banks 3,143,189
20. Due to customers 16,841,601
10. Financial liabilities at amortised cost b) due to customers 16,841,601
30. Securities issued 2,789,682
10. Financial liabilities at amortised cost c) securities issued 2,789,682
40. Financial liabilities held for trading 713
20. Financial liabilities held for trading 713
60. Hedging derivatives 138,691
40. Hedging derivatives 138,691
80. Tax liabilities: a) current 2,184
60. Tax liabilities: a) current 2,184
80. Tax liabilities: b) deferred 179
60. Tax liabilities: b) deferred 179
100. Other liabilities 431,330
80. Other liabilities 421,399
100. Provisions for risks and charges a) commitments and guarantees given 9,931
110. Post-employment benefits 46,546
90. Post-employment benefits 46,546
120. Provisions for risks and charges: a) pension and similar obligations 33,520
100. Provisions for risks and charges: b) pension and similar obligations 33,520
120. Provisions for risks and charges: b) other provisions 81,743
100. Provisions for risks and charges: c) other provisions for risks and charges 81,743
140. Valuation reserves -12,145
120. Valuation reserves -12,145
170. Reserves -60,629
150. Reserves -60,629
190. Share capital 1,846,817
170. Share capital 1,846,817
200. Treasury shares (-) -100
180. Treasury shares (-) -100
210. Equity attributable to non-controlling interests (+/-) 5,352
190. Equity attributable to non-controlling interests (+/-) 5,352
220. Loss for the year (+/-) -331,849
200. Loss for the year (+/-) -331,849
Total liabilities and equity Total liabilities and equity 24,956,824

47
In addition to the changes due to the application of IFRS 9, the update of Bank of Italy Circular
no. 262 of December 2017 also included classification in item “90. Property, equipment and
investment property” of inventories of property, equipment and investment property covered by
IAS 2 that were previously recognised as “Other Assets”.
A statement of reconciliation between the consolidated income statement of the first half of 2017
prepared based on the format envisaged in 2017 and the income statement introduced by the
5th update of Bank of Italy Circular no. 262/05, which implements the adoption of IFRS 9. In this
statement, the accounting balances of the first half of 2017 determined in accordance with IAS
39 are traced back to the new accounting items without applying the new classification and
measurement criteria.
(in thousands of EUR)
Consolidated income statement items of the first quarter of 2017
“5th update of Circular no. 262/05” consolidated income statement items of the first quarter
First half of 2017
10. Interest and similar income 268,431
10. Interest and similar income 268,431
20. Interest and similar expense (69,659)
20. Interest and similar expense (69,659)
30. Net interest income 198,772
30. Net interest income 198,772
40. Fee and commission income 156,498
40. Fee and commission income 156,498
50. Fee and commission expense (14,182)
50. Fee and commission expense (14,182)
60. Net fee and commission income 142,316
60. Net fee and commission income 142,316
70. Dividends and similar income 2,876
70. Dividends and similar income 2,876
80. Profits (Losses) on trading 2,882
80. Profits (Losses) on trading 2,882
90. Net hedging income (expense) (49)
90. Net hedging income (expense) (49)
100. Profit (Loss) on sale or repurchase of: a) loans and receivables (13,411)
100. Profit (Loss) on sale or repurchase of: a) financial assets at amortised cost (13,411)
100. Profit (Loss) on sale or repurchase of: b) available-for-sale financial assets 21,879
100. Profit (Loss) on sale or repurchase of: b) financial assets at fair value through other comprehensive income 21,879
100. Profit (Loss) on sale or repurchase of: d) financial liabilities (491)
100. Profit (Loss) on sale or repurchase of: c) financial liabilities (491)
120. Total income 354,774
120. Total income 354,774
130. Net impairment losses on: a) loans and receivables (293,396)

48
130. Net impairment losses for credit risk on: a) financial assets at amortised cost (293,396)
130. Net impairment losses on: b) available-for-sale financial assets (35,166)
130. Net impairment losses for credit risk on: b) financial assets at fair value through othercomprehensive income (35,166)
130. Net impairment losses on: d) other financial transactions (40,451)
200. Net accruals to provisions for risks and charges a) commitments and guarantees given (40,451)
140. Net financial income (14,239)
150. Net financial income 26,212
180. Administrative expenses: a) personnel expenses (134,315)
190. Administrative expenses: a) personnel expenses (134,315)
180. Administrative expenses: b) other administrative expenses (133,429)
190. Administrative expenses: b) other administrative expenses (133,429)
190. Net accruals to provisions for risks and charges (42)
200. Net accruals to provisions for risks and charges b) other net accruals (42)
200. Depreciation and net impairment losses on property, equipment and investment property (9,155)
210. Depreciation and net impairment losses on property, equipment and investment property (9,155)
210. Amortisation and net impairment losses on intangible assets (4,011)
220. Amortisation and net impairment losses on intangible assets (4,011)
220. Other operating net income 35,730
230. Other operating net income 35,730
230. Operating costs (245,222)
240. Operating costs (285,673)
240. Net gains (losses) on equity investments 158
250. Net gains (losses) on equity investments 158
250. Net result of property, equipment and investment property and intangible assets at fair value (1,146)
260. Net result of property, equipment and investment property and intangible assets at fair value (1,146)
270. Net gains (losses) on sales of investments 69,926
280. Net gains (losses) on sales of investments 69,926
280. Pre-tax profit (loss) from continuing operations (190,523)
290. Pre-tax profit (loss) from continuing operations (190,523)
290. Income taxes (2,477)
300. Income taxes (2,477)
320. Profit (Loss) for the period (193,000)
330. Profit (Loss) for the period (193,000)
330. Profit (Loss) for the period attributable to non-controlling interests (1,828)
340. Profit for the period attributable to non-controlling interests (1,828)
340. Profit (Loss) for the period attributable to owners of the parent (194,828)
350. Profit (Loss) for the period attributable to owners of the parent (194,828)

49
We also state that:
- in the Statement of Cash Flows for the first half of 2017, prepared on the basis of the
format envisaged by Circular 262/05 in 2017, item “B. INVESTING ACTIVITIES 2. Cash
flow used for - purchases of financial assets held to maturity” (amounting to EUR -805,189
thousand) has been reclassified to item “A. OPERATING ACTIVITIES 2. Cash flow
generated/used by financial assets - financial assets at amortised cost” of the Statement
of Cash Flows introduced by the 5th update of Bank of Italy Circular no. 262/05;
- in the Statement of Comprehensive Income of the first half of 2017, prepared on the basis
of the format envisaged by Circular 262/05 in 2017, the equity instrument component
shown in item “100. Available-for-sale financial assets” was shown in item “150. Financial
assets (other than equity instruments) at fair value through other comprehensive income”.
The effects of the first-time adoption of IFRS 9
Impacts from the application of the new rules envisaged by IFRS 9, recognised by using the equity
as an offsetting item at 1 January 2018, are shown below.
With reference to the application of the new rules for the classification and measurement of
financial assets, impacts derive from:
- the reclassification of Available-for-sale financial assets at fair value with changes in value
recognised in equity in the portfolio of Financial assets at fair value through profit or loss
(OEIC units and equity instruments for which the option of classification at fair value
through other comprehensive income was not exercised). As a result, a positive first-time
adoption reserve of EUR 8 million was recognised in equity. This amount was already
stated at 31 December 2017 in valuation reserves;
- the reclassification of Available-for-sale financial assets to Financial assets at amortised
cost that led to the recalculation of the gross carrying amount and the derecognition of
the corresponding valuation reserve (gross AFS Reserve of EUR -16.1 million).
With reference to the application of the new rules for impairment, impacts derive from:
- the calculation of higher impairment losses on performing financial assets at amortised
cost for an amount of EUR 72.1 million mainly deriving from the classification of loans in
stage 2 with the consequent calculation of the expected loss for the entire remaining
duration of financial assets as well as from the application of the 12 month expected credit
loss for the loans classified in stage 1 and from the inclusion in the calculation of the
expected losses of forward looking parameters based on future macroeconomic scenarios;
- the calculation of higher impairment losses on guarantees given and commitments to
grant finance of EUR 5.4 million recognised as provisions for risks and charges deriving
from the classification of loans in stage 2 with the consequent calculation of the expected
loss for the entire remaining duration of financial assets as well as from the application of
the 12 month expected credit loss for the loans classified in stage 1 and from the inclusion
in the calculation of the expected losses of forward looking parameters;
- the calculation of higher impairment losses on Financial assets at fair value through other
comprehensive income of EUR 0.6 million that can be traced back to the application of the
12 month expected credit loss for loans classified in stage 1 and from the inclusion in the
calculation of expected losses of forward looking parameters;
- the calculation of higher impairment losses on Non-performing financial assets at
amortised cost of EUR 520.4 million mainly due to the inclusion of the sales scenarios
consistent with the company objectives to reduce the non-performing financial assets

50
included in the 2018-2020 Business Plan (for part of the non-performing loan portfolio
with transferable characteristics).
No deferred tax assets from tax losses have been recorded on the above impacts in consideration
of the results of the probability test carried out, which has not already allowed the recording of a
part of deferred tax assets from tax losses in 2017. The tax effects considered and recognised in
equity are due to the recognition or derecognition of deferred tax assets that derive from
temporary differences. With reference to the impact of classification and measurement, tax effects
were recorded for a total amount of EUR -4.7 million. With reference to impairment, there are tax
effects of a positive amount of EUR 1.5 million.
The reconciliation between Statement of Financial Position at 31 December 2017, restated based
on the 5th update of Bank of Italy Circular no. 262/05 and the same document at 1 January 2018,
including the effects of first-time adoption as described above.
(in thousands of EUR)
ASSETS 31/12/2017
Reclassifications/Changes in value
Classification and Measurement
Impairment 01/01/2018
10. Cash and cash equivalents 197,829 - - 197,829
20. Financial assets at fair value through profit or loss 20,681 186,825 - 207,506
a) financial assets held for trading 20,681 - - 20,681
b) financial assets designated at fair value - - - -
c) other financial assets mandatorily measured at fair value - 186,825 - 186,825
30. Financial assets at fair value through other comprehensive income 4,419,352 -735,061 - 3,684,291
40. Financial assets at amortised cost 18,714,357 564,376 -592,505 18,686,228
a) loans and receivables with banks 2,033,413 - -722 2,032,691
b) loans and receivables with customers 16,680,944 564,376(*) -591,783 16,653,537
50. Hedging derivatives 199 - - 199
70. Equity investments 24,371 - - 24,371
90. Property, equipment and investment property 441,933 - - 441,933
100. Intangible assets 44,591 - - 44,591
110. Tax assets 676,630 -4,665 1,543 673,508
a) current 80,987 - - 80,987
b) deferred 595,643 -4,665 1,543 592,521
120. Non-current assets held for sale and disposal groups 3,955 - - 3,955
130. Other assets 412,926 - - 412,926
Total assets 24,956,824 11,475 -590,962 24,377,337
(*) This net increase derives from: inclusion of securities previously classified as “Available-for-sale financial assets” with a fair value of EUR 550,293 thousand; recalculation of the value of these securities according to the amortised cost method, with an increase of EUR 16,140 thousand; the reclassification of some securities under item “20. c) other financial assets mandatorily measured at fair value” of EUR 2,057 thousand.

51
LIABILITIES AND EQUITY 31/12/2017
Reclassifications/Changes in value
Classification and Measurement
Impairment 01/01/2018
10. Financial liabilities at amortised cost 22,774,472 - -
22,774,472
a) due to banks 3,143,189 - -
3,143,189
b) due to customers 16,841,601 - -
16,841,601
c) securities issued 2,789,682 - -
2,789,682
20. Financial liabilities held for trading 713 - -
713
40. Hedging derivatives 138,691 - -
138,691
60. Tax liabilities: 2,363 - -
2,363
a) current 2,184 - -
2,184
b) deferred 179 - -
179
80. Other liabilities 421,399 - -
421,399
90. Post-employment benefits 46,546 - -
46,546
100. Provisions for risks and charges: 125,194 -
5,413 130,607
a) commitments and guarantees given 9,931 -
5,413 15,344
b) pension and similar obligations 33,520 -
- 33,520
c) other provisions for risks and charges 81,743 -
- 81,743
120. Valuation reserves -12,145 3,930 387 -7,828
150. Reserves -60,629 7,545 -595,351 -648,435
160. Share premium reserve - - - -
170. Share capital 1,846,817 - - 1,846,817
180. Treasury shares (-) -100 - - -100
190. Equity attributable to non-controlling interests (+/-) 5,352 - -1,411 3,941
200. Profit (Loss) for the period (+/-) -331,849 - - -331,849
Total liabilities and equity 24,956,824 11,475 -590,962 24,377,337
The following table shows the credit risk of Loans and receivables with customers at 31 December
2017 and 1 January 2018 following application of IFRS 9 (exposures at 1 January 2018 include
the reclassifications of securities made on first-time adoption represented above).
(in thousands of EUR)
31/12/2017 - IAS 39 01/01/2018 - IFRS 9
Performing loans
Non-performing
loans Total
Performing loans Non-performing
loans Total
Loans and receivables with customers Stage 1 Stage 2 Stage 3
Gross amount 14,545,619 4,020,835 18,566,454 12,984,676 2,125,319 4,020,835 19,130,830
Impairment losses -62,303 -1,823,207 -1,885,510 -31,367 -102,291 -2,343,635 -2,477,293
Carrying amount 14,483,316 2,197,628 16,680,944 12,953,309 2,023,028 1,677,200 16,653,537
At 31 December 2017, loans and receivables with banks amounted to EUR 2,033,413 thousand
and are represented by performing loans. No impairment losses were recorded. The first
application involved the classification of EUR 2,022,591 thousand in stage 1 with the recognition
of impairment losses of EUR 651 thousand and the classification of EUR 10,822 thousand in stage
2 with the recognition of impairment losses of an amount of EUR 71 thousand.
Finally, the reconciliation statement between the Consolidated Equity at 31 December 2017
included in the Consolidated Financial Statements at 31 December 2017 and the opening
Consolidated Equity at 1 January 2018 is shown, after the transition to IFRS 9, which once again
shows the effects commented above.

52
(in thousands of EUR)
Consolidated equity attributable to owners of the parent at 31/12/2017 1,442,094
Classification and Measurement
Financial assets at amortised cost 16,140
Impairment
Financial assets at amortised cost -592,505
- of which Stage 1 and 2 -72,077
- of which Stage 3 -520,428
Provisions for risks and charges a) commitments and guarantees given -5,413
Tax effects -3,122
Total effects -584,900
of which equity attributable to non-controlling interests -1,411
of which equity attributable to owners of the parent -583,489
Consolidated equity attributable to owners of the parent at 1/1/2018 858,605
Note that reclassifications have been recorded under valuation reserves and profit reserves (FTA
reserve) both as a result of the application of the new classification and measurement criteria and
as a result of the application of the new impairment model.
The effect of first-time adoption of IFRS 9 on coefficients
On 12 December 2017, Regulation (EU) 2017/2395 “Transitional arrangements for mitigating the
impact of the introduction of IFRS 9 on own funds” was issued introducing the new article 473 bis
“Introduction of IFRS 9” in Regulation 575/2013. This article offers banks the possibility of
mitigating the impacts on own funds deriving from the introduction of the new rules on impairment
envisaged by IFRS 9 over a transitory period of 5 years, sterilising the impact in CET1 by applying
percentages that decrease over time.
The group adopts the provisions contained in this article both with reference to the impact
resulting from the comparison between the IAS 39 impairment losses at 31 December 2017 and
those of IFRS 9 at 1 January 2018 and with reference to the higher impairment losses on stage 1
and 2 appearing at the end of the period of reference compared to the same impairment losses
at 1 January 2018. This makes it possible to consider within Common Equity Tier 1 (CET1) a
smaller portion of the impact of the new accounting standard on own funds, calculated net of the
tax effect. This portion gradually decreases from 95% in 2018 to 85% in 2019, 70% in 2020,
50% in 2021 and 25% in 2022.
The application of IFRS 9 on a fully-phased basis, without considering the recalculation of the
thresholds envisaged by the CRR and the share capital increase in the first quarter of 2018,
resulted in a CET1 of 6.2% and a total capital ratio of 8.2%.
First-time adoption of IFRS 15 Revenue from contracts with customers
With reference to IFRS 15, the new accounting standard introduces a single model for the
recognition of revenue, applicable to all the commercial agreements, with the exception of lease
contracts, insurance contracts and financial instruments that require the recognition of revenue
according to the consideration expected to receive against the goods and services provided.
The new standard introduces a five-step model to analyse the transactions and define the
recognition of revenue with reference both to timing and amount:
- identify the contract with a customer;
- identify the performance obligations in the contract;

53
- determine the transaction price (if necessary, estimated);
- allocate the transaction price to the performance obligations in the contract;
- recognise revenue when (or as) the entity satisfies a performance obligation.
The main revenue items that fall within the scope of the new standard were analysed by examining
their components and the related accounting treatment in accordance with IFRS 15. The analyses
carried have not revealed any substantial elements of discontinuity with the accounting method
currently applied. Consequently, the effects of the application of the new standard will mainly
concern new requests for information to be made in financial reports. The standard provides
information on the nature, amount, timing and uncertainty of revenue and cash flows arising from
contracts with customers. These requirements were implemented by the 5th update of Bank of
Italy circular no. 262/05.
Further amendments to international accounting standards
The following additional amendments to the international accounting standards were also
introduced effective as from 1 January 2018:
- Commission Regulation (EU) 2018/519 of 28 March 2018 adopting IFRIC 22 Foreign
Currency Transactions and Advance Consideration. The Interpretation clarifies the
accounting for transactions that include the receipt or payment of advance consideration
in a foreign currency;
- Commission Regulation (EU) 2018/400 of 14 March 2018 adopting the “Amendments to
IAS 40 Investment Property – Transfers of Investment Property”. The amendments clarify
when a company is allowed to reclassify a property to (or from) the “investment property”
category.
- Commission Regulation (EU) 2018/289 of 26 February 2018 adopting the “Amendments
to IFRS 2 Share-based Payment” to clarify how companies should apply the standard in
some specific instances;
- Commission Regulation (EU) 2018/182 of 7 February 2018 adopting the “Annual
Improvements to IFRS Standards 2014–2016 Cycle”. The objective of the annual
improvements is to address non-urgent issues discussed by the IASB during the project
cycle on areas of inconsistencies in International Financial Reporting Standards or where
clarification of wording is required;
- Commission Regulation (EU) 2017/1988 of 3 November 2017 adopting the “Applying IFRS
9 Financial Instruments with IFRS 4 Insurance Contracts”. The objective is to resolve, for
insurance companies, the problems related to the application of IFRS 9, before the
implementation of the standard that will replace IFRS 4 on insurance contracts.
There were no significant impacts due to their application.
The new international accounting standards or the amendments to the accounting standards
already in force, with the related endorsement regulations issued by the European Commission,
whose mandatory application begins after the 2018 financial year, are summarised below:
- Regulation (EU) 1986/2017 adopting IFRS 16 Leases, which introduces new rules for
representing lease contracts both for lessors and for lessees and that replaces the
previously issued standards and interpretations in the field (IAS 17 “Leases”, IFRIC 4
“Determining whether an Arrangement contains a Lease”, SIC 15 “Operating Leases –
Incentives” and SIC 27 “Evaluating the Substance of Transactions in the Legal Form of a
Lease”);
- Regulation (EU) 2018/498 adopting amendments to IFRS 9 Financial Instruments -
Prepayment features with Negative Compensation. The amendments aim to clarify the
classification of particular prepayable financial assets when applying IFRS 9. Companies

54
apply amendments at the latest from the start date of their first financial year beginning
on or after 1 January 2019.
In drawing up the condensed interim consolidated financial statements, estimates and
assumptions were used, which may affect the values recorded in the statement of financial
position, income statement and the Notes to the condensed interim consolidated financial
statements.
The most important valuation processes, such as the assessment of any impairment loss on
assets, are only carried out completely for the preparation of the annual financial statements
when all necessary information is available. Important impairment indicators requiring immediate
assessment are an exception.
Basis of preparation
The condensed interim consolidated financial statements comprise the Statement of financial
position, Income Statement, Statement of Comprehensive Income, Statement of changes in
equity, Statement of cash flows (Financial Statements) and Notes to the condensed interim
consolidated financial statements.
The financial statements were prepared in compliance with the “Instructions for the preparation
of the separate financial statements and of the consolidated financial statements of banks and
financial companies that are parents of banking groups” contained in Circular no. 262/2005 of
Bank of Italy and following updates.
The Bank of Italy issued the 5th update of Circular 262 “Banking Financial Statements: formats
and guidelines” that implements IFRS 9 with the consequent changes introduced in other
international accounting standards, including IFRS 7 “Financial Instruments: Disclosures”, and
also considers the new international accounting standard IFRS 15 “Revenue from Contracts with
Customers”. Upon issuing this update, banks using the exemption from the obligation to restate
the comparative values must include - in the first financial statements drawn up on the basis of
this update - a reconciliation statement showing the methods used and providing a reconciliation
between the data of the last approved financial statements and the first financial statements
drawn up based on the new provisions. The form and content of this information are up to the
competent corporate bodies.
As specified above, the Group uses the exemption from the obligation to restate the comparative
figures on a like-for-like basis in the financial statements of first-time adoption of the new
standard. The comparative periods shown in the financial statements, which refer to 31 December
2017 for the statement of financial position data and to the first half of 2017 for the income
statement data, have been restated compared to those published in 2017, in accordance with the
provisions of Bank of Italy Circular 262, which regulate financial statements of banks to take
account of the regulatory changes described above. The section that describes the first-time
adoption of IFRS 9 includes reconciliation statements that illustrate the reconciliations made
between the previous items in the official statements and those in the new official statements
envisaged by Circular 262/2005. In the tables of the Notes to the condensed interim consolidated
financial statements, the period of comparison was reconciled with the new items introduced by
IFRS 9 except in some cases in which, for the sake of clarity, the period of comparison was
separately shown.
The amounts reported in the Financial Statements and in the Notes to the condensed interim
consolidated financial statements are in thousands of EUR, unless indicated otherwise.
In the Statement of financial position, Income Statement and Statement of Comprehensive
Income, any item equal to zero in the reporting period of reference or in the previous period is

55
not shown. In the Income Statement and Statement of Comprehensive Income, negative amounts
are shown in brackets.
The condensed interim consolidated financial statements at 30 June 2018 are accompanied by
the certification of the Managing Director and of the Manager in charge of financial reporting
envisaged by Article 154 bis of the Consolidated Finance Act and is subject to a limited audit by
KPMG S.p.A.
Business performance and outlook
The Bank of Italy, Consob and Isvap Document no. 2 of 6 February 2009, as well as the following
Document no. 4 of 3 March 2010, require providing information on business outlook in the
financial statements, with a special reference to going concern assumptions, financial risk,
impairment testing and uncertainties in the use of estimates.
With a special reference to going concern, the Credito Valtellinese Directors confirm their
reasonable expectations that the Bank and the Group will remain a going concern in the
foreseeable future and, consequently, the condensed interim consolidated financial statements at
30 June 2018 were prepared on a going concern basis.
The opinion on the going concern was made considering the 2018-2020 Business Plan and the
objectives set out therein, which include the capital increase transaction concluded in the first
quarter of 2018 with full subscription.
The 2018-2020 Business Plan envisages, in addition to the capital strengthening achieved through
the share capital increase, the acceleration of the de-risking and restructuring actions consistently
with the objectives defined in the 2017-2018 Action Plan, with the aim of definitively overcoming
the legacy of the long economic crisis and pre-establishing the conditions for returning to a
sustainable organic profitability in the medium term.
As regards the requirements relating to the disclosure on financial risks, impairment testing of
assets and uncertainties in the use of estimates, please refer to the information provided below
within the discussion of the related items.
Information on risks is described in the chapter of the Notes to the condensed interim consolidated
financial statements dedicated to risk management. Moreover, the Notes to the condensed interim
consolidated financial statements provide the fair value of the financial instruments determined
on the basis of the methods indicated in the financial statements at 31 December 2017, document
to which reference is made for detailed information.
Specific tests were carried out to ascertain any impairment of equity investments, intangible
values and goodwill, subject to the analysis of the presence of impairment indicators. The same
methods and criteria shown in the 2017 financial statements were used in order to determine any
impairment loss.
Consolidation scope and methods
The condensed interim consolidated financial statements include Credito Valtellinese and the
companies directly or indirectly controlled by it. The financial statements used for preparing the
condensed interim consolidated financial statements have the same reporting date.
Investments in companies subject to exclusive control are those in respect of which Credito
Valtellinese has the power over the investee, is subject to exposure or rights to variable returns
from its involvement with the investee and can use its power over the investee to affect the
amount of the investor's returns. Investments in companies subject to joint control are those in
respect of which the Parent, together with other parties subject to the terms of an agreement,

56
has the power of governing the decisions relating to the relevant activities of the agreement, with
the unanimous consent of the parties sharing control.
The financial statements of subsidiaries are consolidated on a line-by-line basis from when the
Parent starts to exercise control until the date on which this control ends. The carrying amount
of the equity investments in these companies is offset against the corresponding shares of equity.
The differences arising from this transaction, after recording the subsidiary’s assets and liabilities,
are recognised, if positive under “Intangible assets” - Goodwill; if negative, they are directly
recognised in the income statement. Non-controlling interests are assigned the corresponding
shares of equity and profit (loss).
Assets, liabilities, income and expenses among consolidated companies are eliminated. The
financial statements of subsidiaries are prepared at the same reporting date and adopting financial
reporting standards consistent with the Parent. In case of discrepancy between the measurement
criteria adopted by a subsidiary and those used in the consolidated financial statements, the
subsidiary's financial statements are adjusted for consolidation purposes.
Associates are those under significant influence, i.e. the Parent has the power of participating in
the determination of financial and management policies but has no control or joint control over
those policies.
Investments in associates and subsidiaries subject to joint control have been accounted at equity.
The investment is initially recognised at cost, the amount later being increased or decreased due
to the effect of investee profits or losses, recorded according to the equity ratios under “Net gains
(losses) on equity investments”, of dividends received and other changes in the equity of the
investees. Other changes are booked to reserves. The differences between the carrying amount
of the equity investment and the equity of the related investee are included in the carrying amount
of the investee.
Dividends booked to the Parent's financial statements and concerning equity investments in
companies included in the consolidation scope or equity-accounted have been cancelled. Taxes
associated with consolidation adjustments have been accounted for, where applicable.
Commitments for the repurchase of own equity instruments, including commitments to purchase
equity instruments of companies consolidated in full, give rise to a financial liability for the current
amount payable. The initial recognition of the liability occurs by using the equity as an offsetting
item.
Compared to the financial statements at 31 December 2017, the scope of consolidation at 30
June 2018 includes Claris Factor S.p.A., company fully controlled by Credito Valtellinese, whereas
it does no longer include Credito Siciliano S.p.A., company merged into Credito Valtellinese, and
Quadrivio SME 2014 S.r.l. since the related securitisation transaction was closed in the first half
of 2018.

57
A list of equity investments in fully consolidated subsidiaries is provided in the table below.
1. Investments in companies subject to exclusive control
Company name Operating office Registered office Type of
relationship
Type of equity investment
Investor company
% held
1. Credito Valtellinese S.p.A. Sondrio Sondrio
2. Creval Sistemi e Servizi Soc. Cons. P.A. Sondrio Sondrio 1 1 95.42
3 0.92
4 0.92
6 0.92
7 0.92
3. Stelline Real Estate S.p.A. Sondrio Sondrio 1 1 100.00
4. Creval PiùFactor S.p.A. Milano Milano 1 1 100.00
5. Claris Factor S.p.A. Montebelluna (TV) Montebelluna (TV) 1 1 100.00
6. Global Assicurazioni S.p.A. Milano Milano 1 1 60.00
7. Global Broker S.p.A. Milano Milano 1 1 51.00
8. Quadrivio Rmbs 2011 S.r.l. Conegliano Conegliano 4
Key: Type of relationship: 1 = majority of voting rights at ordinary shareholders'/quotaholders' meeting 2 = considerable influence in ordinary shareholders'/quotaholders' meeting 3 = agreements with other shareholders 4 = other forms of control 5 = sole management pursuant to article 26, paragraph 1 of “Italian Legislative Decree no. 87/92” 6 = sole management pursuant to article 26, paragraph 2 of “Italian Legislative Decree no. 87/92”
Events after the reporting period
Reorganisation of Bancassurance activities
On 24 July 2018, the following agreements were signed:
- the Framework Agreement between Creval and Rifin aimed at restructuring the existing
agreements, reorganising the co-equity investments held by Creval and Rifin in the companies
Global Assicurazioni, Global Assistance S.p.A. (“Global Assistance”) and Global Broker S.p.A.
(“Global Broker”), as well defining two new distribution agreements with the aforesaid insurance
companies of the Rifin Group, relating to the Non-Life bancassurance business, and to the
insurance brokerage activity on Creval customers (the “CV/Rifin Agreement”), both exclusively
and for a duration of 15 years.
Upon completion of the CV/Rifin Agreement, against a total disbursement of EUR 34 million to
Rifin, in relation to the purchase and sale of the equity investments, Creval will hold: i) 100% of
the share capital of Global Assicurazioni and ii) 30% of the share capital of Global Broker. The
Rifin Insurance Group will hold: i) 100% of the insurance company Global Assistance, specialised
in non-life bancassurance products in particular, ii) 100% of the multifirm agency (Nuova) Global
Assicurazioni S.p.A., which was set up following the demerger of the business unit of Global
Assicurazioni and specialised in non-life bancassurance processes and products, and iii) 70% of
Global Broker, an insurance brokerage company with a special focus on SME, private and public
customers.

58
- the Framework Agreement between CreVal and Crédit Agricole Assurances SA (“CAA”) for the
launch of an exclusive long-term partnership in the life insurance business (“CV/CAA
Agreement”). The partnership will provide CAA, through its Italian subsidiary Crédit Agricole Vita
S.p.A. (“CA Vita”), with access to CreVal's network for the distribution of all savings and
investment insurance products as well as certain protection segment products for a duration of
up to 15 years. As part of the transaction, CAA will purchase 100% of the share capital of Global
Assicurazioni S.p.A. (“GA”), a company that, following the restructuring by the current
shareholders (Creval and Rifin) as detailed above, at the closing date will be wholly owned by
CreVal and will exclusively include the business related to the life insurance policies distributed
on the CreVal network.
The total consideration paid by CAA for the acquisition of GA will be EUR 80 million, of which EUR
70 million paid by CAA at the closing and EUR 10 million deferred, payable at the end of the fifth
year subject to the achievement of previously agreed objectives.
As a result of the CV/CAA Agreement and the CV/Rifin Agreement, the performance of which
remains subject to completion, among other things, of the authorisations of the competent
Supervisory Authorities, Global Assicurazioni and Global Broker will leave the Creval Group's
scope of consolidation.
Merger by incorporation of the subsidiary Creval Sistemi e Servizi into Credito
Valtellinese
On 26 July 2018, the Board of Directors of Creval and of the subsidiary Creval Sistemi e Servizi
(“CSS”) resolved to carry out the merger by incorporation of CSS into Credito Valtellinese S.p.A.
The merger is to be implemented through the simplified system set forth in Article 2505 of the
Italian Civil Code on the assumption that, at the date of effectiveness of the Merger, all CSS
shares, i.e. 100% of the share capital of CSS, are owned by Creval. The transfer of CSS shares
to Credito Valtellinese will take place on the basis of the pro-rata book equity of CSS, in
accordance with its articles of association.
Once the Authorisation has been obtained and the statutory procedure has been completed, the
merger is expected to become effective by the end of the current financial year.
Industrial partnership as part of the activities relating to loans against pledges in Italy
On 9 August 2018, an agreement was signed for the creation of an industrial partnership as part
of the activities relating to loans against pledges in Italy. The partnership will be implemented by
means of Custodia Valore, company created through the acquisition by Dorotheum of the business
dedicated to loans against pledges of the UniCredit Group.
The Transaction envisages (i) a capital increase of Custodia Valore, with the exclusion of the right
of option reserved to Creval, to be released through the contribution of the Creval business unit
dedicated to loans against pledges, in exchange for a non-controlling interest equal to 22% of the
share capital of Custodia Valore and (ii) the provision by Creval of information technology and
support services to Custodia Valore.
Therefore, at the end of the Transaction, the share capital of Custodia Valore will be held by the
Dorotheum Group (78%) and Creval (22%).
The Transaction, subject to the authorisations of the competent Supervisory Authorities, is
expected to be closed by the end of 2018.

59
Industrial partnership in the salary-backed loan market
On 9 August 2018, Creval, Cassa di Risparmio di Asti S.p.A. and Bonino 1934 s.r.l. (“Bonino”)
signed a Term sheet concerning the essential terms and conditions that will regulate: (i) the
purchase by Creval of a 9.9% equity investment in the share capital of Pitagora S.p.A.
(“Pitagora”); by signing at the same time the shareholders' agreements that will envisage, among
other things, the representation of Creval in the Board of Directors of Pitagora, as well as (ii) the
revision and renewal for five years of the existing sales agreement by and between Pitagora and
Creval for the promotion of salary-backed loan agreements, with important objectives of
disbursement on the Creval network.
Main items in the financial statements
This section provides information on the accounting standards adopted for the preparation of the
condensed interim consolidated financial statements at 30 June 2018, with the recognition,
classification, measurement and derecognition criteria illustrated for each individual item,
including, if relevant, the recognition criteria for the income components.
1 - Financial assets at fair value through profit or loss
This category includes financial assets other than those recognised as Financial assets at fair value
through other comprehensive income and Financial assets at amortised cost.
The item “20. Financial assets at fair value through profit or loss” includes:
- financial assets held for trading, consisting mainly of debt instruments, equity instruments
and OEIC units and the positive value of derivative contracts, other than those designated
as effective hedging instruments, held for trading purposes;
- financial assets designated at fair value, as defined at the time of initial recognition and
where the requirements of IFRS 9 are met. Specifically, reference is made to assets whose
designation at fair value through profit or loss eliminates or significantly reduces an
inconsistency in measurement (sometimes defined as “accounting asymmetry”). The
Group does not currently classify financial assets as designated at fair value;
- other financial assets mandatorily measured at fair value, relating to financial assets that
do not meet the requirements for measurement at amortised cost or at fair value through
other comprehensive income. In particular, this item includes financial assets that: i)
generate cash flows that are not exclusively payments of principal and interest, or do not
pass the “SPPI test” (known as “solely payment of principal and interest”); (ii) they are
not held as part of a business model aimed at owning the financial asset with a view to
obtaining cash flows or collecting cash flows, including through the sale of the asset.
Debt and equity instruments and OEIC units are recognised in the financial statements at their
settlement date, loans at their disbursement date, while derivative financial instruments at their
subscription date. Upon initial recognition, they are recorded at fair value, usually represented by
the transaction price, without considering the transaction costs/revenue attributable to the
instrument recognised directly in the income statement.
Financial assets may be reclassified to other categories only if the entity changes its business
model to manage them. In these rare cases, a financial asset at fair value through profit or loss
may be reclassified as a financial asset at amortised cost or as a financial asset at fair value
through other comprehensive income. The transfer value is the fair value at the time of
reclassification and the effects of reclassification operate prospectively from the date of

60
reclassification. In this case, the effective interest rate of the reclassified financial asset is
determined on the basis of its fair value on the date of reclassification, and that date is considered
as the date of initial recognition for the allocation to the various stages of credit risk for the
purposes of determining the impairment of financial assets.
Subsequent to initial recognition, financial assets at fair value through profit or loss are measured
at fair value and the effects of applying this criterion are recognised in the income statement.
Therefore, all gains and losses associated with the above, including trading income and expense,
interests and dividends received and changes in fair value due to market rate fluctuations,
changes in share prices and other market variables, are recognised in the income statement.
In the case of financial instruments quoted in active markets, the fair value is determined on the
basis of the official prices of the most favourable market to which the Group has access. If, for a
given financial instrument, the conditions for identifying an active market do not exist, it is
necessary to use a technical valuation, i.e. a process that makes it possible to identify a price at
which the instrument could be exchanged between knowledgeable willing parties in an arm's
length transaction.
Financial assets or parts thereof are derecognised when the contractual rights to the cash flows
expire or are transferred without retaining substantially the associated risks and benefits. On the
other hand, if a significant portion of the risks and benefits attached to the financial assets remains
upon transfer of their legal ownership, they will continue to be recognised in the financial
statements.
2 - Financial assets at fair value through other comprehensive income
This category includes financial assets for which both the following conditions are met:
- they are held according to a business model whose objective is both the collection of
contractual cash flows related to them and the sale of the instrument itself;
- the contract clauses meet the requirements of the SPPI test, i.e. the cash flows are
represented by payments of principal and accrued interest on the amount of principal to
be repaid on specified dates.
This item also includes equity instruments, not held for trading, for which the entity, on initial
recognition, exercised the option to designate them at fair value through other comprehensive
income.
Debt and equity instruments are recognised in the financial statements at their settlement date,
while loans at their disbursement date. Upon initial recognition, they are recorded at fair value,
considering the transaction costs/revenue attributable to the instrument itself.
Financial assets may be reclassified to other categories only if the entity changes its business
model to manage them. In these rare cases, a financial asset at fair value through other
comprehensive income can be reclassified as a financial asset at amortised cost or as a financial
asset at fair value through profit or loss. The transfer value is the fair value at the time of
reclassification and the effects of reclassification operate prospectively from the date of
reclassification. In the event of reclassification to the amortised cost category, the cumulative
gain (loss) recognised in the valuation reserve is recognised as an adjustment to the fair value of
the financial asset at the date of reclassification. Whereas in the event of reclassification in the
category of fair value through profit or loss, the cumulative gain (loss) previously recognised in
the valuation reserve is reclassified from equity to profit (loss) for the year.
Subsequent to initial recognition, assets classified at fair value through other comprehensive
income not represented by equity instruments are measured at fair value with recognition of
changes in value in equity and recognition of the impacts of the application of amortised cost, of

61
the effects of impairment and of any exchange rate effects in the income statement; changes in
value recognised in equity are recognised in the income statement when the asset is
derecognised.
Specifically, with regard to equity instruments for which the entity opted for designation at fair
value through other comprehensive income, these are measured at fair value with changes
recognised by using equity as an offsetting item; this effect cannot be transferred to the income
statement, even in the event of a sale. Dividends are recognised in the income statement.
In the case of financial instruments quoted in active markets, the fair value is determined on the
basis of the official prices of the most favourable market to which the Group has access. If, for a
given financial instrument, the conditions for identifying an active market do not exist, it is
necessary to use a technical valuation, i.e. a process that makes it possible to identify a price at
which the instrument could be exchanged between knowledgeable willing parties in an arm's
length transaction. If the fair value of equity instruments and OEIC units cannot be determined
reliably, they are carried at cost.
Interest is measured using the effective interest rate method. The effective interest rate is the
rate that aligns the present value of cash flows expected throughout the life of the instrument to
the carrying amount of the asset. The expected flows have been calculated considering all
contractual terms of the instrument and including all fees and base points paid or received by and
between the contracting parties, transaction costs and any other premium or discount that is
measurable and considered an integral part of the effective interest rate of the transaction. The
use of the effective interest rate to calculate interests involves the uniform distribution of interest
throughout the life of the instrument. Dividends on equity instruments are recognised in the
income statement when payment becomes due.
At the end of each reporting period, financial assets at fair value through other comprehensive
income other than equity instruments are subject to impairment in accordance with the rules set
out in IFRS 9; impairment losses are recognised in the Income Statement. For defining
impairment losses, financial assets are classified into different stages:
• stage 1 includes performing financial instruments for which a significant increase in the
credit risk compared to the initial recognition date was not observed. The impairment is
determined collectively based on the 12 month expected credit loss;
• stage 2 includes performing financial instruments for which a significant increase in the
credit risk compared to the initial recognition date was observed. The impairment is
determined collectively based on the lifetime expected credit loss;
• stage 3 includes non-performing financial instruments. The impairment is determined
analytically based on the lifetime expected credit loss.
The methods used to determine the impairment of financial assets are described in point 16 below
(“Criteria for determining the impairment of financial assets”).
Equity instruments are not subject to impairment.
Financial assets or parts thereof are derecognised when the contractual rights to the cash flows
expire or are transferred without retaining substantially the related risks and benefits.
3 - Financial assets at amortised cost
This category includes financial assets for which both the following conditions are met:
- they are held according to a business model whose objective is the collection of contractual
cash flows related to them;

62
- the contract clauses meet the requirements of the SPPI test, i.e. the cash flows are
represented by payments of principal and accrued interest on the amount of principal to
be repaid on specified dates.
More specifically, without prejudice to the existence of the requirements set forth in the previous
paragraph, item “40. Financial assets at amortised cost” includes:
- loans and receivables with banks;
- loans and receivables with customers;
- debt instruments;
- other instruments referring to operating receivables related to the provision of financial
activities and services as established by the Consolidated Banking Act and Consolidated
Finance Act.
Loans and receivables are initially recognised at the disbursement date, and debt instruments are
recognised at their settlement date. Initial recognition is at fair value, which normally corresponds
to the consideration paid, including costs and income directly attributable to the transaction and
determinable at the start.
Financial assets may be reclassified to other categories only if the entity changes its business
model to manage them. In these rare cases, a financial asset at amortised cost can be reclassified
as a financial asset at fair value through other comprehensive or as a financial asset at fair value
through profit or loss. The transfer value is the fair value at the time of reclassification and the
effects of reclassification operate prospectively from the date of reclassification. Gains and losses
resulting from the difference between the amortised cost of a financial asset and its fair value are
recognised in the income statement in the event of reclassification as a financial asset at fair
value through profit or loss and equity, in the specific valuation reserve, in the event of
reclassification as a financial asset at fair value through other comprehensive income.
After initial recognition, loans and receivables are measured at amortised cost using the effective
interest rate method.
The effective interest rate is the rate that aligns the present value of cash flows expected
throughout the life of the instrument (up to maturity or “expected” maturity, or a shorter period
if appropriate) to the net carrying amount of the asset. The use of this rate to calculate interest
involves the uniform distribution of interest throughout the life of the instrument.
The expected flows have been calculated considering all contractual terms of the instrument and
including all fees and base points paid or received by and between the contracting parties,
transaction costs and any other premium or discount that is measurable and considered an
integral part of the effective interest rate of the transaction. The amortised cost is not calculated
for short-term transactions if the effect is considered immaterial and for loans without a defined
maturity or revocable loans. These loans are measured at historical cost and costs/revenue
related to them are recognised in the income statement on a straight-line basis over the
contractual term of the loan.
At the end of each reporting period, financial assets measured at amortised cost are subject to
impairment in accordance with the rules set out in IFRS 9; impairment losses are recognised in
the Income Statement. For defining impairment losses, financial assets are classified into
different stages:
• stage 1 includes performing financial instruments for which a significant increase of the
credit risk compared to the initial recognition date was not observed. The impairment is
determined collectively based on the 12 month expected credit loss;

63
• stage 2 includes performing financial instruments for which a significant increase in the
credit risk compared to the initial recognition date was observed. The impairment is
determined collectively based on the lifetime expected credit loss;
• stage 3 includes non-performing financial instruments. The impairment is determined
analytically based on the lifetime expected credit loss.
The methods used to determine the impairment of financial assets are described in point 16 below
(“Criteria for determining the impairment of financial assets”).
Stage 3 classification includes non-performing financial instruments in accordance with the rules
of Bank of Italy, consistent with IAS/IFRS and European Supervisory Authorities, as summarised
below:
- Bad loans: on and off-statement of financial position exposures to insolvent customers
(even if they have not yet been legally acknowledged as such) or customers in similar
positions, regardless of any anticipated loss formulated by the Bank; the exposures whose
anomalous situation is attributable to profiles pertaining to country risk are excluded;
- Unlikely to pay: on and off-statement of financial position exposures whereby the debtor
is assessed by the Bank as unlikely to pay its credit obligations in full (for the principal
and/or interest) without realisation of collateral, regardless of the presence of any due and
not paid amounts (or instalments);
- Past due non-performing: cash exposures, other than those classified as bad or unlikely
to pay, which, at the end of the reporting period, are past due or overrun for over 90 days.
Regarding the methods to calculate past due loans, only the debtor approach on all the
portfolio positions was used as from 1 January 2014.
Impairment losses of financial assets at amortised cost are recognised in the income statement.
If the reasons for impairment no longer apply due to an event occurring after the impairment was
recognised, reversals of impairment loss are recognised in the income statement. The reversal of
impairment loss cannot exceed the amortised cost that the financial instrument would have had
in the absence of previous impairment losses.
Reversals of impairment losses related to the passing of time are recognised in net interest
income.
During the life of the financial instrument, the original contractual terms may be changed by the
parties to the contract. In that case, it must be determined whether the original asset must
continue to be recognised in the financial statements or whether the original instrument must be
derecognised, and a new financial instrument recognised. In general, changes in a financial asset
lead to its derecognition and to the recognition of a new asset when they are “substantial” and
the assessment of whether the change is “substantial” must be subject to qualitative and
quantitative considerations.
More specifically, the analyses referred to in the previous paragraph must consider:
- the purposes of these changes: reference is made to renegotiations due to financial
difficulties (so-called forbearance measures) rather than to renegotiations for commercial
reasons (aimed, in general, at adjusting the cost of debt to market conditions);
- the presence of objective elements (known as triggers) that are considered to entail
derecognition in consideration of their impact on the original contractual flows.
Financial assets or parts thereof are derecognised when the contractual rights to the cash flows
expire or are transferred without retaining substantially the related risks and benefits. If a

64
significant portion of the risks and benefits related to the financial assets remains upon transfer
of their legal ownership, they will continue to be recognised in the financial statements.
Finance leases
Loans and receivables with customers for leased assets are initially recognised at the effective
date of the corresponding agreements, i.e. upon formal delivery of the asset.
Loans and receivables with customers for leased assets are stated in the financial statements at
amortised cost, that is the initial value of the investment including direct costs initially incurred
and any directly attributable commissions, less any capital repayment and adjusted by the
amortisation calculated using the effective interest method, i.e. by discounting the future
estimated payments at the effective interest rate for the estimated term of the loan. Similar
criteria to the above ones are followed for impairment losses and reversals of impairment losses.
They are subject to impairment in accordance with the rules set out in IFRS 9 for financial assets
at amortised cost as described above.
Forbearance exposures
The renegotiations of exposures due to the financial difficulties of the customer are those in which
the bank grants the customer:
- a change in previous contractual terms and conditions in that the debtor will not be able
to pay because of its financial difficulties; this change would not have been granted if the
debtor had not been in financial difficulties or
- a partial or total refinancing of the debtor, which would not have been granted if the debtor
had not been in financial difficulties, meaning by refinancing a new contract that allows to
repay all or part of the original contract.
The records that the bank has recognised a grant are a difference in favour of the debtor between
the amended and the previous terms of the contract or an amendment to the contract that
includes better conditions compared to other debtors with similar risk characteristics.
The financial difficulties arise if the amended contract was classified as non-performing, or, in the
absence of amendments, it would have been classified as non-performing; the amendment to the
contract involves a total or partial writing-off of the debt; the bank approves the use of clauses
in the contracts for which the debtor would be considered non-performing without the use of such
clause; at the same time or shortly before the granting of a further loan, the debtor pays principal
or interests on another contract that was non-performing or that would have been classified as
non-performing without the loan refinancing.
4 - Hedging transactions
The Credito Valtellinese Group makes use of the possibility envisaged by IFRS 9 to continue to
fully apply the provisions of the IAS 39 accounting standard on hedge accounting (opt-out).
The Group adopts the Fair value hedge to hedge the interest rate risk referring to specific assets.
Fair value hedge accounting contemplates the income statement recognition of the effects
deriving from the fair value change of the hedged element and of the hedging instrument.
The hedging is considered as effective when the changes in fair value of the hedging financial
instrument neutralise (within the limits ranging from 80% to 125%) the changes in the hedged
instrument with reference to the hedged risk.
The fair value change of the hedged element due to the change in the hedged risk
increases/decreases the carrying amount of the asset offset in the Income Statement in the item
“90. Net hedging income (expense)” as well as the fair value change of the derivative. Both

65
changes in fair value indicated are calculated net of accruals/deferrals accrued that are recognised
among interest. The net effect in income statement is represented by any unbalanced difference,
or by the partial ineffectiveness of the hedging.
When the transaction is carried out, the hedge is formally documented through the definition of
the objectives and risk management strategies on the basis of which the hedge was implemented,
the hedging instrument, the hedged item, the nature of the risk hedged and how hedge
effectiveness is to be measured. The hedge effectiveness is established by comparing the changes
in fair value of the cash flows of the hedged instrument, with reference to the risk to be hedged,
with the changes in fair value of the cash flows of the hedging instrument. Prospective and
retrospective effectiveness tests are carried out on a regular basis for all the hedging period.
Hedging transactions are no longer recorded in the Financial Statements when they prove
ineffective, the derivative expires or is sold, extinguished or exercised, the hedged instrument
expires, is sold or repaid or the hedge is cancelled. In this case, the derivative contract is
reclassified as an instrument held for trading and the hedged instrument reacquires the
measurement basis that corresponds to its classification in the financial statements.
5 - Equity investments
Item “70. Equity investments” comprises the carrying amount of equity investments in companies
subject to joint control and companies subject to significant influence.
Investments in companies subject to joint control are those for which the power of taking
decisions relating to the relevant activities is shared between two or more parties.
Investments in associates are those for which the Bank exercises significant influence, i.e. has
the power to take part in decisions regarding the financial and operating policies but has no further
control.
If 20% or more of the voting rights in the shareholders' meeting of the investee is directly or
indirectly held, a significant influence is presumed to exist unless it can be demonstrated to the
contrary. In particular, there is no significant influence if, even in the presence of shares
exceeding 20% of the investee, only property rights on the investments made are held without
having access to management policies and without governance rights.
On the contrary, if less than 20% of the voting rights in the shareholders' meeting of the investee
are directly or indirectly held, a significant influence is not presumed to exist unless such influence
can be clearly demonstrated.
These equity investments are recorded at cost at the time of initial recognition, and subsequently
in accordance with the equity method.
The equity investments are subject to impairment in accordance with IAS 36 when their carrying
amount exceeds their recoverable amount, defined as the higher of their fair value less costs to
sell and their value in use. Fair value is determined based on the best information available to
reflect the amount that the entity could obtain, at the end of the reporting period, from the
disposal of the asset in an arm's length transaction between knowledgeable and willing parties,
following the deduction of disposal costs. This value is determined considering the results of recent
transactions for similar assets carried out within the same industry sector. Value in use is
calculated by using models based on the discounting of future cash flows.
The party who holds the asset is only required to calculate the recoverable amount if there is
evidence of potential impairment. The following elements were considered in evaluating whether
there was impairment:
- significant negative changes for the investee occurred during the year or that will occur in
the near future in the area in which the party operates;

66
- the market interest rates or other capital payment rates on investments increased during
the year and it is likely that these increases will influence the discount rate used in the
calculation of the value in use of the equity investment and significantly reduce its
recoverable amount;
- significant changes with an adverse effect on the investee occurred during the period, or
are expected to occur in the near future;
- internal information that the financial performance of the investee is or will be worse than
expected;
- significant financial difficulties expected in the investee;
- the investee is subject to insolvency proceedings;
- quantitative indicators referred to the significant and prolonged reduction in fair value to
below the carrying amount of the financial assets. Specifically, they refer to market
quotations or valuations that are 30% or lower than the initial carrying amount or the
recognition of quotations or valuations that are lower than the carrying amount for a period
of more than 18 months;
- recognition of a dividend for investments in companies subject to joint control and
associates if:
- the carrying amount of the equity investment in the separate financial statements
exceeds the carrying amounts in the consolidated financial statements of the net
assets of the investee, including the related goodwill;
- the dividend exceeds the total comprehensive income of the jointly controlled entity
or associate during the financial period in which it is declared.
In the presence of impairment indicators, the impairment is recognised to the extent that the
recoverable amount is lower than the carrying amount, allocating the relative impairment loss to
the income statement. Should the reasons for the impairment cease to exist following a
subsequent event, the reversal of impairment losses is recorded in the income statement.
Equity investments are derecognised when the contractual rights to the corresponding cash flows
expire or when they are sold substantially transferring all related risks and benefits.
6 - Property, equipment and investment property
Property, equipment and investment property purchased on the market are recognised as assets
under “90. Property, equipment and investment property” when the main risks and benefits
associated with the assets are acquired.
The “Operational property and equipment” are assets used to carry out the business, assuming
that they will be used for a period of more than one year, while “Investment property” is the asset
that provides rental income or held for appreciation of invested capital or both.
Initial recognition is at cost, including all directly related charges, both for the operational
property, equipment and investment property.
Land is recognised separately, even when purchased together with the building, using a
component approach. Land and buildings are separately assessed on the basis of specific
appraisals and only in the case of self-contained buildings.
Property, equipment and investment property, with the exception of the Group's artistic heritage,
are subsequently valued at cost, adjusted for related depreciation and losses/recoveries of value.
The depreciable value of property and equipment, identified as the difference between the
purchase cost and the residual value, is systematically charged to the income statement on a

67
straight-line basis over the estimated useful use of the assets according to an allocation criterion
that reflects the technical-economic duration and the residual use of each asset item.
According to that criterion, the life of the different categories of property, equipment and
investment property is as follows:
- for buildings, from 30 to 70 years;
- for furniture, furnishings and sundry equipment, from 5 to 8 years;
- for office machines and electronic, technological and communication systems, from 3 to 7
years;
- for motor vehicles, from 4 to 5 years.
The art works owned by the Bank after initial recognition are measured by applying the
restatement model. The restatement model envisages that a class of property, equipment and
investment property may be recognised at a restated value, equal to its fair value on the date of
the restatement, net of any subsequent accumulated depreciation and any subsequent
accumulated impairment loss. If the carrying amount of an asset increased as a result of a
restatement, the increase must be recognised in a special equity reserve, whereas if the carrying
amount of an asset decreased, the reduction must be recognised in the income statement.
Land and artistic assets are not subject to depreciation, as the former has an indefinite useful life
and the latter normally increase in value over time.
At the end of each reporting period, if there are indications that the property, equipment and
investment property may have suffered an impairment loss, the carrying amount and recoverable
amount of the asset (defined as the greater of fair value and value in use) are compared and, if
the latter is lower than the carrying amount, the asset is impaired.
The carrying amount resulting from the reversal of impairment losses on a previously impaired
asset cannot exceed the carrying amount that would have been determined had there been no
impairment in previous periods.
The gain or loss generated from the disposal of a property, plant and equipment is recognised in
the profit/loss for the year.
Inventories of property, equipment and investment property classified according to “IAS 2 –
Inventories” are recorded in the item “90. Property, equipment and investment property” and are
measured at cost or net realisable value, whichever lower. The cost of the inventories includes all
purchase and conversion costs incurred by the entity in order for the inventories to reach their
current location and conditions. The net realisable value can be identified in the market value less
costs to complete and sell. Impairment losses are recognised in the income statement.
Property, equipment and investment property are derecognised when they are sold or no future
economic benefits are expected from their use or disposal.
7 - Intangible assets
Assets recognised under intangible assets are non-monetary assets, without physical substance,
identifiable and able to generate future economic benefits that can be controlled by the group.
Intangible assets purchased externally are recognised as assets at purchase price when the main
risks and benefits related to the asset are transferred. Intangible assets generated internally are
recognised on the basis of the directly attributable costs sustained.
All intangible assets recorded in the financial statements other than goodwill have a finite useful
life and are consequently amortised in consideration of said life. According to IAS 36, the

68
recoverable amount of the intangible assets with a definite useful life must however be calculated
every time there is evidence of impairment. The impairment test must be made by comparing the
carrying amount of the asset with its recoverable amount. An impairment loss must be recognised
where the recoverable amount is lower than the carrying amount. The recoverable amount of the
asset is the higher between its fair value net of costs to sell and its value in use. In order to
calculate the value in use of the intangible asset, reference must be made to its cash flows in
current conditions on the impairment test date.
Intangible assets are derecognised when they are sold or when no future economic benefits are
expected from their use or disposal.
Goodwill
Goodwill generated from business combinations represents the difference between the purchase
cost and the fair value at the acquisition date of the assets and liabilities of the acquired company.
If positive, it is booked at cost as an asset (goodwill) as it represents the amount paid by the
acquirer for the future benefits arising from assets that cannot be either identified as single
components or booked separately. If negative, it is recorded directly in the income statement
(excess over cost).
Goodwill recorded as an asset must be allocated to the cash-generating units to which it refers
(CGU). These units were identified considering the lowest level at which company management
estimates the return on investment and considering that this level may not be higher than the
reportable segment in the primary or secondary segment presentation established in accordance
with IFRS 8 – Operating Segments. Specifically for the Group, CGUs were identified as individual
entities less equity investments.
The cash-generating unit to which goodwill has been allocated is tested annually for impairment
or every time there is an indication that the unit may have undergone impairment.
In accordance with IAS 36, an asset is subject to impairment when its carrying amount exceeds
its recoverable amount, or the higher of its fair value less costs to sell and its value in use.
Fair value is determined based on the best information available to reflect the amount that the
entity could obtain, at the end of the reporting period, from the disposal of the asset in an arm's
length transaction between knowledgeable and willing parties, following the deduction of disposal
costs. This value is determined considering the results of recent transactions for similar assets
carried out within the same industry sector.
Value in use is calculated by using models based on the discounting of future cash flows. The
model for the banks assumes that the value of the asset results from the discounting of future
distributable cash flows including the excess or lack of Tier 1 ratio at the end of the reporting
period compared to a pre-established minimum objective and from the terminal value calculated
as perpetual income estimated in accordance with an economically sustainable normalised cash
flow and consistent with the long-term growth rate. The income model for companies other than
the banks assumed that the value of an asset derives from the discounting of the income flows
produced by the company, increased by the terminal value calculated as perpetual income
estimated in accordance with an economically sustainable normalised cash flow and consistent
with the long-term growth rate.
Any negative difference between the carrying amount and the recoverable amount will be
recognised in the income statement.
Software
Software is recognised at cost, net of the relative amortisation and of any impairment loss. The
costs related to the purchase and development of the software are capitalised when control over

69
the same is acquired and when future benefits that exceed costs are likely to arise over a period
of several years.
This intangible asset is amortised, considering its relative estimated useful life, over a maximum
of 3 years, while its residual value is assumed to be zero.
8 - Non-current assets held for sale and disposal groups
Non-current assets must be classified as held for sale if their carrying amount will be recovered
principally through a sale rather than through continuous use. In order for this to occur, the asset
must be available for immediate sale in its present condition subject only to terms that are usual
and customary for sales of such assets and its sale must be highly probable. Once classified as
held for sale, the asset is measured at the lower of its carrying amount and its fair value less
costs to sell, with the exception of certain types of assets (e.g. financial assets within the scope
of IFRS 9) for which IFRS 5 specifically requires that the measurement criteria of the relevant
accounting standard be applied.
The associated income and expenses, net of related tax effects, are recognised in the income
statement in a separate item in case of discontinued operations.
9 - Current and deferred taxation
Current taxes are recognised in the statement of financial position under tax liabilities. If the
amount already paid in respect of current and prior periods exceeds the amount due for those
periods, the excess must be recognised in the statement of financial position as a tax asset.
Current tax assets and liabilities are only offset if there is a legal exercisable right to offset the
amounts recorded in the accounts and the Group intends to settle or pay the net amounts or to
realise the asset and settle the liability at the same time.
There is a legal exercisable right to offset a current tax asset against a current tax liability when
they refer to income taxes applied by the same tax authority and the tax authority allows the
company to make or receive a single net payment. In this regard, the conditions for the offsetting
of current tax assets and liabilities are considered met also with reference to the Italian corporate
income tax (IRES) for companies that complied with the national tax consolidation, pursuant to
which the Parent makes a single payment of taxes by consolidating taxable income and tax losses
of the consolidated companies.
Deferred taxation is recognised according to the statement of financial position method, whereby
deferred taxes are recognised by comparing the different carrying amounts and tax bases of the
items included under assets and liabilities in the statement of financial position.
If these differences in value cause future increases or decreases in the taxable income of a
subsequent period, they are defined as temporary differences:
- deductible temporary differences will generate a future reduction in the total taxable
amount, as they are non-deductible this year. To the extent that a future taxable amount
is likely to be available, which can be used to offset the deductible temporary differences,
deferred tax assets must be recorded. Article 2, paragraphs 55 to 58, of Italian Law Decree
no. 225/2010, converted, with amendments, by Italian Law no. 10/2011 as amended,
including in particular, those made by Italian Law Decree no. 201/2011, converted, with
amendments, by Italian Law no. 214/2011, allows however, upon the occurrence of certain
conditions, the conversion into tax assets of the deferred tax assets recorded in the
financial statements relating to i) impairment losses on loans and receivables and ii)
goodwill and other intangible assets (for this second category, conversion is no longer
allowed with reference to deferred tax assets recognised for the first time in the financial
statements related to the 2015 financial year);

70
- taxable temporary differences create deferred tax liabilities, as they generate taxable
amounts in future years, since they are deductible or non taxable in the current year. The
relevant deferred tax liabilities are recorded for any other taxable temporary difference.
Further deferred tax assets can be recognised in connection with the carrying forward of tax losses
not used, the recognition of which is subject to checking the probability of their recovery with
future taxable income.
Recognition of deferred tax liabilities and deferred tax assets is reviewed periodically to consider
any change in rates or tax regulation or a new estimate of the probability of recovering the
deductive temporary differences.
Deferred tax assets and liabilities are offset only if there is a legal exercisable right to offset the
current tax assets with current tax liabilities and deferred tax assets and liabilities are related to
income taxes applied by the same tax authority on the same taxable entity.
Deferred tax liabilities and deferred tax assets are not discounted as envisaged by IAS 12.
10 - Provisions for risks and charges
This item is broken down as follows.
• Commitments and guarantees given
This sub-item includes provisions for impairment losses for credit risks recognised against
commitments to disburse funds and financial guarantees given that fall within the scope of
application of the rules on impairment of IFRS 9 set out in point 16 below (“Criteria for determining
the impairment of financial assets”).
For these cases, in principle, the same methods of allocation between the three stages of credit
risk and calculation of the expected loss shown with reference to financial assets at amortised
cost or at fair value through other comprehensive income, are adopted.
The aggregate also includes provisions for risks and charges set up to cover other types of
commitments and guarantees given that, by virtue of their specific characteristics, do not fall
within the aforementioned scope of application of the impairment in accordance with IFRS 9.
• Pension funds and similar obligations
Company pension funds
Pension funds, set up on the basis of internal agreements, are defined as provisions for employee
benefits to be paid once they stop working for the company. The provisions present at the end of
the reporting period are classified as defined benefit plans. A defined benefit plan is a post-
employment benefit plan according to which the bank has the obligation to pay its employees the
benefit agreed.
The determination of the obligation and the defined benefit plan costs must be calculated in a
reliable manner, the amount of employee benefits accrued in accordance with the work carried
out in the current year and prior years. Present values are calculated using the “Projected unit
credit method”, which involves the estimate of future payments based on historical and statistical
analyses, the demographic curve and the discounting of these flows using a market interest rate.
Actuarial gains and losses from changes in the actuarial assumptions previously applied entail a
restatement of the liability and are recognised as an offsetting item to equity reserve shown in
the statement of comprehensive income.
Solidarity funds

71
The purpose of the Solidarity Funds is to guarantee protection during the employment relationship
in the event of a reduction or suspension of work. Wage supports, paid by the employer, are
reimbursed by INPS or adjusted by the employer.
Solidarity funds, set up on the basis of internal agreements, are defined as provisions for
employee benefits to be paid once they stop working for the company. The provisions present at
the end of the reporting period are classified as defined benefit plans. A defined benefit plan is a
post-employment benefit plan according to which the bank has the obligation to pay its employees
the benefit agreed.
The obligation and cost are determined by projecting future payments based on historical and
statistical analyses, the demographic curve and the discounting of these flows using a market
interest rate. Actuarial gains and losses from changes in the actuarial assumptions previously
applied entail a restatement of the liability and are directly recognised in the income statement
of the year.
• Other provisions for risks and charges
Provisions for risks and charges are recorded when the bank has a present obligation (legal or
constructive) resulting from a past event, when it is probable that an outflow of resources
representing economic benefits will be required to settle the obligation, whose amount can be
reliably estimated.
The amount recorded represents the present value of the amount that a company would
reasonably pay in order to extinguish the obligation at the end of the reporting period. If the
impact of the temporary deferral of the obligation is considered non-significant, the amount is not
discounted.
Such provisions are measured at the end of each reporting period and adjusted in order to reflect
the best current estimate. If it is no longer likely that the resources producing economic benefits
will be used to meet the obligation, the provision is reversed and any excess is recorded in the
income statement.
In particular, the item includes provisions relating to the dispute that are determined by
considering, if available, the amount requested by the counterparty, the technical estimate carried
out internally based on the accounting records and/or presented during the trial and, in particular,
the amount assessed by the court-appointed expert (CTU) - if provided - as well as legal interests,
calculated from the notification of the application initiating proceedings and any expense due for
adverse outcome.
They also include the provisions relating to long-term benefits for employees other than pension
funds whose amount is calculated by applying the estimate of future payments based on historical
and statistical analyses, the demographic curve and the discounting of these flows using a market
interest rate; actuarial gains and losses from changes in the actuarial assumptions previously
applied entail a restatement of the liability and are recognised in the income statement.
11 - Financial liabilities at amortised cost
The item includes Due to banks, Due to customers and Securities issued and mainly includes the
funding collected on the inter-bank market and from customers also through the placement of
bonds and certificates of deposit.
Financial instruments issued are classified as liabilities when, according to the substance of the
agreement, the Bank has a contractual obligation to deliver cash or another financial asset to
another entity.

72
Transactions are recognised at the time they are carried out, except those relative to remittance
of bills and to the placement of securities, which are recognised at settlement. Initially, financial
liabilities are designated at fair value plus any directly attributable transaction costs.
Subsequently, they are measured at amortised cost using the effective interest rate method. The
amortised cost has not been calculated for short-term transactions, for which the effect of the
calculations is considered immaterial.
The items also include payables for commitments to repurchase own equity instruments if the
conditions for their recognition are applicable.
Financial liabilities or parts thereof are derecognised when extinguished, i.e. when the obligation
has been met, cancelled or has expired. They are derecognised also following their repurchase on
the market. The derecognition is made on the basis of the fair value of the issued item and of the
repurchased item at the purchase date. The profit or loss resulting from the transaction,
depending on whether the carrying amount of the repurchased item is higher or lower than the
purchase price, is recognised in the income statement. The subsequent re-placement of the
securities is considered as a new issue, recognised at the new placement price.
12 - Financial liabilities held for trading
Financial liabilities held for trading are represented by trading derivative financial instruments
with a negative fair value. They are recognised at the subscription or issue date at a value equal
to the fair value of the instrument, without considering any directly attributable transaction cost
or income.
Financial liabilities held for trading are recognised at fair value and changes are recognised in the
income statement.
They are derecognised from the financial statements when the contractual rights to the
corresponding cash flows expire or when they are sold substantially transferring all related risks
and benefits.
13 - Financial liabilities at fair value
The item includes financial liabilities at fair value, as defined at the time of initial recognition and
where the requirements are met. Specifically, reference is made to liabilities whose designation
at fair value through profit or loss eliminates or significantly reduces an inconsistency in
measurement (sometimes defined as “accounting asymmetry”). The Group does not currently
classify financial liabilities as designated at fair value.
14 - Foreign currency transactions
Transactions denominated in foreign currency are translated, at initial recognition, into the
reporting currency by applying the exchange rate ruling on the transaction date.
At the end of each subsequent reporting period:
- the monetary elements are retranslated at the spot closing rate;
- the non-monetary elements measured at historical cost are retranslated using
transaction's date exchange rate;
- the non-monetary elements measured at fair value are converted at the exchange rate in
force on the date when the fair value was determined.
A monetary element represents the right to receive, or the obligation to pay, a fixed or
determinable amount of money. Conversely, the key characteristic of non-monetary items is the
absence of the right to receive, or the obligation to pay, a set amount of money or an amount
that can be determined. The exchange rate differences relating to monetary items are recorded

73
in the income statement as and when they arise; those related to non-monetary items are
recorded in equity or in the income statement in line with the method used to record the profits
or losses that include that component. Revenue and expenses in foreign currency are recognised
at the exchange rate prevailing at the time they are recorded or, if accruing, at the exchange rate
in force at the end of the reporting period.
15 - Insurance assets and liabilities
The consolidated financial statements do not include insurance assets or liabilities.
16 - Other information
Criteria for determining the impairment of financial assets
IFRS 9 requires that, for financial assets not measured at fair value through profit or loss,
impairment losses must be determined based on the 12 month expected credit loss and, if there
is a significant increase in credit risk compared to the initial recognition date, impairment losses
must be calculated based on the lifetime expected credit loss of the financial instrument. The
financial instruments are classified into three distinct stages:
• stage 1 includes performing financial instruments for which a significant increase of the
credit risk compared to the initial recognition date was not observed. The impairment is
collectively determined based on 12 month expected credit loss;
• stage 2 includes performing financial instruments for which a significant increase in the
credit risk compared to the initial recognition date was observed. The impairment is
collectively determined based on lifetime expected credit loss;
• stage 3 includes non-performing financial instruments. The impairment is analytically
determined based on lifetime expected credit loss.
The Group identified the main elements for the transition from the first to the second stage. In
particular, reference will be made to the change in the default lifetime probabilities as compared
to the initial recognition of the financial instrument determined by the credit quality of each
individual relation on each measurement date; moreover, the possible presence of a past due of
at least 30 days and/or of forbearance measures were considered, presumptively, to be indicative
of a significant increase in credit risk and involve the transition to the second stage. Specific
models were created, based on those used for the definition of internal ratings, for calculating the
12 month expected credit loss and the lifetime expected credit loss.
The calculation of expected losses includes forward looking information linked, among other
things, to changes in the macroeconomic scenario. With reference to this last aspect, also in
consideration of the proportionality criterion, the Group uses the Most likely scenario+add on
approach. This approach envisages determining the expected loss in the baseline scenario
considered the most probable and used for other purposes (for example, for budget and planning
purposes) to which an add on was added to reflect the effects of the possible non-consistency of
the expected credit loss compared to macro-economic scenarios.
With reference to securities, external providers were used to determine the expected credit loss.
The first-in-first-out or FIFO method was used to calculate the reversal to the income statement
of the expected loss recorded in case of sales.
For some categories of residual loans, the low credit risk redemption was used; based on this,
the loans in question were deemed in stage 1, since as of the date of transition they had a rating
equal to or greater than the investment grade.
In the analytical valuation of loans in the third stage, the loss is measured as the difference
between the carrying amount and the present value of estimated future cash flows discounted at

74
the original effective interest rate of the loan. The estimated cash flows take account of the
guarantees associated with the loans. In the event that the guarantees are not likely to be
enforced, account will be taken of either their present value or their realisable value net of
expenses to be incurred to recover the amount due.
The analytical impairment loss relates to expected losses on individual non-performing loans. For
non-performing loans classified as unlikely to pay, which have a limited unitary amount, or as
past due non-performing, the expected loss is calculated by homogenous categories according to
internal statistical models and analytically applied to each position.
Moreover, forward-looking factors that adapt the weighed-up probabilities of occurrence of the
different future scenarios were included in the valuations of exposures classified in the third stage.
Specifically, alternative recovery scenarios were considered like the sale of portfolios of non-
performing loans in relation to the corporate objectives to reduce the non-performing financial
assets in the 2018-2020 Business Plan, to which a realisation probability must be attributed, to
be considered in the overall measurement. Therefore, the expected losses of potentially
transferable non-performing loans are defined on the basis not only of the forecast of the
recoverable flows through internal management, but also of the forecast of the recoverable flows
through their possible sale on the market.
Business combinations
IFRS 3 defines a business combination as a transaction or another event in which a purchaser
acquires control of a business consisting of factors of production and processes applied to such
factors able to create production. Therefore, the acquisitions of equity investments in subsidiaries,
mergers, the acquisition of business units etc. are all considered business combinations.
IFRS 3 envisages that all business combinations that fall within the relative scope must be
recognised using the acquisition method.
For each business combination, one of the combining entities must be identified as the acquirer
that obtains control of another entity or group of businesses.
A subject controls an investee when it is exposed, or has rights, to variable returns from its
involvement with the investee and is also able to use its power over the investee to affect these
returns.
Even though in some cases it is difficult to identify an acquirer, there are usually situations that
demonstrate its existence. In a business combination mainly carried out by transferring cash or
other assets or through assumption of liabilities, generally the acquirer is the entity that transfers
cash or other assets or assumes the liabilities. In a business combination mainly carried out by
exchanging interests, in general the acquirer is the entity that issues the interests. Other relevant
facts and circumstances must be taken into consideration, including:
- the relative voting rights in the combined entity after the business combination;
- the existence of a large minority voting interest in the combined entity if no other owner
or organised group of owners has a significant voting interest;
- the composition of the management of the combined entity;
- the composition of the senior management of the combined entity;
- terms of the exchange of equity interests.
In general, the acquirer is the combining entity whose size (e.g. designated according to assets,
revenue or profits) is considerably bigger compared to the size of the other combining entity.

75
Moreover, in a business combination comprising more than two entities, for the purposes of
determining the acquirer, we must consider, among other things, which of the combining entities
started the combination as well as the relative size of the combining entities.
The acquisition date is the date on which the acquirer obtains control of the acquiree and consists
of the date from when the acquiree is consolidated in the financial statements of the acquiring
company. In the event in which a business combination is achieved in a single exchange
transaction, the date of the exchange is the acquisition date.
The consideration transferred in a business combination must be measured at fair value calculated
as the amount of the fair values, on the acquisition date, of the assets transferred by the acquirer
to the previous shareholders of the acquiree, of the liabilities borne by the acquirer for these
subjects and of the interests issued by the acquirer. The consideration that the acquirer transfers
in exchange for the acquiree includes any asset or liability resulting from a contingent
consideration arrangement.
The costs related to the acquisition are the charges that the acquirer bears for carrying out the
business combination. The acquirer must record in the income statement the costs related to the
acquisition in the periods in which these costs are borne and the services are received, except for
issue costs of shares or debt instruments that must be recognised according to IAS 32 and IAS
39.
Business combinations are recorded according to the “acquisition method”, according to which
the acquired identifiable assets, including any intangible asset not previously recognised by the
acquired company, and the assumed identifiable liabilities must be recognised at their respective
fair value on the acquisition date. The fair value of the assets, liabilities and potential liabilities of
the acquiree may be determined provisionally by the end of the year in which the business
combination is achieved and must be finalised within twelve months of the acquisition date.
If the control is carried out through subsequent purchases, the acquirer must recalculate the
interest that it held before in the acquired company at its respective fair value on the acquisition
date and record in the income statement any difference compared to the previous carrying
amount.
The acquirer must record the goodwill on the acquisition date measuring it as the surplus of the
amount of the transferred consideration, of the amount of any non-controlling interest in the
acquiree and, in a business combination carried out in several phases, of the fair value on the
acquisition date of the interest in the acquiree previously held by the acquirer, on the net value
of the amounts, determined on the acquisition date, of the acquired identifiable assets and of the
identifiable assumed liabilities measured on the basis of what was stated above. In case a negative
difference is reported, it is recorded in the income statement.
For each business combination, any non-controlling interest in the acquiree can be recognised at
fair value, with the resulting increase in the transferred consideration, or in proportion to the
share of non-controlling interest in net identifiable assets of the acquiree. For the transactions
carried out, the Group recognised the non-controlling interests in proportion to the share of the
non-controlling interest in the identifiable net assets of the acquiree without increasing the
consideration transferred, hence by recognising only its own share of goodwill.
Following the purchase of control of a company, further equity investments are accounted for by
recognising the difference between the purchase price and the carrying amount of the non-
controlling interests purchased in equity attributable to owners of the parent. Similarly, the sale
of the non-controlling interest without loss of control will not generate profits/losses in the income
statement, but variations in equity attributable to owners of the parent.

76
IFRS 3 does not apply to business combination transactions between parties subject to common
control.
In the absence of specific indications envisaged by other IAS/IFRS international accounting
standards, IAS 8 requires that the company must make use of its own judgement when applying
an accounting standard to be adopted for the purpose of providing relevant, reliable, prudent
disclosure that reflects the economic essence of the transactions.
These types of business combinations, usually achieved as part of company reorganisations, are
therefore recorded by preserving the continuity of the values of the acquiree in the financial
statements of the acquirer. In particular, the acquired assets and liabilities were recognised at
the amounts resulting from the consolidated financial statements of the Group.
The business combinations carried out at a date before January 2011 were recorded in accordance
with the provisions of the previous version of IFRS 3 (not revised). In particular, the events
following the acquisition of control were treated differently. For transactions carried out before 31
December 2010, the restatement of the additional consideration, calculated during the acquisition
of control of the company, involves the adjustment of the originally calculated cost of the business
combination.
Criteria for the preparation of segment reporting
Segment reporting is prepared on the basis of IFRS 8 - Operating Segments. This standard
requires that companies base their segment reporting on elements used by management to make
their operating decisions, and therefore calls for the identification of operating segments according
to the internal reporting system regularly reviewed by management (the management approach)
in order to allocate resources to the various segments and analyse performance.
An operating segment is a component of a subject:
- whose business activities generate revenue and costs;
- whose operating results are periodically reviewed at the highest operational decision-
making level;
- for which separate financial information is available.
The Group has an organisational-corporate structure including companies focusing on banking
business, on the provision of specialist services and support activities. The specialisation and the
unique nature of the mission of the various Group Companies allow the assignment of each
company to a specific segment. Therefore, an analysis of the specific Credito Valtellinese Group
and the requirements of IFRS 8 resulted in the identification of the following three operating
segments:
- the Market segment: generates its revenue from the production and sale of lending
products and services, investment and transfer services for the Group’s customers. The
statement of financial position and income statement items for this segment refer to
Credito Valtellinese;
- the Specialised Company sector: generates its revenue from the distribution of
bancassurance and factoring products. The statement of financial position and income
statement items for this segment refer to Global Assicurazioni, Global Broker, Claris Factor
and Creval PiùFactor;
- the Corporate Centre segment: monitors ICT management and development and manages
the Group’s real estate assets. The statement of financial position and income statement
items for this segment refer to Stelline Real Estate and Creval Sistemi e Servizi.

77
For segment reporting and comments in the notes to the financial statements, information is
allocated to the three operating segments with reference to the following criteria:
- the assets and liabilities of Group companies, net of consolidated and intra-group entities,
are recognised in full to the reference segment, except for “Financial assets at fair value
through other comprehensive income” represented by shares held for investment purposes
and “Equity investments” in companies that, as they cannot be allocated to any of the
operating segments, are indicated separately as assets not related to any other segment;
- all income components of Group companies, net of consolidated and intra-group accounts,
except for dividends, profit of equity-accounted investments and gains on sales of assets
available-for-sale and represented by shares held for investment purposes, were assigned
to the relevant operating segments;
- the net interest income was determined using applicable internal rates of transfer.
Post-employment benefits
Post-employment benefits fall within the benefits following the end of the employer-employee
relationship defined by the IAS 19 according to two different types:
- defined benefit plans;
- defined contribution plans.
A defined benefit plan is a post-employment benefit plan according to which the company has the
obligation to pay its employees the benefit agreed. The reform of supplementary pension plans
has adjusted the accounting treatment of post-employment benefits. In particular, only post-
employment benefit accrued up to 31 December 2006 continues to be considered as a defined
benefit plan to be assessed by actuarial valuations according to the Projected unit credit method,
as provided by IAS 19. The liability associated with the accrued post-employment benefit is
assessed by actuarial valuations without applying the pro-rata of the service rendered, as the
service to be assessed has already fully accrued. Actuarial gains and losses from changes in the
actuarial assumptions previously applied entail a restatement of the liability and are recognised
as an offsetting item to equity reserve shown in the statement of comprehensive income.
Defined contribution plans envisage the payment by the company of fixed contributions into a
fund. The company has no legal or constructive obligation to make further payments if the fund
does not have sufficient assets to pay all of the employees' entitlements for the service rendered
in the current year and in previous years. The company records the employee's payments into
the fund as a liability after deducting any contribution already paid. If, at the end of the reporting
period, the contributions paid are higher than those actually due, the excess must be accounted
for as an asset to the extent that the advance payment will reduce future payments or give rise
to a reimbursement.
The accrued portions of post-employment benefits, at the employee's option according to explicit
or tacit acceptance, were:
- allocated to supplementary retirement plans or to the Treasury Fund managed by INPS as
from 1 January 2007,
- paid as an integral part of the salary for the pay period as from March 2015.
A defined contribution plan is configured in this area. The amount of the benefits is determined
based on the contributions due by the employee without using actuarial calculations.

78
Contributions to the Single Resolution Fund (SRF), National Resolution Fund (NRF) and
Interbank Guarantee Fund (DGS)
The BRRD (Bank Recovery and Resolution Directive – 2014/59/EU) sets out the new rules for
resolution applied as from 1 January 2015 to all the banks of the European Union. The measures
of the BRRD are financed by the National Resolution Fund that each of the 28 Member States will
have to set up. It is expected for the funds to be paid in advance to reach by 31 December 2024
a minimum target level of 1% of guaranteed deposits. An ex-post extraordinary contribution is
also envisaged if the available financial means are not sufficient to finance the resolution, to the
maximum extent equal to three times the annual amount of ordinary contributions. The Single
Resolution Mechanism Regulation 2014/806/EU, which became effective as from 1 January 2016,
establishes also the creation of the Single Resolution Fund (SRF), which will be managed by the
new European resolution authority (Single Resolution Board – SRB).
Italian Legislative Decree no. 180 of 16 November 2015, containing the implementation in Italian
regulations of the BRRD, provides for the obligation to establish one or more single resolution
funds as from 2015. Therefore, the Bank of Italy, as Single Resolution Board established the
Single Resolution Fund for 2015 with Measure no. 1226609/15 of 18 November 2015.
The annual contributions of each intermediary are calculated as the ratio of the amount of its
liabilities net of own funds, protected deposits and, for entities belonging to groups, intra-group
liabilities. The contribution base is adjusted on the basis of the risk profile of the intermediaries.
The correction for the risk can determine a discount (at the most 20%) or a penalisation (up to
50%) to be applied to the base contribution.
The Deposit Guarantee Schemes Directive 2014/49/EU strengthens the protection of the
depositors and harmonises the regulatory framework at EU level. The new directive requires all
Member States to adopt an ex-ante financing system, whose target level is set at 0.8% of
guaranteed deposits to be reached in 10 years.
Italian Legislative Decree no. 30/2016 implementing Directive 2014/49/EU fixes the target-level
that the financial resources of the deposit guarantee schemes must reach by 3 July 2024, with
the contributions paid by the banks (Article 96.1, paragraphs 1 and 2 of the Consolidated Banking
Act) in an amount equal to 0.8% of protected deposits. The financing mechanism defined by the
European regulations was already regulated in the Articles of Association of the Interbank
Guarantee Fund with the reform approved by the Shareholders' meeting of 26 November 2015
and, later, adjusted to the regulatory framework introduced with Italian Legislative Decree
30/2016.
For the purposes of accounting treatment, reference must be made to IAS 37 “Provisions,
Contingent Liabilities and Contingent Assets” and to IFRIC 21 “Levies”, which deal with the
recognition of a liability related to the payment of a levy if this liability falls within the scope of
IAS 37. Pursuant to IFRIC 21, “a levy represents outflows embodying economic benefits imposed
on entities by governments in accordance with laws and/or regulations”.
Compulsory contributions to the Single Resolution Fund, National Resolution Fund and Interbank
Guarantee Fund derive from law provisions and fall under “Levies” set forth in IFRIC 21.
IAS 37 and IFRIC 21 envisage that a liability must be recognised when the binding fact that
creates a current obligation occurs. Since the decree does not envisage that the contributions
must be, in whole or in part, reduced or returned to the intermediaries, each time the binding
fact occurs, the entire amount of the liability related to its contributions must be recorded.
However, IAS 37 and IFRIC 21 do not regulate whether the balancing entry of the liability (or of
the outgoing cash) must be an asset to be recognised in the statement of financial position or a
cost to be recognised in the income statement. However, in the case under examination, it is not

79
possible to configure a statement of financial position balancing entry since it is not possible to
recognise an intangible asset or an asset for advance payment due to the absence of accounting
assumptions. These amounts are recognised in profit or loss. In particular, since they are forms
of contribution similar in accounting terms to levies, they are included among “Administrative
expenses - other administrative expenses” of the income statement, which also includes indirect
taxes and taxes for the year.
Treasury shares
Shares issued and repurchased are recorded as a direct reduction of equity. No profit or loss
resulting from the purchase, sale, issue or cancellation of said instruments is recorded in the
income statement. Any amount paid or received for said instruments is recorded directly under
equity.
A specific reserve is recorded, pursuant to Article 2357-ter of the Italian Civil Code.
Guarantees and commitments
Guarantees given are initially recognised at their fair value, represented by the commission
received, and subsequently at the estimated obligation or the initially booked amount gradually
reduced by the portion related to the year, whichever higher. The overall nominal value of
guarantees given, net of amounts used, is highlighted in the notes to the financial statements.
Commitments are entered in the financial statements on the basis of the best estimate of the
obligation. The overall amount of the commitment assumed is shown in the notes of the financial
statements.
Financial guarantees given and commitments to disburse funds are subject to impairment in
accordance with IFRS 9 as described in point 16 (“Criteria for determining the impairment of
financial assets”). For these cases, in principle, the same methods of allocation between the
stages of credit risk and calculation of the expected loss shown with reference to financial assets
at amortised cost or at fair value through other comprehensive income, are adopted.
The provisions related to impairment losses on guarantees and commitments are recognised in
the statement of financial position in item “100. Provisions for risks and charges” whereas the
regular provision is recognised in the income statement in item “200. Net accruals to provisions
for risks and charges a) commitments and guarantees given”.
Accounting of revenue and costs
Revenue arising from contractual obligations with customers is recognised in profit or loss if it is
probable that the entity will receive the consideration to which it will be entitled in exchange for
the goods or services to be transferred to the customer. The consideration for the transaction
must be allocated to the contractual commitments and services and is recognised as revenue
based on the timing for the fulfilment of the contractual commitments and obligations. Revenue
is recognised:
• at a specific point in time, when the entity fulfils its obligation to perform by transferring
the promised goods or services to the customer;
• over time, i.e. as the entity fulfils its obligation to perform by transferring the promised
goods or services to the customer.
In particular, commissions on revenue from services are recognised, on the basis of contractual
agreements, in the period in which the actual services were provided, with the exception of the
commissions included in the amortised cost for determining the effective interest rate.
Interests are recognised on a pro rata basis according to the contractual rate of interest or the
actual rate (in the case of the application of amortised cost). The items interest income and

80
interest expense also include the differentials, or the positive or negative margins accrued until
the end of the reporting period of the financial statements in relation to:
a) derivative contracts hedging assets and liabilities that generate interest;
b) derivative contracts classified in the statement of financial position as trading instruments,
but operationally linked to financial assets and/or liabilities at fair value, in accordance
with IFRS 9;
c) derivative contracts operationally linked to financial assets and liabilities classified in the
statement of financial position as trading instruments or operationally linked to “other
financial assets mandatorily measured at fair value” and that provide for the settlement of
differentials or margins at different maturities;
Default interests, provided for in the contract, are recorded at the time of their actual collection.
Dividends are recognised in the income statement during the financial year in which their
distribution is resolved.
Gains and losses deriving from the trading of financial instruments are recognised in the income
statement, or in equity in case of equity instruments for which designation at fair value through
other comprehensive income has been opted, when the sale is completed, based on the difference
between the consideration paid or received and the carrying amount of the instruments
themselves.
Costs are recognised in the income statement in the period in which they are incurred, on an
accrual basis. Costs relating to the receipt and fulfilment of contracts with customers are
recognised in the income statement in the periods in which the relative revenue is recognised. If
the costs cannot be associated to the revenue, they are recognised immediately in the income
statement.
Use of estimates and assumptions in drawing up the financial statements
In drawing up the financial report, estimates and assumptions were used that may affect the
carrying amounts recorded in the statement of financial position, income statement and the notes
to the financial statements.
More specifically, subjective evaluations by company management were made in the following
cases:
- to quantify the impairment of financial assets, especially loans and receivables, equity
investments and property, equipment and investment property;
- to determine the fair value of financial instruments to be used for financial reporting and
the use of valuation models to determine fair value of financial instruments that are not
quoted on active markets;
- to assess the reasonableness of the amount of goodwill and of the other intangible assets;
- to quantify employees' provisions and provisions for risks and charges;
- the actuarial and financial assumptions used for determining liabilities associated with
defined benefit plans for employees;
- estimates and assumptions made with regard to the recoverability of deferred tax assets.
In order to formulate reasonable estimates and assumptions for the recording of business
transactions, subjective evaluations are made based on all information and historical experience
available.

81
Fair value information
The fair value is the price at which an asset can be sold, or a liability can be transferred in a
regular transaction between market participants at a certain valuation date. The fair value
represents a market measurement basis, not related to the individual company and must be
measured by adopting assumptions that the market operators would use to determine the price
of the asset or of the liability, assuming that they act to meet their economic interest in the best
way possible.
The fair value of a financial liability that is due (for example, a sight deposit) cannot be less than
the amount payable on demand, discounted from the first date on which payment may be
required.
In particular, the criteria adopted are as follows:
- Mark to Market: valuation method that coincides with the Level 1 classification of the fair
value hierarchy;
- Comparable Approach: valuation method based on the use of inputs observable on the
market the use of which implies a Level 2 classification of the fair value hierarchy;
- Mark to Model: valuation method related to the application of pricing models whose inputs
determine the Level 3 classification (use of at least one significant input that cannot be
observed) of the fair value hierarchy.
With regard to the criteria for determining the fair value, please refer to what is contained in the
financial statements at 31 December 2017.
Assets and liabilities measured at fair value on a recurring basis: breakdown by level of fair value
Financial assets/liabilities at fair value 30/06/2018 31/12/2017
L1 L2 L3 L1 L2 L3
1. Financial assets at fair value throughprofit or loss 37,975 24,014 181,276 19,612 1,068 1
a) financial assets held for trading 37,574 21,309 1 19,612 1,068 1
b) financial assets at fair value - - - - - -
c) other financial assets mandatorily measured atfair value 401 2,705 181,275 - - -
2. Financial assets at fair value throughother comprehensive income 1,928,361 56,329 41,875 4,166,153 36,093 217,106
3. Hedging derivatives - - - - 199 -
4. Property, equipment and investment property - - 24,428 - - 24,428
5. Intangible assets - - - - - -
Total 1,966,336 80,343 247,579 4,185,765 37,360 241,535
1. Financial liabilities held for trading - 198 - - 713 -
2. Financial liabilities at fair value - - - - - -
3. Hedging derivatives - 135,599 - - 138,691 -
Total - 135,797 - - 139,404 -
Key: L1 = Level 1 L2 = Level 2 L3 = Level 3

82
The transfers among different levels of fair value involve a limited number of positions. In
particular, in the first half of 2018, transfers were recorded from Level 1 to Level 2 of financial
assets of EUR 1.3 million.
The overall data of the DVA for derivative transactions at 30 June 2018 amounted to EUR 32
thousand, whereas the overall data of the CVA for derivative transactions at 30 June 2018
amounted to EUR 3 thousand.
The Group has carried out a sensitivity analysis of unobservable market parameters in the
valuation of instruments classified in Level 3 of the fair value hierarchy and measured at fair value
on a recurring basis.
The portfolio of instruments measured at fair value on a recurring basis and classified within level
3 of the fair value hierarchy mainly consists of OEIC units and equity instruments.
Level 3 OEIC units classified in the portfolio of “Financial assets at fair value through profit or
loss” mainly include shares of real estate funds and private equity. The Group also holds a share
in the Italian Recovery Fund (former Atlante II), managed by Quaestio Capital SGR, whose
investment policy is aimed at non-performing loans of a number of Italian banks, by subscribing
financial instruments (usually notes of different seniority originating from securitisation
transactions, including junior tranches); in an extremely adverse simulation scenario, the
cancellation of the value of EUR 12 million cannot be excluded.
The value of the real estate OEIC units totalling EUR 60.3 million is exposed to the trend of the
domestic real estate market. The sensitivity is estimated on the basis of a historical simulation
approach, assuming a reduction in the value of the units equal to the first percentile of the
distribution of annual changes in prices of a residential real-estate market index (Italy ISI Property
Price Residential) recorded over a 6-year period. The change in the parameter used in the
evaluation, together with the estimated sensitivity, is shown below.
Financial assets Non-observable
parameter
Parameter
change
Sensitivity (in thousands of EUR)
Real estate OEIC Trend in prices of the real
estate market -300 b.p. -1,810
Moreover, “Financial assets at fair value through profit or loss” also include OEIC units of private
equity that hold equity investments or debt instruments, mainly of small and medium enterprises,
for an amount of EUR 32.5 million, whose value is affected by the economic situation of the
domestic market and for which information is not sufficient to build a sensitivity analysis. The
item also includes OEIC units of EUR 23.3 million that invest mainly (80%) in past due corporate
loans and partly (20%) in senior financial restructuring operations; on the basis of the information
available, it was not possible to carry out a sensitivity analysis.
“Financial assets at fair value through profit or loss” also include the mezzanine and junior
tranches coming from the disposal through a securitisation of a portfolio of bad debts (Elrond and
Aragorn), amounting to EUR 1.3 million and corresponding to 5% of the total amount placed with
institutional investors. In consideration of the peculiar characteristics of the operations described
above, no fair value sensitivity analyses were carried out.
The banking book also includes, as “Financial assets at fair value through other comprehensive
income”, bonds and equity investments held as part of more complex relations with specific
companies or that represent a support tool for important initiatives in the area where the Group
operates; for this type of instruments, it was not possible to carry out a sensitivity analysis.

83
Annual changes of assets at fair value on a recurring basis (Level 3)
It is specified that the opening balances were presented in accordance with IFRS 9. In particular,
the item “of which: financial assets mandatorily measured at fair value” includes OEIC units and
securities that did not pass the SPPI test (at 31 December 2017 classified as “Available-for-sale
financial assets” and “Loans and receivables with customers”).
Financial assets at fair value through profit or loss Financial assets
at fair value through other comprehensive
income
Hedging derivatives
Property, equipment
and investment
property
Intangible assets
Total
Of which: a) financial
assets held for trading
of which: b)
financial assets at fair value
of which: c) financial assets
mandatorily measured at
fair value
1. Opening balance 176,451 1 - 176,450 42,714 - 24,428 -
2. Increases 14,341 - - 14,341 2,633 - - -
2.1. Purchases 13,498 - - 13,498 2,368 - - -
2.2. Gains recognised in: 843 - - 843 264 - - -
2.2.1. Profit or loss 843 - - 843 - - - -
- of which gains 843 - - 843 - - - -
2.2.2. Equity X X X X 264 - - -
2.3. Transfers from other levels - - - - - - - -
2.4. Other increases - - - - 1 - - -
3. Decreases -9,516 - - -9,516 -3,472 - - -
3.1. Sales -6,829 - - -6,829 -2,642 - - -
3.2. Redemptions -55 - - -55 -3 - - -
3.3. Losses recognised in: -2,596 - - -2,596 -827 - - -
3.3.1. Profit or loss -2,596 - - -2,596 - - - -
- of which losses -2,596 - - -2,596 - - - -
3.3.2. Equity X X X X -827 - - -
3.4. Transfers to other levels - - - - - - - -
3.5. Other decreases -36 - - -36 - - - -
4. Closing balance 181,276 1 - 181,275 41,875 - 24,428 -
Annual changes of liabilities at fair value on a recurring basis (Level 3)
There are no financial liabilities at fair value on a recurring basis (Level 3).

84
Breakdown of the main statement of financial position items
ASSETS AND LIABILITIES AT AMORTISED COST
FINANCIAL ASSETS AT AMORTISED COST - ITEM 40
Breakdown by type of item “40 a) Loans and receivables with banks”
Type of transaction/Amounts
30/06/2018
Carrying amount Fair Value
Stage 1 and 2
Stage 3
of which: acquired
or originated impaired
assets
L1 L2 L3
A. Loans and Receivables with Central Banks 164,328 - - - - 164,328
1. Term deposits - - - X X X
2. Obligatory reserve 164,328 - - X X X
3. Reverse repurchase agreements - - - X X X
4. Other - - - X X X
B. Loans and receivables with banks 432,258 - - 6,598 4,797 422,086
1. Loans 421,543 - - - 630 422,086
1.1 Current accounts and sight deposits 141,950 - - X X X
1.2 Term deposits 630 - - X X X
1.3 Other loans: 278,963 - - X X X
- Reverse repurchase agreements - - - X X X
- Finance leases - - - X X X
- Other 278,963 - - X X X
2. Debt instruments 10,715 - - 6,598 4,167 -
2.1 Structured instruments - - - X X X
2.2 Other debt instruments 10,715 - - X X X
Total 596,586 - - 6,598 4,797 586,414
Key: L1 = Level 1 L2 = Level 2 L3 = Level 3
The item “1.3 Other loans” mainly includes the items related to the Quadrivio RMBS 2011
securitisation transaction and margin trading on existing derivatives.

85
Type of transaction/Amounts
31/12/2017
Carrying amount Fair Value
Stage 1 and 2
Stage 3
of which: acquired
or originated impaired
L1 L2 L3
A. Loans and Receivables with Central Banks 1,769,219 - - - - 1,769,220
1. Term deposits 1,199,973 - - X X X
2. Obligatory reserve 569,246 - - X X X
3. Reverse repurchase agreements - - - X X X
4. Other - - - X X X
B. Loans and receivables with banks 264,194 - - - 4,853 260,972
1. Loans 260,007 - - - 454 260,972
1.1 Current accounts and sight deposits 24,034 - - X X X
1.2 Term deposits 551 - - X X X
1.3 Other loans: 235,422 - - X X X
- Reverse repurchase agreements - - - X X X
- Finance leases - - - X X X
- Other 235,422 - - X X X
2. Debt instruments 4,187 - - - 4,399 -
2.1 Structured instruments - - - X X X
2.2 Other debt instruments 4,187 - - X X X
Total 2,033,413 - - - 4,853 2,030,192
Key: L1 = Level 1 L2 = Level 2 L3 = Level 3
Breakdown by type of item “40 b) loans and receivables with customers”
Type of transaction/Amounts
30/06/2018
Carrying amount Fair Value
Stage 1 and 2 Stage 3
of which: acquired or originated impaired
assets
L1 L2 L3
1. Loans 14,568,831 968,134 383 - 307,448 16,074,582
1.1. Current accounts 2,230,798 300,910 - X X X
1.2 Reverse repurchase agreements 307,479 - - X X X
1.3 Mortgages 9,422,792 499,457 - X X X
1.4 Credit cards, personal loans and salary-backed loans 221,013 13,341 - X X X
1.5 Finance leases 350,208 67,640 - X X X
1.6 Factoring 145,088 12,580 - X X X
1.7 Other loans 1,891,453 74,206 383 X X X
2. Debt instruments 5,897,703 - - 4,695,373 16,929 970,434
2.1 Structured instruments - - - X X X
2.2 Other debt instruments 5,897,703 - - X X X
Total 20,466,534 968,134 383 4,695,373 324,377 17,045,016
Key: L1 = Level 1 L2 = Level 2 L3 = Level 3
Item “1.7. Other loans” includes instalment and non-instalment sundry facilities of EUR 715,332
thousand, loans for advances on bills of EUR 324,684 thousand, loans and receivables with Cassa
Compensazione other than repurchase agreements of EUR 395,382 thousand, import and export
loans of EUR 230,211 thousand and loans against security of EUR 68,340 thousand.

86
Item “2.2 Other debt instruments” increased compared to 31 December 2017 due to
reclassifications of securities made on first-time adoption of IFRS 9 of EUR 564.4 million for the
recognition of the senior security of EUR 509.5 million issued as part of the Aragorn transaction
and held by Credito Valtellinese, as well as by the purchase of securities carried out during the
half-year (mainly Government bonds).
Type of transaction/Amounts
31/12/2017
Carrying amount Fair Value
Stage 1 and 2
Stage 3
of which: acquired or originated impaired
assets
L1 L2 L3
1. Loans 14,005,702 2,197,628 459 - 711,716 16,319,515
1.1. Current accounts 2,022,049 757,762 - X X X
1.2 Reverse repurchase agreements 712,064 - - X X X
1.3 Mortgages 9,309,630 1,204,665 - X X X
1.4 Credit cards, personal loans and salary-backed loans 264,821 16,557 - X X X
1.5 Finance leases 377,218 114,100 - X X X
1.6 Factoring - - - X X X
1.7 Other loans 1,319,920 104,544 459 X X X
2. Debt instruments 477,614 - - - 4,506 473,557
2.1 Structured instruments - - - X X X
2.2 Other debt instruments 477,614 - - X X X
Total 14,483,316 2,197,628 459 - 716,222 16,793,072
Key: L1 = Level 1 L2 = Level 2 L3 = Level 3
Breakdown by debtor/issuer of item “40 b) Loans and receivables with customers”
Type of transaction/Amounts
30/06/2018 31/12/2017
Stage 1 and 2
Stage 3
of which: acquired or originated
impaired assets
Stage 1 and 2
Stage 3
of which: acquired or originated
impaired assets
1. Debt instruments 5,897,703 - - 477,614 - -
a) Public administrations 4,886,865 - - - - -
b) Other financial companies 969,211 - - 472,802 - -
of which: insurance companies - - - - - -
c) Non-financial companies 41,627 - - 4,812 - -
2. Loans to: 14,568,831 968,134 383 14,005,702 2,197,628 459
a) Public administrations 172,562 6,499 - 88,130 5,821 -
b) Other financial companies 1,830,761 38,717 - 1,616,322 57,514 -
of which: insurance companies 10,478 - - 2,444 1 -
c) Non-financial companies 7,428,266 695,893 106 8,113,306 1,864,766 244
d) Households and others 5,137,242 227,025 277 4,187,944 269,527 215
Total 20,466,534 968,134 383 14,483,316 2,197,628 459
The decrease in non-performing financial assets (Stage 3) is related to sales transactions finalised
in the first half year. More specifically, sales transactions mainly refer to a non-performing secured
loans and receivables portfolio (Project GIMLI 1) with a GBV of more than EUR 222 million and to
a securitisation transaction for which the conditions for the derecognition of assets were met, of
a portfolio of mainly secured bad loans (Project ARAGORN) with a GBV of approximately EUR 1.6

87
billion. In relation to the latter transaction, a State guarantee was required for senior securities
issued by the special purpose entity (known as GACS).
In addition, an agreement was finalised for the sale of a non-performing secured loans and
receivables portfolio (Project GIMLI 2) for a GBV of more than EUR 222 million. This portfolio was
reclassified in item “120. Non-current assets held for sale and disposal groups”.
The following table shows the breakdown of this item by the stage to which it belongs.
30/06/2018
Stage 1 Stage 2 Stage 3 Total
Loans and receivables with customers 18,609,432 1,857,102 968,134 21,434,668
FINANCIAL LIABILITIES AT AMORTISED COST - ITEM 10
Financial liabilities at amortised cost: breakdown by type of due to banks
Type of transaction/Amounts
30/06/2018 31/12/2017
Carrying amount
Fair Value Carrying amount
Fair Value
L1 L2 L3 L1 L2 L3
1. Due to central banks 2,500,764 X X X 2,501,703 X X X
2. Due to banks 623,809 X X X 641,486 X X X
2.1 Current accounts and sight deposits 206,756 X X X 144,276 X X X
2.2 Term deposits 20,515 X X X 2,500 X X X
2.3 Loans 390,513 X X X 491,348 X X X
2.3.1 Repurchase agreements 328,704 X X X 419,537 X X X
2.3.2 Other 61,809 X X X 71,811 X X X
2.4 Payables for commitments to repurchase own equity instruments -
X X X - X X X
2.5 Other payables 6,025 X X X 3,362 X X X
Total 3,124,573 - 2,858,781 270,434 3,143,189 - 2,924,229 214,001
Key: L1 = Level 1 L2 = Level 2 L3 = Level 3
The item “2.3.2 Loans – other” mainly includes loans received from the European Investment
Bank.

88
Financial liabilities at amortised cost: breakdown by type of due to customers
Type of transaction/Amounts
30/06/2018 31/12/2017
Carrying amount
Fair Value Carrying amount
Fair Value
L1 L2 L3 L1 L2 L3
1. Current accounts and sight deposits 12,513,006 X X X 12,273,362 X X X
2. Term deposits 841,816 X X X 808,772 X X X
3. Loans 4,889,046 X X X 3,634,051 X X X
3.1. Repurchase agreements 4,457,886 X X X 3,129,229 X X X
3.2. Other 431,160 X X X 504,822 X X X
4. Payables for commitments torepurchase own equity instruments 33,000
X X X 33,000 X X X
5. Other payables 80,517 X X X 92,416 X X X
Total 18,357,385 - 5,285,385 13,057,683 16,841,601 - 3,923,490 12,903,591
Key: L1 = Level 1 L2 = Level 2 L3 = Level 3
Item “3.1 Repurchase agreements” mainly contains transactions with Cassa Compensazione e
Garanzia. Item “3.2 Loans - other” mainly refers to medium to long-term loans received by Cassa
Depositi e Prestiti following the agreement between ABI and the Cassa Depositi e Prestiti in
support of SMEs, whereas item “4. Payables for commitments to repurchase own equity
instruments” refers to purchase options for non-controlling interests in Global Assicurazioni S.p.A.
Financial liabilities at amortised cost: breakdown by type of securities issued
Type of instrument/Amounts
30/06/2018 31/12/2017
Carrying amount
Fair Value Carrying amount
Fair Value
L1 L2 L3 L1 L2 L3
A. Securities
1. bonds 1,885,610 - 1,696,724 173,491 2,600,669 - 1,929,255 590,874
1.1 structured - - - - - - - -
1.2 other 1,885,610 - 1,696,724 173,491 2,600,669 - 1,929,255 590,874
2. other securities 171,131 - 171,131 - 189,013 - 189,013 -
2.1 structured - - - - - - - -
2.2 other 171,131 - 171,131 - 189,013 - 189,013 -
Total 2,056,741 - 1,867,855 173,491 2,789,682 - 2,118,268 590,874
Key: L1 = Level 1 L2 = Level 2 L3 = Level 3
Financial instruments indicated in Level 3 at 30 June 2018 refer to the securities sold in relation
to the Quadrivio RMBS 2011 securitisation.

89
FINANCIAL ASSETS AND LIABILITIES AT FAIR VALUE THROUGH PROFIT OR LOSS
Breakdown by type of item “20 a) Financial assets held for trading”
Item/Amounts 30/06/2018 31/12/2017
L1 L2 L3 L1 L2 L3
A. On-statement of financial position assets
1. Debt instruments 10,600 307 - 15,320 396 -
1.1 Structured instruments - - - - - -
1.2 Other debt instruments 10,600 307 - 15,320 396 -
2. Equity instruments 11,440 1,132 1 3,337 154 1
3. OEIC units 15,534 19,296 - 955 - -
4. Loans - - - - - -
4.1 Reverse repurchase agreements - - - - - -
4.2 Other - - - - - -
Total A 37,574 20,735 1 19,612 550 1
B. Derivatives
1. Financial derivatives - 574 - - 518 -
1.1 trading - 574 - - 518 -
1.2 associated with fair value option - - - - - -
1.3 other - - - - - -
2. Credit derivatives - - - - - -
2.1 trading - - - - - -
2.2 associated with fair value option - - - - - -
2.3 other - - - - - -
Total B - 574 - - 518 -
Total (A+B) 37,574 21,309 1 19,612 1,068 1
Key: L1 = Level 1 L2 = Level 2 L3 = Level 3

90
Breakdown by debtor/issuer/counterparties of item “20 a) Financial assets held for trading”
Item/Amounts 30/06/2018 31/12/2017
A. On-statement of financial position assets
1. Debt instruments 10,907 15,716
a) Central Banks - -
b) Public administrations 10,899 11,524
c) Banks 8 4,192
d) Other financial companies - -
of which: insurance companies - -
e) Non-financial companies - -
2. Equity instruments 12,573 3,492
a) Banks 1,938 277
b) Other financial companies 4,384 564
of which: insurance companies - -
c) Non-financial companies 6,251 -
d) Other issuers - 2,651
3. OEIC units 34,830 955
4. Loans - -
a) Central Banks - -
b) Public administrations - -
c) Banks - -
d) Other financial companies - -
of which: insurance companies - -
e) Non-financial companies - -
f) Households and others - -
Total A 58,310 20,163
B. Derivatives
a) Central counterparties - -
b) Other 574 518
Total B 574 518
Total (A+B) 58,884 20,681
Bonds issued by Public administrations are mainly represented by exposures towards the Italian
Government.

91
Breakdown by type of item “20 c) Other financial assets mandatorily measured at fair value”
Item/Amounts 30/06/2018 31/12/2017
L1 L2 L3 L1 L2 L3
1. Debt instruments - - 2,255
1.1 Structured instruments - - - - - -
1.2 Other debt instruments - - 2,255 - - -
2. Equity instruments 401 2,705 50,942 - - -
3. OEIC units - - 128,078 - - -
4. Loans - - - - - -
4.1 Reverse repurchase agreements - - - - - -
4.2 Other - - - - - -
Total 401 2,705 181,275 - - -
Key: L1 = Level 1 L2 = Level 2 L3 = Level 3
Breakdown by debtor/issuer of item “20 c) Other financial assets mandatorily measured at fair value” Item/Amounts 30/06/2018
1. Equity instruments 54,048
of which: banks 50,942
of which: other financial companies 2,705
of which: other non-financial companies 401
2. Debt instruments 2,255
a) Central Banks -
b) Public administrations -
c) Banks -
d) Other financial companies 1,306
of which: insurance companies -
e) Non-financial companies 949
3. OEIC units 128,078
4. Loans -
a) Central Banks -
b) Public administrations -
c) Banks -
d) Other financial companies -
of which: insurance companies -
e) Non-financial companies -
f) Households and others -
Total 184,381

92
Breakdown by type of hedge and level of item “50 Hedging derivatives”
30/06/2018 31/12/2017
FV NV
FV NV
L1 L2 L3 L1 L2 L3
A. Financial derivatives - - - - - 199 - 65,000
1) Fair value - - - - - 199 - 65,000
2) Cash flows - - - - - - - -
3) Investments in foreign operations - - - - - - - -
B. Credit derivatives - - - - - - - -
1) Fair value - - - - - - - -
2) Cash flows - - - - - - - -
Total - - - - - 199 - 65,000
Key: NV = notional value FV = fair value L1 = Level 1 L2 = Level 2 L3 = Level 3

93
Financial liabilities held for trading: breakdown by type
Type of transaction/Amounts
30/06/2018
NV FV
FV* L1 L2 L3
A. On-statement of financial position liabilities
1. Due to banks - - - - -
2. Due to customers - - - - -
3. Debt instruments
3.1 Bonds
3.1.1 Structured - - - - X
3.1.2 Other bonds - - - - X
3.2 Other securities
3.2.1 Structured - - - - X
3.2.2 Other - - - - X
Total A - - - - -
B. Derivatives
1. Financial derivatives
1.1 trading X - 198 - X
1.2 associated with fair value option X - - - X
1.3 other X - - - X
2. Credit derivatives
2.1 trading X - - - X
2.2 associated with fair value option X - - - X
2.3 other X - - - X
Total B X - 198 - X
Total (A+B) - - 198 - -
Key: FV = fair value FV* = fair value calculated by excluding changes in value due to change in creditworthiness of the issuer with respect to the issue date NV = nominal or notional value L1 = Level 1 L2 = Level 2 L3 = Level 3

94
Type of transaction/Amounts
31/12/2017
NV FV
FV* L1 L2 L3
A. On-statement of financial position liabilities
1. Due to banks - - - - -
2. Due to customers - - - - -
3. Debt instruments
3.1 Bonds
3.1.1 structured - - - - X
3.1.2 other bonds - - - - X
3.2 Other securities
3.2.1 structured - - - - X
3.2.2 other - - - - X
Total A - - - - -
B. Derivatives
1. Financial derivatives
1.1 trading X - 713 - X
1.2 associated with fair value option X - - - X
1.3 other X - - - X
2. Credit derivatives
2.1 trading X - - - X
2.2 associated with fair value option X - - - X
2.3 other X - - - X
Total B X - 713 - X
Total (A+B) - - 713 - -
Key: FV = fair value FV* = fair value calculated by excluding changes in value due to change in creditworthiness of the issuer with respect to the issue date NV = nominal or notional value L1 = Level 1 L2 = Level 2 L3 = Level 3

95
Hedging derivatives: breakdown by type of hedge and level
30/06/2018 31/12/2017
Fair value NV
Fair value NV
L1 L2 L3 L1 L2 L3
A. Financial derivatives - 135,599 - 365,000 - 138,691 - 300,000
1) Fair value - 135,599 - 365,000 - 138,691 - 300,000
2) Cash flows - - - - - - - -
3) Investments in foreignoperations
- - - - - - - -
B. Credit derivatives - - - - - - - -
1) Fair value - - - - - - - -
2) Cash flows - - - - - - - -
Total - 135,599 - 365,000 - 138,691 - 300,000
Key: NV = nominal value L1 = Level 1 L2 = Level 2 L3 = Level 3
FINANCIAL ASSETS AT FAIR VALUE THROUGH OTHER COMPREHENSIVE INCOME - ITEM 30
Breakdown by type of item “30 financial assets at fair value through other comprehensive income”
Item/Amounts 30/06/2018
L 1 L 2 L 3
1. Debt instruments 1,925,787 35,982 -
1.1 Structured instruments - - -
1.2 Other debt instruments 1,925,787 35,982 -
2. Equity instruments 2,573 20,348 41,875
3. Loans - - -
Total 1,928,360 56,330 41,875
Key: L1 = Level 1 L2 = Level 2 L3 = Level 3
Item/Amounts 31/12/2017
L 1 L 2 L 3
1. Debt instruments 4,155,778 14,711 374
1.1 Structured instruments - - -
1.2 Other debt instruments 4,155,778 14,711 374
2. Equity instruments 10,375 21,382 93,232
2.1 At fair value 10,375 21,382 515
2.2 At cost - - 92,717
4. OEIC units - - 123,500
5. Loans - - -
Total 4,166,153 36,093 217,106
Key: L1 = Level 1 L2 = Level 2 L3 = Level 3

96
Breakdown by debtor/issuer of item “30 financial assets at fair value through other comprehensive income”
Item/Amounts 30/06/2018
1. Debt instruments 1,961,769
a) Central Banks -
b) Public administrations 1,844,429
c) Banks 87,891
d) Other financial companies 24,418
of which: insurance companies 3,036
e) Non-financial companies 5,031
2. Equity instruments 64,796
a) Banks 22,971
b) Other issuers: 41,825
- other financial companies 35,669
of which: insurance companies -
- non-financial companies 6,156
- other -
3. Loans -
a) Central Banks -
b) Public administrations -
c) Banks -
d) Other financial companies -
of which: insurance companies -
e) Non-financial companies -
f) Households and others -
Total 2,026,565
Item/Amounts 31/12/2017
1. Debt instruments 4,170,863
a) Governments and Central Banks 4,156,532
b) Other government agencies -
c) Banks 10,122
d) Other issuers 4,209
2. Equity instruments 124,989
a) Banks 74,898
b) Other issuers: 50,091
- insurance companies -
- financial companies 39,143
- non-financial companies 10,948
- other -
3. OEIC units 123,500
4. Loans -
a) Governments and Central Banks -
b) Other government agencies -
c) Banks -
d) Other parties -
Total 4,419,352

97
EQUITY INVESTMENTS - ITEM 70
Information on the investment shares
Name Registered
office Operating office
Type of relationship
(1)
Type of equity investment
% Voting rights Investor company
% held
A. Companies subject to joint control
1. Rajna Immobiliare s.r.l. Sondrio Sondrio 1 Credito Valtellinese 50.00 -
B Companies subject to significant influence
1. Global Assistance S.p.A. Milano Milano 2 Credito Valtellinese 40.00 -
2. Sondrio Città Futura S.r.l. Milano Milano 2 Stelline Real Estate 49.00 -
3. Valtellina Golf Club S.p.A Caiolo Caiolo 2 Credito Valtellinese 43.08 -
4. Fidipersona Società Cooperativa Ancona Ancona 2 Credito Valtellinese 18.51 -
5. Creset - Crediti, Servizi e Tecnologie S.p.A. Milano Lecco 2 Credito Valtellinese 40.00 -
6. Finanziaria Laziale S.p.A. in liquidation Frosinone Frosinone 2 Credito Valtellinese 20.00 -
7. Generalfinance S.p.A. Milano Milano 2 Credito Valtellinese 46.81 -
(1) Type of relationship 1= joint control 2= significant influence
The percentage of available votes is not indicated when it corresponds to the percentage of the equity investment.
Furthermore, in July, the shareholders' meeting of Finanziaria Laziale Spa in liquidation was held,
which approved the final liquidation accounts.
OTHER ASSET AND LIABILITY ITEMS
PROPERTY, EQUIPMENT AND INVESTMENT PROPERTY - ITEM 90
Breakdown of item “90 of assets Property, equipment and investment property - operational property, equipment and investment property”
Asset/Amounts 30/06/2018 31/12/2017
1. Owned 319,117 329,655
a) land 50,439 50,737
b) buildings 229,468 236,983
c) furniture 29,761 30,410
d) electronic systems 3,393 3,972
e) other 6,056 7,553
2. Assets acquired under finance lease - -
a) land - -
b) buildings - -
c) furniture - -
d) electronic systems - -
e) other - -
Total 319,117 329,655

98
Breakdown of item “90 of assets Property, equipment and investment property - property, equipment and investment property held for investment measured at cost”
Asset/Amounts
30/06/2018 31/12/2017
Carrying amount
Fair value Carrying amount
Fair value
L1 L2 L3 L1 L2 L3
1. Owned 74,583 - - 96,324 65,596 - - 84,696
a) land 9,117 - - 10,361 8,819 - - 11,208
b) buildings 65,466 - - 85,963 56,777 - - 73,488
2. Assets purchased under finance lease - - - - - - - -
a) land - - - - - - - -
b) buildings - - - - - - - -
Total 74,583 - - 96,324 65,596 - - 84,696
Key: L1 = Level 1 L2 = Level 2 L3 = Level 3
Breakdown of inventories of property, equipment and investment property regulated by IAS 2
Asset/Amounts 30/06/2018 31/12/2017
1. Inventories of property, equipment and investment property obtained through therealisation of guarantees received
22,193 21,074
a) land 4,183 3,532
b) buildings 18,010 17,542
c) furniture - -
d) electronic systems - -
e) other - -
2. Other inventories of property, equipment and investment property 26,982 25,608
Total 49,175 46,682
INTANGIBLE ASSETS - ITEM 100
Intangible assets: breakdown by type
Asset/Amounts 30/06/2018 31/12/2017
Definite life Indefinite life Definite life Indefinite life
A.1 Goodwill X 30,385 X 30,385
A.1.1 attributable to owners of the parent X 30,385 X 30,385
A.1.2 attributable to non-controlling interests X - X -
A.2 Other intangible assets 14,500 - 14,206 -
A.2.1 Assets measured at cost: 14,500 - 14,206 -
a) internally generated intangible assets 8,551 - 8,197 -
b) other assets 5,949 - 6,009 -
A.2.2 Assets measured at fair value: - - - -
a) internally generated intangible assets - - - -
b) other assets - - - -
Total 14,500 30,385 14,206 30,385

99
With reference to the goodwill recorded at 30 June 2018, analyses were carried out in order to
check the possible presence of impairment indicators and the subsequent need to calculate again
the recoverable amount of the different CGUs.
It is specified that, following the results of the impairment test carried out with reference to past
financial statements and of the consequent write-downs, the residual goodwill recognised at 30
June 2018 is fully attributable to the Global Assicurazioni Specialised Company CGU.
It represents the lowest level at which group management estimates the return on investment
and this level is not greater than the operating segments identified for the segment reporting of
the group prepared according to IFRS 8 Operating segments.
The analyses carried out, using the same methodological approach adopted during evaluation in
the financial statements at 31 December 2017 to which reference is made, showed the following:
– with reference to the estimate of the cash flows, final data at 30 June 2018 was compared
with the interim forecasts pointing out their deviations. The economic results of the CGU
of the first half of 2018 were substantially in line compared to what was defined in the
budget;
– with reference to forecast figures, with reference to the CGU to which the goodwill of the
consolidated financial statements was allocated, the expected financial results determined
during the impairment test for the 2017 financial statements were substantially confirmed;
– with reference to the long-term growth rate (g) of the cash flows used to estimate the
terminal value, the figure is confirmed in line with the one used in the impairment test for
the 2017 financial statements (2%);
– with reference to the discount rate of the cash flows, it was updated on the basis of the
new information available at 30 June 2018. In particular, the cost of capital at 30 June
2018 stood at 9.0%, higher than 0.1% compared to the value reported at 31 December
2017. This was due to the combined effect of changes recorded on the Risk free rate (from
2.08% to 2.05%) and on the average beta associated with a sample of major listed Italian
banks (from 1.25 to 1.245).
Albeit the outlines of the scenario as well as the parameters used during evaluation may vary
significantly as a result of the events that management cannot influence, the results of the
aforesaid analyses do not show the presence of factors and circumstances that give rise to the
presumption of impairment and, as a result, confirm the carrying amounts.
Deferred tax assets
Article 2 of Italian Law Decree no. 225 of 29 December 2010, converted, with amendments, by
Italian Law no. 10 of 26 February 2011, allows the conversion into tax assets of the deferred tax
assets recorded in the financial statements relating to impairment losses on loans and receivables
of banks and financial companies and to goodwill and other intangible assets. The provision was
amended by Italian Law no. 147 of 27 December 2013, which extended the regulation also to
deferred tax assets, always related to the same items, recognised with reference to the local
business tax (IRAP). As a result of accounting losses arising from the financial statements of the
consolidated companies in 2017, the amount of deferred tax assets that were converted in 2018
in tax asset amounted to EUR 80.8 million.

100
OTHER ASSETS - ITEM 130
Other assets: breakdown
30/06/2018 31/12/2017
Amounts due from the tax authorities 48,889 51,036
Cheques drawn on the bank to be settled 44,747 29,105
Counterparts for securities and coupon payments to be received 5,325 7,429
Sundry items to be charged to customers and banks 68,309 93,547
Value date differences on portfolio transactions 23,464 182,903
Costs and other advance payments 1,264 11,417
Receivables related to the supply of goods and services 4,532 5,704
Leasehold improvements 3,187 3,340
Other items 93,989 28,445
Total 293,706 412,926
OTHER LIABILITIES - ITEM 80
Other liabilities: breakdown
30/06/2018 31/12/2017
Amounts due to tax authorities for indirect taxes 5,720 7,304
Amounts due to social security and welfare institutions 8,454 11,058
Amounts due to government agencies on behalf of third parties 122,345 41,544
Sundry items to be credited to customers and banks 58,305 36,703
Amounts available to customers 38,387 37,409
Amounts payable to employees 16,944 9,915
Value date differences on portfolio transactions 72,831 87,631
Items in transit between branches 524 2,027
Accruals other than those capitalised 2,944 2,457
Payables related to the supply of goods and services 31,579 22,308
Sundry and residual items 264,896 163,043
Total 622,929 421,399
PROVISIONS FOR RISKS AND CHARGES - ITEM 100
Provisions for risks and charges: breakdown
Item/Amounts 30/06/2018 31/12/2017
1. Provisions for risks and charges relating to commitments and guarantees given 5,254 1,963
2. Provisions on other commitments and other guarantees given 6,829 7,968
3. Company pension funds 36,902 33,520
4. Other provisions for risks and charges 143,646 81,743
4.1 Legal disputes 27,275 22,101
4.2 Personnel expenses 109,284 57,077
4.3 Other 7,087 2,565
Total 192,631 125,194
The increase in item “4.2 Other provisions for risks and charges: personnel expenses” compared
to the figure at the end of 2017 mainly refers to the Provision set aside to cover the early
retirement plan set forth in the trade-union agreement signed on 16 April (EUR 63.5 million).

101
NON-CURRENT ASSETS HELD FOR SALE AND DISPOSAL GROUPS AND ASSOCIATED LIABILITIES - ITEM 120 UNDER ASSETS
Non-current assets held for sale and disposal groups: breakdown by type
30/06/2018 31/12/2017
A. Assets held for sale
A.1 Financial assets 88,161 2,437
A.2 Equity investments 775 1,028
A.3 Property, equipment and investment property 535 490
A.4 Intangible assets - -
A.5 Other non-current assets - -
Total (A) 89,471 3,955
of which measured at cost 775 1,028
of which measured at fair value level 1 - -
of which measured at fair value level 2 - -
of which measured at fair value level 3 88,696 2,927
Item “A.1 Financial assets” mainly includes bad loans included in the Gimli2 Portfolio.
Item “A.2 Equity investments” includes the equity investment in Adamello S.p.A., held by Stelline
Real Estate.
Item “A.3 Property, equipment and investment property” includes investment properties for which
preliminary sale agreements were signed.
GROUP EQUITY - ITEMS 120, 150, 160, 170 AND 180
Information on Group share capital and reserves
At 30 June 2018, equity attributable to the owners of the parent amounted to EUR 1,493 million,
compared to EUR 1,442 million recorded at the end of December 2017. The main changes in the
half-year are mainly due to:
• capital increase that resulted in an increase in equity of EUR 671.8 million including net
costs related to the transaction and the equivalent value of the sale of non-exercised
rights;
• first-time adoption of IFRS 9, with a negative impact of EUR 583.5 million;
• a negative change of EUR 37.3 million in valuation reserves, mainly attributable to the
change in the value of Government bonds held in the portfolio of Financial assets at fair
value through other comprehensive income.
The share capital of Credito Valtellinese amounted to EUR 1,916.8 million. Considering the reverse
share split put in place on 8 January 2018 (ratio of 1 new ordinary share - without any indication
of a nominal value – for every 10 existing ordinary shares, after cancellation of 6 ordinary shares),
the issue of the new shares for the capital increase concluded on 20 March 2018 (issue of
6,996,605,613 new shares) and the merger of the subsidiary Credito Siciliano (issue of 7,275,110
exchange shares), the share capital is made up of 7,014,969,446 shares with no indication of the
nominal value. At 30 June 2018, the portfolio contained 600 treasury shares of EUR 100 thousand.
No purchase or sale was put in place during the financial year.

102
Information on share capital - number of shares: annual changes
Items/Types 2018
Ordinary Other
A. Shares at the beginning of the year 110,887,236 -
- fully paid-up 110,887,236 -
- not fully paid-up - -
A.1 Treasury shares (-) -6,000 -
A.2 Outstanding shares: opening balance 110,881,236 -
B. Increases 7,003,880,723 -
B.1 New issues 7,003,880,723 -
- against payment: 7,003,880,723 -
- business combinations 7,275,110 -
- conversion of bonds - -
- exercising of warrants - -
- other 6,996,605,613 -
- free: - -
- on behalf of employees - -
- on behalf of directors - -
- other - -
B.2 Sale of treasury shares - -
B.3 Other increases - -
C. Decreases -99,798,513 -
C.1 Cancellation - -
C.2 Repurchase of treasury shares - -
C.3 Disposals of companies - -
C.4 Other decreases -99,798,513 -
D. Outstanding shares: final balance 7,014,968,846 -
D.1 Treasury shares (+) 600
D.2 Shares outstanding at the end of the year 7,014,969,446
- fully paid-up 7,014,969,446
- not fully paid-up - -

103
OTHER INFORMATION
Commitments and financial guarantees given
30/06/2018
Notional value on commitments and financial guarantees given Total
Stage 1 Stage 2 Stage 3
Commitments to grant finance 5,108,828 120,932 35,986 5,265,746
a) Central Banks - - - -
b) Public administrations 345,931 28 - 345,959
c) Banks 32,176 5,904 - 38,080
d) Other financial companies 342,107 3 33 342,143
e) Non-financial companies 3,738,472 90,740 35,076 3,864,288
f) Households and others 650,142 24,257 877 675,276
Financial guarantees given 111,004 5,297 1,810 118,111
a) Central Banks - - - -
b) Public administrations - - - -
c) Banks 44,894 - - 44,894
d) Other financial companies 869 - - 869
e) Non-financial companies 56,762 4,351 1,658 62,771
f) Households and others 8,479 946 152 9,577
Other commitments and other financial guarantees given
30/06/2018
Other guarantees given 553,940
of which: non-performing loans 23,630
a) Central Banks -
b) Public administrations 3,367
c) Banks 13,297
d) Other financial companies 8,926
e) Non-financial companies 482,279
f) Households and others 46,071
Other commitments 24,551
of which: non-performing loans -
a) Central Banks -
b) Public administrations 1,340
c) Banks -
d) Other financial companies 22,605
e) Non-financial companies 606
f) Households and others -

104
31/12/2017
1) Financial guarantees given
a) Banks 44,820
b) Customers 78,959
2) Commercial guarantees given
a) Banks 9,897
b) Customers 565,616
3) Irrevocable commitments to grant finance
a) Banks
i) certain to be called on 436
ii) not certain to be called on -
b) Customers
i) certain to be called on 1,503
ii) not certain to be called on 429,478
4) Commitments underlying credit derivatives: protection sales -
5) Assets pledged as guarantee for third-party commitments -
6) Other commitments -
Total 1,130,709
Assets pledged as guarantee for the Bank's liabilities and commitments
Portfolios 30/06/2018 31/12/2017
1. Financial assets at fair value through profit or loss 10,588 15,284
2. Financial assets at fair value through other comprehensive income 1,639,585 3,251,044
3. Financial assets at amortised cost 9,487,194 7,033,636
4. Property, equipment and investment property - -
The assets indicated above were used as a guarantee for funding repurchase agreements, issue
of bank drafts, derivatives as well as the loan received from the European Central Bank, of loans
received from the European Investment Bank and from Cassa Depositi e Prestiti.

105
BREAKDOWN OF THE MAIN INCOME STATEMENT ITEMS
INTEREST - ITEMS 10 AND 20
Interest and similar income: breakdown
Items/Technical forms Debt
instruments Loans
Other transactions
1st half of 2018
1st half of 2017
Change
1. Financial assets atfair value through profit or loss 164 - - 164 137 19.71%
1.1 Financial assets held for trading 67 - - 67 137 -51.09%
1.2 Financial assets at fair value - - - - - -
1.3 Other financial assets mandatorily measured at fair value 97 - - 97 - -
2. Financial assets at fair value throughother comprehensive income 5,421 - X 5,421 30,067 -81.97%
3. Financial assets at amortised cost 19,343 204,763 X 224,106 234,643 -4.49%
3.1 Loans and receivables with banks 79 468 X 547 824 -33.62%
3.2 Loans and receivables with customers 19,264 204,295 X 223,559 233,819 -4.39%
4. Hedging derivatives X X - - - -
5. Other assets X X 187 187 31 n.s.
6. Financial liabilities X X X 5,492 3,553 54.57%
Total 24,928 204,763 187 235,370 268,431 -12.32%
Interest income calculated using the amortised cost method amounted to EUR 235,019 thousand.
In the first half of 2017, item “3. Financial assets at amortised cost” also includes interest on securities classified as “Financial assets held to maturity”.
Interest and similar expense: breakdown
Items/Technical forms Payables Securities Other
transactions 1st half of 2018
1st half of 2017
Change
1. Financial liabilities at amortised cost:
1.1 Due to central banks - X X - - -
1.2 Due to banks (2,800) X X (2,800) (557) n.s.
1.3 Due to customers (17,555) X X (17,555) (21,076) -16.71%
1.4 Securities issued X (26,552) X (26,552) (33,358) -20.40%
2. Financial liabilities held for trading - - (16) (16) (68) -76.47%
3. Financial liabilities at fair value - - - - - -
4. Other liabilities and provisions X X - - - -
5. Hedging derivatives X X (6,967) (6,967) (13,016) -46.47%
6. Financial assets X X X (2,601) (1,584) 64.20%
Total (20,355) (26,552) (6,983) (56,491) (69,659) -18.90%

106
FEES AND COMMISSIONS - ITEMS 40 AND 50
Fee and commission income: breakdown
Type of services/Amounts 1st half of 2018
1st half of 2017
Change
a) guarantees given 2,972 3,377 -11.99%
b) credit derivatives - - -
c) management, trading and consulting services: 54,756 52,953 3.40%
1. trading of financial instruments 1 1 -
2. currency trading 1,837 2,090 -12.11%
3. portfolio management - - -
3.1 individual - - -
3.2 collective - - -
4. custody and administration of securities 334 352 -5.11%
5. custodian bank - - -
6. placement of securities 25,729 20,636 24.68%
7. order acceptance and transmission 2,667 3,179 -16.11%
8. consulting services 453 338 34.02%
8.1 on investments - - -
8.2 on financial structuring 453 338 34.02%
9. distribution of third party services 23,735 26,357 -9.95%
9.1. portfolio management 6,093 8,106 -24.83%
9.1.1. individual 6,093 8,106 -24.83%
9.1.2. collective - - -
9.2. insurance products 15,075 15,928 -5.36%
9.3. other products 2,567 2,323 10.50%
d) collection and payment services 39,376 39,941 -1.41%
e) servicing for securitisation transactions - - -
f) factoring transaction services 24 - -
g) tax collection services - - -
h) management of multilateral trading facilities - - -
i) current account management 27,981 29,432 -4.93%
j) other services 29,086 30,795 -5.55%
Total 154,195 156,498 -1.47%
Fee and commission income included under “j) other services” refers to commissions on arranged
overdraft of EUR 21,134 thousand, commissions for loans origination deriving from financial
assets not designated at fair value through profit or loss of EUR 3,156 thousand and commissions
for rights and pledges of EUR 1,758 thousand.

107
Fee and commission expense: breakdown
Services/Amounts 1st half of 2018
1st half of 2017
Change
a) guarantees received (1,461) (1,286) 13.61%
b) credit derivatives - - -
c) management and trading services: (549) (667) -17.69%
1. trading of financial instruments (13) (4) 225.00%
2. currency trading (1) (1) -
3. portfolio management - - -
3.1 own account - - -
3.2 for third parties - - -
4. custody and administration of securities (535) (662) -19.18%
5. placement of financial instruments - - -
6. off-premises provision of financial instruments, products and services - - -
d) collection and payment services (12,124) (11,484) 5.57%
e) other services (639) (745) -14.23%
Total (14,773) (14,182) 4.17%
DIVIDENDS AND SIMILAR INCOME - ITEM 70
Dividends and similar income: breakdown
Items/Income
1st half of 2018 1st half of 2017 Change
Dividends Similar income
Dividends Similar income
Dividends Similar income
A. Financial assets held for trading 713 - 1 - n.s. -
B. Other financial assets mandatorily measured at fair value 781 - - - - -
C. Financial assets at fair value through other comprehensive income 373 - 2,700 175 -86.19% -100.00%
D. Equity investments - - - - - -
Total 1,867 - 2,701 175 -30.88% 100.00%

108
PROFITS (LOSSES) ON TRADING - ITEM 80
Profits (Losses) on trading: breakdown
Transactions/Income components Gains (A) Trading
income (B) Losses (C)
Trading losses (D)
Profits (Losses) on
trading [(A+B)-(C+D)]
1. Financial assets held for trading 280 1,035 (3,327) (1,296) (3,308)
1.1 Debt instruments - 76 (512) (109) (545)
1.2 Equity instruments 268 619 (1,331) (835) (1,279)
1.3 OEIC units 12 340 (1,484) (352) (1,484)
1.4 Loans - - - - -
1.5 Other - - - - -
2. Financial liabilities held for trading - - - - -
2.1 Debt instruments - - - - -
2.2 Payables - - - - -
2.3 Other - - - - -
3. Financial assets and liabilities: exchange ratedifferences
X X X X 206
4. Derivatives 20 3,448 (4) (145) 4,135
4.1 Financial derivatives:
- On debt instruments and interest rates 20 3,448 (4) (145) 3,319
- On equity instruments and stock market share indices - - - - -
- On currencies and gold X X X X 816
- Other - - - - -
4.2 Credit derivatives - - - - -
of which: natural hedges associated with fair value option X X X X -
Total 300 4,483 (3,331) (1,441) 1,033

109
NET HEDGING INCOME (EXPENSE) – ITEM 90
Net hedging income (expense): breakdown
Income components/Amounts 1st half of
2018 1st half of
2017 Change
A. Gains on:
A.1 Fair value hedges 2,349 29,204 -91.96%
A.2 Financial assets with fair value hedges 364 - -
A.3 Financial liabilities with fair value hedges - - -
A.4 Financial derivatives for cash flow hedges - - -
A.5 Foreign currency assets and liabilities - - -
Total hedging income (A) 2,713 29,204 -90.71%
B. Losses on:
B.1 Fair value hedges (94) - -
B.2 Financial assets with fair value hedges (2,669) (29,253) -90.88%
B.3 Financial liabilities with fair value hedges - - -
B.4 Financial derivatives for cash flow hedges - - -
B.5 Foreign currency assets and liabilities - - -
Total hedging expense (B) (2,763) (29,253) -90.55%
C. Net hedging expense (A-B) (50) (49) 2.04%
of which: result of hedges on net positions - - -
PROFIT (LOSS) ON SALE/REPURCHASE - ITEM 100
Profit (loss) on sale/repurchase: breakdown
Items/Income components
1st half of 2018
Profit Losses Net profit (losses)
A. Financial assets
1. Financial assets at amortised cost
1.1 Loans and receivables with banks - - -
1.2 Loans and receivables with customers 125,013 (220,233) (95,220)
2. Financial assets at fair value through other comprehensive income
2.1 Debt instruments 26,809 (9,349) 17,460
2.2 Loans - - -
Total assets (A) 151,822 (229,582) (77,760)
B. Financial liabilities at amortised cost
1. Due to banks - - -
2. Due to customers - - -
3. Securities issued 76 (5) 71
Total liabilities (B) 76 (5) 71

110
Items/Income components
1st half of 2017
Profit Losses Net profit (losses)
Financial assets
1. Loans and receivables with banks - - -
2. Loans and receivables with customers 1,166 (14,576) (13,410)
3. Available-for-sale financial assets
3.1 Debt instruments 12,334 (313) 12,021
3.2 Equity instruments 9,855 - 9,855
3.3 OEIC units 2 - 2
3.4 Loans - - -
4. Financial assets held to maturity - - -
Total assets 23,357 (14,889) 8,468
Financial liabilities
1. Due to banks - - -
2. Due to customers - - -
3. Securities issued 250 (741) (491)
Total liabilities 250 (741) (491)
Profits and losses on loans and receivables with customers refer to the sale transactions of non-
performing loans occurred in the first half of 2017 (in particular Algebris 2) whereas profits on
equity instruments mainly refer to the sale of shares of Anima Holding S.p.A.
PROFITS (LOSSES) ON OTHER ASSETS AND LIABILITIES AT FAIR VALUE THROUGH PROFIT OR LOSS – ITEM
110
Net change in value of other financial assets and liabilities at fair value through profit or loss: breakdown of financial assets and liabilities mandatorily measured at fair value
Transactions/Income components Gains (A) Gains
on sales (B) Losses (C)
Losses on sales
(D)
Net profit (losses) [(A+B)-(C+D)]
1. Financial assets 843 458 (3,342) - (2,041)
1.1 Debt instruments - - - - -
1.2 Equity instruments 50 433 (746) - (263)
1.3 OEIC units 793 25 (2,596) - (1,778)
1.4 Loans - - - - -
2. Financial assets: exchange ratedifferences X X X X -
Total 843 458 (3,342) - (2,041)

111
NET IMPAIRMENT LOSSES FOR CREDIT RISK - ITEM 130
Net impairment losses for credit risk relating to financial assets at amortised cost: breakdown
Transactions/ Income components
Impairment losses (1) Reversals of
impairment losses (2) 1st half of
2018 1st half of
2017
Stage 1 and 2
Stage 3 Stage 1 and
2 Stage 3 Total Total
Write-off Other
A. Loans and receivables with banks
(398) - - 170 - (228) -
- Loans (349) - - 121 - (228) -
- Debt instruments (49) - - 49 - - -
of which: acquired or originated impaired loans - - - - - - -
B. Loans and receivables with customers
(2,494) (13,599) (156,506) 17,415 179,730 24,546 (293,396)
- Loans 437 (13,599) (156,506) 17,064 179,730 27,126 (292,976)
- Debt instruments (2,931) - - 351 - (2,580) (420)
of which: acquired or originated impaired loans
- - - - - - -
Total (2,892) (13,599) (156,506) 17,585 179,730 24,318 (293,396)
The reversals of impairment losses shown above mainly refer to non-performing loans, which are also measured based on sales scenarios that have not been included in the final disposal portfolios of Aragorn and Gimli.
Net impairment losses for credit risk relating to financial assets at fair value through other comprehensive income: breakdown
Transactions/Income components
Impairment losses (1) Reversals of impairment
losses (2) 1st half of 2018
Stage 1 and 2
Stage 3 Stage 1 and
2 Stage 3 Total
Write-off Other
A. Debt instruments (1,496) - - 38 - (1,458)
B. Loans - - - - - -
- with customers - - - - - -
- with banks - - - - - -
of which: acquired or originated impaired financial assets - - - - - -
Total (1,496) - - 38 - (1,458)

112
Net impairment losses on available-for-sale financial assets: breakdown
Transactions/Income components
Impairment losses Reversals of
impairment losses 1st half of
2017 Individual Individual
Derecognition Other A B
A. Debt instruments - - - - -
B. Equity instruments - (3,153) X X (3,153)
C. OEIC units - (32,013) X - (32,013)
D. Loans with banks - - - - -
E. Loans with customers - - - - -
F. Total - (35,166) - - (35,166)
Key: A = from interest B = other reversals
Impairment losses on OEIC units mainly refer to the write-down of the Atlante fund (EUR 31
million) carried out in the first half of 2017.
ADMINISTRATIVE EXPENSES - ITEM 190
Personnel expenses: breakdown
Type of expense/Amounts 1st half of
2018 1st half of
2017 Change
1) Employees (190,323) (130,060) 46.33%
a) wages and salaries (84,784) (91,707) -7.55%
b) social security charges (28,088) (28,899) -2.81%
c) post-employment benefits (5,353) (5,867) -8.76%
d) pension expenses - - -
e) accrual for post-employment benefits (387) (486) -20.37%
f) accrual for pension and similar provisions:
- defined contribution - - -
- defined benefit (659) (240) 174.58%
g) payments to external supplementary pension funds:
- defined contribution (3,937) (4,541) -13.30%
- defined benefit (150) (203) -26.11%
h) costs of share-based payment plans - - -
i) other employee benefits (66,965) 1,883 n.s.
2) Other personnel in service (88) (859) -89.76%
3) Directors and statutory auditors (2,039) (2,427) -15.99%
4) Retired personnel (982) (969) 1.34%
Total (193,432) (134,315) 44.01%
Item “1 employees: i) other employee benefits” includes EUR 63.5 million of extraordinary
expenses relating to early retirement plan set forth in the trade-union agreement signed on 16
April. In the first half of 2017, the same item included a positive component of EUR 7.5 million
(“NASPI” - Nuova Assicurazione Sociale per l’Impiego contribution).

113
Average number of employees by category
1st half of 2018 1st half of 2017
Employees: 3,677 3,775
a) executives 47 54
b) middle managers 1,468 1,502
c) other employees 2,162 2,219
Other personnel 5 48
Total 3,682 3,823
“Other employees” includes atypical forms of contract other than subordinate employment
contract, such as for example project and temporary work contracts.
Other administrative expenses: breakdown
1st half of 2018
1st half of 2017
Change
Fees for professional and consulting services (22,529) (32,635) -30.97%
Data processing services (13,475) (14,072) -4.24%
Property management (4,755) (6,445) -26.22%
Rent payable (11,882) (11,229) 5.82%
Taxes (25,976) (29,386) -11.60%
SRF, DGS and additional contributions (12,611) (7,922) 59.19%
Miscellaneous items (31,415) (31,740) -1.02%
Total (122,643) (133,429) -8.08%
NET ACCRUALS TO PROVISIONS FOR RISKS AND CHARGES - ITEM 200
Net accruals to provisions for risks and charges: breakdown
Items 1st half of 2018
1st half of 2017
Change
Provision for legal disputes and claims from liquidators (3,643) (576) n.s.
Provision for sundry risks and charges (4,244) 534 n.s.
Total (7,887) (42) n.s.
OTHER OPERATING NET INCOME - ITEM 230
Other operating expenses: breakdown
1st half of 2018
1st half of 2017
Change
Amortisation of leasehold improvements (500) (688) -27.33%
Real estate costs (2,923) (2,646) 10.47%
Other expenses (4,697) (4,722) -0.53%
Total (8,120) (8,056) 0.79%
Other operating expenses include costs borne as a result of the Aragorn operation of EUR 1 million.

114
Other operating income: breakdown
1st half of 2018
1st half of 2017
Change
Rent receivable 775 901 -13.98%
Recovery of loan setup fees 801 1,057 -24.22%
Income from real estate services (including income from review of prices on real estate agreements underway) 6 190 -96.84%
Income from data processing services 2,809 6,211 -54.77%
Income from other services 280 275 1.82%
Recovery of indirect taxes 18,610 20,116 -7.49%
Recovery of insurance policy payments 430 443 -2.93%
Recovery of legal and notarial costs 2,646 5,159 -48.71%
Badwill 15,357 - -
Changes in property works in progress 2,500 1,573 58.93%
Revenue from property sales 335 25 n.s.
Other income 3,153 7,836 -59.76%
Total 47,702 43,786 8.94%
The other operating income mainly includes recovery of expenses incurred in the half-year for the
management of bad loans included in the Aragorn portfolio of EUR 1,785 thousand.

115
NET GAINS (LOSSES) ON EQUITY INVESTMENTS - ITEM 250
Net gains (losses) on equity investments: breakdown
Income components/Sectors 1st half of 2018
1st half of 2017
Change
1. Companies subject to joint control
A. Income 7 9 -22.22%
1. Revaluations 7 9 -22.22%
2. Gains on sale - - -
3. Reversals of impairment losses - - -
4. Other income - - -
B. Expense - - -
1. Impairment - - -
2. Impairment losses - - -
3. Losses on sale - - -
4. Other expenses - - -
Net gains (losses) 7 9 -22.22%
2. Companies subject to significant influence
A. Income 1,580 427 n.s.
1. Revaluations 1,580 427 n.s.
2. Gains on sale - - -
3. Reversals of impairment losses - - -
4. Other income - - -
B. Expense (288) (278) 3.60%
1. Impairment (288) (278) 3.60%
2. Impairment losses - - -
3. Losses on sale - - -
4. Other expenses - - -
Net gains (losses) 1,292 149 n.s.
Total 1,299 158 n.s.
NET GAINS (LOSSES) ON SALES OF INVESTMENTS - ITEM 280
Net gains (losses) on sales of investments: breakdown
Income components/Sectors 1st half of 2018 1st half of 2017 Change
A. Property
- Gains on sale 18 69,935 -99.97%
- Losses on sale - (21) -100.00%
B. Other assets
- Gains on sale 5 16 -68.75%
- Losses on sale (42) (4) n.s.
Net gains (losses) (19) 69,926 -100.03%
In the first half of 2017, the item includes the gain on the sale of a portfolio of capital properties
as part of the “sale & lease back” transaction concluded at the end of June 2017.
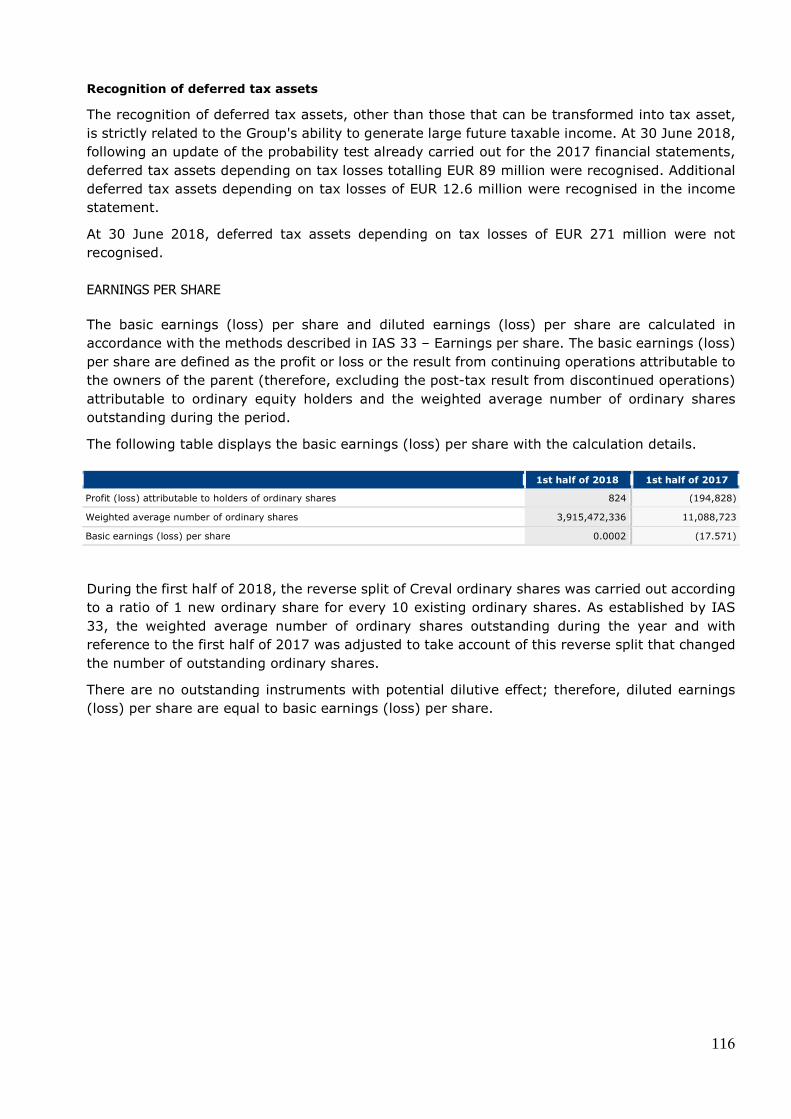
116
Recognition of deferred tax assets
The recognition of deferred tax assets, other than those that can be transformed into tax asset,
is strictly related to the Group's ability to generate large future taxable income. At 30 June 2018,
following an update of the probability test already carried out for the 2017 financial statements,
deferred tax assets depending on tax losses totalling EUR 89 million were recognised. Additional
deferred tax assets depending on tax losses of EUR 12.6 million were recognised in the income
statement.
At 30 June 2018, deferred tax assets depending on tax losses of EUR 271 million were not
recognised.
EARNINGS PER SHARE
The basic earnings (loss) per share and diluted earnings (loss) per share are calculated in
accordance with the methods described in IAS 33 – Earnings per share. The basic earnings (loss)
per share are defined as the profit or loss or the result from continuing operations attributable to
the owners of the parent (therefore, excluding the post-tax result from discontinued operations)
attributable to ordinary equity holders and the weighted average number of ordinary shares
outstanding during the period.
The following table displays the basic earnings (loss) per share with the calculation details.
1st half of 2018 1st half of 2017
Profit (loss) attributable to holders of ordinary shares 824 (194,828)
Weighted average number of ordinary shares 3,915,472,336 11,088,723
Basic earnings (loss) per share 0.0002 (17.571)
During the first half of 2018, the reverse split of Creval ordinary shares was carried out according
to a ratio of 1 new ordinary share for every 10 existing ordinary shares. As established by IAS
33, the weighted average number of ordinary shares outstanding during the year and with
reference to the first half of 2017 was adjusted to take account of this reverse split that changed
the number of outstanding ordinary shares.
There are no outstanding instruments with potential dilutive effect; therefore, diluted earnings
(loss) per share are equal to basic earnings (loss) per share.

117
Information on risks and related hedging policies
Strategic decisions regarding risk management at Group level are taken by the Parent's corporate
bodies, taking account of the specific operations and related risk profiles of each Bank/Company
of the Group, in order to implement an integrated and consistent risk management policy.
In this context, the Parent defines and approves the Group Risk Appetite Framework (RAF) and
Risk Appetite Statement (RAS), which define the risk appetite, the roles and responsibilities of
the corporate bodies and functions involved, the system of indicators and limits, the monitoring
system of the indicators and the escalation procedures to be activated in case the thresholds are
exceeded.
Moreover, in compliance with the Supervisory provisions, the Group adopts an internal control
system that defines the set of rules, functions, structures, resources, processes and procedures
that aim to ensure, in compliance with sound and prudent management, the achievement of the
following goals:
- monitoring the implementation of strategies and corporate policies;
- reducing the risk within the limits indicated in the framework of reference for determining
the risk appetite of the bank (Risk Appetite Framework - “RAF”);
- safeguarding of the asset value and protection from losses;
- effectiveness and efficiency of corporate processes;
- reliability and security of business information and of IT procedures;
- prevention of the risk that the bank is involved, even unintentionally, in illegal activities
(with a special reference to those related to money laundering, usury and terrorist
financing);
- compliance of the transactions with the law and supervisory regulations, as well as with
policies, regulations and internal procedures.
The control system is divided into different phases (decision, implementation, control and
information cycle) and shows the involvement of decision-making, operating and control bodies,
supported by adequate IT systems. In full compliance with the principles of independence,
autonomy and professionalism of the appointed functions, both the risk management process and
the control process are highly integrated with the decision-making process and involve both the
structures of the Group and of individual Companies.
In particular, in order to ensure an effective system of governance and control at the Group level,
the Parent monitors the Group in three different ways:
- a strategic control on the development of the different business areas in which the Group
operates and of the risks related to the activities carried on. This is a control of both the
performance of activities carried out by the companies belonging to the Group
(endogenous growth or reduction) and of the policies of acquisition and disposal by group
companies (exogenous growth or reduction);
- a management control aimed at ensuring maintenance of the conditions of economic and
financial balance of the individual companies and of the Group as a whole;
- technical and operational control aimed at evaluating the various risk profiles of individual
subsidiaries and the overall risks of the Group.
As part of the controls indicated above, the identification of risks to which the Credito Valtellinese
Banking Group is actually and potentially exposed constitutes the essential prerequisite for a
knowledgeable assumption of said risks and their effective management. In line with the

118
regulatory provisions, with the operational and organisational characteristics, the different types
of risk that the Group assumes and manages in the carrying on of its activities are:
- credit and counterparty risk (including country and transfer risk);
- credit valuation adjustment risk;
- market risk for the trading book (including the basis risk);
- operational risk;
- IT risk;
- interest rate risk for the banking book;
- concentration risk of the loans and receivables with customers portfolio;
- liquidity risk;
- real estate risk;
- compliance risk;
- risk of money laundering and terrorist financing;
- risk towards associated parties;
- reputational risk;
- risk deriving from securitisations;
- residual risk;
- strategic risk (including risk from investments);
- risk of excessive leverage;
- sovereign risk;
- model risk;
- risk related to the portion of encumbered assets (asset encumbrance).
The risk exposure is assessed primarily within the Internal Capital Adequacy Assessment Process
(ICAAP) and Internal Liquidity Adequacy Assessment Process (ILAAP). The subjective importance
of the risks to be measured is confirmed in regulatory terms by the supervisory provisions, which
require a capital control in connection with certain types of risk (known as “First Pillar” risks) and
require the banks to assess other types of risk (known as “Second Pillar” risks), included in a list
that is not complete, and to have an adequate capital to face up to them. The assumption of
importance based on objective and regulatory elements is accompanied additionally by the
consideration of company characteristics, which can lead both to the integration and to the
increase/decrease of the assessment of importance.
In line with its focus on retail banking, the Group is mainly exposed to credit risk. In terms of
capital requirements, the exposure to operational risks is also significant: these risks are assumed
in that they serve as a means for carrying out the banking business. The exposure to financial
and market risks is limited, given that the objective of limiting the volatility of the forecast results
would not be compatible with an intensive speculative financial activity, with a pronounced
transformation of maturities and with treasury management as a profit centre rather than a
service. The current composition of the assets also involves an exposure to the sovereign risk,
whereas the other risks are of lesser significance.
At the end of the reporting period, the exposure to each risk is consistent with the risk appetite
defined by the Board of Directors and with the risk-taking and risk management policies.

119
Detailed information on the general characteristics of the control systems, the risk management,
measurement and control policies are contained in the Notes to the 2017 Consolidated Financial
Statements (Part E – Information on risks and hedging policies) and in the informative report on
the third pillar at 31 December 2017 made available on the Group's website at
www.gruppocreval.com.
1.1 CREDIT RISK
In line with its focus on retail banking, the Group is mainly exposed to credit risk taken on when
carrying out the traditional lending activity, regardless of the specific technical form in which the
loan is granted.
In line with and as part of the guidelines of the Group Risk Appetite Framework and of the budget
objectives for the year, the aim of the credit policies is to:
- make concrete and operational the statutory principles that express the corporate identity
- a Group oriented to financing the real economy of the areas in which the Group operates,
SMEs and households in particular - and inspire its guidelines for carrying out its lending
activity;
- direct the loans portfolio composition towards the optimisation of the ratio between the
expected return and credit risk, with a view to realigning the risk-adjusted profitability to
the cost of capital and limiting the concentration of exposures on single
counterparties/groups, on single business segments or geographical areas;
- support the monitoring of the credit risk management by applying policies, processes,
methods and standard IT procedures.
The credit risk monitoring mainly involves the risk management department assigned to the Chief
Risk Officer and the organisational area controlled by the Chief Lending Officer (CLO) of Credito
Valtellinese whose task is to:
- govern the credit process, including the medium to long-term loans segment and corporate
finance;
- monitor credit quality by controlling all the variables of risk management, guidance and
monitoring;
- manage anomalous credit;
- endorse corporate and Group regulations concerning Loans.
The credit rating process, approval and management of positions is based on defined guidelines
and standard processes and on delegated powers to authorise loans. In the granting of loans,
guarantees are an accessory element; the granting of loans is, in fact, based on the borrower’s
actual capacity to repay the loan. Where necessary, for the purposes of credit risk reduction, the
Bank acquires from its customers the typical banking guarantees, i.e., mainly, mortgages on real
estate, collaterals on securities and marginally personal guarantees.
The Group makes use of a set of parameters and instruments for managing and measuring the
credit risk, which includes important elements such as internal ratings and the Probability of
default parameter, calculated through differentiated and estimated models specifically by
customer segment (Corporate, SME Corporate, Small Retail, Micro Retail and Private).
The distributions by rating class for the company portfolio (Corporate and Retail) and Private
Retail are indicated below. The data refer to 30 June 2018 and 31 December 2017.

120
Chart 1 - Distribution of loans to companies and private by rating class
The master scale adopted by the Group consists of 9 rating classes to which the related PDs
(Probability of default) correspond, i.e., the probability that a counterparty belonging to a
particular rating class passes to the default state within a time horizon of one year.
A second risk parameter used by the Group for measuring and managing the credit risk is the
Loss Given Default (LGD) that represents a loss rate in case of default, i.e. the expected value
(possibly affected by adverse scenarios) of the ratio, expressed in percentage terms, between the
loss due to default and the amount of exposure at the moment of default (Exposure At Default,
EAD). In order to calculate the value of LGD, bad loans LGD and the Danger Rate are estimated
and then two additional components are applied: the downturn effect and indirect costs.
The third parameter is Exposure At Default (EAD), which derives from the estimate of the Credit
Conversion Factor (CCF). The CCF is the ratio between the current unused portion of a line of
credit that could be used - and that in case of default would result in an exposure - and the portion
currently unused of this line of credit, where the entity of the credit line is determined by the
previously established limit.
In line with IFRS 9 “Financial Instruments”, the Group also estimated the risk parameters to
define the risk metrics against a lifetime horizon conditional to expectations on future
macroeconomic scenarios (known as forward looking). Specifically, the following parameters were
estimated:
- lifetime Probability of Default (PD), which involves the use of both point in time and
through the cycle metrics, the latter only for the purposes of classifying exposures in IFRS
9 stages;
- forward looking Loss Given Default (LGD) obtained from estimates of Danger Rate and
LGD-point in time forward looking bad loan components;
- Credit Conversion Factor (CCF), which identifies the relationships existing between the
CCFs historically recorded on the Group's loan portfolio and the economic and financial
variables, in order to simulate the evolution of the CCFs over time in the Most Likely
5.5
%
18
.0%
14
.8%
18
.8%
11
.5%
9.7
%
8.0
%
6.6
%
6.4
%
0,8
%
6.8
%
19
.9%
15
.5%
18
.2%
10
.8%
9.0
%
7.6
%
5.8
%
5.4
%
0,9
%
0%
5%
10%
15%
20%
AAA AA A BBB BB B CCC CC C NA/Unrated
Po
rtio
n o
f E
AD
Rating class
Enterprises and Private
December 2017
June 2018

121
scenario in order to obtain forward looking estimates that reflect the point in time state of
the economy;
In addition to the above, in order to determine impairment losses on exposures classified as stage
2, the following components were estimated: the probability of prepayment and the trend of the
exposure over time. Moreover, with regard to macroeconomic scenarios, the Group adopts the
“Most likely scenario+Add-on” approach.
The risk parameters have a key role in loan granting, monitoring and management. In particular,
they play a role in deciding the bodies competent to approve loans and contribute to guide the
decisions of loan managers when classifying positions based on their performance.
Moreover, the risk parameters indicated are used in the classification of performing loans and
receivables with customers portfolio (stage 1 and 2 IFRS 9). Non-performing loans and receivables
with customers (stage 3 IFRS 9) are classified in compliance with what is provided by the
supervisory regulations in:
- past due and/or overdue non-performing loans: credit exposures (other than those defined
as bad or unlikely to pay) due to past-due by more than ninety days in accordance with
the conditions laid down in the supervisory regulations (Bank of Italy Circular no. 272
“Accounts Matrix”);
- unlikely to pay: credit exposures for which the Bank considers it unlikely that the debtor
will fully meet (principal and/or interest) its obligations without taking action to preserve
its credit standing, such as, for example, the realisation of collaterals;
- bad loans: loans and receivables claimed from insolvent counterparties (even if they have
not yet been legally acknowledged as such) or counterparties in similar positions,
regardless of any formulated anticipated loss.
Finally, the risk parameters indicated are used in the impairment of financial assets.
In particular, impairment losses are calculated based on the 12 month expected credit loss and,
if there is a significant increase in credit risk compared to the initial recognition date, based on
the lifetime expected credit loss of the financial instrument. The management of non-performing
loans is entrusted to dedicated structures within the Group that operate through previously set
recovery procedures, differentiated according to the risk classification. More specifically, the
measurement of non-performing financial assets is regulated by company rules and procedures
with reference to:
- the classification of loans and receivables as non-performing, with specific triggers for the
classification as unlikely to pay and bad loans;
- the determination of the value of the loan and receivable/impairment losses;
- the recognition of write-off and debt-forgiveness.
In particular, the write-off of a loan is first of all the result of an evaluation of the position made
by the credit manager and can take place both for non-recoverability and for lack of economic
convenience of the recovery actions. The write-off for non-recoverability refers to cases where
the Bank is in possession of documents attesting to the significant probability that the loan cannot
be recovered in whole or in part. The write-off for lack of economic convenience is made when it
is evident, and can be demonstrated, that the costs associated with pursuing credit recovery
actions (e.g. legal and administrative costs, etc.) are higher than the value of the financial asset
that is expected to be recovered.
Concentration risk
The exposure to concentration risk, by single counterparty or group of related customers, by
business segments and by geographical areas, is modest and consistent with the objectives.

122
QUANTITATIVE INFORMATION
CREDIT QUALITY
NON-PERFORMING AND PERFORMING LOANS: AMOUNTS AND IMPAIRMENT LOSSES
Consolidation of accounts - Distribution of financial assets by portfolio and credit quality (carrying amounts)
Portfolio/Quality Bad loans Unlikely to
pay
Past due non-
performing loans
Past due performing
loans
Other exposures
Total
1. Financial assets at amortised cost 228,456 642,410 97,268 802,156 20,260,964 22,031,254
2. Financial assets at fair value throughother comprehensive income - - - - 1,961,769 1,961,769
3. Financial assets at fair value - - - - - -
4. Other financial assetsmandatorily measured at fair value - - - - 2,255 2,255
5. Financial assets held for sale 20,502 58,762 4,789 2,209 343 86,605
30/06/2018 248,958 701,172 102,057 804,365 22,225,331 24,081,883
31/12/2017 657,512 1,437,161 103,329 554,565 20,132,653 22,885,220
Consolidation of accounts - Distribution of credit exposures by portfolio and credit quality (gross amount and carrying amount)
Portfolio/Quality
Non-performing assets Performing assets
Total (carrying amount) Gross
amount
Total impairment
losses
Carrying amount
Gross amount
Total impairment
losses
Carrying amount
1. Financial assetsat amortised cost 1,970,358 -1,002,224 968,134 21,183,218 -120,098 21,063,120 22,031,254
2. Financial assets at fair valuethrough other comprehensive income - - - 1,963,433 -1,664 1,961,769 1,961,769
3. Financial assets at fair value - - - X X - -
4. Other financial assets mandatorilymeasured at fair value - - - X X 2,255 2,255
5. Financial assets held for sale 211,694 -127,641 84,053 2,928 -376 2,552 86,605
30/06/2018 2,182,052 -1,129,865 1,052,187 23,149,579 -122,138 23,029,696 24,081,883
31/12/2017 4,021,209 -1,823,207 2,198,002 20,749,521 -62,303 20,687,218 22,885,220

123
Prudential consolidation – On and off-statement of financial position credit exposures with banks: gross amount and carrying amount
Type of exposure/Amounts
30/06/2018
Gross amount
Total impairment losses and total provisions for the credit risk
Carrying amount Non-
performing assets
Performing assets
A. On-statement of financial position exposures
a) Bad loans - X - -
- of which: forbearance exposures - X - -
b) Unlikely to pay - X - -
- of which: forbearance exposures - X - -
c) Past due non-performing loans - X - -
- of which: forbearance exposures - X - -
d) Past due performing loans X 1,410 -8 1,402
- of which: forbearance exposures X - - -
e) Other performing loans X 647,875 -2,217 645,658
- of which: forbearance exposures X - - -
Total (A) - 649,285 -2,225 647,060
B. Off-statement of financial position exposures
a) Non-performing - X - -
b) Performing X 83,388 -3 83,385
Total (B) - 83,388 -3 83,385
Total (A+B) - 732,673 -2,228 730,445

124
Prudential consolidation - On and off-statement of financial position credit exposures with customers: gross amount and carrying amount
Type of exposure/Amounts
30/06/2018
Gross amount
Total impairment losses and total provisions for
the credit risk Carrying amount
Non-performing
assets
Performing assets
A. On-statement of financial position exposures
a) Bad loans 855,811 X -606,853 248,958
- of which: forbearance exposures 50,561 X -39,047 11,514
b) Unlikely to pay 1,203,188 X -502,016 701,172
- of which: forbearance exposures 595,557 X -241,308 354,249
c) Past due non-performing loans 123,053 X -20,996 102,057
- of which: forbearance exposures 12,184 X -2,102 10,082
d) Past due performing loans X 820,558 -17,595 802,963
- of which: forbearance exposures X 28,437 -2,129 26,308
e) Other performing loans X 21,693,326 -102,224 21,591,102
- of which: forbearance exposures X 217,715 -9,691 208,024
Total (A) 2,182,052 22,513,884 -1,249,684 23,446,252
B. Off-statement of financial position exposures
a) Non-performing 37,801 X -1,000 36,801
b) Performing X 5,320,916 -4,251 5,316,665
Total (B) 37,801 5,320,916 -5,251 5,353,466
Total (A+B) 2,219,853 27,834,800 -1,254,935 28,799,718

125
DISTRIBUTION AND CONCENTRATION OF CREDIT EXPOSURES
Prudential consolidation - Distribution of on and off-statement of financial position credit exposures with customers by business segment
Exposures/Counterparts
Public administrations Financial companies Financial companies (of
which: insurance companies)
Carrying amount
Total impairment
losses
Carrying amount
Total impairment
losses
Carrying amount
Total impairment
losses
A. On-statement of financial position credit exposures
A.1 Bad loans 177 -21 5,247 -8,045 - -
- of which: forbearance exposures - - - -1,889 - -
A.2 Unlikely to pay 6,334 -1,330 34,280 -32,179 - -
- of which: forbearance exposures 5,726 -1,257 20,291 -12,075 - -
A.3 Past due non-performing loans 1 - 126 -19 - -
- of which: forbearance exposures - - - - - -
A.4 Performing loans 6,914,755 -2,502 2,865,005 -12,441 5,491 -7
- of which: forbearance exposures - - 358 -30 - -
Total (A) 6,921,267 -3,853 2,904,658 -52,684 5,491 -7
B. Off-statement of financial position credit exposures
B.1 Non-performing loans - - 33 - - -
B.2 Performing loans 346,522 -777 397,808 -899 10 -
Total (B) 346,522 -777 397,841 -899 10 -
Total (A+B) 30/06/2018 7,267,789 -4,630 3,302,499 -53,583 5,501 -7
Total (A+B) 31/12/2017 4,522,268 -1,563 2,277,911 -46,861 2,495 -44
Exposures/Counterparts Non-financial companies Households and others
Carrying amount Total impairment
losses Carrying amount
Total impairment losses
A. On-statement of financial position credit exposures
A.1 Bad loans 176,540 -418,108 66,994 -180,679
- of which: forbearance exposures 10,277 -36,099 1,237 -1,059
A.2 Unlikely to pay 525,093 -397,344 135,465 -71,163
- of which: forbearance exposures 289,539 -210,805 38,693 -17,171
A.3 Past due non-performing loans 60,834 -14,144 41,096 -6,833
- of which: forbearance exposures 5,626 -1,424 4,456 -678
A.4 Performing loans 7,477,082 -84,411 5,137,223 -20,465
- of which: forbearance exposures 187,002 -10,909 46,972 -881
Total (A) 8,239,549 -914,007 5,380,778 -279,140
B. Off-statement of financial position credit exposures
B.1 Non-performing loans 35,772 -952 996 -48
B.2 Performing loans 3,889,275 -1,747 683,060 -828
Total (B) 3,925,047 -2,699 684,056 -876
Total (A+B) 30/06/2018 12,164,596 -916,706 6,064,834 -280,016
Total (A+B) 31/12/2017 10,646,082 -1,643,706 4,552,969 -203,281

126
Large exposures
30/06/2018
a) Amount - carrying amount 14,274,378
b) Amount - weighted amount 999,903
c) Number 7
In accordance with Regulation 575/2013, the number of large exposures is determined by
reference to non-weighted exposures exceeding 10% of eligible capital, where exposure is defined
as the sum of on-statement of financial position (excluding those deducted from eligible capital)
and off-statement of financial position exposures with regard to a customer, or group of
associated customers, without the application of weighting factors.
The table above shows the carrying amount of the exposure and the exposure weighted amount,
i.e. the exposure value after applying the Credit Risk Mitigation and the exemptions pursuant to
Article 400 of the CRR.
The report shows positions that exceed the 10% threshold of the eligible capital, attributable to
exposures towards the Italian Government and towards Cassa Compensazione e Garanzia
totalling EUR 11,565 million before applying the weightings and, for the remaining part, mainly
exposures towards banking, financial and government counterparties.

127
1.2 MARKET RISKS
1.2.1 - INTEREST RATE RISK AND PRICE RISK - REGULATORY TRADING BOOK
QUALITATIVE INFORMATION
A. General aspects
“Regulatory trading book” means the portfolio of financial instruments subject to the capital
requirements for the market risks, as stated by the measures regarding supervisory reports. The
trading book comprises bonds, shares, OEIC units and trading derivatives. The bond component
of the portfolio consists mainly of floating rate securities. The bonds held are issued mainly by
the Italian Republic. The equity investments mainly involve ETFs and shares listed on the Italian
Stock Exchange and with high degree of liquidity. The financial instruments in the book are mainly
in Euro.
The risk is allocated to the Parent and the exposure remains well within established limits; the
size and riskiness of the book comply with the established limits. The main portion of the portfolio
risk consists of the price risk. Risk hedging tools and techniques are used in the management of
the portfolio.
Risk is measured using both analytical techniques (establishing the duration of the bond portfolio
with regard to interest rate risk exposure) and statistical estimate techniques of the Value at Risk
(VaR) that allows to evaluate the maximum potential loss in the trading book within a given time
horizon with an established level of confidence.
The estimate is carried out by using the parametric approach, based on the volatility and the
correlations of risk factors observed in a certain period, over a 10-day period and a 99%
confidence interval. The data used is provided by Prometeia (RiskSize).
During the half-year, the VaR recorded limited values with relation to the book's size and to the
allocated VaR.
At the end of the reporting period, the main factors to which the book is exposed are price and
currency risk. The importance of these risks is ascribable to the purchase of listed shares and
ETFs, also denominated in US dollars, carried out during the half-year.
The back-testing activities carried out with reference to the trading book confirm the reliability of
the estimates carried out.
Regulatory trading book – VaR performance
First half of 2018 2017
Average Minimum Maximum 30/06/2018 Average Minimum Average
1,059 211 2,456 2,228 427 146 676

128
Regulatory trading book – VaR performance
Regulatory trading book – Contribution of risk factors to calculation of VaR
Situation at 30/06/2018
Price and specific risk Interest rate risk Currency risk Issuer risk Benefit of
diversification
56.0% 0.2% 30.4% 13.4% -55.2%
Regulatory trading book – Breakdown of bond exposures by issuer type
Situation at 30/06/2018
Sovereign
issuers
Public
issuers Banks
Insurance companies and other financial
companies Corporate
97.1% 2.8% 0.1% 0.0% 0.0%
-
400,000
800,000
1,200,000
1,600,000
2,000,000
2,400,000
2,800,000
2-Jan 30-Jan 27-Feb 27-Mar 27-Apr 28-May 25-Jun
Credito Valtellinese Group VaR First half of 2018
VaR

129
1.2.2 - INTEREST RATE RISK AND PRICE RISK - BANKING BOOK
The banking book consists of all financial instruments payable and receivable not included in the
trading book. It mainly comprises loans and receivables with banks and customers and amounts
due to banks and customers and Government bonds.
The interest-rate risk mainly derives from the existence in the financial statements of the bank of
interest-bearing assets and onerous liabilities. Interest rate risk management aims to minimise
the impact of unfavourable changes in the rates curve on the economic value of equity and on
cash flows generated by statement of financial position items. Limiting exposure to interest rate
risk is achieved primarily by index-linking asset and liability items to money market benchmarks
(usually the Euribor rate) and by balancing the duration of the asset or liability at low levels.
The objectives with respect to interest rate risk exposure are considered when carrying out
strategic and operational planning, both when identifying and developing new products. The Risk
Management Department monitors on a monthly basis the exposure to the interest rate risk and
verifies the compliance with the system of limits. Adequate information flows are provided on a
regular basis and timely to corporate bodies and functions of management and control.
Measurement of interest rate risk is firstly based on the economic value approach, defined as the
current value of expected net financial flows generated by assets, liabilities and off-statement of
financial position items. The behavioural profile of sight items, analysed on a statistical basis with
a special model, is also considered in the assessment of the exposure to risk, based on the
revaluation of positions in different scenarios.
In the measurement of the risk, the current profit approach is used additionally and leads to the
estimate of the impact of change in interest rates on net interest income, which represents a
significant portion of bank revenue.
The exposure to interest rate risk was subject to limits, both at individual and consolidated level,
defined in terms of fair value change at the end of the reporting period (static ALM) resulting from
instantaneous movements of the rate curve. To this end, both parallel shifts of fixed size (typically
200 basis points) and specific changes for each node of the interest-rate structure are considered,
determined on the basis of major decreases and increases actually recorded in an observation
period of 6 years (considering the 1st and 99th percentile of the distribution, respectively).
Moreover, non-parallel shifts of the yield curve that can change its inclination (flattening,
steepening and reversal of the interest rate structure) are also taken into consideration.
At half-year end, the changed duration calculated for all financial statement assets and liabilities
as well as the duration gap were moderate. Assuming that the rate structure makes a parallel
shift upwards of 100 basis points, the fair value would decrease by EUR 173.6 million. In case of
an equal downward shift, under the non-negativity restriction in nominal interest rates, the value
would increase by EUR 47.9 million. As regards income profiles, in the hypothesis of instantaneous
and parallel shifts of the interest rate curve by -100 basis points, the variation of the net interest
income generated by the banking book, over a time horizon of 12 months, would equal EUR 0.4
million, whereas it would equal EUR 37 million in the case of shifts of +100 basis points. These
amounts express the effect of changes in the interest rates on the banking book, excluding
changes in the composition and size of the financial statement items. As a result, these cannot
be considered as an indicator in forecasting the expected level of the net interest income.
However, under the assumptions indicated, changes in the net interest income would result in
equal changes in total income and minor changes in profit, if we consider the related tax effects.
The banking book consists also of the shares that are held as part of more in-depth relations with
specific companies or represent the instrument supporting significant initiatives undertaken in the
Group's reference territory. Therefore, the price risk management methods for such financial

130
instruments tend more towards the management approach for investments in associates and
companies subject to joint control, rather than the risk measurement techniques and instruments
used for the trading book. The held fund units, mainly real-estate type, mostly pertain to the
Italian market.
Fair value hedges
The hedging of interest rate risk aims to protect the banking book from fair value changes of
loans caused by changes in the interest rate curve (fair value hedge); types of derivatives used
are represented by interest rate swaps (IRS) carried out with third parties.
At the end of the half-year, Italian and French Government bonds are recognised in the banking
book with the objective of hedging the variability of the relevant fair value component linked to
changes in interest rates.
The effectiveness tests carried out on a monthly basis confirmed a very high effectiveness and,
anyway, within the range required by the IFRS.

131
1.3 DERIVATIVE INSTRUMENTS AND HEDGING POLICIES
1.3.1 TRADING DERIVATIVE INSTRUMENTS
A. FINANCIAL DERIVATIVES
Trading financial derivatives: positive and negative fair value – breakdown by product
Types of derivatives
30/06/2018 31/12/2017
Over the counter
Organised markets
Over the counter
Organised markets
Central counterparties
Without central counterparties
Central counterparties
Without central counterparties
With offset
agreements
Without offset agreements
With offset
agreements
Without offset agreements
1. Positive fair value
a) Options - - 28 - - - 32 -
b) Interest rate swaps - - - - - - - -
c) Cross currency swaps - - - - - - - -
d) Equity swaps - - - - - - - -
e) Forwards - - 546 - - - 486 -
f) Futures - - - - - - - -
g) Others - - - - - - - -
Total - - 574 - - - 518 -
2. Negative fair value
a) Options - - 28 - - - 33 -
b) Interest rate swaps - - - - - - 133 -
c) Cross currency swaps - - - - - - - -
d) Equity swaps - - - - - - - -
e) Forwards - - 170 - - - 547 -
f) Futures - - - - - - - -
g) Others - - - - - - - -
Total - - 198 - - - 713 -

132
1.3.2 HEDGE ACCOUNTING
A. HEDGING DERIVATIVES
Hedging derivatives: positive and negative fair value – breakdown by product
Types of derivatives
30/06/2018 31/12/2017
Over the counter
Organised markets
Over the counter
Organised markets Central
counterparties
Without central counterparties
Central counterparties
Without central counterparties
With offset
agreements
Without offset
agreements
With offset
agreements
Without offset
agreements
1. Positive fair value
a) Options - - - - - - - -
b) Interest rate swaps - - - - - - 199 -
c) Cross currency swaps - - - - - - - -
d) Equity swaps - - - - - - - -
e) Forwards - - - - - - - -
f) Futures - - - - - - - -
g) Others - - - - - - - -
Total - - - - - - 199 -
2. Negative fair value
a) Options - - - - - - - -
b) Interest rate swaps - - 135,599 - - - 138,691 -
c) Cross currency swaps - - - - - - - -
d) Equity swaps - - - - - - - -
e) Forwards - - - - - - - -
f) Futures - - - - - - - -
g) Others - - - - - - - -
Total - - 135,599 - - - 138,691 -
1.4. LIQUIDITY RISK
The liquidity risk to which the banks are normally exposed due to the phenomenon of
transformation of maturities is the risk that the banks will not be able to meet their payment
commitments due to inability to procure the funds (funding liquidity risk) and to divest their assets
(market liquidity risk).
Liquidity management is aimed primarily at ensuring the solvency of the Group also in stressful
or crisis conditions, not at achieving profits (an objective that may involve a trade-off with the
ability of the group to meet its commitments when they fall due and reduce the effectiveness of
the risk management system).
The liquidity risk management process mainly involves some specific structures that produce, in
relation to their operational and monitoring activities, special reports for corporate bodies. In
particular, the Finance Department is in charge of treasury management and of the supply on the
interbank market and manages the intraday and short-term liquidity risk; the Planning and Control
Department participates in defining the structural liquidity balance; the Risk Management
Department - independently from the “operational management” of the liquidity risk - contributes
to the definition of the policies and processes of risk management, develops the evaluation process
of liquidity risk, supports the governing bodies in defining and carrying out activities related to
the observance of the prudential regulations, and ensures accurate, complete and timely
information.
The liquidity risk occurs according to different exposure profiles compared to the considered
timescale, to which specific arrangements for the management, measurement, mitigation and
control correspond. The approach adopted for risk management envisages integration of the cash

133
flow matching approach (which tends to make expected cash inflows coincide with expected cash
outflows for each time horizon) with the liquid assets approach (which requires the financial
statements to include a set number of financial instruments that can be readily converted into
cash). In order to face up to the possible occurrence of unexpected liquidity requirements and
thus to mitigate the relevant risk exposure, the Group provides itself with adequate short-term
cash reserves (liquidity buffer).
At 30 June 2018, the Group had a negative net interbank position of EUR 2.5 billion and a carrying
amount towards central counterparties of EUR 4.2 billion. The Group held liquidity reserves mostly
consisting of Italian Government bonds and deemed appropriate to the contingent and perspective
requirements. In particular, EUR 8.7 billion (amount already reduced by the haircuts) of assets
eligible for refinancing with the European Central Bank, including loans that meet the eligibility
requirements. At the end of the reporting period, almost one third of these assets secured the
transactions with the ECB, whereas approximately half was used with market counterparties;
assets amounting to EUR 1.9 billion are free. With reference to a three-month time horizon, not
tied up liquidity reserves amounted to EUR 5.6 billion. At 30 June 2018, the main source of funding
consisted of retail customers (EUR 15.0 billion, accounting for 63.6% of total funding defined
considering both the bank and customer components), stable and diversified. Funding from ECB
(EUR 2.5 billion for long-term refinancing transactions) amounts to 10.6% of total funding.
In consideration of the current composition of deposits carried out, in order to assess the
concentration, the degree of dependence on a limited number of counterparties is analysed, in
particular, whereas transactions in currencies other than the euro and the concentration on special
technical forms such as securitisations are not important. The Group monitors the stock of
liabilities on sight or with a short-term to the major wholesale counterparts (institutional investors,
large companies or groups, non-economic institutions) considered more sensitive to the market
situation and to the real or perceived situation of the Group. The degree of concentration at the
end of June 2018 is in line with the one reported at the end of the prior year and remains at low
levels.
From the structural perspective, the Group carried out a modest transformation of maturities. The
loan-and-deposit ratio was 105.0%, up from 85.0% at the end of the previous year.
Securitisation transactions
The specific risk deriving from securitisations is defined as the “risk that the economic substance
of the securitisation transaction may not be fully reflected in the decisions of risk assessment and
management”. The carrying out of securitisations also involves an exposure to other types of
risks, different by type and entity in relation to the structure of the transactions. With regard to
assessment of exposure to risk, the different profiles are taken in consideration as part of the
ordinary course of business related to the different types of risk.
At the end of the reporting period, the following securitisation transactions are in place:
- Quadrivio RMBS 2011,
for which the Group is not exposed to specific risk deriving from securitisations, having purchased
the junior tranche of the transaction and therefore considered the credit risk relating to the
underlying portfolio.
- Elrond NPL 2017,
transaction completed in July 2017 - The securitisation of bad loans portfolio for a Gross Book
Value (“GBV”) of approximately EUR 1.4 billion at the cut-off date (30 November 2016), by
transferring to a securitisation vehicle – Elrond NPL 2017 S.r.l. - established pursuant to Italian
Law 130/99, and issuing by the latter of three different classes of ABS securities:
- a senior tranche of EUR 464 million, with Baa3/BBB- rating by Moody’s and Scope Ratings,

134
- a mezzanine tranche – with B1/B+ rating by Moody’s and Scope Ratings - and a junior
tranche, without rating, of EUR 42.5 million and EUR 20 million, respectively.
For the securities of the senior tranche – for which the Ministry of Economy and Finance granted
the State guarantee (GACS) on 29 September 2017 – are fully considered by Credito Valtellinese,
whereas the mezzanine and junior tranches were placed by 95% with an institutional counterpart
at the end of a competitive process.
Loans and receivables have been prudentially derecognised following the substantial transfer of
the risks and benefits related to securitised loans.
- Aragorn NPL 2018,
transaction completed in June 2018. The securitisation concerned a portfolio of bad loans for a
Gross Book Value on the cut-off date (31 December 2017) of approximately EUR 1.6 billion, by
transferring this portfolio to a vehicle for securitisation – Aragorn – established pursuant to Italian
Law 130/99, and issue by the latter of three different classes of ABS securities:
- a senior tranche of EUR 509.5 million, with expected rating in line with the requirements
of the regulations relating to the State guarantee (GACS),
- a mezzanine tranche with rating and a junior tranche of EUR 66.8 million and EUR 10
million, respectively.
Senior securities, fully considered by Credito Valtellinese, are expected to benefit from the “GACS”
state guarantee, whose request to the MEF was formalised. Mezzanine and junior tranches were
placed by 95% with institutional investors.
The Aragorn portfolio was derecognised in accounting terms in June, whereas the prudent
derecognition will take place when GACS is obtained.
Credito Valtellinese holds also the senior tranches of ABS securities issued as part of the
securitisations carried out pursuant to Italian Law 130/1999. As a result of the paid redemptions,
the current equivalent carrying amount is EUR 40,215 thousand.
1.5. OPERATIONAL RISK
The operational risk is defined as the risk of incurring losses due to the inadequacy or inefficiency
of procedures, human resources and internal systems or due to external events, including the
legal risk. It includes, inter alia, losses deriving from fraud, human error, interruption of
operations, system break-down, contractual non-performance and natural disasters.
Risk containment is achieved using regulatory, organisational and procedural measures and
training. Any critical area, identified through joint analysis of various sources of data, is examined
in further depth by department managers who, together with the Risk Management Department,
establish the appropriate corrective actions.
Under the regulatory profile, the Group calculated the capital requirement to meet the operational
risk in the consolidated financial statements by using the Traditional Standardised Approach (TSA)
in combination with the Basic approach (BIA). From the management viewpoint, risk exposure is
assessed both in quantitative terms, by analysing the operating losses incurred, and in qualitative
terms, through risk self-assessment.
Legal risks
A provision was made in the financial statements, appropriate and consistent with the policy for
calculating the provisions adopted by the Group, in order to mitigate the potential economic losses
resulting from the pending legal proceedings with regard to the Bank and the other banks
belonging to the Group.

135
At 30 June 2018, there are 523 actions brought against the companies belonging to the Group
for an overall amount of EUR 128 million against which a total loss of EUR 19.1 million is expected.
The cases mainly refer to requests for restitution for compound interests and bankruptcy claw-
backs, claims for compensation for losses accrued in investments in financial instruments and
other cases of damages broken down as follows.
Type of cases No. of cases Relief sought
(in millions of EUR)
Provision made (in millions of EUR)
Compound interests 276 29.7 5.5
Bankruptcy clawbacks 47 35.5 9.0
Investment services 31 6.4 1.6
Other 169 56.4 3.0
Total 523 128.0 19.1
The Group pursues careful settlement procedures, based on an in-depth analysis of the concrete
grounds on which the actions are based, meaning the existence of both the subjective and
objective elements.
Some information concerning important actions against the Bank is summarised below.
Gianfranco Ferrè in A.S.
In 2012, the Procedure started bankruptcy clawback proceedings against Credito Artigiano, now
Credito Valtellinese, pursuant to Article 67 of the Bankruptcy Law with reference to the settlement
remittances paid into the current account of the bankrupt company quantified by the counterparty
in EUR 10.4 million. The Court of Isernia rejected the requests made by the Receivership in their
entirety, considering that the subjective profile of the revocation action proposed by the opposing
party was non-existent. As things stand, the time limits for appealing are still pending.
Ministry of Economy and Finance
On 3 February 2014, a claim form was notified to Credito Valtellinese by the MEF, in relation to
the alleged non-payment by the Bank of interest due as a result of the exercise of the right of
redemption of the financial instruments issued pursuant to Article 12 of Italian Law Decree no.
185 of 29 November 2008, amended and converted by Italian Law no. 2 of 28 January 2009
(known as Tremonti-bond). The MEF asked the Court of Rome to order the Bank to pay a total
amount of EUR 16.86 million. In this regard, on 18 June 2013 the Bank had informed the Ministry
of its intention not to pay the amount of EUR 16.86 million (corresponding to the interests accrued
on a pro rata basis up to the date of redemption and calculated in proportion to the interest paid
on the date of payment of the immediately previous interests) in that such interest is considered
not due on the basis of an interpretation of the applicable regulations and of the formalised issue
prospectus. The Bank appeared before the court maintaining that, at the time of redemption of
the Financial Instruments, there was no payment obligation of interests, in that the last
consolidated financial statements available on the redemption date, or the 2012 financial
statements, approved by the Board of Directors of Credito Valtellinese on 19 March 2013, showed
a loss for the year. These financial instruments were included among the equity instruments and
the related interests were paid through equity. Any further payments of interests must be
recognised by using the equity as an offsetting item. The parties filed the legal briefs and the
reply briefs, and the case was referred to the Judge for decision.
Saba Srl
The plaintiff company started the case with regard to Credito Siciliano charging it with alleged
irregularities in the management by the bank of the loans disbursed to the company itself (with

136
a special reference to a building loan). The counterparty claims that, as a result of these
irregularities, it would have undergone economic damages quantified in the summons in EUR 11.8
million. The judge rejected the requests for preliminary inquiries made by the counterparty.
Judgement is pending. Based on acquired elements of pre-trial investigation, the claim appears
unfounded.
Le Betulle S.p.A. (Marina di Archimede)
The lawsuit concerns a proceeding for damages of EUR 6.65 million related to the case of abusive
lending. The claim is started jointly and severally against Credito Spa, as assignee of Mediocreval
and Credito Siciliano, and the other Banks participating in the pool (with BNL as leading bank,
with the parent BNP Paribas and Interbanca also summoned) which had financed the company
Marina di Archimede S.p.A. for the construction of the marina of Siracusa, as well as against Rina
Services, which had been appointed as the person responsible for verifying the progress of work,
and Rina Check. The building project was never completed and the financed company, in default,
was admitted to the composition proceeding. The plaintiff Company Le Betulle S.p.A., former
creditor of the insolvent company Marina di Archimede S.p.A., contests the banks' right to the
wrong and unlawful performance of the loan agreement inducing the creditors to reasonably rely
on the solvency of the financed party. The Court rejected all the opposing requests for preliminary
investigations and adjourned the case for the summing of the evidence without accepting any of
the evidence requested by the plaintiff. At this stage, the risk of losing the case is considered to
be remote.
Tax dispute
During the first half of 2018, there are no notices of assessment of significant amount.
With regard to past disputes and assessments, the following developments are shown:
- amendment and payment notice of additional mortgage and cadastral taxes, penalties and
interests of EUR 171 thousand, notified to the company Stelline Real Estate during the
2017 financial year, relating to the transfer of a commercial property purchased during
sale by the court, was defined during settlement before the court, at no charge for the
Company;
- amendment and payment notice of additional mortgage and cadastral taxes, penalties and
interests was reported to Credito Valtellinese S.p.A. during 2017 for the transfer of a
commercial property coming from a leasing agreement cancelled during the insolvency
proceedings of the user, for a total amount of EUR 140 thousand: the dispute was defined
during settlement before the court at no charge for the Company in this case as well;
- with regard to the merged company Credito Siciliano S.p.A., note that a notice of
assessment following the closure in 2017 of a general tax audit for the 2014 tax year has
not yet been received, with reference to which, in the relevant report on findings, findings
of an insignificant amount were raised and are believed will be defined in acquiescence
upon receipt of the next tax assessment notice, which, as mentioned above, has not yet
been notified;
- moreover, again with regard to the merged company Credito Siciliano S.p.A., note that a
hearing was held at the Provincial Tax Commission of Palermo on 7 May 2018 relating to
the dispute that arose due to the Company's opposition to the notice of assessment with
which the Regional Tax Office of Sicily challenged during 2017 the application of the
participation exemption system to the gain of EUR 826 thousand made during the transfer
to the Anima Group of the equity investment held in the company Lussemburgo Gestioni
S.A., occurred during the 2012 tax period, on the assumption that the requirement for the
carrying-on of a commercial activity by it was not integrated. Therefore, the Tax Office
requested the payment of a greater amount of Italian corporate income tax (IRES) of

137
approximately EUR 219 thousand, interests of approximately EUR 33 thousand and a
penalty of approximately EUR 197 thousand: in this regard, note that the enacting clause
of the sentence was received on 10 July and that the appeal was upheld.
The rights of the Group companies are protected by external professionals with special skills and
experience, with the intention to enforce the rights of the companies in the competent
administrative and legal venues.
Labour related lawsuits
Disputes in which the companies of the Group are involved at 30 June 2018 are divided equally
between actions undertaken for alleged de-skilling or for disputes concerning the application of
contractual regulations and/or laws governing salary aspects of the employment relationship and
actions concerning the contestation of dismissals with regard to the employee.
At 30 June 2018, labour related lawsuits at Group level amount to no. 17, unchanged from 31
December 2017.
As regards risk quantification, at 30 June 2018, against the relief sought of the labour dispute
described above and amounting to approximately EUR 3.3 million, provisions were made for risks
and charges of EUR 1.4 million, against provisions for risks and charges of EUR 1.5 million at 31
December 2017, with relief sought, at the same date, of EUR 3.1 million.
IT (or ICT) risk
IT risk is the risk of incurring economic, reputation and market share losses in relation to the use
of the Information and Communication Technology - ICT. In the integrated representation of
business risks for prudential purposes (ICAAP), this type of risk is considered, in accordance with
the specific aspects, among operational, reputational and strategic risks.
The IT risk analysis is a tool guaranteeing the efficiency and effectiveness of the protection
measures of the ICT resources.
In the light of the supervisory provisions on this matter, the Group defined the overall framework
for managing the IT risk as well as the methods of risk analysis and assessment.
The percentage distribution of operational losses recognised in the internal database during the
period is shown in terms of frequency and impact.
Operational losses - Distribution by type of event
Event size Losses
Others*
External fraud
Customers, products and business
practices
Stoppage of operations and
malfunctions of the systems
Execution, delivery and management
of processes
10.1%
0.0%
*Internal fraud, contractual relationship and safety in the workplace, damages caused by external events.
9.2%
0.0%
0.4%
80.3%
0.2%
83.8%
8.0%3.3%
4.7%

138
The events reported during the half-year are mainly attributable in terms of frequency to the
following event types: “Execution, delivery and management of processes” (83.8%), “External
fraud” (8%) and “Stoppage of operations and malfunctions of the systems” (4.7%).
In terms of impact, losses are attributable to “Execution, delivery and management of processes”
by 80.3%, to “External fraud” by 10.1% and to “Customers, products and business practices” by
9.2%; losses attributable to other event types are of lesser importance.
1.6. OTHER RISKS
Sovereign risk
The investment in Italian Government bonds, mostly recorded in “Financial assets at amortised
cost” involves the exposure to the credit risk of the Italian Republic that, as with any other issuer,
may occur in the form of a decrease in creditworthiness or, in extreme cases, of insolvency. The
investment in French, Spanish, Greek and Portuguese Government bonds, of a smaller size,
generates an exposure to the credit risk of France, Spain, Greece, Portugal and the United States.
The exposure is monitored on a regular basis and referred to corporate bodies.
The outlook of the exposure to the sovereign risk profile is weighed considering adverse scenarios
of varying intensity, also based on historical simulations, and their impact on the value of the
portfolio and on own funds.
The exposure stood at values higher than those recorded at the end of the year.
The table below shows the carrying amount of the exposures to sovereign debt risk, broken down
by portfolio:
Countries Financial assets at fair value through
profit or loss
Financial assets at fair value through other
comprehensive
Financial assets at amortised cost
Total HTCS
reserve(*)
Italy 10,895 1,754,968 3,895,410 5,661,273 -32,372
France - 65,488 - 65,488 256
Spain - - 847,699 847,699 -
Portugal - - 109,273 109,273 -
Greece - 23,973 - 23,973 11
Other 4 - 34,483 34,487 -
Total 10,899 1,844,429 4,886,865 6,742,193 -32,105
(*) Reserve calculated after the tax effect
Additionally, loans and receivables with customers referring to central and local public administrations amounting to EUR 179,064 thousand are also recognised.
The following table provides information on the expiry of exposures in securities to sovereign debt
risk.
Portfolio Second half of 2018
2019 2020 2021-2022 2023-2028 Beyond
2028 Total
Financial assets at fair value through profit or loss
- - - 10,893 6 - 10,899
Financial assets at fair value through other comprehensive
23,974 49,704 362,044 1,282,333 126,374 - 1,844,429
Financial assets at amortised cost 29,840 151,157 267,755 488,064 3,515,406 434,643 4,886,865
Total 53,814 200,861 629,799 1,781,290 3,641,786 434,643 6,742,193
At 30 June 2018, securities issued by the Governments were measured referring to prices inferred from markets (Level 1 fair value).
139
Risk of excessive leverage
The leverage ratio is considerably higher than the minimum threshold proposed by the
international standards.
Risks towards associated parties
Exposure remained essentially constant in the half-year and is in full compliance with the limits
set by the prudential regulations and by internal policies.
Reputational risk
During the first half of the year, with the positive conclusion of the capital increase in March, the
rating agencies Fitch, Moody's and DBRS reviewed their ratings on Credito Valtellinese with a
positive long-term outlook. During the half-year, there is no element that may have changed or
may change significantly in the short term the perception of the image of the Group with the
various categories of stakeholders (customers, counterparties, shareholders, investors or
supervisory authorities).

140
INFORMATION ON CONSOLIDATED EQUITY
On 1 January 2014, the prudential regulations for banks and investment companies contained in
EU Regulation no. 575/2013 (Capital Requirements Regulation, known as CRR) and in the
2013/36/EU Directive (Capital Requirements Directive, known as CRD IV) approved on 26 June
2013 that transpose in the European Union the standards defined by the Basel Committee on
Banking Supervision (known as Basel III framework) came into force.
As from 1 January 2014, the banking groups must meet a minimum ratio:
- of CET1 equal to 4.5%,
- of Tier 1 equal to 6% as from 2015,
- of a Total Capital ratio equal to 8%.
The following reserves (buffer) of CET1 are added to these binding minimum values envisaged by
the Regulation:
- as from 1 January 2014, the capital conservation buffer;
- from 2016, the counter-cyclical buffer in periods of excessive growth in loans and the
systemic buffer for banks important at global or local level (G-SII, O-SII).
With the 18th update of Circular no. 285, it was established that as from 2018, the banking groups
will be obliged to apply a minimum ratio of capital conservation buffer equal to 1.875% from 1
January 2018 to 31 December 2018.
The counter-cyclical buffer in periods of excessive growth in loans of the first and second quarter
of 2018 remained at zero percent by Bank of Italy.
The sum of regulatory requirements and of additional buffers determine the level of minimum
capital conservation requested from the banking groups at the consolidated level; for 2018, this
level is as follows:
- CET1 equal to 6.375%;
- Tier 1 equal to 7.875%;
- Total Capital ratio equal to 9.875%.
If the sum of these buffers does not comply with the minimum requirement (Combined
Requirement), profit distribution is limited, and it is necessary to adopt a capital conservation
plan.
The Bank of Italy at the end of the regular Supervisory Review and Evaluation Process (SREP),
communicated with measure no. 624242/18 of 23 May 2018 the specific capital requirements
that the Credito Valtellinese Banking Group must comply with for 2018, pursuant to Article 67-
ter, paragraph 1, letter d) of Italian Legislative Decree no. 385/93 (Consolidated Banking Act).
These requirements, including the minimum regulatory requirements as reserve for maintaining
the capital and the additional requirements calculated at the end of SREP, are set as follows:
- CET1 equal to 7.075%;
- Tier 1 equal to 8.813%;
- Total Capital ratio equal to 11.125%.
At 30 June 2018, own funds were calculated by applying the new regulations mentioned above.
However, this regulation envisages transitional regulatory provisions that envisage, until 2022, a
phasing-in mechanism (in terms of capital ratios) of the new accounting standard IFRS 9 through
a transitional period during which a percentage share of the increase in impairment due to the
introduction of the new accounting system is counted in Common equity tier 1 capital.
The elements forming Own Funds are set below:
- Common Equity Tier 1 – CET1;
- Additional Tier 1 – AT1;

141
- Tier 2 – T2.
CET1 and AT1 form the Total Tier 1 capital that together with Tier 2 capital allows to determine
Total Own Funds.
Total Common Equity Tier 1 (CET1), which does not include the profit for the period, amounted
under transitional regulations to EUR 1,939 million. The main changes occurred during the half-
year mainly concern:
- capital increase that resulted in an increase in equity of EUR 671.8 million including net
costs related to the transaction and the equivalent value of the sale of non-exercised
rights;
- a negative change of EUR 37.3 million in valuation reserves, mainly attributable to the
change in the value of Government bonds held in the portfolio of Financial assets at fair
value through other comprehensive income;
- the effects of first-time adoption of IFRS 9 considering the application of the adopted
transitional regime (negative impact of EUR 29.9 million) and the zeroing of the filters
linked to the transitional regime in place at 31 December 2017 (negative impact of EUR
25 million);
- greater deductions related to deferred tax assets (negative impact of EUR 15.6 million).
At 30 June 2018, both significant investments in Common equity tier 1 capital instruments held
in financial sector entities and deferred tax assets that arise from temporary differences and rely
on future profitability are below the exemption limits envisaged by the regulations.
At 30 June 2018, the fully loaded Tier 2 Capital included in T2 instruments the subordinated loans
issued by Credito Valtellinese of EUR 218.9 million. The main changes occurred compared to
December 2017 concern the theoretical amortisation of the loans calculated on a daily basis in
compliance with the provisions of regulation 575/2013.
At 30 June 2018, risk-weighted assets amounted to EUR 13,892 million, compared to EUR 12,944
million at 31 December 2017.
The capital ratios, determined on the basis of transitional methods in force, stood at:
- 14% for Common Equity Tier 1 ratio and Tier 1 Capital ratio;
- 15.5% for Total Capital ratio.

142
(in thousands of EUR) 30/06/2018 31/12/2017
Common Equity Tier 1 capital (CET1) 1,939,044 1,374,187
Tier 1 Capital 1,939,044 1,374,187
Total Own Funds 2,157,913 1,623,293
Credit risk and counterparty risk 989,681 927,007
Credit valuation adjustment risk 1,010 1,072
Settlement risks - -
Market risks 12,967 987
Operational risk 107,663 106,436
Other calculation elements - -
Total capital requirements 1,111,321 1,035,502
Risk-weighted assets 13,891,518 12,943,781
Common Equity Tier 1 capital / Risk-weighted assets (CET1 capital ratio) 13.96% 10.62%
Tier 1 capital / Risk-weighted assets (Tier 1 capital ratio) 13.96% 10.62%
Total own funds / Risk-weighted assets (Total capital ratio) 15.53% 12.54%
At 30 June 2018, the transitional regime for the introduction of IFRS 9 was applied. In the absence
of such an approach, the capital ratios would have amounted to 10.2% for Tier 1 Capital ratio
and 11.9% for Total Capital ratio, respectively.

143
Business combinations
Business combinations – acquisition of control of Claris Factor S.p.A.
Name Operation date (1) (2) (3) (4)
Acquisition of Claris Factor S.p.A. 29/06/2018 5,000 100% 6,608 290
Key (1) = Purchase cost of the equity investment (2) = Percentage interest acquired with voting right in the ordinary shareholders’ meeting. (3) = Total revenue (total income) achieved in 2017 (4) = Profit for 2017
On 29 June 2018, following the authorisation issued by the Bank of Italy, Credito Valtellinese
completed the acquisition of 100% of the share capital of Claris Factor S.p.A. (“Claris Factor”)
held by Veneto Banca S.p.A. in compulsory winding-up for a consideration of EUR 5 million. Claris
Factor, established in 1990 and registered in the Sole Register of Financial Intermediaries since
2015, is based in Montebelluna (Treviso). The company carries out factoring activities through a
direct channel. In 2017, Claris Factor developed a turnover of approximately EUR 890 million,
mainly concentrated in Lombardia, Veneto and Lazio.
The transaction is recorded based on the provisions of IFRS 3 - Business Combinations, by
applying the acquisition method, which involves identifying the acquirer and determining the date
of acquisition (29 June 2018), determining the cost of acquisition (or consideration transferred)
and allocating the cost of acquisition (known as Purchase Price Allocation - PPA).
Pursuant to IFRS 3, par. 37, the consideration transferred in a business combination must be
determined based on the fair value at the acquisition date of the assets transferred by the acquirer
to the previous shareholders of the acquiree, of the liabilities borne by the acquirer for these
subjects and of the interests issued by the acquirer. The consideration for the purchase of the
equity investment amounted to EUR 5 million.
With reference to the allocation of the cost of acquisition, IFRS 3 requires the purchaser to
allocate, at the date of acquisition, the cost of the business combination to assets, including
intangible assets, and to liabilities (including potential liabilities plus those that are not probable),
recognising them at fair value at that date. The residual difference between the cost of business
combination and the net fair value of the assets and liabilities must be recorded in the Statement
of Financial Position as goodwill if positive, while it must be recognised in the Income Statement
if negative (badwill).
This allocation process of the cost of acquisition must be completed within twelve months of the
acquisition date. Since the transaction was only completed at the end of June, the measurement
process had not yet been completed as at the date of this Report. The provisionally estimated
amounts could therefore be subject to corrections in the statement of financial position at 31
December 2018 on the basis of more and/or more precise information that will become available
in the coming months.

144
Preliminary allocation of the cost of the business combination in the Condensed interim
consolidated report
In the provisional process of allocation of the cost of acquisition carried out in the Condensed
interim consolidated report, no categories of intangibles relating to customer relationships were
identified and the net assets acquired were measured at fair value with recognition of changes in
value of non-performing loans (EUR -4.3 million) and provisions for risks and charges (EUR -2.9
million).
With reference to non-performing loans, the fair value was measured with reference to the prices
of transactions on the market. Performing loans are mainly receivables for factoring operations
with and without recourse with an average limited duration. The characteristics of the portfolio
and the duration suggest that the fair value of the positions is substantially in line with the carrying
amount.
Deferred taxes were recognised on adjustments made should the requirements exist. Specifically,
deferred tax assets of EUR 2.4 million were recognised.
Considering the equity of Claris Factor at the PPA date, equal to EUR 25.2 million, and the
provisional adjustments by PPA, equal to EUR -4.8 million, the estimate of the fair value of the
net assets acquired amounts to EUR 20.4 million. The comparison with the purchase price of EUR
5 million shows a badwill of EUR 15.4 million that was recognised in the consolidated income
statement at 30 June 2018, under item “230. Other operating income”, as a positive income
component.
Business combinations between parties under common control completed during the
financial year
On 18 June 2018, the deed of merger into Credito Valtellinese S.p.A. of Credito Siciliano S.p.A.
was signed. The effective share exchange ratio was set at 78.35 new shares of Credito
Valtellinese, without nominal value, for each share of Credito Siciliano, without nominal value as
well. Since the merging company held 98.5% of the share capital of Credito Siciliano, the Merger
took place in a simplified form pursuant to Article 2505-bis of the Italian Civil Code. In particular,
the shareholders of Credito Siciliano, other than Credito Valtellinese, were assigned the right to
sell their shares to Creval pursuant to Article 2505-bis of the Italian Civil Code at the price of EUR
19.68 per share.
The merger was legally effective as from 25 June 2018. The bank opted for accounting and tax
backdating of the effects of the merger. The costs and revenue of the merged bank were booked
to the financial statements of Credito Valtellinese as from 1 January 2018.
This transaction is a business combination between parties under common control; therefore, it
is excluded from the scope of application of IFRS 3 - Business Combinations. In the absence of
specific provisions under IFRS, IAS 8 provides that the company uses its own judgement when
applying an accounting standard for the purpose of providing relevant, reliable, prudent disclosure
which reflects the substance of the transaction. These types of business combination, achieved
as part of company reorganisations, are accounted for by preserving the same carrying amount
of the acquired in the financial statements of the acquirer. In particular, the acquired assets and
liabilities have been recorded at the carrying amount resulting from the consolidated financial
statements of Credito Valtellinese (the common Group). Therefore, there are no impacts on the
consolidated financial statements except those related to the acquisition of non-controlling
interests, transaction recorded as an offsetting item under equity.

145
Related party transactions
Related party transactions are mainly regulated:
- by Article 2391-bis of the Italian Civil Code, whereby the governing bodies of companies
resorting to the equity market adopt, according to general principles indicated by Consob,
rules that assure “the transparency and substantial and procedural correctness of related party
transactions” carried out directly or through subsidiaries;
- by the “Related Party Transaction Regulation” adopted by Consob with resolution no. 17221
of 12 March 2010, as amended, (hereinafter also the “Consob Regulation”);
- by the supervisory provisions issued by the Bank of Italy (Bank of Italy no. 263/06) on risk
assets and conflicts of interest with respect to “Associated Parties”, provisions that
complement what is provided by the Consob regulation;
- by the provisions of Article 136 of the Consolidated Banking Act.
In compliance with the combined provision of the above-mentioned regulations, the Board of
Directors approved the new “Procedures concerning Related Party Transactions and Associated
parties” (hereinafter also the “RPT Creval Procedures”). In accordance with current regulations,
the document is published on the website, http://www.gruppocreval.com – Corporate Governance
section – Corporate documents. The RPT Creval Procedures establish the procedures and rules
for ensuring transparency and substantive and procedural correctness in related-party
transactions and associated parties carried out directly by Credito Valtellinese or by means of its
subsidiaries. They also adopt the provisions on the assumption of risk assets towards associated
parties pursuant to the Associated Party Regulations of Bank of Italy.
The Board of Directors of the Parent also approved the “Policies regarding controls on risk
activities and on conflicts of interest towards associated parties” that describes, in relation to the
operational features and the strategies of the Bank and of the Group, the business segments and
the types of business relations, also other than those implying the assumption of risk assets, in
relation to which conflicts of interest may arise, as well as the safeguards inserted in the
organisational structures and in the internal control system to ensure constant compliance with
prudential limits and the above decision-making procedures. The document also summarises the
principles and rules applicable to transactions with associated parties that were used for the
preparation of the relevant Procedures.
The international financial reporting standards regulate the related party disclosure with IAS 24,
standard approved with Regulation (EU) no. 1126/2008 (amended by subsequent regulations).

146
Information on remuneration of key management personnel
Information on remuneration of key management personnel is indicated below.
FEES 1st half of 2018
a) short-term benefits (*) 3,444
b) post-employment benefits 154
c) other long-term benefits -
d) termination benefits -
e) share-based payments -
Total 3,598
(*) The indicated amount includes payments to directors and to the board of statutory auditors for a total
of EUR 1,571 thousand compared to EUR 1,940 thousand in the first half of 2017.
Information on related party transactions
On the basis of the instructions of IAS 24 applied to the organisational and governance structure
of the Bank and of the Credito Valtellinese Banking Group, the following natural persons and
corporate bodies are considered related parties:
- subsidiaries, companies over which the Parent directly or indirectly exercises control, as
defined by IFRS 10;
- associates, companies over which the Parent directly or indirectly exercises significant
influence, as defined by IAS 28 and their subsidiaries;
- companies subject to joint control, companies in which the Parent directly or indirectly
exercises joint control, as defined by IFRS 11;
- the Directors, the Statutory Auditors, the General Manager, the Deputy General Managers
as well as the Chief Operating Officer, Chief Lending Officer, Chief Risk Officer, Chief
Commercial Officer and Chief Financial Officer if they are not already part of the general
management.
- other related parties, which include:
• immediate family members - relatives until the second degree of kinship and the
spouse or common law spouses of one related party as well as their children - of
subjects as defined above;
• subsidiaries, companies subject to joint control or to significant influence by
subjects as defined above, as well as by their immediate family members;
• pension funds established by companies of the Group.
Related-party transactions, both intra-group and with parties not belonging to the Creval Group,
are regulated at market or standard conditions.
In particular, the economic effects of the transaction between the companies of the Group are
regulated on the basis of specific contractual agreements that, with the main objective of
optimising synergies and economies of scale and purpose at Group level, refer to long-term
objective and constant parameters, distinguished by material transparency and fairness. The
quantification of the expected fees for services was defined and formalised according to standard
parameters that consider actual utilisation by each user company.
The Board of Directors is exclusively responsible for the definition of intra-group contractual
agreements and approval and possible amendment of the related economic conditions.

147
Related party transactions with parties other than companies in the Credito Valtellinese Group
are part of normal banking activities and are generally regulated at arm's length for specific
transactions or aligned to the most favourable measure that may have been agreed for
employees.
In relation to the specific business, the provisions of Article 136 of the Consolidated Banking Act
on obligations of banking representatives also apply to the companies.
No atypical or unusual transactions that impacted significantly on the financial position or results
of operations of the company have taken place during the half-year.
Statement of financial position data at 30 June 2018 and income statement data of the first half
of 2018 with regard to related parties as defined above in accordance with IAS 24 as well as their
percentage impact on the corresponding financial statements data are provided below. The impact
of transactions completed with Group companies has not been included, as their line-by-line
consolidation requires the netting of intra-group balances and transactions.
(in thousands of EUR)
RELATED PARTY TRANSACTIONS
30/06/2018
ASSOCIATES
COMPANIES SUBJECT TO JOINT CONTROL
EXECUTIVES AND
CONTROL BODIES
OTHER RELATED PARTIES
% INCIDENCE
STATEMENT OF FINANCIAL POSITION ITEMS
40. Financial assets at amortised cost 47,396 - 2,070 54,334 0.5%
130. Other assets 28 - - 103 -
TOTAL ASSETS 47,424 - 2,070 54,437
10. Financial liabilities at amortised cost 5,655 44 4,439 25,555 0.2%
80. Other liabilities - - 13 19 -
100. Provisions for risks and charges - - 1,305 - 0.7%
TOTAL LIABILITIES 5,655 44 5,757 25,574
Guarantees given 820 - - 1,326 1.8%
Commitments to grant finance 6,827 - 936 17,596 0.5%
TOTAL GUARANTEES AND COMMITMENTS 7,647 - 936 18,922

148
(in thousands of EUR)
RELATED PARTY TRANSACTIONS
1st half of 2018
ASSOCIATES
COMPANIES SUBJECT TO JOINT CONTROL
EXECUTIVES AND
CONTROL BODIES
OTHER RELATED PARTIES
% INCIDENCE
INCOME STATEMENT ITEMS
Net interest income 220 - (7) 398 0.3%
Net fee and commission income 94 - 49 173 0.2%
Administrative expenses 48 - (4,372) (327) 1.5%
Other operating net income 46 - - (2) 0.1%
TOTAL INCOME STATEMENT 408 - (4,330) 242
At 31 December 2017, loans and receivables with customers (other related parties) include
positions classified as unlikely to pay for a carrying amount of EUR 41,245 thousand, while
guarantees given include positions classified as unlikely to pay of EUR 13,170 thousand.
Impairment losses recognised in the first half-year on these positions amounted to EUR 13,167
thousand. At 30 June 2018, these positions no longer represent exposures to related parties and
are therefore not shown in the tables above.
Most significant transactions
For the transactions of greatest importance, as defined in the Consob Regulation, the procedural
regulations and the reporting obligations specified by the RPT Procedures were applied.
During the first quarter of 2018, the framework resolutions for the subscription of intra-group
bond issues were approved but were not implemented during the half-year.
In the second quarter of 2018, the Quadrivio SME 2017 “multi-originator” securitisation of
performing loans carried out by Credito Valtellinese and Credito Siciliano (merged into Credito
Valtellinese in June) with the Special purpose entity Quadrivio SME 2014 S.r.l. was also closed.
Finally, on 25 June 2018, the merger into Credito Valtellinese S.p.A. of Credito Siciliano S.p.A.
became effective, as approved on 20 December by the Board of Directors of the Parent.

149
Segment Reporting
In compliance with IFRS 8, segment reporting is prepared on the basis of elements used by
management to make operational and strategic decisions.
The following operating segments were identified for the Credito Valtellinese Group:
- the Market segment: generates its revenue from the production and sale of lending
products and services, investment and transfer services for the Group’s customers;
- The Specialised Companies sector: generates its revenue from the distribution of
bancassurance and factoring products;
- the Corporate Centre segment: monitors the management and development of
Information and Communication Technology and manages the Group’s real estate assets.

150
The summary statements are provided below:
(in thousands of EUR) Market Specialised Companies Corporate Centre Other assets Total
30/06/2018 31/12/2017 % 30/06/2018 31/12/2017 % 30/06/2018 31/12/2017 % 30/06/2018 31/12/2017 % 30/06/2018 31/12/2017 %
STATEMENT OF FINANCIAL POSITION DATA
Loans and receivables with customers 21,260,056 16,668,986 27.5 171,461 8,851 n.s. 3,151 3,107 1.4 - - - 21,434,668 16,680,944 28.5
Loans and receivables with banks 588,981 2,033,413 -71.0 7,605 - n.s. - - - - - - 596,586 2,033,413 -70.7
Treasury securities and equity investments
2,150,412 4,314,527 -50.2 - - - - - - 144,010 149,360 -3.6 2,294,422 4,463,887 -48.6
Non-current assets held for sale and disposal groups 87,139 490 n.s. - - -
- - - 2,332 3,465
-32.7 89,741 3,955 n.s.
Due to banks 3,124,532 3,143,189 -0.6 41 - n.s. - - - - - - 3,124,573 3,143,189 -0.6
Direct funding 20,378,672 19,593,396 4.0 35,454 37,887 -6.4 - - - - - - 20,414,126 19,631,283 4.0
- Due to customers 18,321,931 16,803,714 9.0 35,454 37,887 -6.4 - - - - - - 18,357,385 16,841,601 9.0
- Securities issued 2,056,741 2,789,682 -26.3 - - - - - - - - - 2,056,741 2,789,682 -26.3
Indirect funding 10,437,811 11,273,213 -7.4 - - - - - - - - - 10,437,811 11,273,213 -7.4
ORGANISATIONAL DATA
Personnel 3,374 3,307 2.0 68 39 74.4 459 472 -2.8 1 1 - 3,902 3,819 2.2

151
(in thousands of EUR) Market Specialised Companies Corporate Centre Other assets Total
1st half of 2018
1st half of 2017
% 1st half of
2018 1st half of
2017 %
1st half of 2018
1st half of 2017
% 1st half of
2018 1st half of
2017 %
1st half of 2018
1st half of 2017
%
INCOME STATEMENT DATA
Net interest income 178,242 198,297 -10.1 15 - n.s. 151 12 n.s. 471 463 1.7 178,879 198,772 -10.0
Net fee and commission income 124,402 126,230 -1.4 15,020 16,086 -6.6 - - - - - - 139,422 142,316 -2.0
Dividends and similar income - - - - - - - - - 1,867 2,876 -35.1 1,867 2,876 -35.1
Net gains on equity-accounted investments - - - - - - - - - 1,299 158 n.s. 1,299 158 n.s.
Net trading and hedging income (expense) and profit (loss) on sales/repurchases 16,473 14,364 14.7 - - - - - - - 9,857 n.s. 16,473 24,221 -32.0
Other operating net income (112) 3,749 n.s. 5 4 25.0 3,146 6,947 -54.7 - - - 3,039 10,700 -71.6
Operating income 319,005 342,640 -6.9 15,040 16,090 -6.5 3,297 6,959 -52.6 3,637 13,354 -72.8 340,979 379,043 -10.0
Personnel expenses (178,632) (122,447) 45.9 (1,572) (1,486) 5.8 (13,195) (10,348) 27.5 (33) (34) -2.9 (193,432) (134,315) 44.0
Other administrative expenses (79,106) (83,239) -5.0 (385) (354) 8.8 (21,435) (24,084) -11.0 (31) (34) -8.8 (100,957) (107,711) -6.3
Depreciation/amortisation and net impairment losses on property, equipment and investment property and intangible assets (8,347) (9,014) -7.4 (4) (5) -20.0 (4,216) (4,835) -12.8 - - - (12,567) (13,854) -9.3
Operating costs (266,085) (214,700) 23.9 (1,961) (1,845) 6.3 (38,846) (39,267) -1.1 (64) (68) -5.9 (306,956) (255,880) 20.0
Operating profit 52,920 127,940 -58.6 13,079 14,245 -8.2 (35,549) (32,308) 10.0 3,573 13,286 -73.1 34,023 123,163 -72.4
Net impairment losses for credit risk and gains/losses from amendments to contracts 22,143 (325,408) n.s. 59 - n.s. - - - - (3,154) n.s. 22,202 (328,562) n.s.
Losses on sale/repurchase of financial assets at amortised cost (95,220) (13,411) n.s. - - - - - - - - - (95,220) (13,411) n.s.
Net accruals to provisions for risks and charges (4,575) (40,482) -88.7 - - - - (11) n.s. - - - (4,575) (40,493) -88.7
Net gains/losses on sales of investments and property, equipment and investment property measured at fair value
24 66,657 n.s. - - - (43) 2,123 n.s. - - - (19) 68,780 n.s.
Badwill - - 15,357 - n.s. - - - - - 15,357 - n.s.
Pre-tax profit (loss) from continuing operations (24,708) (184,704) -86.6 28,495 14,245 100 (35,592) (30,196) 17.9 3,573 10,132 -64.7 (28,232) (190,523) -85.2

152
Market sector
The Market sector is the core business of the Group, as it includes all the lending, investment
and transfer products and services.
In the first half of 2018, the market segment generated operating income of EUR 319 million.
The segment accounts for 93.6% of the operating income of the Group. Operating costs stood
at EUR 266.1 million whereas pre-tax loss from continuing operations amounted to EUR -24.7
million.
The direct funding of the market segment amounted to EUR 20,379 million. Indirect funding
reached EUR 10,438 million. Loans and receivables with customers increased (+27.5 %) to
EUR 21,260 million. At the end of the half-year, the market segment had 363 branches. There
were 3,374 human resources employed in the segment, equal to 86.5% of the total employees
of the Group.
Specialised Companies sector
The sector includes the distribution of bancassurance and factoring products.
During the first half of 2018, the Specialised Companies sector generated operating income of
EUR 15.0 million, accounting for 4.4% of Group operating income, and recorded pre-tax profit
from continuing operations of EUR 28.5 million.
At the end of June 2018, the resources for this sector totalled 68, i.e. about 1.7% of the
Group's total workforce.
Corporate Centre sector
The sector only includes operations of the Group's special purpose entities (Creval Sistemi e
Servizi and Stelline Real Estate).
Operating costs of the Corporate Centre sector amounted to EUR 38.8 million. The loss of the segment was EUR -35.6 million.
The employees of the Corporate Centre sector amounted to 459, equal to about 11.8% of the
Group’s workforce.

153
CERTIFICATION OF THE CONDENSED INTERIM CONSOLIDATED
FINANCIAL STATEMENTS PURSUANT TO ARTICLE 81-TER OF
CONSOB REGULATION NO. 11971/99
1. The undersigned, Mauro Selvetti, as Managing Director, and Simona Orietti, as theManager in charge of financial reporting of Credito Valtellinese S.p.A., also considering theprovisions of article 154-bis, paragraphs 3 and 4, of Legislative Decree no. 58 of 24February 1998, hereby certify:
• the adequacy, in relation to the business characteristics and• the effective application of administrative and accounting procedures for preparing the
condensed interim consolidated report during the period 1 January 18- 30 June 2018.
2. The assessment of the adequacy and the actual application of the administrative andaccounting procedures for preparing the condensed interim consolidated report during theperiod between 1 January 2018 – 30 June 2018, is based on a model conceived by CreditoValtellinese S.p.a., in line with the “Internal Control - Integrated Framework (CoSO)” andwith the “Control Objective for IT and Related Technologies (Cobit)”, which representreference standards for the internal control system and for financial reporting in particular,generally accepted at international level.
3. We also certify that:
3.1 the condensed interim consolidated report: a) was prepared in compliance with applicable IFRS endorsed in the European Community
pursuant to (EC) Regulation no. 1606/2002 of the European Parliament and Council,dated 19 July 2002;
b) is consistent with accounting books and records;c) provides a true and fair view of the financial position and performance of the issuer
and the group of companies included in the scope of consolidation
3.2 the interim report on operations includes a reliable analysis of the references to the important events that occurred in the first six months of the year and to the effect they had on the condensed interim consolidated report, together with a description of the main risks and uncertainties for the remaining six months of the year. The interim report on operations also includes a reliable analysis of the information on significant transactions with related parties.
Sondrio, 9 August 2018
The Managing Director
Mauro Selvetti
Manager in charge of financial reporting
Simona Orietti