Condensed consolidated interim financial information for ... · PDF fileCondensed consolidated...
35
1 Condensed consolidated interim financial information for the three-month period ended 31 March 2012
-
Upload
nguyenxuyen -
Category
Documents
-
view
216 -
download
2
Transcript of Condensed consolidated interim financial information for ... · PDF fileCondensed consolidated...
1
Condensed consolidated interim financial information
for the three-month period
ended 31 March 2012
2
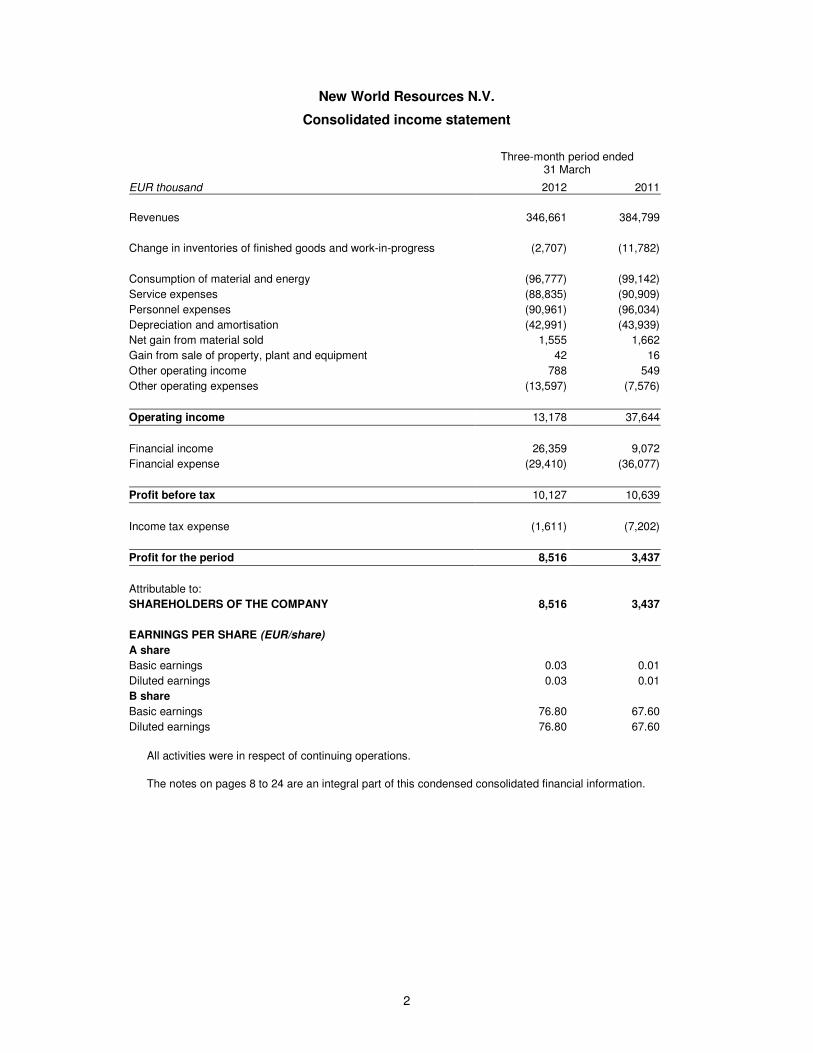
New World Resources N.V.
Consolidated income statement
Three-month period ended 31 March
EUR thousand 2012 2011
Revenues 346,661 384,799
Change in inventories of finished goods and work-in-progress (2,707) (11,782)
Consumption of material and energy (96,777) (99,142)
Service expenses (88,835) (90,909)
Personnel expenses (90,961) (96,034)
Depreciation and amortisation (42,991) (43,939)
Net gain from material sold 1,555 1,662
Gain from sale of property, plant and equipment 42 16
Other operating income 788 549
Other operating expenses (13,597) (7,576)
Operating income 13,178 37,644
Financial income 26,359 9,072
Financial expense (29,410) (36,077)
Profit before tax 10,127 10,639
Income tax expense (1,611) (7,202)
Profit for the period 8,516 3,437
Attributable to:
SHAREHOLDERS OF THE COMPANY 8,516 3,437
EARNINGS PER SHARE (EUR/share)
A share
Basic earnings 0.03 0.01
Diluted earnings 0.03 0.01
B share
Basic earnings 76.80 67.60
Diluted earnings 76.80 67.60
All activities were in respect of continuing operations.
The notes on pages 8 to 24 are an integral part of this condensed consolidated financial information.
3
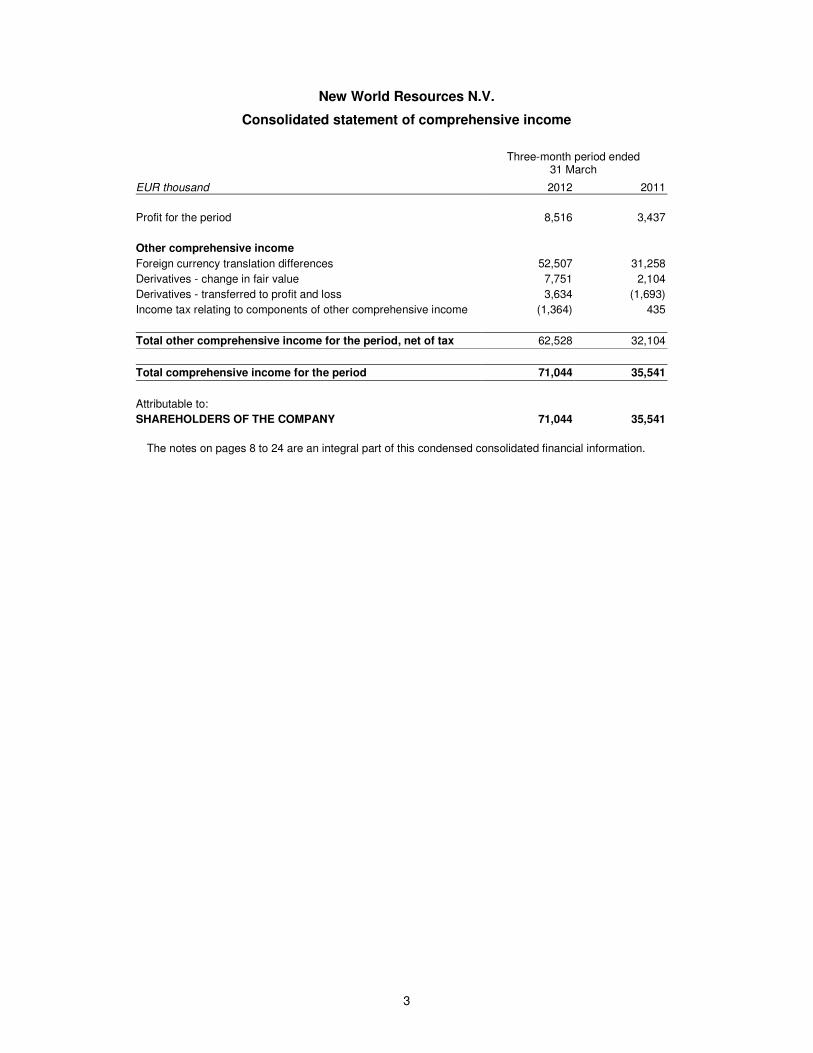
New World Resources N.V.
Consolidated statement of comprehensive income
Three-month period ended 31 March
EUR thousand 2012 2011
Profit for the period 8,516 3,437
Other comprehensive income
Foreign currency translation differences 52,507 31,258
Derivatives - change in fair value 7,751 2,104
Derivatives - transferred to profit and loss 3,634 (1,693)
Income tax relating to components of other comprehensive income (1,364) 435
Total other comprehensive income for the period, net of tax 62,528 32,104
Total comprehensive income for the period 71,044 35,541
Attributable to:
SHAREHOLDERS OF THE COMPANY 71,044 35,541
The notes on pages 8 to 24 are an integral part of this condensed consolidated financial information.
4
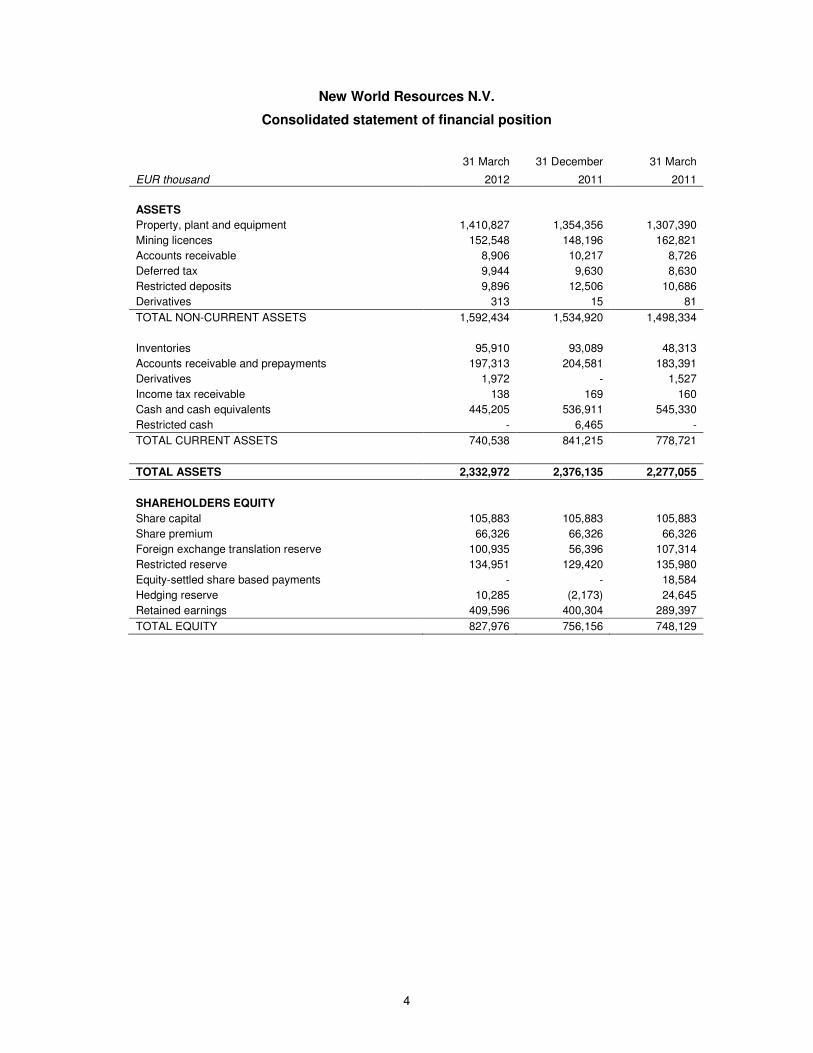
New World Resources N.V.
Consolidated statement of financial position
31 March 31 December 31 March
EUR thousand 2012 2011 2011
ASSETS
Property, plant and equipment 1,410,827 1,354,356 1,307,390
Mining licences 152,548 148,196 162,821
Accounts receivable 8,906 10,217 8,726
Deferred tax 9,944 9,630 8,630
Restricted deposits 9,896 12,506 10,686
Derivatives 313 15 81
TOTAL NON-CURRENT ASSETS 1,592,434 1,534,920 1,498,334
Inventories 95,910 93,089 48,313
Accounts receivable and prepayments 197,313 204,581 183,391
Derivatives 1,972 - 1,527
Income tax receivable 138 169 160
Cash and cash equivalents 445,205 536,911 545,330
Restricted cash - 6,465 -
TOTAL CURRENT ASSETS 740,538 841,215 778,721
TOTAL ASSETS 2,332,972 2,376,135 2,277,055
SHAREHOLDERS EQUITY
Share capital 105,883 105,883 105,883
Share premium 66,326 66,326 66,326
Foreign exchange translation reserve 100,935 56,396 107,314
Restricted reserve 134,951 129,420 135,980
Equity-settled share based payments - - 18,584
Hedging reserve 10,285 (2,173) 24,645
Retained earnings 409,596 400,304 289,397
TOTAL EQUITY 827,976 756,156 748,129
5
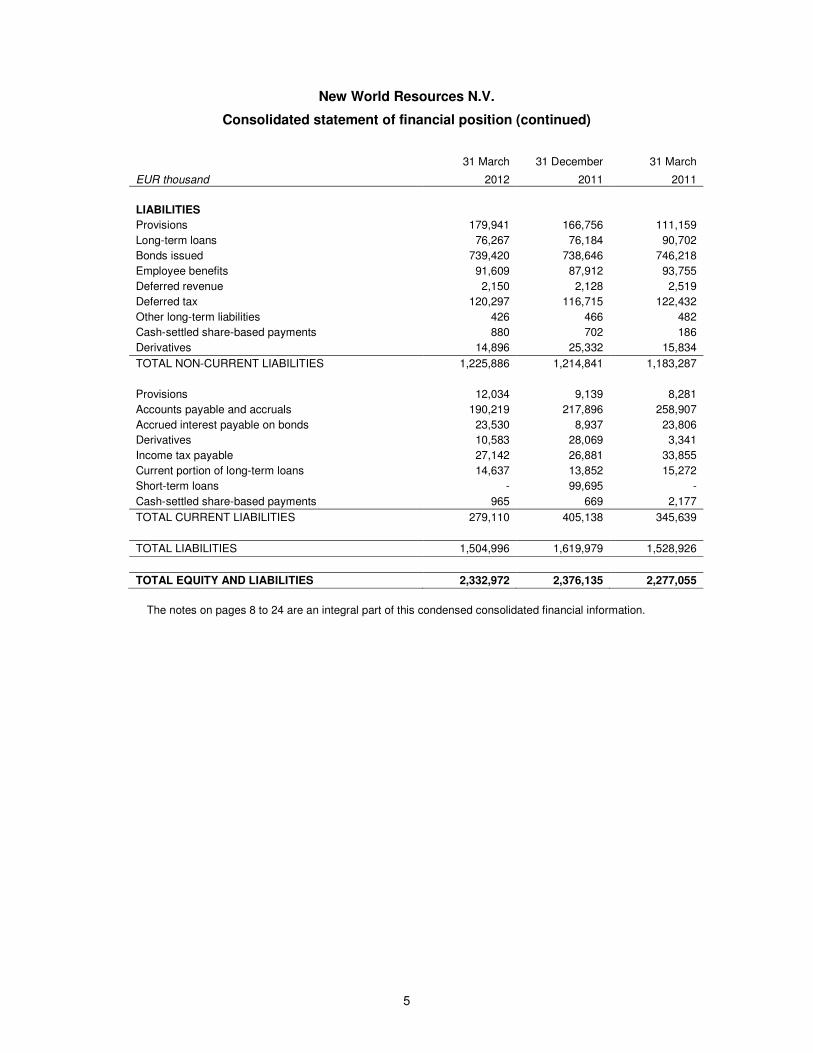
New World Resources N.V.
Consolidated statement of financial position (continued)
31 March 31 December 31 March
EUR thousand 2012 2011 2011
LIABILITIES
Provisions 179,941 166,756 111,159
Long-term loans 76,267 76,184 90,702
Bonds issued 739,420 738,646 746,218
Employee benefits 91,609 87,912 93,755
Deferred revenue 2,150 2,128 2,519
Deferred tax 120,297 116,715 122,432
Other long-term liabilities 426 466 482
Cash-settled share-based payments 880 702 186
Derivatives 14,896 25,332 15,834
TOTAL NON-CURRENT LIABILITIES 1,225,886 1,214,841 1,183,287
Provisions 12,034 9,139 8,281
Accounts payable and accruals 190,219 217,896 258,907
Accrued interest payable on bonds 23,530 8,937 23,806
Derivatives 10,583 28,069 3,341
Income tax payable 27,142 26,881 33,855
Current portion of long-term loans 14,637 13,852 15,272
Short-term loans - 99,695 -
Cash-settled share-based payments 965 669 2,177
TOTAL CURRENT LIABILITIES 279,110 405,138 345,639
TOTAL LIABILITIES 1,504,996 1,619,979 1,528,926
TOTAL EQUITY AND LIABILITIES 2,332,972 2,376,135 2,277,055
The notes on pages 8 to 24 are an integral part of this condensed consolidated financial information.

6
New World Resources N.V.
Consolidated statement of cash flows
Three-month period ended
31 March
EUR thousand 2012 2011
Cash flows from operating activities Profit before tax 10,127 10,639
Adjustments for:
Depreciation and amortisation 42,991 43,939
Changes in provisions 7,486 727
(Profit) / loss on disposal of property, plant and equipment (42) (16)
Interest expense, net 18,020 15,732
Change in fair value of derivatives (18,821) (5,110)
Equity-settled share-based payment transactions 776 1,427
Operating cash flows before working capital changes 60,537 67,338
(Increase) / Decrease in inventories (2,822) 7,700
(Increase) / Decrease in receivables 8,366 40,920
(Decrease) / Increase in payables and deferred revenue 8,481 3,928
(Increase) / decrease in restricted cash and restricted deposits 9,481 134
Currency translation and other non-cash movements (3,618) 1,931
Cash generated from operating activities 80,425 121,951
Interest paid (2,644) (1,495)
Corporate income tax paid (5,082) (1,496)
Net cash flows from operating activities 72,699 118,960
Cash flows from investing activities
Interest received 2,938 2,488
Purchase of land, property, plant and equipment (68,640) (65,865)
Proceeds from sale of property, plant and equipment 534 5
Net cash flows from investing activities (65,168) (63,372)
Cash flows from financing activities
Repayments of short-term borrowings (100,054) -
Dividends paid to B shareholders - (40,000)
Net cash flows from financing activities (100,054) (40,000)
Net effect of currency translation 817 501
Net increase/(decrease) in cash and cash equivalents (91,706) 16,089
Cash and Cash Equivalents at the beginning of period 536,911 529,241
Cash and Cash Equivalents at the end of period 445,205 545,330
The notes on pages 8 to 24 are an integral part of this condensed consolidated financial information.
7
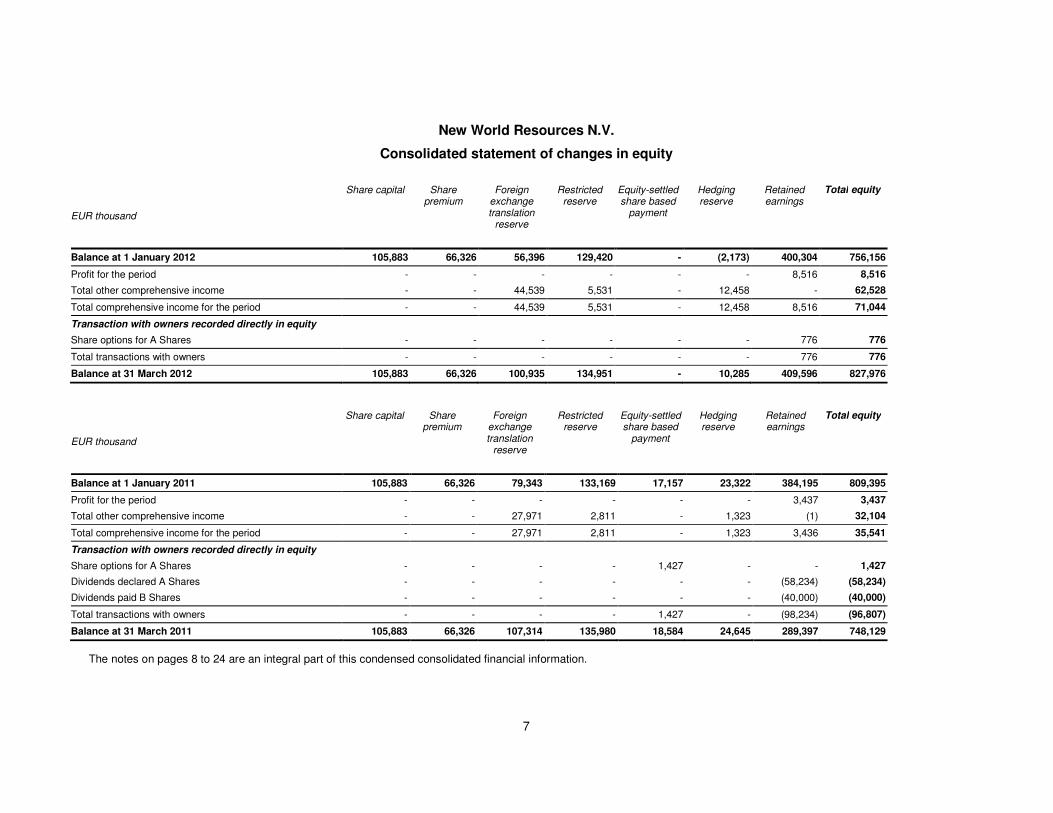
New World Resources N.V.
Consolidated statement of changes in equity
EUR thousand
Share capital Share premium
Foreign exchange translation
reserve
Restricted reserve
Equity-settled share based
payment
Hedging reserve
Retained earnings
Total equity
Balance at 1 January 2012 105,883 66,326 56,396 129,420 - (2,173) 400,304 756,156
Profit for the period - - - - - - 8,516 8,516
Total other comprehensive income - - 44,539 5,531 - 12,458 - 62,528
Total comprehensive income for the period - - 44,539 5,531 - 12,458 8,516 71,044
Transaction with owners recorded directly in equity
Share options for A Shares - - - - - - 776 776
Total transactions with owners - - - - - - 776 776
Balance at 31 March 2012 105,883 66,326 100,935 134,951 - 10,285 409,596 827,976
EUR thousand
Share capital Share premium
Foreign exchange translation
reserve
Restricted reserve
Equity-settled share based
payment
Hedging reserve
Retained earnings
Total equity
Balance at 1 January 2011 105,883 66,326 79,343 133,169 17,157 23,322 384,195 809,395
Profit for the period - - - - - - 3,437 3,437
Total other comprehensive income - - 27,971 2,811 - 1,323 (1) 32,104
Total comprehensive income for the period - - 27,971 2,811 - 1,323 3,436 35,541
Transaction with owners recorded directly in equity
Share options for A Shares - - - - 1,427 - - 1,427
Dividends declared A Shares - - - - - - (58,234) (58,234)
Dividends paid B Shares - - - - - - (40,000) (40,000)
Total transactions with owners - - - - 1,427 - (98,234) (96,807)
Balance at 31 March 2011 105,883 66,326 107,314 135,980 18,584 24,645 289,397 748,129
The notes on pages 8 to 24 are an integral part of this condensed consolidated financial information.
8
New World Resources N.V. Operating and Financial Review
for the three-month period ended 31 March 2012 (‘3M 2012’)
Corporate Information
New World Resources N.V. (‘NWR NV’ or the ‘Company’) is a public limited liability company with its registered office at Jachthavenweg 109h, 1081 KM Amsterdam, the Netherlands. The Company is the sole producer of hard coal in the Czech Republic and one of the leading hard coal and coke producers in Central Europe. NWR NV produces coking and thermal coal through its subsidiary OKD, a.s. (‘OKD’) and coke through its subsidiary OKK Koksovny, a.s. (‘OKK’). NWR NV and its subsidiaries are collectively referred to as ‘the Group’.
The Group operates four mines and four coking batteries in the Czech Republic and currently has two development projects in Poland. The Group serves several large Central and Eastern European steel and energy producers, among others in the Czech Republic, Poland, Austria, Slovakia, Hungary and Germany. Among its key customers are Arcelor Mittal Steel, U.S. Steel, Dalkia, Moravia Steel, voestalpine, Verbund and EZ.
The Group's largest source of revenue is the sale of coking coal, which accounted for 53% of total revenues in 3M 2012, followed by the sale of thermal coal (22%) and the sale of coke (14%).
The majority of coal sales are based on long-term framework agreements. Thermal coal sales are priced on an annual calendar year basis. All of the Group’s coking coal and coke sales are priced quarterly.
Financial Results Overview
Revenues. The Group’s revenues decreased by 10% (9% on a constant currency basis), from EUR 384,799 thousand in 3M 2011 to EUR 346,661 thousand in 3M 2012. This is mainly attributable to decreased revenues from thermal coal, driven by lower sales volumes, partly offset by higher prices as well as to decreased revenues from coke, driven by both lower sales volumes and prices.
Operating expenses. Total operating expenses including depreciation and amortisation, net of other operating income and gain/loss from sale of material and property, plant and equipment, decreased from EUR 335,373 thousand to EUR 330,776 thousand or by 1% (increased by 1% on a constant currency basis) in 3M 2012 compared to the same period in 2011.
EBITDA. EBITDA decreased by 31% from EUR 81,567 thousand in 3M 2011 to EUR 56,127 thousand in 3M 2012. The decrease in revenues of EUR 38,138 thousand was only partly offset by a decrease in total operating expenses, before depreciation and amortisation, gain from sale of PPE and net of changes in inventories, of EUR 12,698 thousand.
Basis of Presentation
General information The condensed consolidated interim financial information (‘financial information’) presented in this document is prepared for the three-month period ended 31 March 2012, with the three-month period ended 31 March 2011 as the comparative period.
9
The financial information includes New World Resources N.V. and its subsidiaries. The Company’s significant subsidiaries as of 31 March 2012 are:
Entity % Equity Nature of Activity
New World Resources N.V. Management services OKD, a.s. 100.0 %* Coal mining (Czech Republic)
OKD, HBZS, a.s. 100.0 %* Emergency services, waste processing OKK Koksovny, a.s. 100.0 %* Coke production NWR KARBONIA S.A. 100.0 %* Coal mining (Poland) – in development NWR Communications, s.r.o. 100.0 %* PR and communication
* representing 100% ownership by New World Resources N.V.
The objective of the Company is to provide management services to the Group.
See note ‘Changes in the consolidated group’ on page 10 for information on the comparable period.
All of the Company’s consolidated subsidiaries are incorporated in the Czech Republic, with the exception of NWR KARBONIA S.A. (‘NWR Karbonia’), which is incorporated in Poland.
Statement of compliance The presented financial information is prepared based on IFRS recognition and measurement criteria as adopted by European Union (‘adopted IFRS’).
These condensed consolidated interim financial statements have been prepared in accordance with IAS 34 Interim Financial Reporting. They do not include all of the information required for full annual financial statements and should be read in conjunction with the consolidated financial statements of the Company as at and for the year ended 31 December 2011.
Accounting policies The financial information has been prepared on the basis of accounting policies and methods of compilation consistent with those applied in the 31 December 2011 annual consolidated financial statements, which are contained within the 2011 Annual Report and Accounts of the Company, which are available on the Group’s website at www.newworldresources.eu.
There is one new standard (Amendment to IFRS 7 Financial Instruments: Disclosure) relevant for the Group which is effective from 1 January 2012. This amendment affects disclosure and presentation only and as such is not relevant for quarterly financial statements and has no impact on the Group’s financial position or performance.
Basis of preparation
The financial information is prepared on the historical cost basis, except for derivative and certain other financial instruments, which are stated at their fair value. It is presented in Euros (EUR) and is rounded to the nearest thousand. Financial information of operations with functional currency other than EUR was translated to the Group presentation currency (EUR).
EUR is the functional currency of the Company, Polish Zloty (PLN) is the functional currency of NWR Karbonia and Czech Koruna (CZK) is the functional currency of all the remaining consolidated companies in the Group.
The preparation of financial statements requires management to make judgements, estimates and assumptions that affect the application of accounting policies and the reported amounts of assets and liabilities, income and expense. Actual results may differ from these estimates. In preparing these condensed consolidated interim financial statements, the significant judgements made by the management in
10
applying the Group’s accounting policies and the key sources of estimation uncertainty were the same as those applied to the consolidated financial statements of the Company for the year ended 31 December 2011.
Changes in the consolidated group
The changes listed below include all changes in the consolidated group for the period from 1 January 2011 to 31 March 2012.
New subsidiary A new 100% subsidiary NWR Communications, s.r.o. was established on 6 June 2011 to perform public relations and corporate communication activities.
Reincorporation
On 30 March 2011, New World Resources Plc (‘NWR Plc’) was incorporated as part of a corporate reorganisation under which it became the new UK incorporated holding company for the business previously held by NWR NV.
The reorganisation was undertaken by way of an offer by NWR Plc to the shareholders of NWR NV to exchange shares in NWR Plc for their shares in NWR NV on a one-for-one basis. The condition of the offer relating to acceptances was met on 5 May 2011 (’the first closing date’) and NWR Plc became the new holding company when it issued shares to accepting shareholders of NWR NV on 6 May 2011. At that date NWR Plc held approximately 97.0% of the A shares of NWR NV and 100% of its B shares. The A shares of NWR NV that were not tendered into the offer at that date represented a non-controlling interest in NWR NV from NWR Plc point of view, that was decreased by additional closings and private share-for-share exchange to 0.2% as at 31 December 2011. NWR Plc is currently in the process of a compulsory squeeze-out under which it intends to acquire the remaining shares in NWR NV.
As a result of reincorporation, the Company was delisted from London and Prague stock exchange and plan to be delisted from Warsaw stock exchange once squeeze-out procedure is finished.
The reincorporation did not lead to a change in control and did not result in any changes to the day-to-day operations of the Group.
Non-IFRS Measures
The Company defines EBITDA as net profit before income tax, net financial costs, depreciation and amortisation, impairment of property, plant and equipment (‘PPE’) and gains/losses from sale of PPE. While the amounts included in EBITDA are derived from the Group's financial information, it is not a financial measure determined in accordance with adopted IFRS. Accordingly, EBITDA should not be considered as an alternative to net income or operating income as a sole indication of the Group's performance or as an alternative to cash flows as a measure of the Group's liquidity. The Company currently uses EBITDA in its business operations to, among other things, evaluate the performance of its operations, develop budgets, and measure its performance against those budgets. The Company considers EBITDA a useful tool to assist in evaluating performance because it excludes interest, taxes and any non-cash charges.
The Company defines net debt as total debt less cash and cash equivalents. Total debt includes issued bonds, long-term and short-term interest-bearing loans and borrowings. Total debt is defined as gross amount of debt less related expenses. Interest-bearing loans, bond issues, and borrowings are measured at amortised cost.
11
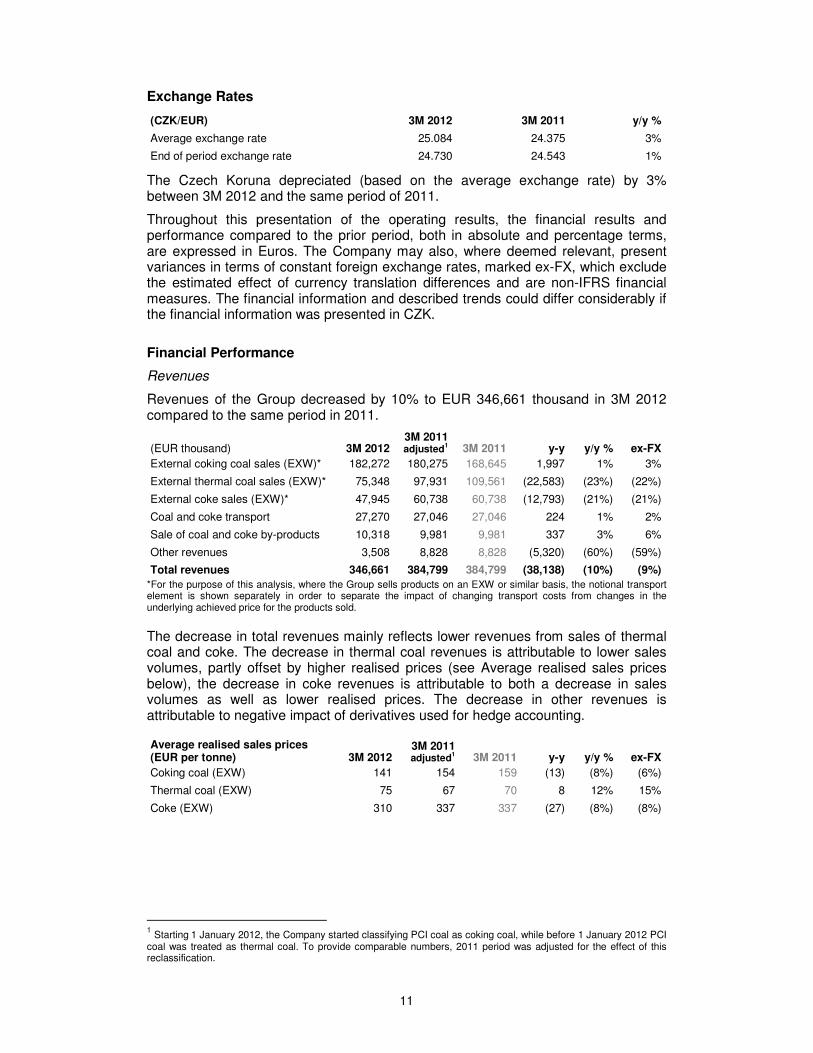
Exchange Rates
(CZK/EUR) 3M 2012 3M 2011 y/y %
Average exchange rate 25.084 24.375 3%
End of period exchange rate 24.730 24.543 1%
The Czech Koruna depreciated (based on the average exchange rate) by 3% between 3M 2012 and the same period of 2011.
Throughout this presentation of the operating results, the financial results and performance compared to the prior period, both in absolute and percentage terms, are expressed in Euros. The Company may also, where deemed relevant, present variances in terms of constant foreign exchange rates, marked ex-FX, which exclude the estimated effect of currency translation differences and are non-IFRS financial measures. The financial information and described trends could differ considerably if the financial information was presented in CZK.
Financial Performance
Revenues
Revenues of the Group decreased by 10% to EUR 346,661 thousand in 3M 2012 compared to the same period in 2011.
(EUR thousand) 3M 2012 3M 2011 adjusted1 3M 2011 y-y y/y % ex-FX
External coking coal sales (EXW)* 182,272 180,275 168,645 1,997 1% 3%
External thermal coal sales (EXW)* 75,348 97,931 109,561 (22,583) (23%) (22%)
External coke sales (EXW)* 47,945 60,738 60,738 (12,793) (21%) (21%)
Coal and coke transport 27,270 27,046 27,046 224 1% 2%
Sale of coal and coke by-products 10,318 9,981 9,981 337 3% 6%
Other revenues 3,508 8,828 8,828 (5,320) (60%) (59%)
Total revenues 346,661 384,799 384,799 (38,138) (10%) (9%) *For the purpose of this analysis, where the Group sells products on an EXW or similar basis, the notional transport element is shown separately in order to separate the impact of changing transport costs from changes in the underlying achieved price for the products sold.
The decrease in total revenues mainly reflects lower revenues from sales of thermal coal and coke. The decrease in thermal coal revenues is attributable to lower sales volumes, partly offset by higher realised prices (see Average realised sales prices below), the decrease in coke revenues is attributable to both a decrease in sales volumes as well as lower realised prices. The decrease in other revenues is attributable to negative impact of derivatives used for hedge accounting.
Average realised sales prices (EUR per tonne) 3M 2012
3M 2011 adjusted1 3M 2011 y-y y/y % ex-FX
Coking coal (EXW) 141 154 159 (13) (8%) (6%)
Thermal coal (EXW) 75 67 70 8 12% 15%
Coke (EXW) 310 337 337 (27) (8%) (8%)
1 Starting 1 January 2012, the Company started classifying PCI coal as coking coal, while before 1 January 2012 PCI coal was treated as thermal coal. To provide comparable numbers, 2011 period was adjusted for the effect of this reclassification.
12
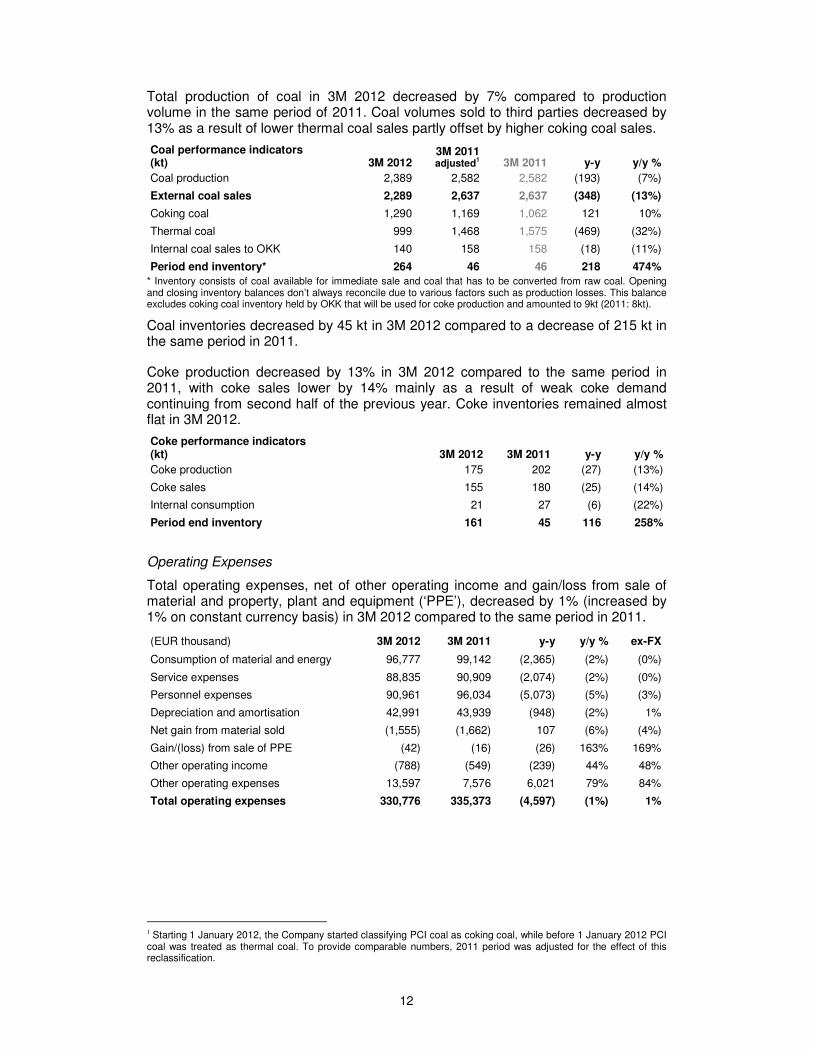
Total production of coal in 3M 2012 decreased by 7% compared to production volume in the same period of 2011. Coal volumes sold to third parties decreased by 13% as a result of lower thermal coal sales partly offset by higher coking coal sales.
Coal performance indicators (kt) 3M 2012
3M 2011 adjusted1 3M 2011 y-y y/y %
Coal production 2,389 2,582 2,582 (193) (7%)
External coal sales 2,289 2,637 2,637 (348) (13%)
Coking coal 1,290 1,169 1,062 121 10%
Thermal coal 999 1,468 1,575 (469) (32%)
Internal coal sales to OKK 140 158 158 (18) (11%)
Period end inventory* 264 46 46 218 474% * Inventory consists of coal available for immediate sale and coal that has to be converted from raw coal. Opening and closing inventory balances don’t always reconcile due to various factors such as production losses. This balance excludes coking coal inventory held by OKK that will be used for coke production and amounted to 9kt (2011: 8kt).
Coal inventories decreased by 45 kt in 3M 2012 compared to a decrease of 215 kt in the same period in 2011.
Coke production decreased by 13% in 3M 2012 compared to the same period in 2011, with coke sales lower by 14% mainly as a result of weak coke demand continuing from second half of the previous year. Coke inventories remained almost flat in 3M 2012.
Coke performance indicators (kt) 3M 2012 3M 2011 y-y y/y %
Coke production 175 202 (27) (13%)
Coke sales 155 180 (25) (14%)
Internal consumption 21 27 (6) (22%)
Period end inventory 161 45 116 258%
Operating Expenses
Total operating expenses, net of other operating income and gain/loss from sale of material and property, plant and equipment (‘PPE’), decreased by 1% (increased by 1% on constant currency basis) in 3M 2012 compared to the same period in 2011.
(EUR thousand) 3M 2012 3M 2011 y-y y/y % ex-FX
Consumption of material and energy 96,777 99,142 (2,365) (2%) (0%)
Service expenses 88,835 90,909 (2,074) (2%) (0%)
Personnel expenses 90,961 96,034 (5,073) (5%) (3%)
Depreciation and amortisation 42,991 43,939 (948) (2%) 1%
Net gain from material sold (1,555) (1,662) 107 (6%) (4%)
Gain/(loss) from sale of PPE (42) (16) (26) 163% 169%
Other operating income (788) (549) (239) 44% 48%
Other operating expenses 13,597 7,576 6,021 79% 84%
Total operating expenses 330,776 335,373 (4,597) (1%) 1%
1 Starting 1 January 2012, the Company started classifying PCI coal as coking coal, while before 1 January 2012 PCI
coal was treated as thermal coal. To provide comparable numbers, 2011 period was adjusted for the effect of this reclassification.
13
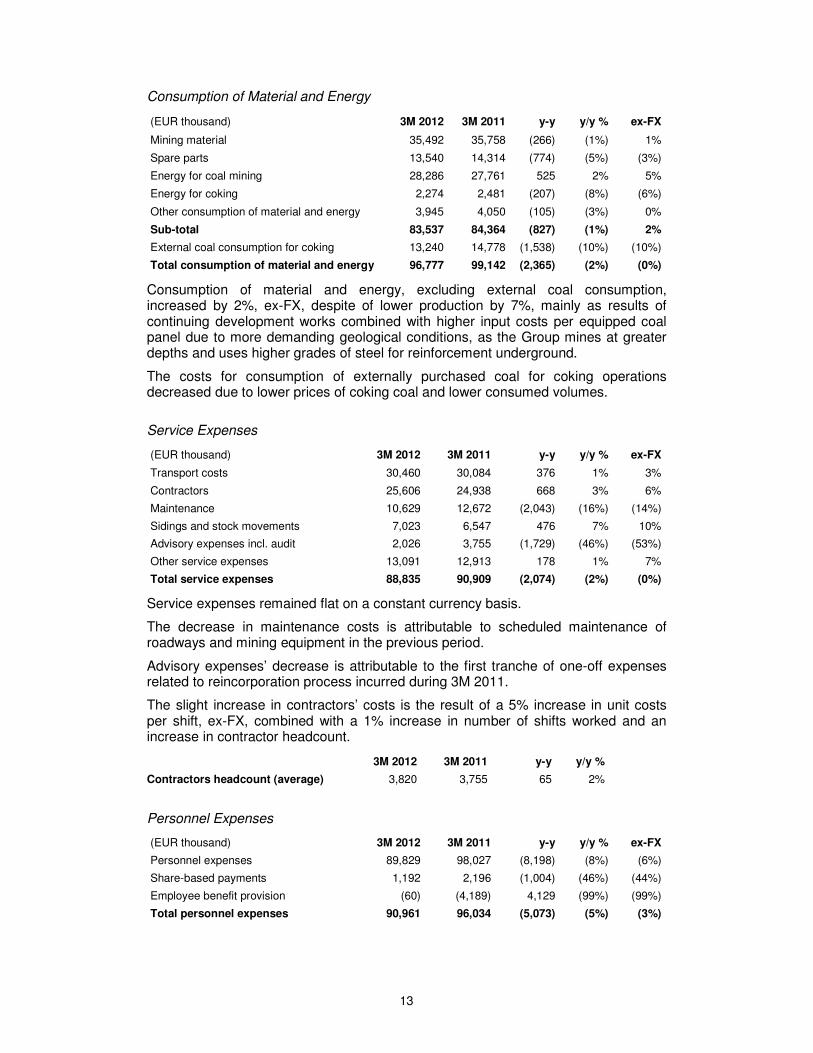
Consumption of Material and Energy
(EUR thousand) 3M 2012 3M 2011 y-y y/y % ex-FX
Mining material 35,492 35,758 (266) (1%) 1%
Spare parts 13,540 14,314 (774) (5%) (3%)
Energy for coal mining 28,286 27,761 525 2% 5%
Energy for coking 2,274 2,481 (207) (8%) (6%)
Other consumption of material and energy 3,945 4,050 (105) (3%) 0%
Sub-total 83,537 84,364 (827) (1%) 2%
External coal consumption for coking 13,240 14,778 (1,538) (10%) (10%)
Total consumption of material and energy 96,777 99,142 (2,365) (2%) (0%)
Consumption of material and energy, excluding external coal consumption, increased by 2%, ex-FX, despite of lower production by 7%, mainly as results of continuing development works combined with higher input costs per equipped coal panel due to more demanding geological conditions, as the Group mines at greater depths and uses higher grades of steel for reinforcement underground.
The costs for consumption of externally purchased coal for coking operations decreased due to lower prices of coking coal and lower consumed volumes.
Service Expenses
(EUR thousand) 3M 2012 3M 2011 y-y y/y % ex-FX
Transport costs 30,460 30,084 376 1% 3%
Contractors 25,606 24,938 668 3% 6%
Maintenance 10,629 12,672 (2,043) (16%) (14%)
Sidings and stock movements 7,023 6,547 476 7% 10%
Advisory expenses incl. audit 2,026 3,755 (1,729) (46%) (53%)
Other service expenses 13,091 12,913 178 1% 7%
Total service expenses 88,835 90,909 (2,074) (2%) (0%)
Service expenses remained flat on a constant currency basis.
The decrease in maintenance costs is attributable to scheduled maintenance of roadways and mining equipment in the previous period.
Advisory expenses’ decrease is attributable to the first tranche of one-off expenses related to reincorporation process incurred during 3M 2011.
The slight increase in contractors’ costs is the result of a 5% increase in unit costs per shift, ex-FX, combined with a 1% increase in number of shifts worked and an increase in contractor headcount.
Personnel Expenses
(EUR thousand) 3M 2012 3M 2011 y-y y/y % ex-FX
Personnel expenses 89,829 98,027 (8,198) (8%) (6%)
Share-based payments 1,192 2,196 (1,004) (46%) (44%)
Employee benefit provision (60) (4,189) 4,129 (99%) (99%)
Total personnel expenses 90,961 96,034 (5,073) (5%) (3%)
3M 2012 3M 2011 y-y y/y %
Contractors headcount (average) 3,820 3,755 65 2%
14
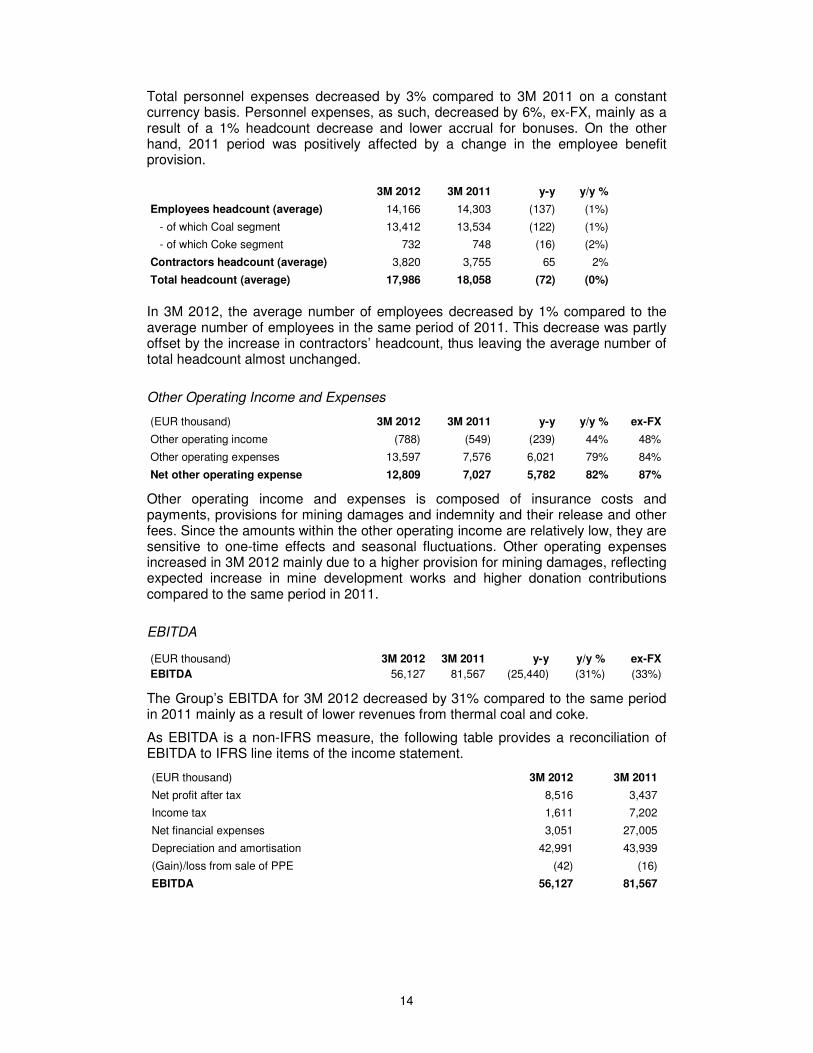
Total personnel expenses decreased by 3% compared to 3M 2011 on a constant currency basis. Personnel expenses, as such, decreased by 6%, ex-FX, mainly as a result of a 1% headcount decrease and lower accrual for bonuses. On the other hand, 2011 period was positively affected by a change in the employee benefit provision.
3M 2012 3M 2011 y-y y/y %
Employees headcount (average) 14,166 14,303 (137) (1%)
- of which Coal segment 13,412 13,534 (122) (1%)
- of which Coke segment 732 748 (16) (2%)
Contractors headcount (average) 3,820 3,755 65 2%
Total headcount (average) 17,986 18,058 (72) (0%)
In 3M 2012, the average number of employees decreased by 1% compared to the average number of employees in the same period of 2011. This decrease was partly offset by the increase in contractors’ headcount, thus leaving the average number of total headcount almost unchanged.
Other Operating Income and Expenses
(EUR thousand) 3M 2012 3M 2011 y-y y/y % ex-FX
Other operating income (788) (549) (239) 44% 48%
Other operating expenses 13,597 7,576 6,021 79% 84%
Net other operating expense 12,809 7,027 5,782 82% 87%
Other operating income and expenses is composed of insurance costs and payments, provisions for mining damages and indemnity and their release and other fees. Since the amounts within the other operating income are relatively low, they are sensitive to one-time effects and seasonal fluctuations. Other operating expenses increased in 3M 2012 mainly due to a higher provision for mining damages, reflecting expected increase in mine development works and higher donation contributions compared to the same period in 2011.
EBITDA
(EUR thousand) 3M 2012 3M 2011 y-y y/y % ex-FX
EBITDA 56,127 81,567 (25,440) (31%) (33%)
The Group’s EBITDA for 3M 2012 decreased by 31% compared to the same period in 2011 mainly as a result of lower revenues from thermal coal and coke.
As EBITDA is a non-IFRS measure, the following table provides a reconciliation of EBITDA to IFRS line items of the income statement.
(EUR thousand) 3M 2012 3M 2011
Net profit after tax 8,516 3,437
Income tax 1,611 7,202
Net financial expenses 3,051 27,005
Depreciation and amortisation 42,991 43,939
(Gain)/loss from sale of PPE (42) (16)
EBITDA 56,127 81,567
15
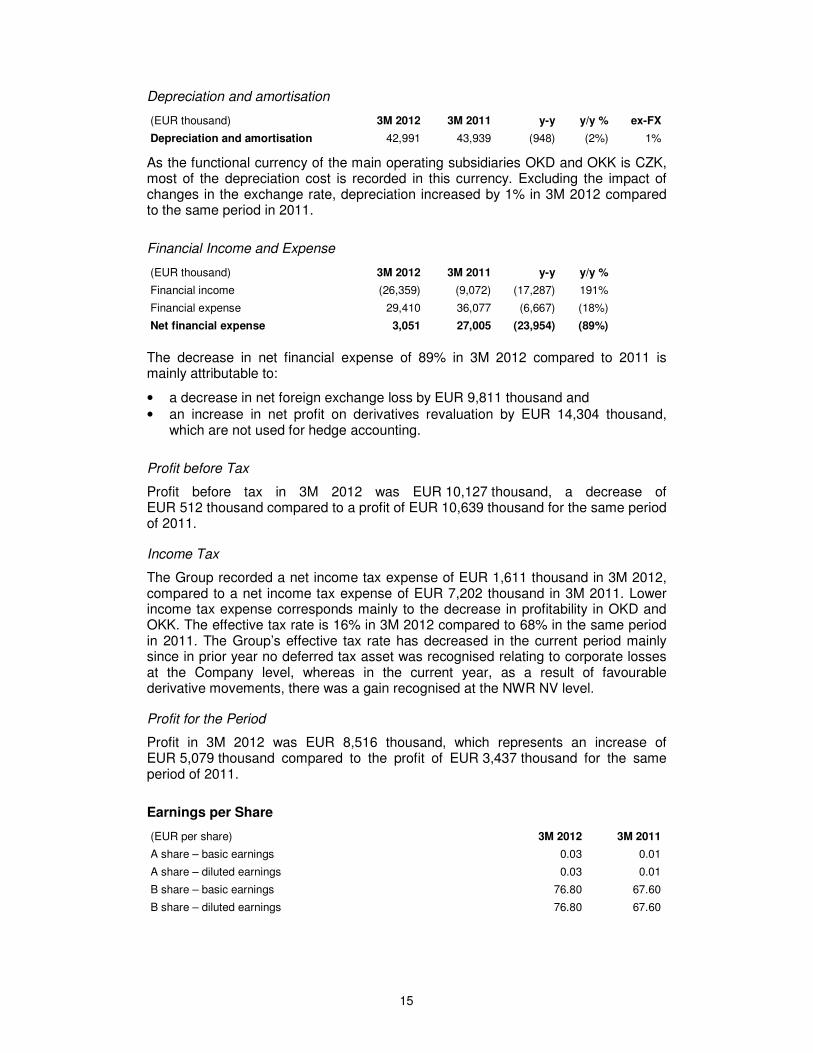
Depreciation and amortisation
(EUR thousand) 3M 2012 3M 2011 y-y y/y % ex-FX
Depreciation and amortisation 42,991 43,939 (948) (2%) 1%
As the functional currency of the main operating subsidiaries OKD and OKK is CZK, most of the depreciation cost is recorded in this currency. Excluding the impact of changes in the exchange rate, depreciation increased by 1% in 3M 2012 compared to the same period in 2011.
Financial Income and Expense
(EUR thousand) 3M 2012 3M 2011 y-y y/y %
Financial income (26,359) (9,072) (17,287) 191%
Financial expense 29,410 36,077 (6,667) (18%)
Net financial expense 3,051 27,005 (23,954) (89%)
The decrease in net financial expense of 89% in 3M 2012 compared to 2011 is mainly attributable to:
• a decrease in net foreign exchange loss by EUR 9,811 thousand and • an increase in net profit on derivatives revaluation by EUR 14,304 thousand,
which are not used for hedge accounting.
Profit before Tax
Profit before tax in 3M 2012 was EUR 10,127 thousand, a decrease of EUR 512 thousand compared to a profit of EUR 10,639 thousand for the same period of 2011.
Income Tax
The Group recorded a net income tax expense of EUR 1,611 thousand in 3M 2012, compared to a net income tax expense of EUR 7,202 thousand in 3M 2011. Lower income tax expense corresponds mainly to the decrease in profitability in OKD and OKK. The effective tax rate is 16% in 3M 2012 compared to 68% in the same period in 2011. The Group’s effective tax rate has decreased in the current period mainly since in prior year no deferred tax asset was recognised relating to corporate losses at the Company level, whereas in the current year, as a result of favourable derivative movements, there was a gain recognised at the NWR NV level.
Profit for the Period
Profit in 3M 2012 was EUR 8,516 thousand, which represents an increase of EUR 5,079 thousand compared to the profit of EUR 3,437 thousand for the same period of 2011.
Earnings per Share
(EUR per share) 3M 2012 3M 2011
A share – basic earnings 0.03 0.01
A share – diluted earnings 0.03 0.01
B share – basic earnings 76.80 67.60
B share – diluted earnings 76.80 67.60
16
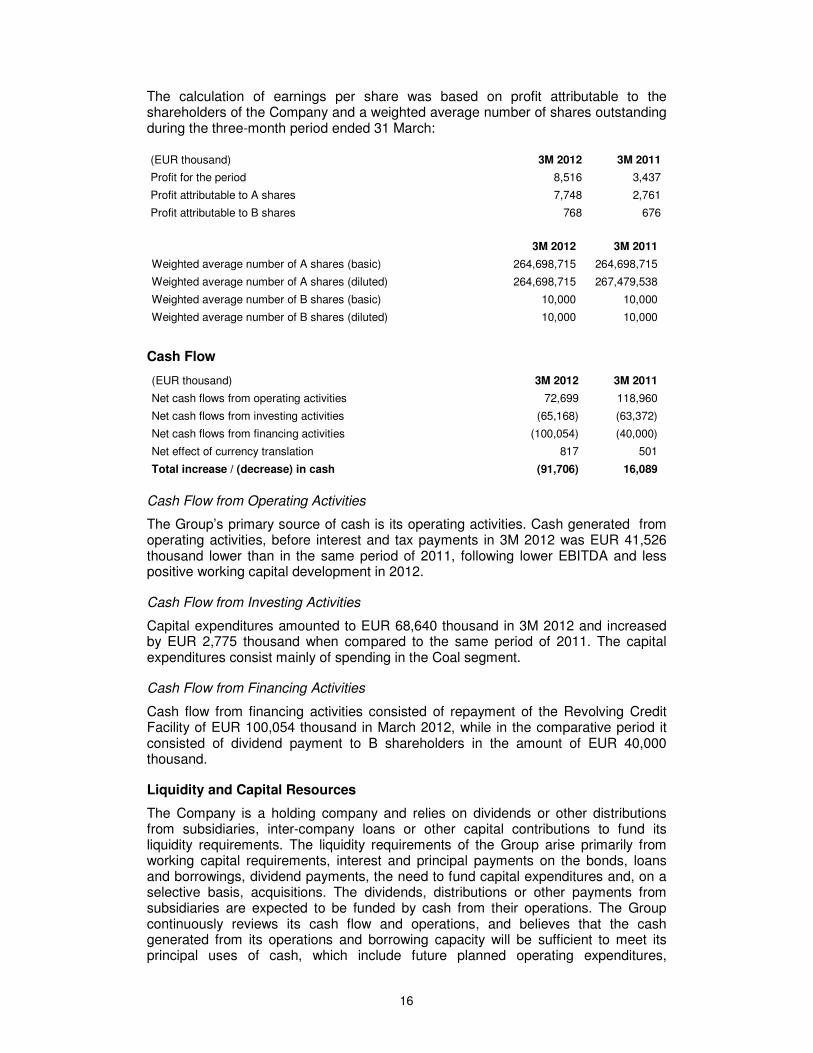
The calculation of earnings per share was based on profit attributable to the shareholders of the Company and a weighted average number of shares outstanding during the three-month period ended 31 March:
(EUR thousand) 3M 2012 3M 2011
Profit for the period 8,516 3,437
Profit attributable to A shares 7,748 2,761
Profit attributable to B shares 768 676
3M 2012 3M 2011
Weighted average number of A shares (basic) 264,698,715 264,698,715
Weighted average number of A shares (diluted) 264,698,715 267,479,538
Weighted average number of B shares (basic) 10,000 10,000
Weighted average number of B shares (diluted) 10,000 10,000
Cash Flow
(EUR thousand) 3M 2012 3M 2011
Net cash flows from operating activities 72,699 118,960
Net cash flows from investing activities (65,168) (63,372)
Net cash flows from financing activities (100,054) (40,000)
Net effect of currency translation 817 501
Total increase / (decrease) in cash (91,706) 16,089
Cash Flow from Operating Activities
The Group’s primary source of cash is its operating activities. Cash generated from operating activities, before interest and tax payments in 3M 2012 was EUR 41,526 thousand lower than in the same period of 2011, following lower EBITDA and less positive working capital development in 2012.
Cash Flow from Investing Activities
Capital expenditures amounted to EUR 68,640 thousand in 3M 2012 and increased by EUR 2,775 thousand when compared to the same period of 2011. The capital expenditures consist mainly of spending in the Coal segment.
Cash Flow from Financing Activities
Cash flow from financing activities consisted of repayment of the Revolving Credit Facility of EUR 100,054 thousand in March 2012, while in the comparative period it consisted of dividend payment to B shareholders in the amount of EUR 40,000 thousand.
Liquidity and Capital Resources
The Company is a holding company and relies on dividends or other distributions from subsidiaries, inter-company loans or other capital contributions to fund its liquidity requirements. The liquidity requirements of the Group arise primarily from working capital requirements, interest and principal payments on the bonds, loans and borrowings, dividend payments, the need to fund capital expenditures and, on a selective basis, acquisitions. The dividends, distributions or other payments from subsidiaries are expected to be funded by cash from their operations. The Group continuously reviews its cash flow and operations, and believes that the cash generated from its operations and borrowing capacity will be sufficient to meet its principal uses of cash, which include future planned operating expenditures,
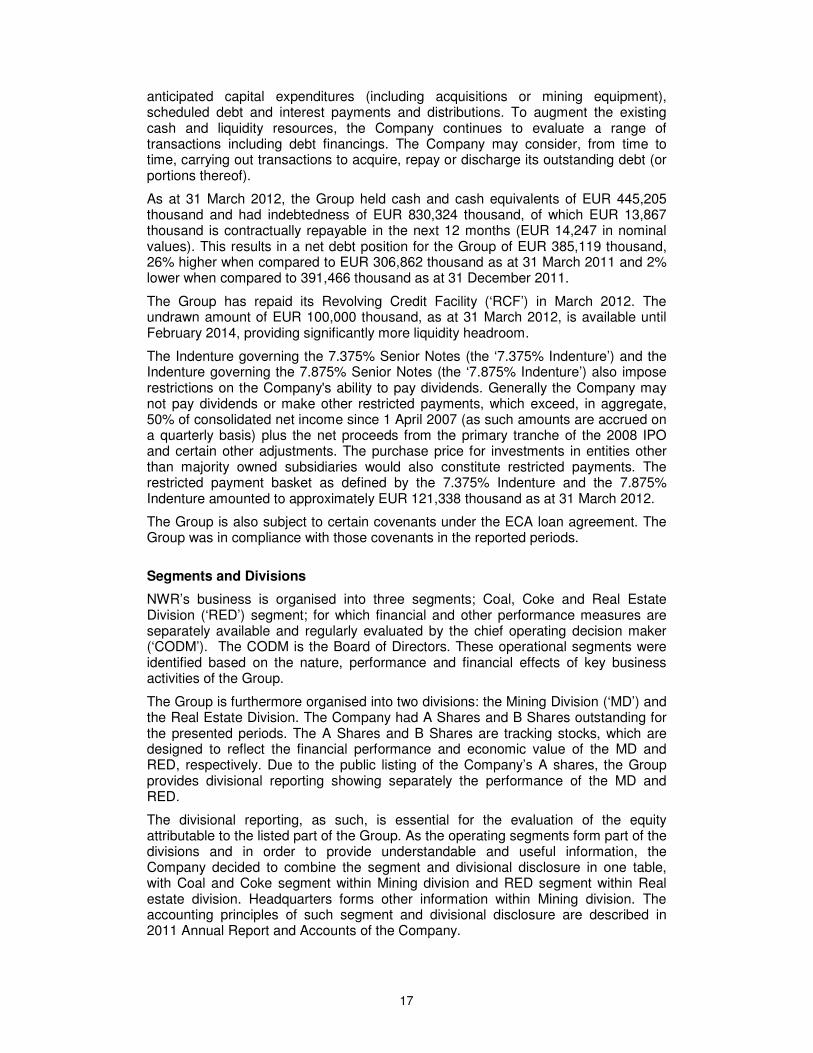
17
anticipated capital expenditures (including acquisitions or mining equipment), scheduled debt and interest payments and distributions. To augment the existing cash and liquidity resources, the Company continues to evaluate a range of transactions including debt financings. The Company may consider, from time to time, carrying out transactions to acquire, repay or discharge its outstanding debt (or portions thereof).
As at 31 March 2012, the Group held cash and cash equivalents of EUR 445,205 thousand and had indebtedness of EUR 830,324 thousand, of which EUR 13,867 thousand is contractually repayable in the next 12 months (EUR 14,247 in nominal values). This results in a net debt position for the Group of EUR 385,119 thousand, 26% higher when compared to EUR 306,862 thousand as at 31 March 2011 and 2% lower when compared to 391,466 thousand as at 31 December 2011.
The Group has repaid its Revolving Credit Facility (‘RCF’) in March 2012. The undrawn amount of EUR 100,000 thousand, as at 31 March 2012, is available until February 2014, providing significantly more liquidity headroom.
The Indenture governing the 7.375% Senior Notes (the ‘7.375% Indenture’) and the Indenture governing the 7.875% Senior Notes (the ‘7.875% Indenture’) also impose restrictions on the Company's ability to pay dividends. Generally the Company may not pay dividends or make other restricted payments, which exceed, in aggregate, 50% of consolidated net income since 1 April 2007 (as such amounts are accrued on a quarterly basis) plus the net proceeds from the primary tranche of the 2008 IPO and certain other adjustments. The purchase price for investments in entities other than majority owned subsidiaries would also constitute restricted payments. The restricted payment basket as defined by the 7.375% Indenture and the 7.875% Indenture amounted to approximately EUR 121,338 thousand as at 31 March 2012.
The Group is also subject to certain covenants under the ECA loan agreement. The Group was in compliance with those covenants in the reported periods.
Segments and Divisions
NWR’s business is organised into three segments; Coal, Coke and Real Estate Division (‘RED’) segment; for which financial and other performance measures are separately available and regularly evaluated by the chief operating decision maker (‘CODM’). The CODM is the Board of Directors. These operational segments were identified based on the nature, performance and financial effects of key business activities of the Group.
The Group is furthermore organised into two divisions: the Mining Division (‘MD’) and the Real Estate Division. The Company had A Shares and B Shares outstanding for the presented periods. The A Shares and B Shares are tracking stocks, which are designed to reflect the financial performance and economic value of the MD and RED, respectively. Due to the public listing of the Company’s A shares, the Group provides divisional reporting showing separately the performance of the MD and RED.
The divisional reporting, as such, is essential for the evaluation of the equity attributable to the listed part of the Group. As the operating segments form part of the divisions and in order to provide understandable and useful information, the Company decided to combine the segment and divisional disclosure in one table, with Coal and Coke segment within Mining division and RED segment within Real estate division. Headquarters forms other information within Mining division. The accounting principles of such segment and divisional disclosure are described in 2011 Annual Report and Accounts of the Company.
18
Business Segments 1 January 2012 - 31 March 2012
Mining division
Real Estate
division
Eliminations & adjustments
2 Group
operations total
(EUR thousand)
Coal segment
Coke segment Other
Eliminations &
adjustments1
Mining division -
total RED
segment
Segment revenues
Sales to third parties 292,444 57,112 (2,895)3 - 346,661 - - 346,661
Sales to other segments 21,319 23 345 (21,687) - 193 (193) -
Total revenues 313,763 57,135 (2,550) (21,687) 346,661 193 (193) 346,661 Change in inventories of finished goods and work-in-progress
(3,040) (72) - 405 (2,707) - - (2,707)
Consumption of material and energy (79,443) (38,154) (19) 20,840 (96,776) (1) - (96,777)
Service expenses (79,494) (8,484) (1,304) 447 (88,835) - - (88,835)
of which transport costs (24,929) (5,531) - - (30,460) - - (30,460)
Personnel expenses (86,791) (4,289) 119 - (90,961) - - (90,961)
Depreciation and amortisation (40,678) (2,288) (21) - (42,987) (4) - (42,991) Amortisation of rights to use land - divisional adjustment
(111) (82) - - (193) - 193 -
Net gain from material sold 1,476 79 - - 1,555 - - 1,555
Gain/(loss) from sale of property, plant and equipment 6 - - - 6 36 - 42
Other operating income 608 105 - (16) 697 91 - 788
Other operating expenses (12,961) (356) (288) 8 (13,597) - - (13,597)
SEGMENT OPERATING INCOME/(LOSS) 13,335 3,594 (4,063) (3) 12,863 315 - 13,178
EBITDA 54,118 5,964 (4,042) (3) 56,037 283 (193) 56,127
1 elimination of intercompany transactions within the Mining division (e.g. coal sales, service fees)
2 elimination of transactions between the divisions (e.g. lease charges, service fees, annual fees for providing real estates)
3 impact of FX hedging
19
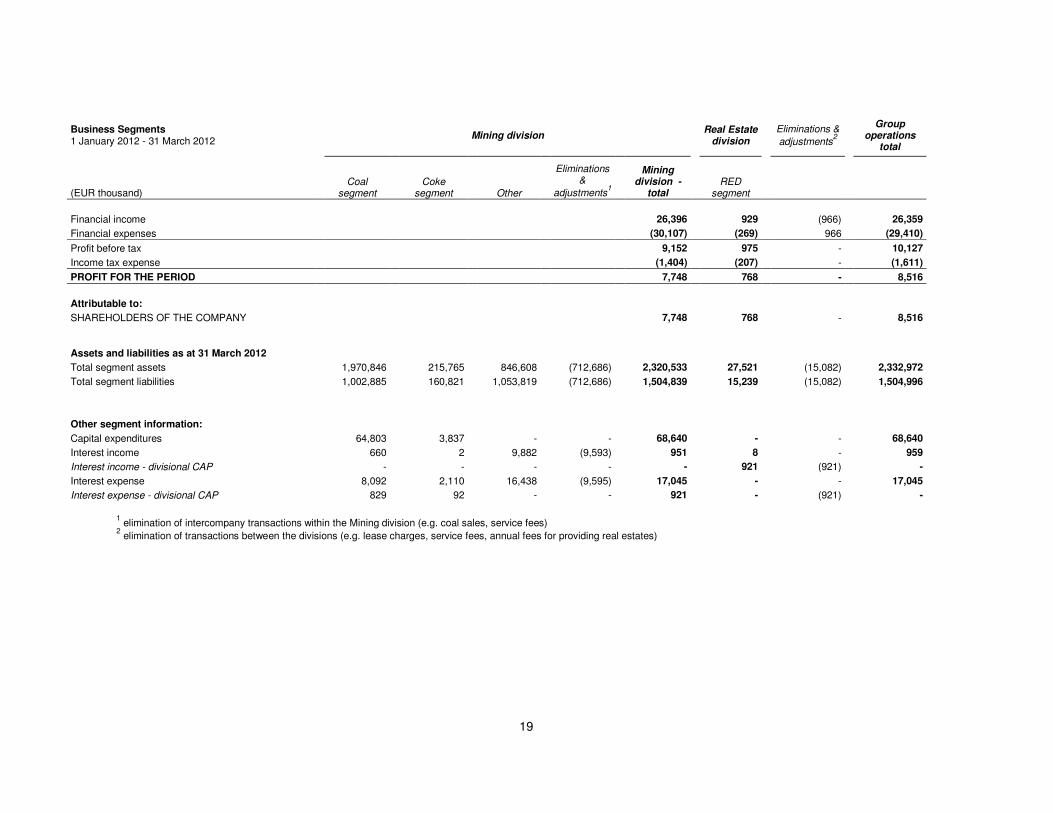
Business Segments 1 January 2012 - 31 March 2012
Mining division
Real Estate
division
Eliminations & adjustments
2 Group
operations total
(EUR thousand)
Coal segment
Coke segment Other
Eliminations &
adjustments1
Mining division -
total RED
segment
Financial income 26,396 929 (966) 26,359
Financial expenses (30,107) (269) 966 (29,410)
Profit before tax 9,152 975 - 10,127
Income tax expense (1,404) (207) - (1,611)
PROFIT FOR THE PERIOD 7,748 768 - 8,516
Attributable to:
SHAREHOLDERS OF THE COMPANY 7,748 768 - 8,516
Assets and liabilities as at 31 March 2012
Total segment assets 1,970,846 215,765 846,608 (712,686) 2,320,533 27,521 (15,082) 2,332,972
Total segment liabilities 1,002,885 160,821 1,053,819 (712,686) 1,504,839 15,239 (15,082) 1,504,996
Other segment information:
Capital expenditures 64,803 3,837 - - 68,640 - - 68,640
Interest income 660 2 9,882 (9,593) 951 8 - 959
Interest income - divisional CAP - - - - - 921 (921) -
Interest expense 8,092 2,110 16,438 (9,595) 17,045 - - 17,045
Interest expense - divisional CAP 829 92 - - 921 - (921) -
1 elimination of intercompany transactions within the Mining division (e.g. coal sales, service fees)
2 elimination of transactions between the divisions (e.g. lease charges, service fees, annual fees for providing real estates)
20
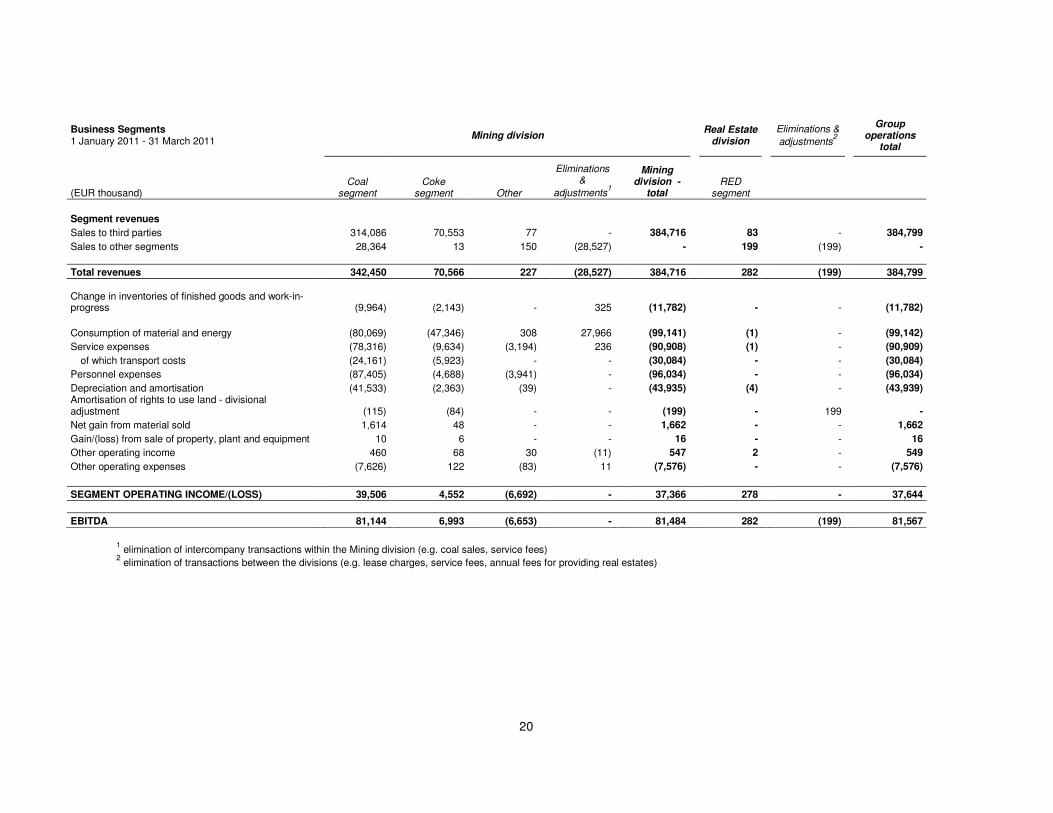
Business Segments 1 January 2011 - 31 March 2011
Mining division
Real Estate
division
Eliminations & adjustments
2 Group
operations total
(EUR thousand)
Coal segment
Coke segment Other
Eliminations &
adjustments1
Mining division -
total RED
segment
Segment revenues
Sales to third parties 314,086 70,553 77 - 384,716 83 - 384,799
Sales to other segments 28,364 13 150 (28,527) - 199 (199) -
Total revenues 342,450 70,566 227 (28,527) 384,716 282 (199) 384,799 Change in inventories of finished goods and work-in-progress
(9,964) (2,143) - 325 (11,782) - - (11,782)
Consumption of material and energy (80,069) (47,346) 308 27,966 (99,141) (1) - (99,142)
Service expenses (78,316) (9,634) (3,194) 236 (90,908) (1) - (90,909)
of which transport costs (24,161) (5,923) - - (30,084) - - (30,084)
Personnel expenses (87,405) (4,688) (3,941) - (96,034) - - (96,034)
Depreciation and amortisation (41,533) (2,363) (39) - (43,935) (4) - (43,939) Amortisation of rights to use land - divisional adjustment
(115) (84) - - (199) - 199 -
Net gain from material sold 1,614 48 - - 1,662 - - 1,662
Gain/(loss) from sale of property, plant and equipment 10 6 - - 16 - - 16
Other operating income 460 68 30 (11) 547 2 - 549
Other operating expenses (7,626) 122 (83) 11 (7,576) - - (7,576)
SEGMENT OPERATING INCOME/(LOSS) 39,506 4,552 (6,692) - 37,366 278 - 37,644
EBITDA 81,144 6,993 (6,653) - 81,484 282 (199) 81,567
1 elimination of intercompany transactions within the Mining division (e.g. coal sales, service fees)
2 elimination of transactions between the divisions (e.g. lease charges, service fees, annual fees for providing real estates)
21
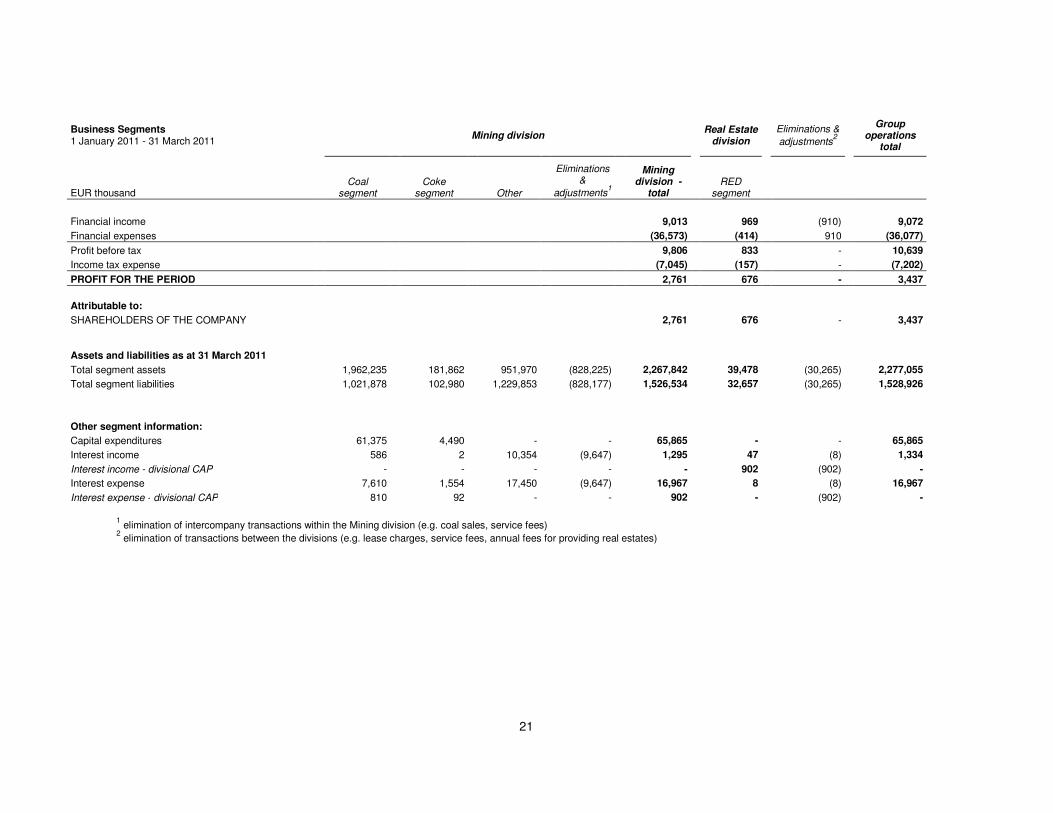
Business Segments 1 January 2011 - 31 March 2011
Mining division
Real Estate
division
Eliminations & adjustments
2 Group
operations total
EUR thousand
Coal segment
Coke segment Other
Eliminations &
adjustments1
Mining division -
total RED
segment
Financial income 9,013 969 (910) 9,072
Financial expenses (36,573) (414) 910 (36,077)
Profit before tax 9,806 833 - 10,639
Income tax expense (7,045) (157) - (7,202)
PROFIT FOR THE PERIOD 2,761 676 - 3,437
Attributable to:
SHAREHOLDERS OF THE COMPANY 2,761 676 - 3,437
Assets and liabilities as at 31 March 2011
Total segment assets 1,962,235 181,862 951,970 (828,225) 2,267,842 39,478 (30,265) 2,277,055
Total segment liabilities 1,021,878 102,980 1,229,853 (828,177) 1,526,534 32,657 (30,265) 1,528,926
Other segment information:
Capital expenditures 61,375 4,490 - - 65,865 - - 65,865
Interest income 586 2 10,354 (9,647) 1,295 47 (8) 1,334
Interest income - divisional CAP - - - - - 902 (902) -
Interest expense 7,610 1,554 17,450 (9,647) 16,967 8 (8) 16,967
Interest expense - divisional CAP 810 92 - - 902 - (902) -
1 elimination of intercompany transactions within the Mining division (e.g. coal sales, service fees)
2 elimination of transactions between the divisions (e.g. lease charges, service fees, annual fees for providing real estates)
22
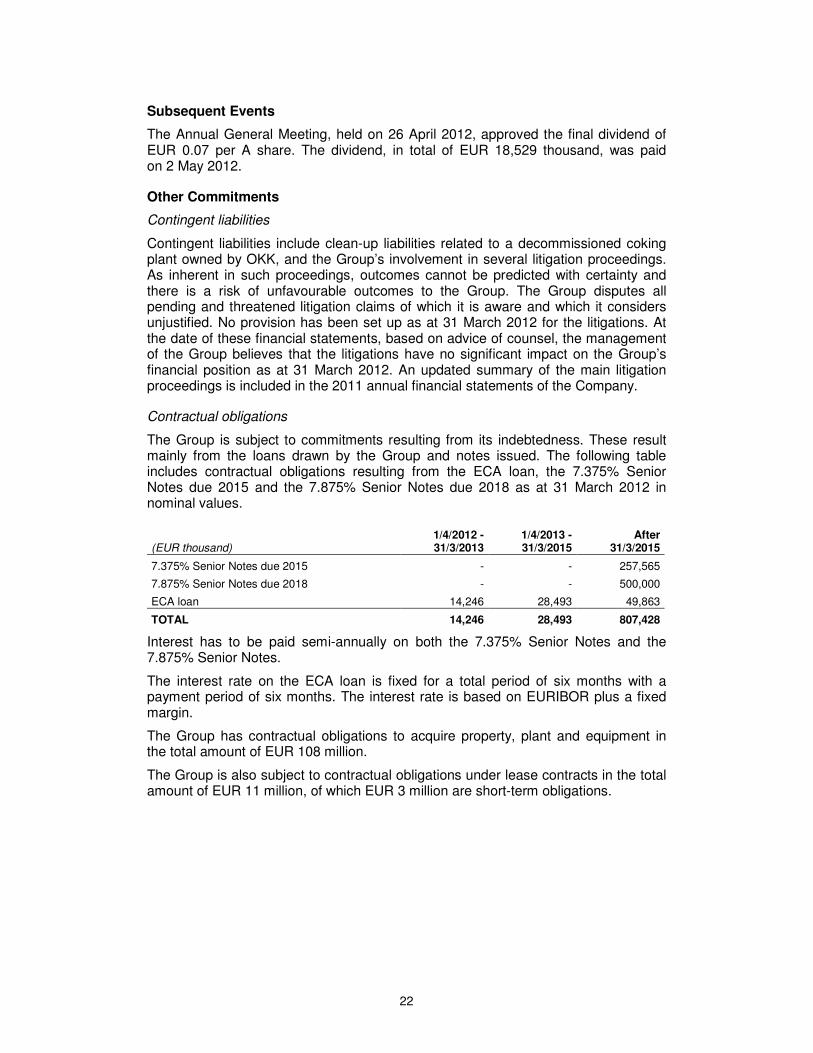
Subsequent Events
The Annual General Meeting, held on 26 April 2012, approved the final dividend of EUR 0.07 per A share. The dividend, in total of EUR 18,529 thousand, was paid on 2 May 2012.
Other Commitments
Contingent liabilities
Contingent liabilities include clean-up liabilities related to a decommissioned coking plant owned by OKK, and the Group’s involvement in several litigation proceedings. As inherent in such proceedings, outcomes cannot be predicted with certainty and there is a risk of unfavourable outcomes to the Group. The Group disputes all pending and threatened litigation claims of which it is aware and which it considers unjustified. No provision has been set up as at 31 March 2012 for the litigations. At the date of these financial statements, based on advice of counsel, the management of the Group believes that the litigations have no significant impact on the Group’s financial position as at 31 March 2012. An updated summary of the main litigation proceedings is included in the 2011 annual financial statements of the Company.
Contractual obligations
The Group is subject to commitments resulting from its indebtedness. These result mainly from the loans drawn by the Group and notes issued. The following table includes contractual obligations resulting from the ECA loan, the 7.375% Senior Notes due 2015 and the 7.875% Senior Notes due 2018 as at 31 March 2012 in nominal values.
(EUR thousand) 1/4/2012 - 31/3/2013
1/4/2013 - 31/3/2015
After 31/3/2015
7.375% Senior Notes due 2015 - - 257,565
7.875% Senior Notes due 2018 - - 500,000
ECA loan 14,246 28,493 49,863
TOTAL 14,246 28,493 807,428
Interest has to be paid semi-annually on both the 7.375% Senior Notes and the 7.875% Senior Notes.
The interest rate on the ECA loan is fixed for a total period of six months with a payment period of six months. The interest rate is based on EURIBOR plus a fixed margin.
The Group has contractual obligations to acquire property, plant and equipment in the total amount of EUR 108 million.
The Group is also subject to contractual obligations under lease contracts in the total amount of EUR 11 million, of which EUR 3 million are short-term obligations.
23
Certain Relationships and Related Party Transactions
A description of the relationship between the Company and its subsidiaries on the one hand and BXR Group Limited (which controls the Company) and entities affiliated with it (‘BXR Group’) is included on pages 84-88 of and in the financial statements included in the 2011 Annual Report and Accounts of NWR NV. There has been no substantive change to the nature, scale or terms of these arrangements during the three-month period ended 31 March 2012.
24
Principal risks and uncertainties
It is not anticipated that the nature of the principal risks and uncertainties that affect the business, and which are set out on pages 24 to 27 of the 2011 Annual Report and Accounts of NWR NV, will change in respect of the next nine months of the financial year.
25
Forward Looking Statements Certain statements in this document are not historical facts and are or are deemed to be ‘forward-looking’. The Company’s prospects, plans, financial position and business strategy, and statements pertaining to the capital resources, future expenditure for development projects and results of operations, may constitute forward-looking statements. In addition, forward-looking statements generally can be identified by the use of forward-looking terminology including, but not limited to; ‘may’, ‘expect’, ‘intend’, ‘estimate’, ‘anticipate’, ‘plan’, ‘foresee’, ‘will’, ‘could’, ‘may’, ‘might’, ‘believe’ or ‘continue’ or the negatives of these terms or variations of them or similar terminology. Although the Company believes that the expectations reflected in these forward-looking statements are reasonable, it can give no assurance that these expectations will prove to have been correct. These forward-looking statements involve a number of risks, uncertainties and other facts that may cause actual results to be materially different from those expressed or implied in these forward-looking statements because they relate to events and depend on circumstances that may or may not occur in the future and may be beyond the Company’s ability to control or predict. Forward-looking statements are not guarantees of future performances.
Factors, risk and uncertainties that could cause actual outcomes and results to be materially different from those projected include, but are not limited to, the following: risks relating to changes in political, economic and social conditions in the Czech Republic, Poland and the CEE region; future prices and demand for the Company's products and demand for the Group's customers' products; coal mine reserves; remaining life of the Group's mines; coal production; trends in the coal industry and domestic and international coal market conditions; risks in coal mining operations; future expansion plans and capital expenditures; the Group's relationship with, and conditions affecting, the Group's customers; competition; railroad and other transportation performance and costs; availability of specialist and qualified workers; and weather conditions or catastrophic damage; risks relating to Czech or Polish law, regulations and taxation, including laws, regulations, decrees and decisions governing the coal mining industry, the environment and currency and exchange controls relating to Czech and Polish entities and their official interpretation by governmental and other regulatory bodies and by the courts; and risks relating to global economic conditions and the global economic environment. Additional risk factors are described in the Company’s 2011 Annual Report and Accounts.
Forward-looking statements speak only as of the date of this document. The Company expressly disclaims any obligation or undertaking to release, publicly or otherwise, any updates or revisions to any forward-looking statement contained in this report to reflect any change in its expectations or any change in events, conditions, assumptions or circumstances on which any such statement is based unless so required by applicable law.
Amsterdam, 15 May 2012
Board of Directors

26
Directors’ Statement of Responsibility
We confirm that to the best of our knowledge:
• the condensed set of financial statements has been prepared in accordance with IAS 34 Interim Financial Reporting as adopted by the European Union;
• the three-month period management report includes a fair review of the information required by:
(a) DTR 4.2.7R of the Disclosure and Transparency Rules, being an indication of important events that have occurred during the first three months of the financial year and their impact on the condensed set of financial statements; and a description of the principal risks and uncertainties for the remaining nine months of the year; and
(b) DTR 4.2.8R of the Disclosure and Transparency Rules, being related party transactions that have taken place in the first three months of the current financial year and that have materially affected the financial position or performance of the entity during that period; and any changes in the related party transactions described in the last annual report that could do so.
The Board The Board of Directors that served during all or part of the three-month period to 31 March 2012 and their respective responsibilities can be found on pages 62 to 67 of the 2011 Annual Report and Accounts of NWR NV.
Approved by the Board and signed on its behalf by Marek Jelínek Executive Director and Chief Financial Officer 15 May 2012
New World Resources Plc | c/o Hackwood Secretaries Limited, One Silk Street | London EC2Y 8HQ | United Kingdom Headquarters: Jachthavenweg 109h | 1081 KM Amsterdam | The Netherlands Tel: +31 20 570 2200 I Fax: +31 20 570 2222 I E-mail: [email protected] I www.newworldresources.eu A public company incorporated in England and Wales with Company Number 7584218 1/1
New World Resources Plc (‘NWR Plc’) is the holding company of New World Resources N.V. (‘NWR NV’). NWR Plc oversees the Group’s strategy and reviews management and financial performance. This press release presents the Group’s1 overview for the first quarter 2012.
1 “Group refers to New World Resources Plc and its subsidiaries.
New World Resources Plc | One Silk Street | London EC2Y 8HQ | United Kingdom Headquarters: Jachthavenweg 109h | 1081 KM Amsterdam | The Netherlands | Tel: +31 20 570 2200 I Fax: +31 20 570 2222 I E-mail: [email protected] I www.newworldresources.eu A public company incorporated in England and Wales with Company Number 7584218 1/8
Amsterdam, 16 May 2012
New World Resources Unaudited results for the first quarter 2012
New World Resources Plc (‘NWR’ or the ‘Company’) today announces its financial results for the three-month period ended 31 March 2012.
Highlights
! Revenues of EUR 347 million, down 10%
! EBITDA of EUR 54 million, down 34%
! Net profit of EUR 6 million, up 80%
! Basic EPS of EUR 0.02
! Cash flow from operations of EUR 80 million
! Net debt of EUR 385 million, down 2% since the beginning of the year
! LTIFR1 improved by 4% to 7.17, the best result in the Company’s history
! Coal production of 2.4Mt, and external sales of 2.3Mt (1.3Mt coking coal)
! Coke production of 175kt, and external sales of 155kt
! Q2 coking coal and coke prices agreed at EUR 130/t and EUR 298/t respectively
! Debiensko CAPEX for 2012 capped at EUR 5 million pending project’s review
! Agreement with trade unions on 3% increase in basic wages from 1 April 2012
! 2012 guidance on production, sales, coal mix and unit costs unchanged
Chairman’s statement
Operational performance during the first three months was in line with our expectations including the slower rate of production in the first quarter and our full year 2012 production and sales targets remain unchanged. In April we successfully concluded negotiations with the trade unions ensuring a positive outcome for our mining employees whilst keeping the Company’s largest cost component contained. Coupled with other favourable cost movements we are on track to achieve the previously announced target of flat unit costs in local currency for the full year 2012.
1 Lost Time Injury Frequency Rate represents the number of reportable injuries in the NWR Group causing at least three days of absence per million hours worked including contractors.
New World Resources Plc | One Silk Street | London EC2Y 8HQ | United Kingdom Headquarters: Jachthavenweg 109h | 1081 KM Amsterdam | The Netherlands | Tel: +31 20 570 2200 I Fax: +31 20 570 2222 I E-mail: [email protected] I www.newworldresources.eu A public company incorporated in England and Wales with Company Number 7584218 2/8
Our injury frequency rate showed continued improvement in the first quarter of 2012, decreasing by 4% year-on-year, and all our operations were fatality-free during the period.
Improving the coal mix is one of NWR's operational priorities. In February we announced that the deteriorating trend in our product mix has reversed in the short term. In the first quarter of 2012, we have seen very strong coking coal volumes and we are on track to achieve our previously announced full year guidance on coal mix, which marks an improvement compared to 2011. For the medium term, we have initiated expansion projects from our existing mining footprint to unlock approximately 30 million tonnes of coking coal reserves.
Our balance sheet remains robust. Net debt decreased for the third consecutive quarter and we have no immediate refinancing obligations ahead of us. We repaid in full the EUR 100 million revolving credit facility, which is now fully available. However we remain alert to continuing challenges, including increased flows of US coal into Europe, the muted outlook for Eurozone economies and financial markets in general. We therefore continue to focus on prudently managing and constantly evaluating our operations, capital expenditure and funding.
In that respect, we have capped our CAPEX spending at Debiensko in 2012 at EUR 5 million, reflecting changed water management conditions as well as inflationary pressures in Poland. We decided to carry out a thorough review of the project’s key parameters before advancing the CAPEX programme.
Industrialisation and urbanisation in China, India and other rapidly developing emerging economies will continue to require huge imports of steel-making materials. And although we appear to be entering an era of weak or even negative growth rates in developed economies, we believe that continued growth in emerging markets will provide a floor to international coking coal prices.
Steel production in the CEE region has been on an improving trajectory since the beginning of the year. Steel mills in our customer markets are currently running at utilisation rates of between 80 and 90 per cent with steel production up 7 per cent in the quarter compared to the previous quarter. An important end market for us – car production – is maintaining its momentum in the CEE region. Vehicle production in the Czech Republic alone increased by 14 per cent in the first quarter relative to the previous year.
To conclude, we reiterate our full year 2012 guidance that NWR expects to extract between 10.8Mt and 11Mt of coal and produce 700kt of coke this year. External sales of coal are projected to reach between 10.25Mt and 10.5Mt of coal, split approximately 52 per cent thermal coal and 48 per cent coking coal. Additionally, we expect to sell 600kt of coke this year. We also reiterate our target of flat mining unit costs in Czech Koruna for the full year.
Mike Salamon, Executive Chairman of NWR
New World Resources Plc | One Silk Street | London EC2Y 8HQ | United Kingdom Headquarters: Jachthavenweg 109h | 1081 KM Amsterdam | The Netherlands | Tel: +31 20 570 2200 I Fax: +31 20 570 2222 I E-mail: [email protected] I www.newworldresources.eu A public company incorporated in England and Wales with Company Number 7584218 3/8
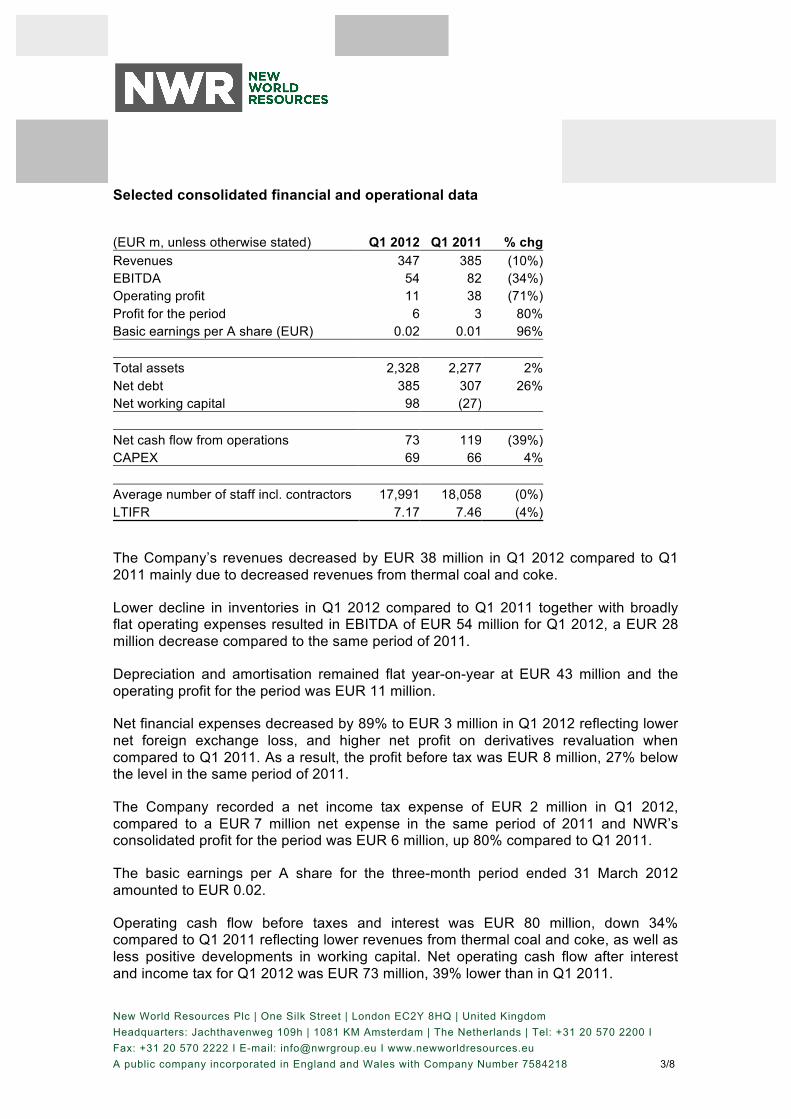
Selected consolidated financial and operational data
(EUR m, unless otherwise stated) Q1 2012 Q1 2011 % chg
Revenues 347 385 (10%) EBITDA 54 82 (34%) Operating profit 11 38 (71%) Profit for the period 6 3 80% Basic earnings per A share (EUR) 0.02 0.01 96% Total assets 2,328 2,277 2% Net debt 385 307 26% Net working capital 98 (27) Net cash flow from operations 73 119 (39%) CAPEX 69 66 4% Average number of staff incl. contractors 17,991 18,058 (0%) LTIFR 7.17 7.46 (4%)
The Company’s revenues decreased by EUR 38 million in Q1 2012 compared to Q1 2011 mainly due to decreased revenues from thermal coal and coke.
Lower decline in inventories in Q1 2012 compared to Q1 2011 together with broadly flat operating expenses resulted in EBITDA of EUR 54 million for Q1 2012, a EUR 28 million decrease compared to the same period of 2011.
Depreciation and amortisation remained flat year-on-year at EUR 43 million and the operating profit for the period was EUR 11 million.
Net financial expenses decreased by 89% to EUR 3 million in Q1 2012 reflecting lower net foreign exchange loss, and higher net profit on derivatives revaluation when compared to Q1 2011. As a result, the profit before tax was EUR 8 million, 27% below the level in the same period of 2011.
The Company recorded a net income tax expense of EUR 2 million in Q1 2012, compared to a EUR 7 million net expense in the same period of 2011 and NWR’s consolidated profit for the period was EUR 6 million, up 80% compared to Q1 2011.
The basic earnings per A share for the three-month period ended 31 March 2012 amounted to EUR 0.02.
Operating cash flow before taxes and interest was EUR 80 million, down 34% compared to Q1 2011 reflecting lower revenues from thermal coal and coke, as well as less positive developments in working capital. Net operating cash flow after interest and income tax for Q1 2012 was EUR 73 million, 39% lower than in Q1 2011.
New World Resources Plc | One Silk Street | London EC2Y 8HQ | United Kingdom Headquarters: Jachthavenweg 109h | 1081 KM Amsterdam | The Netherlands | Tel: +31 20 570 2200 I Fax: +31 20 570 2222 I E-mail: [email protected] I www.newworldresources.eu A public company incorporated in England and Wales with Company Number 7584218 4/8
Total capital expenditure in Q1 2012 amounted to EUR 69 million, 4% above the Q1 2011 level. This includes CAPEX of EUR 2 million spent on the Debiensko project.
As at 31 March 2011, the Company’s net debt was EUR 385 million, down 2% from 31 December 2011. The Company’s first significant debt maturity is not until 2015. In March we fully repaid the EUR 100 million revolving credit facility and during 2012 we will continue to watch the markets closely so that we are able to take advantage of opportunities either to raise new financing or to refinance our debt as they arise.
Health and safety
The safety of our workforce is an absolute priority and the investment in modern mining technologies bought under the POP 2010 programme has helped bring down the LTIFR in recent years. In the first quarter of 2012 our LTIFR showed another 4% improvement to 7.17 loss-time injuries per one million hours worked in the NWR Group. This is the lowest injury rate ever achieved in the history of NWR and NWR’s management is committed to reducing LTIFR below 5 by 2015.
Development projects
At present NWR has three major projects in its pipeline in various stages of development, Debiensko and Morcinek in Poland and Frenstat in the Czech Republic.
In the first quarter of 2012, construction works on the Debiensko project progressed according to plan. However, the risk profile related to water management has changed and long-term water treatment liabilities now need to be reviewed. In addition, recent competitive bids for certain parts of the project reflect inflationary pressures for mining equipment and services in Poland.
We have, therefore, capped CAPEX spend for 2012 at EUR 5 million, pending a review of the project’s parameters. The review will involve several months of engineering work.
We are also undertaking expansion initiatives within our existing mining footprint in the Karvina region aimed at improving our product mix. Two expansion projects at the Karvina Mine are aimed at accessing to more than 30 million tonnes of coking coal via our existing operations by 2016 – 2017. In March 2012 we submitted a notice of intention to further extend mining activities in the Karvina Mine to the Ministry of Environment of the Czech Republic.
New World Resources Plc | One Silk Street | London EC2Y 8HQ | United Kingdom Headquarters: Jachthavenweg 109h | 1081 KM Amsterdam | The Netherlands | Tel: +31 20 570 2200 I Fax: +31 20 570 2222 I E-mail: [email protected] I www.newworldresources.eu A public company incorporated in England and Wales with Company Number 7584218 5/8
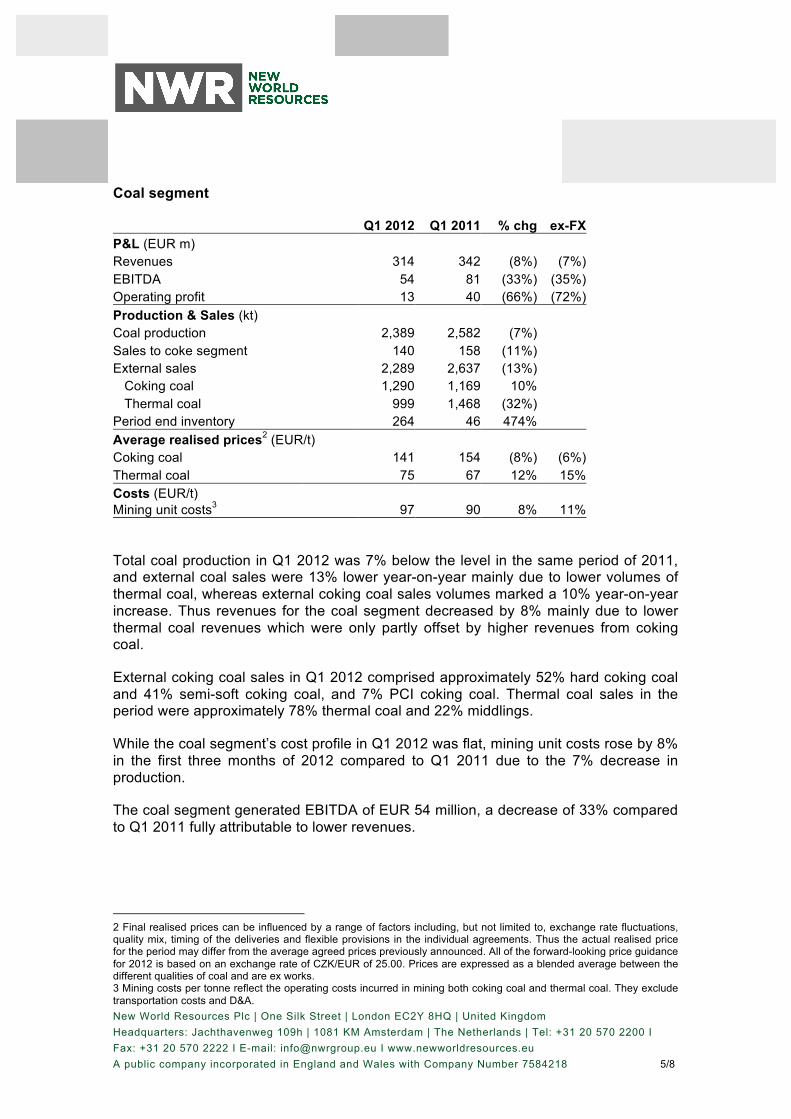
Coal segment
Q1 2012 Q1 2011 % chg ex-FX P&L (EUR m) Revenues 314 342 (8%) (7%) EBITDA 54 81 (33%) (35%) Operating profit 13 40 (66%) (72%) Production & Sales (kt) Coal production 2,389 2,582 (7%) Sales to coke segment 140 158 (11%) External sales 2,289 2,637 (13%)
Coking coal 1,290 1,169 10% Thermal coal 999 1,468 (32%)
Period end inventory 264 46 474% Average realised prices2 (EUR/t) Coking coal 141 154 (8%) (6%) Thermal coal 75 67 12% 15% Costs (EUR/t) Mining unit costs3 97 90 8% 11% Total coal production in Q1 2012 was 7% below the level in the same period of 2011, and external coal sales were 13% lower year-on-year mainly due to lower volumes of thermal coal, whereas external coking coal sales volumes marked a 10% year-on-year increase. Thus revenues for the coal segment decreased by 8% mainly due to lower thermal coal revenues which were only partly offset by higher revenues from coking coal.
External coking coal sales in Q1 2012 comprised approximately 52% hard coking coal and 41% semi-soft coking coal, and 7% PCI coking coal. Thermal coal sales in the period were approximately 78% thermal coal and 22% middlings.
While the coal segment’s cost profile in Q1 2012 was flat, mining unit costs rose by 8% in the first three months of 2012 compared to Q1 2011 due to the 7% decrease in production.
The coal segment generated EBITDA of EUR 54 million, a decrease of 33% compared to Q1 2011 fully attributable to lower revenues.
2 Final realised prices can be influenced by a range of factors including, but not limited to, exchange rate fluctuations, quality mix, timing of the deliveries and flexible provisions in the individual agreements. Thus the actual realised price for the period may differ from the average agreed prices previously announced. All of the forward-looking price guidance for 2012 is based on an exchange rate of CZK/EUR of 25.00. Prices are expressed as a blended average between the different qualities of coal and are ex works. 3 Mining costs per tonne reflect the operating costs incurred in mining both coking coal and thermal coal. They exclude transportation costs and D&A.
New World Resources Plc | One Silk Street | London EC2Y 8HQ | United Kingdom Headquarters: Jachthavenweg 109h | 1081 KM Amsterdam | The Netherlands | Tel: +31 20 570 2200 I Fax: +31 20 570 2222 I E-mail: [email protected] I www.newworldresources.eu A public company incorporated in England and Wales with Company Number 7584218 6/8
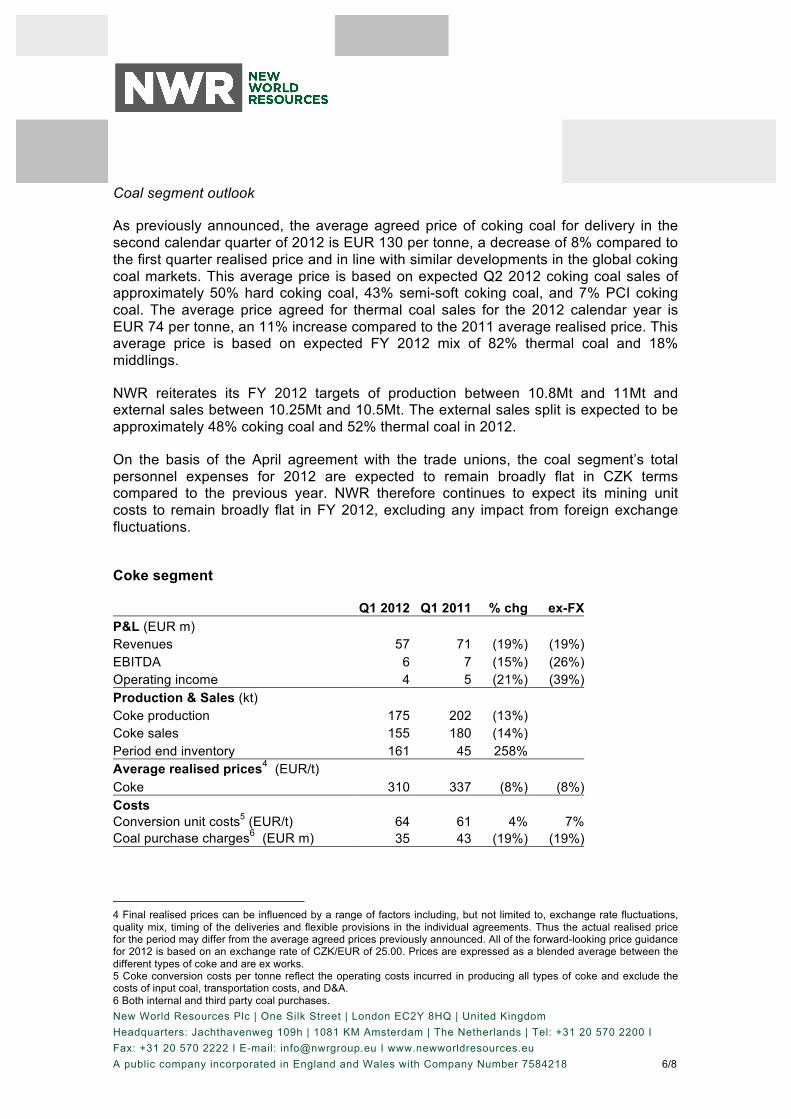
Coal segment outlook
As previously announced, the average agreed price of coking coal for delivery in the second calendar quarter of 2012 is EUR 130 per tonne, a decrease of 8% compared to the first quarter realised price and in line with similar developments in the global coking coal markets. This average price is based on expected Q2 2012 coking coal sales of approximately 50% hard coking coal, 43% semi-soft coking coal, and 7% PCI coking coal. The average price agreed for thermal coal sales for the 2012 calendar year is EUR 74 per tonne, an 11% increase compared to the 2011 average realised price. This average price is based on expected FY 2012 mix of 82% thermal coal and 18% middlings.
NWR reiterates its FY 2012 targets of production between 10.8Mt and 11Mt and external sales between 10.25Mt and 10.5Mt. The external sales split is expected to be approximately 48% coking coal and 52% thermal coal in 2012.
On the basis of the April agreement with the trade unions, the coal segment’s total personnel expenses for 2012 are expected to remain broadly flat in CZK terms compared to the previous year. NWR therefore continues to expect its mining unit costs to remain broadly flat in FY 2012, excluding any impact from foreign exchange fluctuations.
Coke segment
Q1 2012 Q1 2011 % chg ex-FX P&L (EUR m) Revenues 57 71 (19%) (19%) EBITDA 6 7 (15%) (26%) Operating income 4 5 (21%) (39%) Production & Sales (kt) Coke production 175 202 (13%) Coke sales 155 180 (14%) Period end inventory 161 45 258% Average realised prices4 (EUR/t) Coke 310 337 (8%) (8%) Costs Conversion unit costs5 (EUR/t) 64 61 4% 7% Coal purchase charges6 (EUR m) 35 43 (19%) (19%)
4 Final realised prices can be influenced by a range of factors including, but not limited to, exchange rate fluctuations, quality mix, timing of the deliveries and flexible provisions in the individual agreements. Thus the actual realised price for the period may differ from the average agreed prices previously announced. All of the forward-looking price guidance for 2012 is based on an exchange rate of CZK/EUR of 25.00. Prices are expressed as a blended average between the different types of coke and are ex works. 5 Coke conversion costs per tonne reflect the operating costs incurred in producing all types of coke and exclude the costs of input coal, transportation costs, and D&A. 6 Both internal and third party coal purchases.
New World Resources Plc | One Silk Street | London EC2Y 8HQ | United Kingdom Headquarters: Jachthavenweg 109h | 1081 KM Amsterdam | The Netherlands | Tel: +31 20 570 2200 I Fax: +31 20 570 2222 I E-mail: [email protected] I www.newworldresources.eu A public company incorporated in England and Wales with Company Number 7584218 7/8
Revenues for the coke segment decreased by 19% due to a year-on-year decrease in both sales volumes and prices in Q1 2012. Coke sales in Q1 2012 were approximately 71% foundry coke, 21% blast furnace coke, and 8% other types.
Coke conversion unit costs increased by just 4% despite the 13% drop in production. Together with the lower cost of inputted coal, the impact of lower revenues on the operating result was muted and EBITDA was EUR 6 million in Q1 2012, which is only EUR 1 million lower than EBITDA in the comparable period of 2011.
Coke segment outlook
As previously announced, the average price of coke agreed for delivery in the second calendar quarter of 2012 is EUR 298 per tonne, a 4% decrease compared to the first quarter realised price, which is mainly due to lower prices in the European foundry coke market. This average price is based on the expectation of Q2 2012 sales of approximately 67% foundry coke, 16% blast furnace coke and 16% other types.
NWR expects to produce 700kt and sell 600kt of coke in FY 2012.
Coke unit conversion costs are expected to increase in line with the expected decrease in production in FY 2012.
Q1 2012 earnings analyst conference call NWR management will host an analyst and investor conference call on 16 May 2012 at 10:00 GMT (11:00 CET) to discuss the financial results for the period. The call will include a brief Q&A session.
The presentation will be also made available via a live audio webcast on www.newworldresources.eu and the webcast will be then archived on the Company’s website.
Dial in details: UK & the rest of Europe (Toll) +44 (0) 20 7784 1036 US (Toll) +1 646 254 3361 Czech Republic (Toll free) 800 701 231 Poland (Toll free) 00 800 121 4330 The Netherlands (Toll) +31 (0) 20 721 9158
Access Code 5541511
A replay of the conference call will be available for one week by dialling: +44 (0) 20 7111 1244 (Access code: 5541511)
For further information: Investor Relations Corporate Communications Radek Nemecek Petra Masinova Tel: +31 20 570 2244 Tel: +31 20 570 2229 Email: [email protected] Email: [email protected] Website: www.newworldresources.eu
New World Resources Plc | One Silk Street | London EC2Y 8HQ | United Kingdom Headquarters: Jachthavenweg 109h | 1081 KM Amsterdam | The Netherlands | Tel: +31 20 570 2200 I Fax: +31 20 570 2222 I E-mail: [email protected] I www.newworldresources.eu A public company incorporated in England and Wales with Company Number 7584218 8/8
About NWR New World Resources Plc is one of Central Europe’s leading hard coal and coke producers. NWR produces quality coking and thermal coal for the steel and energy sectors in Central Europe through its subsidiary OKD, the largest hard coal mining company in the Czech Republic. NWR's coke subsidiary OKK, is Europe's largest producer of foundry coke. NWR currently has development projects in Poland and Czech Republic, which form part of NWR's regional growth strategy. NWR is a FTSE 250 company, with listings in London, Prague and Warsaw.
Disclaimer and Cautionary Note on Forward Looking Statements and Notes on Certain Other Matters
Certain statements in this document are not historical facts and are or are deemed to be “forward-looking”. The Company’s prospects, plans, financial position and business strategy, and statements pertaining to the capital resources, future expenditure for development projects and results of operations, may constitute forward-looking statements. In addition, forward-looking statements generally can be identified by the use of forward-looking terminology including, but not limited to; “may”, “expect”, “intend”, “estimate”, “anticipate”, “plan”, “foresee”, “will”, “could”, “may”, “might”, “believe” or “continue” or the negatives of these terms or variations of them or similar terminology. Although the Company believes that the expectations reflected in these forward-looking statements are reasonable, it can give no assurance that these expectations will prove to have been correct. These forward-looking statements involve a number of risks, uncertainties and other facts that may cause actual results to be materially different from those expressed or implied in these forward-looking statements because they relate to events and depend on circumstances that may or may not occur in the future and may be beyond NWR’s ability to control or predict. Forward-looking statements are not guarantees of future performances.
Factors, risk and uncertainties that could cause actual outcomes and results to be materially different from those projected include, but are not limited to, the following: risks relating to changes in political, economic and social conditions in the Czech Republic, Poland and the CEE region; future prices and demand for the Group's products, and demand for the Group's customers' products; coal mine reserves; remaining life of the Group's mines; coal production; trends in the coal industry and domestic and international coal market conditions; risks in coal mining operations; future expansion plans and capital expenditures; the Group's relationship with, and conditions affecting, the Group's customers; competition; railroad and other transportation performance and costs; availability of specialist and qualified workers; and weather conditions or catastrophic damage; risks relating to Czech or Polish law, regulations and taxation, including laws, regulations, decrees and decisions governing the coal mining industry, the environment and currency and exchange controls relating to Czech and Polish entities and their official interpretation by governmental and other regulatory bodies and by the courts; and risks relating to global economic conditions and the global economic environment. Additional risk factors are as described in the NWR’s annual report.
Forward-looking statements are made only as of the date of this document. The Company expressly disclaims any obligation or undertaking to release, publicly or otherwise, any updates or revisions to any forward-looking statement contained in this report to reflect any change in its expectations or any change in events, conditions, assumptions or circumstances on which any such statement is based unless so required by applicable law.
This document does not contain or constitute an offer to sell or the solicitation of an offer to buy or subscribe for any securities in the United States or in any other jurisdiction.