Condensed Consolidated Financial Statements For the six ...
25
1 Pursuant to Chapter 38 of the Rules Governing the Listing of Securities on The Stock Exchange of Hong Kong Limited, the Securities and Futures Commission regulates Hong Kong Exchanges and Clearing Limited in relation to the listing of its shares on The Stock Exchange of Hong Kong Limited. The Securities and Futures Commission takes no responsibility for the contents of this document, makes no representation as to its accuracy or completeness, and expressly disclaims any liability whatsoever for any loss howsoever arising from or in reliance upon the whole or any part of the contents of this document. Condensed Consolidated Financial Statements For the six months ended 30 June 2016 (Unaudited) At 10 August 2016, the board of directors of Hong Kong Exchanges and Clearing Limited (HKEX) comprises 12 Independent Non-executive Directors, namely Mr CHOW Chung Kong (Chairman), Mr Apurv BAGRI, Mr CHAN Tze Ching, Ignatius, Mr Timothy George FRESHWATER, Ms FUNG Yuen Mei, Anita, Mr Rafael GIL -TIENDA, Mr John Barrie HARRISON, Dr HU Zuliu, Fred, Dr KWOK Chi Piu, Bill, Mr LEE Kwan Ho, Vincent Marshall, Mrs LEUNG KO May Yee, Margaret, and Mr John Mackay McCulloch WILLIAMSON, and one Executive Director, Mr LI Xiaojia, Charles, who is also HKEX’s Chief Executive. (Incorporated in Hong Kong with limited liability) (Stock Code: 388)
Transcript of Condensed Consolidated Financial Statements For the six ...

1
Pursuant to Chapter 38 of the Rules Governing the Listing of Securities on The Stock Exchange of Hong Kong Limited, the Securities and Futures Commission regulates Hong Kong Exchanges and Clearing Limited in relation to the listing of its shares on The Stock Exchange of Hong Kong Limited. The Securities and Futures Commission takes no responsibility for the contents of this document, makes no representation as to its accuracy or completeness, and expressly disclaims any liability whatsoever for any loss howsoever arising from or in reliance upon the whole or any part of the contents of this document.
Condensed Consolidated Financial Statements
For the six months ended 30 June 2016
(Unaudited)
At 10 August 2016, the board of directors of Hong Kong Exchanges and Clearing Limited (HKEX) comprises 12 Independent Non-executive Directors, namely Mr CHOW Chung Kong (Chairman), Mr Apurv BAGRI, Mr CHAN Tze Ching, Ignatius, Mr Timothy George FRESHWATER, Ms FUNG Yuen Mei, Anita, Mr Rafael GIL-TIENDA, Mr John Barrie HARRISON, Dr HU Zuliu, Fred, Dr KWOK Chi Piu, Bill, Mr LEE Kwan Ho, Vincent Marshall, Mrs LEUNG KO May Yee, Margaret, and Mr John Mackay McCulloch WILLIAMSON, and one Executive Director, Mr LI Xiaojia, Charles, who is also HKEX’s Chief Executive.
(Incorporated in Hong Kong with limited liability)
(Stock Code: 388)

2
CONDENSED CONSOLIDATED INCOME STATEMENT (UNAUDITED) (Financial figures are expressed in Hong Kong Dollar)
Note
Six months ended
30 Jun 2016 $m
Six months ended 30 Jun 2015 $m
Trading fees and trading tariff 3 2,255 2,941
Stock Exchange listing fees 531 564
Clearing and settlement fees 1,187 1,676
Depository, custody and nominee services fees 473 483
Market data fees 404 386
Other revenue 406 407
REVENUE 2 5,256 6,457
Investment income 410 402
Interest rebates to Participants (55) (11)
Net investment income 4 355 391
Sundry income 19 5
REVENUE AND OTHER INCOME 5,630 6,853
OPERATING EXPENSES
Staff costs and related expenses 5 (1,016) (1,034)
Information technology and computer maintenance expenses (251) (251)
Premises expenses (162) (139)
Product marketing and promotion expenses
(21) (21)
Legal and professional fees (46) (29)
Other operating expenses:
Reversal of provision for impairment losses arising from Participants’ default on market contracts 6 -
77
Others (192) (183)
(1,688) (1,580)
EBITDA* 3,942 5,273
Depreciation and amortisation (382) (325)
OPERATING PROFIT 3,560 4,948
Finance costs 7 (43) (77)
Share of loss of a joint venture (5) (5)
PROFIT BEFORE TAXATION 2 3,512 4,866
TAXATION 8 (540) (783)
PROFIT FOR THE PERIOD 2,972 4,083
PROFIT/(LOSS) ATTRIBUTABLE TO:
- Shareholders of HKEX
- x
2,985 4,095
- Non-controlling interests (13) (12)
2,972 4,083
Basic earnings per share 9(a) $2.47 $3.49
Diluted earnings per share 9(b) $2.47 $3.47
* EBITDA represents earnings before interest expenses and other finance costs, taxation, depreciation and amortisation. It
excludes the Group’s share of results of the joint venture.
3
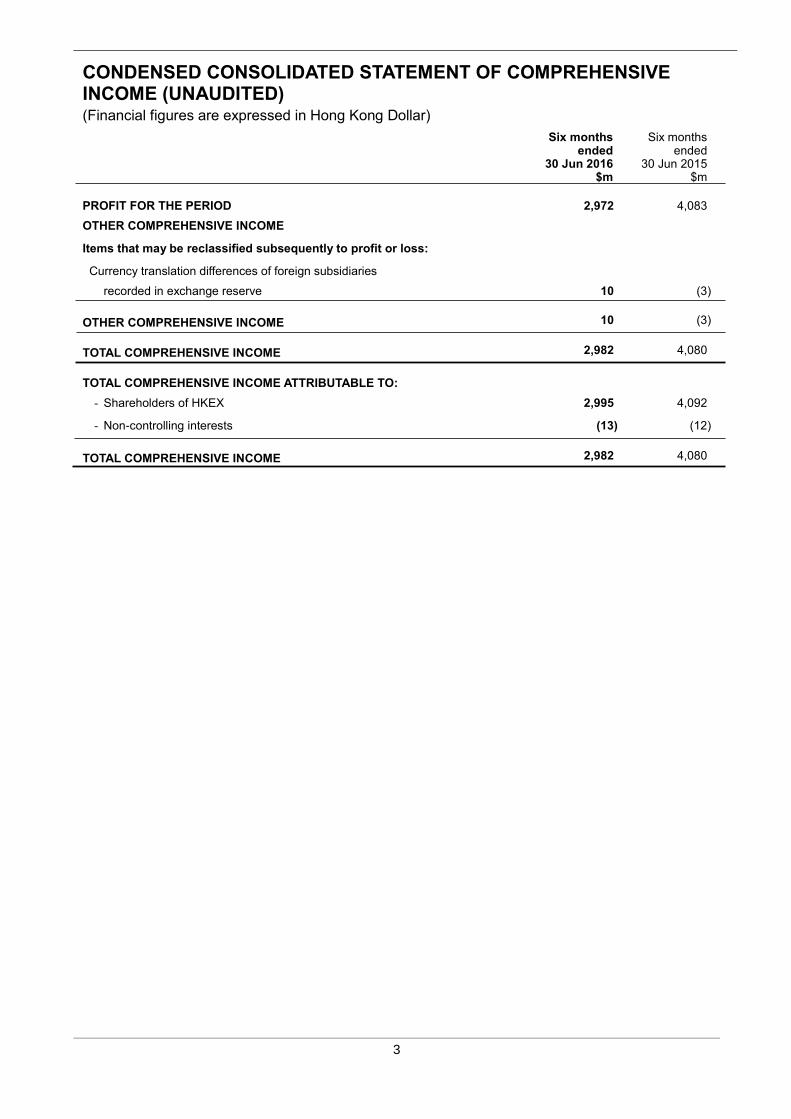
CONDENSED CONSOLIDATED STATEMENT OF COMPREHENSIVE INCOME (UNAUDITED) (Financial figures are expressed in Hong Kong Dollar)
Six months ended
30 Jun 2016 $m
Six months ended
30 Jun 2015 $m
PROFIT FOR THE PERIOD 2,972 4,083
OTHER COMPREHENSIVE INCOME
Items that may be reclassified subsequently to profit or loss:
Currency translation differences of foreign subsidiaries
recorded in exchange reserve
10
(3)
OTHER COMPREHENSIVE INCOME 10 (3)
TOTAL COMPREHENSIVE INCOME 2,982 4,080
TOTAL COMPREHENSIVE INCOME ATTRIBUTABLE TO:
- Shareholders of HKEX 2,995 4,092
- Non-controlling interests (13) (12)
TOTAL COMPREHENSIVE INCOME 2,982 4,080

4
CONDENSED CONSOLIDATED STATEMENT OF FINANCIAL POSITION (UNAUDITED) (Financial figures are expressed in Hong Kong Dollar)
At 30 Jun 2016 At 31 Dec 2015
Note
Current
$m
Non-current
$m
Total
$m
Current
$m
Non-current
$m
Total
$m
ASSETS
Cash and cash equivalents 11 98,053 - 98,053 110,890 - 110,890
Financial assets measured at fair value
through profit or loss
11
56,265
-
56,265
72,705
-
72,705
Financial assets measured at amortised cost 11 24,224 62 24,286 19,439 57 19,496
Accounts receivable, prepayments and deposits 11, 12 7,903 21 7,924 15,535 21 15,556
Taxation recoverable 2 - 2 2 - 2
Interest in a joint venture - 63 63 - 68 68
Goodwill and other intangible assets - 17,842 17,842 - 17,872 17,872
Fixed assets - 1,491 1,491 - 1,560 1,560
Lease premium for land - 21 21 - 22 22
Deferred tax assets - 32 32 - 22 22
Total assets 186,447 19,532 205,979 218,571 19,622 238,193
LIABILITIES AND EQUITY
Liabilities
Financial liabilities at fair value through profit or loss 13 47,850 - 47,850 64,486 - 64,486
Margin deposits, Mainland security and settlement
deposits, and cash collateral from Clearing
Participants
14
106,005
- 106,005
115,213
-
115,213
Accounts payable, accruals and other liabilities 15 8,073 22 8,095 15,270 15 15,285
Deferred revenue 495 - 495 773 - 773
Taxation payable 845 - 845 653 - 653
Other financial liabilities 49 - 49 42 - 42
Participants’ contributions to Clearing House Funds 16 7,196 -
-
7,196 7,474 - 7,474
Borrowings 17 - 3,418 3,418 - 3,409 3,409
Provisions 84 68 152 65 70 135
Deferred tax liabilities - 754 754 - 761 761
Total liabilities 170,597 4,262 174,859 203,976 4,255 208,231
Equity
Share capital 18 20,816 19,285
Shares held for Share Award Scheme 18 (578) (590)
Employee share-based compensation reserve 19 281 199
Exchange reserve (244) (254)
Designated reserves 20 776 778
Reserve relating to written put options to
non-controlling interests
(293)
(293)
Retained earnings 10,229 10,691
Equity attributable to shareholders of HKEX 30,987 29,816
Non-controlling interests 133 146
Total equity 31,120 29,962
Total liabilities and equity 205,979 238,193
Net current assets 15,850 14,595
5
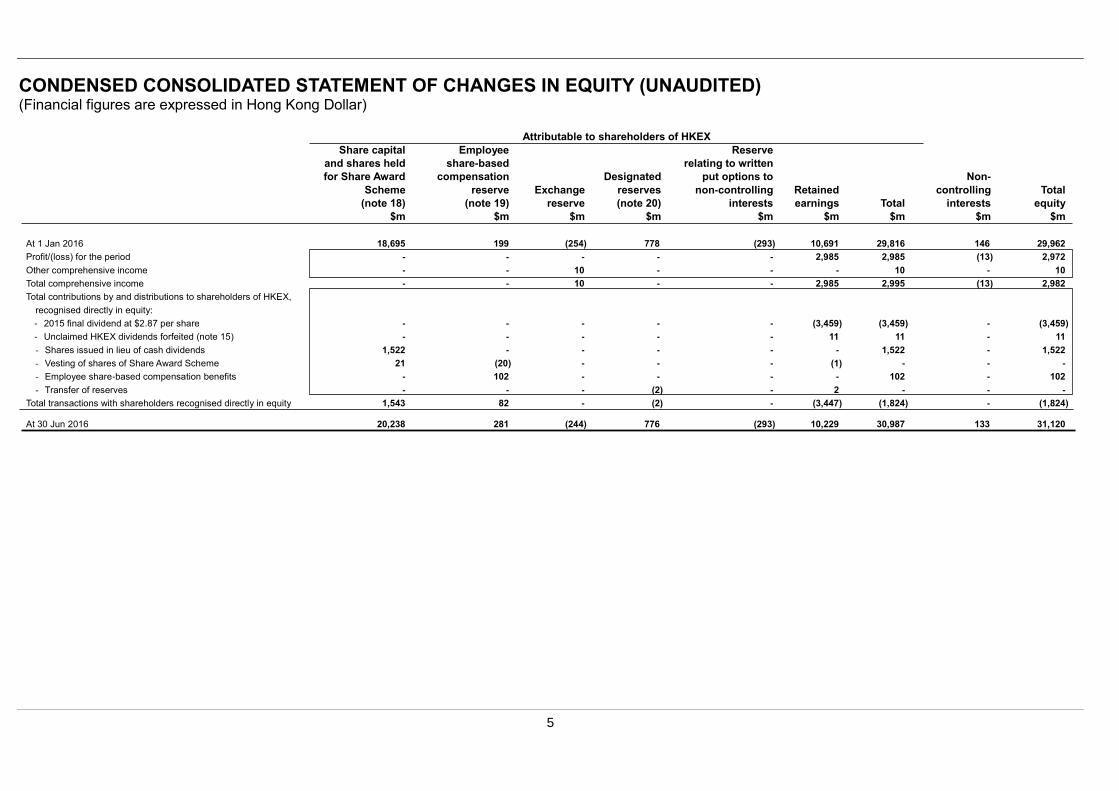
CONDENSED CONSOLIDATED STATEMENT OF CHANGES IN EQUITY (UNAUDITED) (Financial figures are expressed in Hong Kong Dollar)
Attributable to shareholders of HKEX
Share capital
and shares held
for Share Award
Scheme
(note 18)
$m
Employee
share-based
compensation
reserve
(note 19)
$m
Exchange
reserve
$m
Designated
reserves
(note 20)
$m
Reserve
relating to written
put options to
non-controlling
interests
$m
Retained
earnings
$m
Total
$m
Non-
controlling
interests
$m
Total
equity
$m
At 1 Jan 2016 18,695 199 (254) 778 (293) 10,691 29,816 146 29,962
Profit/(loss) for the period - - - - - 2,985 2,985 (13) 2,972
Other comprehensive income - - 10 - - - 10 - 10
Total comprehensive income - - 10 - - 2,985 2,995 (13) 2,982
Total contributions by and distributions to shareholders of HKEX,
recognised directly in equity:
- 2015 final dividend at $2.87 per share - - - - - (3,459) (3,459) - (3,459)
- Unclaimed HKEX dividends forfeited (note 15) - - - - - 11 11 - 11
- Shares issued in lieu of cash dividends 1,522 - - - - - 1,522 - 1,522
- Vesting of shares of Share Award Scheme 21 (20) - - - (1) - - -
- Employee share-based compensation benefits - 102 - - - - 102 - 102
- Transfer of reserves - - - (2) - 2 - - -
Total transactions with shareholders recognised directly in equity 1,543 82 - (2) - (3,447) (1,824) - (1,824)
At 30 Jun 2016 20,238 281 (244) 776 (293) 10,229 30,987 133 31,120

6
CONDENSED CONSOLIDATED STATEMENT OF CHANGES IN EQUITY (UNAUDITED) (Financial figures are expressed in Hong Kong Dollar)
Attributable to shareholders of HKEX
Share capital
and shares held
for Share Award
Scheme
$m
Employee
share-based
compensation
reserve
$m
Exchange
reserve
$m
Convertible
bond reserve
$m
Designated
reserves
$m
Reserve
relating to written
put options to
non-controlling
interests
$m
Retained
earnings
$m
Total
$m
Non-
controlling
interests
$m
Total
equity
$m
At 1 Jan 2015 11,743 142 (247) 409 643 (217) 8,800 21,273 86 21,359
Profit/(loss) for the period - - - - - - 4,095 4,095 (12) 4,083
Other comprehensive income - - (3) - - - - (3) - (3)
Total comprehensive income - - (3) - - - 4,095 4,092 (12) 4,080
Total contributions by and distributions to shareholders of HKEX,
recognised directly in equity:
- 2014 final dividend at $2.15 per share - - - - - - (2,533) (2,533) - (2,533)
- Unclaimed HKEX dividends forfeited (note 15) - - - - - - 9 9 - 9
- Shares issued upon exercise of employee share options 3 - - - - - - 3 - 3
- Shares issued in lieu of cash dividends 1,293 - - - - - - 1,293 - 1,293
- Vesting of shares of Share Award Scheme 13 (13) - - - - - - - -
- Employee share-based compensation benefits - 80 - - - - - 80 - 80
- Tax credit relating to Share Award Scheme (note 8(b)) - - - - - - 6 6 - 6
- Conversion of convertible bonds 3,877 - - (409) - - 266 3,734 - 3,734
- Transfer of reserves - - - - (1) - 1 - - -
- Transfer of reserves – surplus of reversal of provision for
closing-out losses by a defaulting Clearing Participant
-
-
-
-
100
-
(100)
-
-
-
Total changes in ownership interests in subsidiaries that do not
result in a loss of control:
- Changes in ownership interest in a subsidiary - - - - - - (35) (35) 35 -
Total transactions with shareholders recognised directly in equity 5,186 67 - (409) 99 - (2,386) 2,557 35 2,592
At 30 Jun 2015 16,929 209 (250) - 742 (217) 10,509 27,922 109 28,031
7
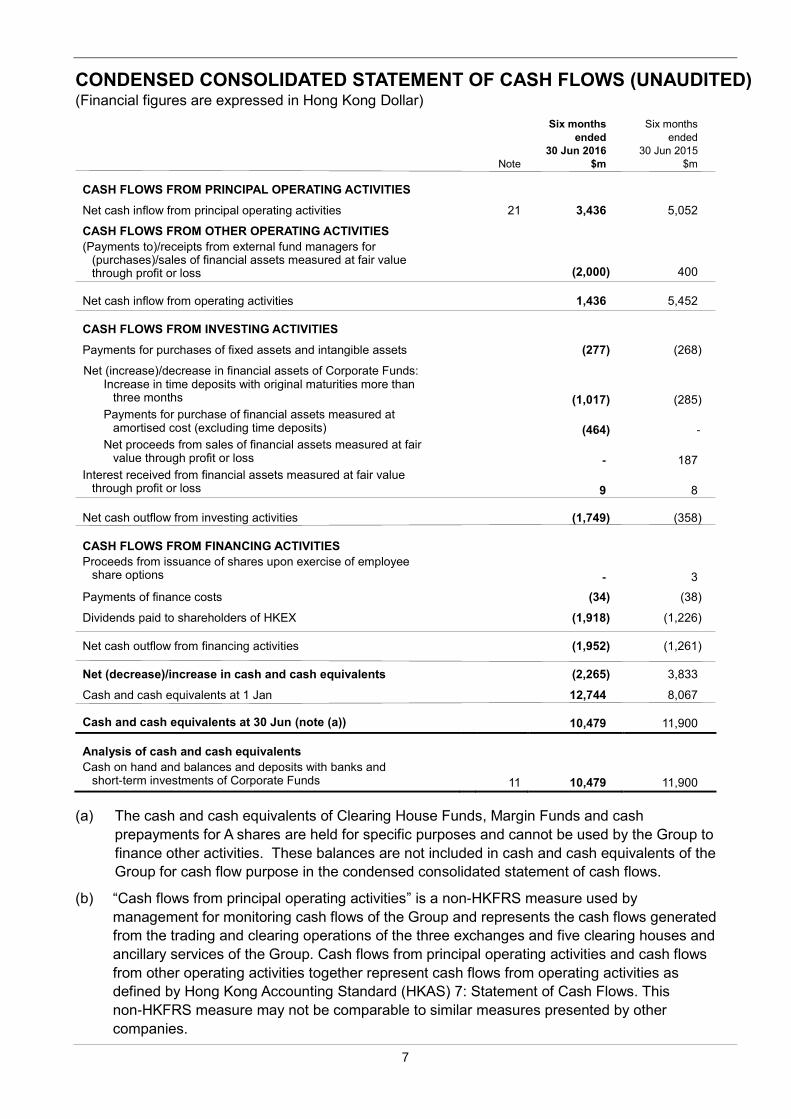
CONDENSED CONSOLIDATED STATEMENT OF CASH FLOWS (UNAUDITED) (Financial figures are expressed in Hong Kong Dollar)
Note
Six months
ended
30 Jun 2016
$m
Six months
ended
30 Jun 2015
$m
CASH FLOWS FROM PRINCIPAL OPERATING ACTIVITIES
Net cash inflow from principal operating activities 21 3,436 5,052
CASH FLOWS FROM OTHER OPERATING ACTIVITIES
(Payments to)/receipts from external fund managers for (purchases)/sales of financial assets measured at fair value through profit or loss
(2,000)
400
Net cash inflow from operating activities 1,436 5,452
CASH FLOWS FROM INVESTING ACTIVITIES
Payments for purchases of fixed assets and intangible assets (277) (268)
Net (increase)/decrease in financial assets of Corporate Funds: Increase in time deposits with original maturities more than
three months
(1,017) (285)
Payments for purchase of financial assets measured at amortised cost (excluding time deposits)
(464) -
Net proceeds from sales of financial assets measured at fair value through profit or loss
- 187
Interest received from financial assets measured at fair value through profit or loss
9 8
Net cash outflow from investing activities (1,749) (358)
CASH FLOWS FROM FINANCING ACTIVITIES
Proceeds from issuance of shares upon exercise of employee share options
- 3
Payments of finance costs (34) (38)
Dividends paid to shareholders of HKEX (1,918) (1,226)
Net cash outflow from financing activities (1,952) (1,261)
Net (decrease)/increase in cash and cash equivalents
-+.increase in cash and cash equivalents
(2,265) 3,833
Cash and cash equivalents at 1 Jan 12,744 8,067
Cash and cash equivalents at 30 Jun (note (a)) 10,479 11,900
Analysis of cash and cash equivalents
Cash on hand and balances and deposits with banks and short-term investments of Corporate Funds
11 10,479 11,900
(a) The cash and cash equivalents of Clearing House Funds, Margin Funds and cash
prepayments for A shares are held for specific purposes and cannot be used by the Group to
finance other activities. These balances are not included in cash and cash equivalents of the
Group for cash flow purpose in the condensed consolidated statement of cash flows.
(b) “Cash flows from principal operating activities” is a non-HKFRS measure used by
management for monitoring cash flows of the Group and represents the cash flows generated
from the trading and clearing operations of the three exchanges and five clearing houses and
ancillary services of the Group. Cash flows from principal operating activities and cash flows
from other operating activities together represent cash flows from operating activities as
defined by Hong Kong Accounting Standard (HKAS) 7: Statement of Cash Flows. This
non-HKFRS measure may not be comparable to similar measures presented by other
companies.

8
NOTES TO THE CONDENSED CONSOLIDATED FINANCIAL STATEMENTS (UNAUDITED)
(Financial figures are expressed in Hong Kong Dollar unless otherwise stated)
1. Basis of Preparation and Accounting Policies
These unaudited condensed consolidated financial statements are prepared in accordance with
HKAS 34: Interim Financial Reporting, issued by the Hong Kong Institute of Certified Public
Accountants.
These unaudited condensed consolidated financial statements should be read in conjunction with
the 2015 annual consolidated financial statements. The accounting policies and methods of
computation used in the preparation of these condensed consolidated financial statements are
consistent with those used in the annual consolidated financial statements for the year ended 31
December 2015. Amendments to Hong Kong Financial Reporting Standards (HKFRSs) effective
for the financial year ending 31 December 2016 do not have any financial impact to the Group.
The financial information relating to the year ended 31 December 2015 that is included in these
unaudited condensed consolidated financial statements for the six months ended 30 June 2016 as
comparative information does not constitute the statutory annual consolidated financial statements
of Hong Kong Exchanges and Clearing Limited (HKEX or the Company) for that year but is derived
from those consolidated financial statements. Further information relating to these statutory
financial statements required to be disclosed in accordance with section 436 of the Hong Kong
Companies Ordinance (Chapter 622) is as follows:
The Company has delivered the consolidated financial statements for the year ended 31 December
2015 to the Registrar of Companies as required by section 662(3) of, and Part 3 of Schedule 6 to,
the Hong Kong Companies Ordinance (Chapter 622).
The Company’s auditor has reported on those consolidated financial statements. The auditor’s
report was unqualified; did not include a reference to any matters to which the auditor drew
attention by way of emphasis without qualifying its report; and did not contain a statement under
sections 406(2), 407(2) or (3) of the Hong Kong Companies Ordinance (Chapter 622).
2. Operating Segments
HKEX and its subsidiaries (collectively the Group) determine its operating segments based on the
reports that are used to make strategic decisions reviewed by the chief operating decision-maker.
The Group has five reportable segments (“Corporate Items” is not a reportable segment). The
segments are managed separately as each segment offers different products and services and
requires different information technology systems and marketing strategies. The operations in
each of the Group’s reportable segments are as follows:
The Cash segment covers all equity products traded on the Cash Market platforms and the
Shanghai Stock Exchange through the Shanghai-Hong Kong Stock Connect (Stock Connect),
sales of market data relating to these products and other related activities. The major sources of
revenue of the segment are trading fees, trading tariff and listing fees of equity products and market
data fees.
9
NOTES TO THE CONDENSED CONSOLIDATED FINANCIAL STATEMENTS (UNAUDITED) (CONT’D)
2. Operating Segments (continued)
The Equity and Financial Derivatives segment refers to derivatives products traded on Hong
Kong Futures Exchange Limited (Futures Exchange) and The Stock Exchange of Hong Kong
Limited (Stock Exchange) and other related activities. These include the provision and
maintenance of trading platforms for a range of equity and financial derivatives products, such as
stock and equity index futures and options, derivative warrants (DWs), callable bull/bear contracts
(CBBCs) and warrants and sales of market data relating to these products. The major sources of
revenue are trading fees, trading tariff and listing fees of derivatives products and market data fees.
The Commodities segment refers to the operations of The London Metal Exchange (LME), which
operates an exchange in the United Kingdom (UK) for the trading of base metals futures and
options contracts and the development and operations of the new commodity trading platform in
the Mainland. It also covers the Asia Commodities contracts traded on the Futures Exchange. The
major sources of revenue of the segment are trading fees, commodity market data fees and fees
generated from other ancillary operations.
The Clearing segment refers to the operations of the five clearing houses, namely Hong Kong
Securities Clearing Company Limited (HKSCC), The SEHK Options Clearing House Limited
(SEOCH), HKFE Clearing Corporation Limited (HKCC), OTC Clearing Hong Kong Limited (OTC
Clear) and LME Clear Limited (LME Clear), which are responsible for clearing, settlement and
custodian activities of the Stock Exchange, the Futures Exchange and the Shanghai Stock
Exchange through Stock Connect, clearing and settlement of over-the-counter derivatives
contracts, and clearing and settlement of base metals futures and options contracts traded on the
LME. Its principal sources of revenue are derived from providing clearing, settlement, depository,
custody and nominee services and net investment income earned on Margin Funds and Clearing
House Funds.
The Platform and Infrastructure segment refers to all services in connection with providing users
with access to the platform and infrastructure of the Group. Its major sources of revenue are
network, terminal user, dataline and software sub-license fees, trading booth user fees and hosting
services fees.
Central income (including net investment income of Corporate Funds) and central costs (costs of
central support functions that provide services to all of the operating segments, finance costs and
other costs not directly related to any of the operating segments) are included as “Corporate Items”.
The chief operating decision-maker assesses the performance of the operating segments
principally based on their EBITDA. An analysis by operating segment of the Group’s EBITDA and
profit before taxation for the period is as follows:

10
NOTES TO THE CONDENSED CONSOLIDATED FINANCIAL STATEMENTS (UNAUDITED) (CONT’D)
2. Operating Segments (continued)
Six months ended 30 Jun 2016
Cash
$m
Equity and
Financial
Derivatives
$m
Commodities
$m
Clearing
$m
Platform
and
Infrastructure
$m
Corporate
Items
$m
Group
$m
Revenue from external customers 1,282 1,065 804 1,838 264 3 5,256
Net investment income - - - 273 - 82 355
Sundry income - - - 11 - 8 19
Revenue and other income 1,282 1,065 804 2,122 264 93 5,630
Operating expenses (270) (229) (291) (352) (74) (472) (1,688)
3,\ Reportable segment EBITDA 1,012 836 513 1,770 190 (379) 3,942
Depreciation and amortisation (44) (45) (147) (88) (22) (36) (382)
Finance costs - - - - - (43) (43)
Share of loss of a joint venture - (5) - - - - (5)
Reportable segment profit before
taxation 968 786 366 1,682 168 (458) 3,512
Six months ended 30 Jun 2015
Cash
$m
Equity and
Financial
Derivatives
$m
Commodities
$m
Clearing
$m
Platform
and
Infrastructure
$m
Corporate
Items
$m
Group
$m
Revenue from external customers 1,886 1,100 886 2,335 248 2 6,457
Net investment income - - - 317 - 74 391
Sundry income - - - 5 - - 5
Revenue and other income 1,886 1,100 886 2,657 248 76 6,853
Operating expenses (276) (236) (254) (309) (74) (431) (1,580)
3,\ Reportable segment EBITDA 1,610 864 632 2,348 174 (355) 5,273
Depreciation and amortisation (49) (36) (129) (69) (22) (20) (325)
Finance costs - - - - - (77) (77)
Share of loss of a joint venture - (5) - - - - (5)
Reportable segment profit before
taxation 1,561 823 503 2,279 152 (452) 4,866
3. Trading Fees and Trading Tariff
Six months
ended
30 Jun 2016
$m
Six months
ended
30 Jun 2015
$m
Trading fees and trading tariff were derived from:
Equity securities traded on the Stock Exchange and the Shanghai Stock
Exchange through Stock Connect
678
1,321
DWs, CBBCs and warrants traded on the Stock Exchange 279 408
Futures and options contracts traded on the Stock Exchange and the Futures
Exchange
654
491
Base metals futures and options contracts traded on the LME 644 721
2,255 2,941

11
NOTES TO THE CONDENSED CONSOLIDATED FINANCIAL STATEMENTS (UNAUDITED) (CONT’D)
4. Net Investment Income
Six months
ended
30 Jun 2016
$m
Six months
ended
30 Jun 2015
$m
Gross interest income from financial assets measured at amortised cost 359 357
Interest rebates to Participants (55) (11)
Net interest income 304 346
Net fair value gains including interest income on financial assets
mandatorily measured at fair value through profit or loss and financial
liabilities at fair value through profit or loss
68
(1(17
57
Others (17) (12)
Net investment income 355 391
5. Staff Costs and Related Expenses
Staff costs and related expenses comprised the following:
Six months
ended
30 Jun 2016
$m
Six months
ended
30 Jun 2015
$m
Salaries and other short-term employee benefits 843 879
Employee share-based compensation benefits of HKEX Share Award
Scheme (Share Award Scheme)
102
80
Termination benefits 2 7
Retirement benefit costs (note 24(b)) 69 68
1,016 1,034
6. Reversal of Provision for Impairment Losses Arising from Participants’ Default on Market
Contracts
During the six months ended 30 June 2015, the liquidators of Lehman Brothers Securities Asia
Limited paid dividends of $77 million, and these were recognised within operating expenses in the
Group’s condensed consolidated income statement, as a reversal of a provision for impairment
losses recognised in prior years.

12
NOTES TO THE CONDENSED CONSOLIDATED FINANCIAL STATEMENTS (UNAUDITED) (CONT’D)
7. Finance Costs
Six months
ended
30 Jun 2016
$m
Six months
ended
30 Jun 2015
$m
Interest expenses on borrowings 40 78
Net foreign exchange losses/(gains) on financing activities 3 (1)
43 77
8. Taxation
Hong Kong Profits Tax has been provided at the rate of 16.5 per cent (2015: 16.5 per cent) and
overseas profits tax at the rates of taxation prevailing in the countries in which the Group
operates, with the average corporation rate applicable to the subsidiaries in the UK being 20 per
cent (2015: 20.25 per cent).
(a) Taxation charge/(credit) in the condensed consolidated income statement represented:
Six months
ended
30 Jun 2016
$m
Six months
ended
30 Jun 2015
$m
Current tax - Hong Kong Profits Tax 447 648
Current tax - Overseas Tax 111 172
558 820
Deferred tax (18) (37)
540 783
(b) Taxation credited directly to retained earnings represented:
Six months
ended
30 Jun 2016
$m
Six months
ended
30 Jun 2015
$m
Current tax – Overseas Tax - (2)
Deferred tax - (4)
- (6)
Under the tax rules in the UK, tax deduction on employee share awards is available at the
time of vesting based on the prevailing market value. The tax credits in 2015 were related to
tax deductions arising from increases in the value of Awarded Shares to employees of the
LME Group under the Share Award Scheme since award date. The amount of taxation
charged directly to retained earnings in 2016 was under $1 million.

13
NOTES TO THE CONDENSED CONSOLIDATED FINANCIAL STATEMENTS (UNAUDITED) (CONT’D)
9. Earnings Per Share
The calculation of the basic and diluted earnings per share is as follows:
(a) Basic earnings per share
Six months
ended
30 Jun 2016
Six months
ended
30 Jun 2015
Profit attributable to shareholders ($m) 2,985 4,095
Weighted average number of shares in issue
less shares held for Share Award Scheme (in ’000)
1,206,736
1,172,838
Basic earnings per share ($) 2.47 3.49
(b) Diluted earnings per share
Six months
ended
30 Jun 2016
Six months
ended
30 Jun 2015
Profit attributable to shareholders ($m) 2,985 4,095
Interest expenses on convertible bonds (net of tax) ($m) - 41
Adjusted profit attributable to shareholders ($m) 2,985 4,136
Weighted average number of shares in issue
less shares held for Share Award Scheme (in ’000)
1,206,736
1,172,838
Effect of employee share options (in ’000) - 12
Effect of shares awarded under Share Award Scheme (in ’000)
(in ’000) (in ’000)
3,173 2,821
Effect of convertible bonds (in ’000) - 17,829
Weighted average number of shares for the purpose of
calculating diluted earnings per share (in ’000)
1,209,909
1,193,500
Diluted earnings per share ($) 2.47 3.47
10. Dividends
Six months
ended
30 Jun 2016
$m
Six months
ended
30 Jun 2015
$m
Interim dividend declared of $2.21 (2015: $3.08) per share at 30 Jun 2,690 3,688
Less: Dividend for shares held by Share Award Scheme at 30 Jun (7) (9)
2,683 3,679

14
NOTES TO THE CONDENSED CONSOLIDATED FINANCIAL STATEMENTS (UNAUDITED) (CONT’D)
11. Financial Assets
The financial assets of Clearing House Funds, Margin Funds, base metals derivatives contracts,
cash prepayments for A shares and Corporate Funds are allocated into cash and cash equivalents,
financial assets measured at fair value through profit or loss, financial assets measured at
amortised cost, and accounts receivable and deposits, details of which are as follows:
At
30 Jun 2016
$m
At
31 Dec 2015
$m
Clearing House Funds (note 16)
Cash and cash equivalents 8,000 8,210
Financial assets measured at amortised cost 156 220
8,156 8,430
Margin Funds (note 14)
Cash and cash equivalents 79,574 89,807
Financial assets measured at fair value through profit or loss 3,913 5,844
Financial assets measured at amortised cost 22,133 18,765
Accounts receivable and deposits 385 797
106,005 115,213
Base metals derivatives contracts
Financial assets measured at fair value through profit or loss (note (a)) 47,843 64,480
Cash prepayments for A shares
Cash and cash equivalents - 129
Corporate Funds
Cash and cash equivalents 10,479 12,744
Financial assets measured at fair value through profit or loss 4,509 2,381
Financial assets measured at amortised cost 1,997 511
16,985 15,636
178,989 203,888
The expected maturity dates of the financial assets are analysed as follows:
At 30 Jun 2016 At 31 Dec 2015
Clearing
House
Funds
$m
Margin
Funds
$m
Base
metals
derivatives
contracts
$m
Cash
prepayments
for
A shares
$m
Corporate
Funds
$m
Total
$m
Clearing
House
Funds
$m
Margin
Funds
$m
Base
metals
derivatives
contracts
$m
Cash
prepayments
for
A shares
$m
Corporate
Funds
$m
Total
$m
Within twelve months 8,156 106,005 47,843 - 16,923 178,927 8,430 115,213 64,480 129 15,579 203,831
Over twelve months - - - - 62 62 - - - - 57 57
8,156 106,005 47,843 - 16,985 178,989 8,430 115,213 64,480 129 15,636 203,888
(a) The amount represents the fair value of outstanding base metals futures and options
contracts of LME Clear that do not qualify for netting under HKAS 32: Financial Instruments:
Presentation, where LME Clear is acting in its capacity as a central counterparty to the
contracts traded on the LME. A corresponding amount was recorded under financial
liabilities at fair value through profit or loss (note 13).
15
NOTES TO THE CONDENSED CONSOLIDATED FINANCIAL STATEMENTS (UNAUDITED) (CONT’D)
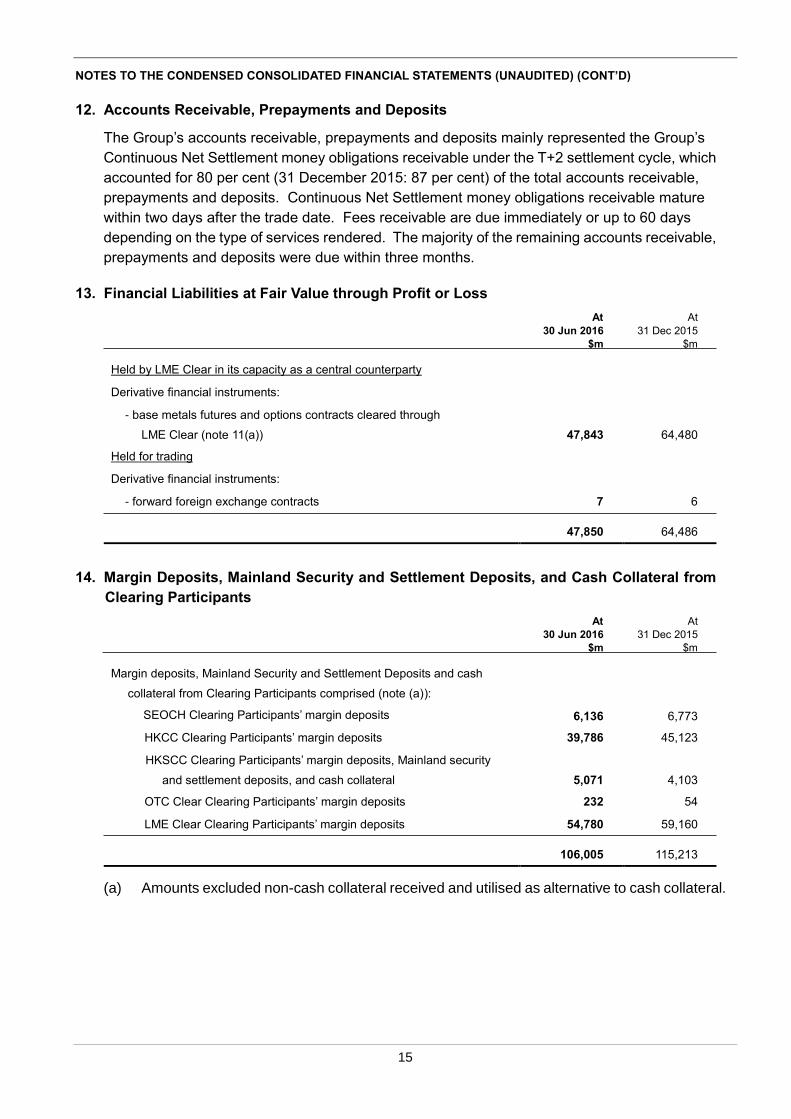
12. Accounts Receivable, Prepayments and Deposits
The Group’s accounts receivable, prepayments and deposits mainly represented the Group’s
Continuous Net Settlement money obligations receivable under the T+2 settlement cycle, which
accounted for 80 per cent (31 December 2015: 87 per cent) of the total accounts receivable,
prepayments and deposits. Continuous Net Settlement money obligations receivable mature
within two days after the trade date. Fees receivable are due immediately or up to 60 days
depending on the type of services rendered. The majority of the remaining accounts receivable,
prepayments and deposits were due within three months.
13. Financial Liabilities at Fair Value through Profit or Loss
At
30 Jun 2016
$m
At
31 Dec 2015
$m
Held by LME Clear in its capacity as a central counterparty
Derivative financial instruments:
- base metals futures and options contracts cleared through
LME Clear (note 11(a))
47,843
64,480
Held for trading
Derivative financial instruments:
- forward foreign exchange contracts 7 6
47,850 64,486
14. Margin Deposits, Mainland Security and Settlement Deposits, and Cash Collateral from
Clearing Participants
At
30 Jun 2016
$m
At
31 Dec 2015
$m
Margin deposits, Mainland Security and Settlement Deposits and cash
collateral from Clearing Participants comprised (note (a)):
SEOCH Clearing Participants’ margin deposits 6,136 6,773
HKCC Clearing Participants’ margin deposits 39,786 45,123
HKSCC Clearing Participants’ margin deposits, Mainland security
and settlement deposits, and cash collateral
5,071
4,103
OTC Clear Clearing Participants’ margin deposits 232 54
LME Clear Clearing Participants’ margin deposits 54,780 59,160
106,005 115,213
(a) Amounts excluded non-cash collateral received and utilised as alternative to cash collateral.

16
NOTES TO THE CONDENSED CONSOLIDATED FINANCIAL STATEMENTS (UNAUDITED) (CONT’D)
15. Accounts Payable, Accruals and Other Liabilities
The Group’s accounts payable, accruals and other liabilities mainly represented the Group’s
Continuous Net Settlement money obligations payable, which accounted for 79 per cent (31
December 2015: 89 per cent) of the total accounts payable, accruals and other liabilities.
Continuous Net Settlement money obligations payable mature within two days after the trade
date. The majority of the remaining accounts payable, accruals and other liabilities would mature
within three months.
During the six months ended 30 June 2016, $11 million (2015: $9 million) of dividends declared by
HKEX, which were unclaimed over a period of six years from the date of payment, were forfeited
and transferred to retained earnings in accordance with HKEX’s Articles of Association.
16. Clearing House Funds
At
30 Jun 2016
$m
At
31 Dec 2015
$m
The Clearing House Funds comprised:
Clearing Participants’ cash contributions (note (a)) 7,196 7,474
Contribution to OTC Clear Rates and FX Guarantee Resources
156 156
Designated reserves (note 20) 776 778
8,128 8,408
The Clearing House Funds were invested in the following instruments
for managing the obligations of the Funds:
Financial assets of Clearing House Funds (note 11) 8,156 8,430
Less: Other financial liabilities of Clearing House Funds (28) (22)
8,128 8,408
The Clearing House Funds comprised the following Funds:
HKSCC Guarantee Fund 2,718 2,926
SEOCH Reserve Fund 502 542
HKCC Reserve Fund 1,032 1,134
OTC Clear Rates and FX Guarantee Fund 556 505
OTC Clear Rates and FX Guarantee Resources 159 158
LME Clear Default Fund 3,161 3,143
8,128 8,408
(a) Amounts excluded non-cash collateral received and utilised as alternatives to cash
contributions.

17
NOTES TO THE CONDENSED CONSOLIDATED FINANCIAL STATEMENTS (UNAUDITED) (CONT’D)
17. Borrowings
At
30 Jun 2016
$m
At
31 Dec 2015
$m
Bank borrowings 1,587 1,585
Notes 1,518 1,516
Written put options to non-controlling interests 313 308
Total borrowings 3,418 3,409
During the six months ended 30 June 2016, there were no repayments of the bank borrowings
or notes, and none of the written put options were exercised.
18. Share Capital, Share Premium and Shares Held for Share Award Scheme
Number
of shares ’000
Share
capital $m
Shares held for Share Award
Scheme $m
Total $m
At 1 Jan 2015 1,165,264 12,225 (482) 11,743
Shares issued upon exercise of employee share options
144
3
-
3
Shares issued in lieu of cash dividends (note (a))
- total 15,632 3,180 - 3,180
- to Share Award Scheme (73) - (15) (15)
15,559 3,180 (15) 3,165
Share purchased for Share Award Scheme (1,137) - (227) (227)
Vesting of shares of Share Award Scheme (note (b)) 853 - 134 134
Conversion of convertible bonds 24,594 3,877 - 3,877
At 31 Dec 2015 1,205,277 19,285 (590) 18,695
At 1 Jan 2016 1,205,277 19,285 (590) 18,695
Shares issued in lieu of cash dividends (note (a))
- total 8,863 1,531 - 1,531
- to Share Award Scheme (53) - (9) (9)
8,810 1,531 (9) 1,522
Vesting of shares of Share Award Scheme (note (b)) 119 - 21 21
At 30 Jun 2016 1,214,206 20,816 (578) 20,238
(a) In June 2016, 8,862,992 new fully paid HKEX shares (year ended 31 December 2015:
15,632,464 shares) were issued and allotted at $172.81 per share (year ended 31
December 2015: weighted average price of $203.39 per share) to the shareholders
(including 53,390 new shares (year ended 31 December 2015: 73,236 shares) allotted to
the Share Award Scheme) who elected to receive HKEX shares in lieu of cash dividends
pursuant to the scrip dividend scheme.
(b) During the six months ended 30 June 2016, the Share Award Scheme transferred 119,176
HKEX shares (year ended 31 December 2015: 852,317 shares) to the awardees upon
vesting of certain Awarded Shares and the shares arising from related dividends
reinvested. The total cost of the vested shares was $21 million (year ended 31 December
2015: $134 million).

18
NOTES TO THE CONDENSED CONSOLIDATED FINANCIAL STATEMENTS (UNAUDITED) (CONT’D)
19. Employee Share-based Arrangements
The Group operates the Share Award Scheme as part of the benefits of its employees. Under the
Share Award Scheme, the Board is allowed to make awards as long-term incentives for selected
senior executives of the Group (Senior Executive Awards) in addition to any other awards
(Employee Share Awards) which they may be eligible to receive under the Share Award Scheme.
The employee share-based compensation expenses in relation to the share awards are charged
to profit or loss under staff costs over the relevant vesting periods with a corresponding increase
in employee share-based compensation reserve.
During the six months ended 30 June 2016, no Senior Executive Awards and Employee Share
Awards were granted.
20. Designated reserves
Designated reserves are segregated for their respective purposes and comprised the following:
At
30 Jun 2016
$m
At
31 Dec 2015
$m
Clearing House Funds reserves (note 16)
- HKSCC Guarantee Fund reserve 315 318
- SEOCH Reserve Fund reserve 104 104
- HKCC Reserve Fund reserve 350 351
- OTC Clear Rates and FX Guarantee Fund reserve
4 3
- OTC Clear Rates and FX Guarantee Resources reserve 3 2
776 778

19
NOTES TO THE CONDENSED CONSOLIDATED FINANCIAL STATEMENTS (UNAUDITED) (CONT’D)
21. Notes to the Condensed Consolidated Statement of Cash Flows
Reconciliation of profit before taxation to net cash inflow from principal operating activities:
Six months
ended
30 Jun 2016
$m
Six months
ended
30 Jun 2015
$m
Profit before taxation 3,512 4,866
Adjustments for:
Net interest income (304) (346)
Dividend income (3) (4)
Net fair value gains including interest income on financial
assets measured at fair value through profit or loss and
financial liabilities at fair value through profit or loss
(68)
(57)
Forfeiture of unclaimed cash dividends held by HKSCC
Nominees Limited
(11)
(5)
Amortisation of lease premium for land under premises expenses 1 1
Finance costs 43 77
Depreciation and amortisation 382 325
Employee share-based compensation benefits 102 80
Provision for/(reversal of provision for) impairment losses of
receivables
2
(71)
Share of loss of a joint venture 5 5
Changes in provisions 11 19
Net decrease/(increase) in financial assets of Margin Funds 9,207 (25,065)
Net (decrease)/increase in financial liabilities of Margin Funds (9,208) 25,062
Net decrease/(increase) in Clearing House Fund financial assets 274 (3,996)
Net (decrease)/increase in Clearing House Fund financial liabilities (272) 3,897
Net increase in financial assets measured at fair value through
profit or loss less financial liabilities at fair value through profit or
loss
(58)
(9)
Decrease in cash prepayments for A shares 129 619
Decrease/(increase) in accounts receivable, prepayments and
deposits
7,211
(4,515)
(Decrease)/increase in other current liabilities (7,503) 3,987
Net cash inflow from principal operations 3,452 4,870
Dividends received 2 2
Interest received from bank deposits 359 357
Interest received from financial assets measured at fair value
through profit or loss
43
26
Interest paid to Participants (55) (11)
Income tax paid (365) (192)
Net cash inflow from principal operating activities 3,436 5,052

20
NOTES TO THE CONDENSED CONSOLIDATED FINANCIAL STATEMENTS (UNAUDITED) (CONT’D)
22. Capital Expenditures and Commitments
During the six months ended 30 June 2016, the Group incurred capital expenditures of $266
million (2015: $262 million) related to renovation of new offices and the development and
upgrade of various information technology systems including the commodities trading and
clearing systems, a cash trading system, a pre-trade risk management system for Derivatives
Market, trading and clearing systems to facilitate mutual stock market access between Mainland
China and Hong Kong, and a new corporate Enterprise Resource Planning system.
At 30 June 2016, the Group’s commitments in respect of capital expenditure were as follows:
At
30 Jun 2016
$m
At
31 Dec 2015
$m
Contracted but not provided for
- fixed assets
-
19 4
- intangible assets 67 43
Authorised but not contracted for
- fixed assets
-
220 264
- intangible assets 595 650
901 961
The Group’s capital expenditure commitments were mainly related to the development and
enhancement of information technology systems including cash and commodities trading and
clearing systems, and trading and clearing systems to facilitate mutual stock market access
between Mainland China and Hong Kong.
23. Contingent Liabilities
At 30 June 2016, the Group’s material contingent liabilities were as follows:
(a) The Group had a contingent liability in respect of potential calls to be made by the Securities
and Futures Commission (SFC) to replenish all or part of compensation less recoveries
paid by the Unified Exchange Compensation Fund established under the Securities
Ordinance up to an amount not exceeding $71 million (31 December 2015: $71 million). Up
to 30 June 2016, no calls had been made by the SFC in this connection.
(b) The Group had undertaken to indemnify the Collector of Stamp Revenue against any
underpayment of stamp duty by its Participants of up to $200,000 for each Participant. In
the unlikely event that all of its 530 trading Participants covered by the indemnity at 30 June
2016 (31 December 2015: 515) defaulted, the maximum contingent liability of the Group
under the indemnity would amount to $106 million (31 December 2015: $103 million).
(c) HKEX had given an undertaking in favour of HKSCC to contribute up to $50 million in the
event of HKSCC being wound up while it is a wholly-owned subsidiary of HKEX or within
one year after HKSCC ceases to be a wholly-owned subsidiary of HKEX, for payment of the
liabilities of HKSCC contracted before HKSCC ceases to be a wholly-owned subsidiary of
HKEX, and for the costs of winding up.

21
NOTES TO THE CONDENSED CONSOLIDATED FINANCIAL STATEMENTS (UNAUDITED) (CONT’D)
23. Contingent Liabilities (continued)
(d) US litigation
In 2013, the LME, LME Holdings Limited (LMEH) and HKEX were named as defendants in
aluminium warehousing litigation alleging anti-competitive behaviour in the United States
(US). Following vigorous defence by the Group, the US District Court for the Southern
District of New York (District Court) dismissed all the claims in a series of orders. In 2014,
plaintiffs classified as “consumer end users” and “commercial end users” filed appeals
against the District Court’s decisions but the appeals were all dismissed by the US Court of
Appeals in July 2015 with the agreement of the plaintiffs. While the direct action plaintiffs
and plaintiffs classified as “first level” purchasers do not currently have a right to appeal
against the District Court’s decisions, they may do so after their claims against the other
non-HKEX group defendants have concluded or if the court grants them permission to
appeal in the meantime. It is not clear when the litigation against the non-HKEX group
defendants will conclude but to date, no application to appeal has been filed by any of the
direct action plaintiffs or the “first level” purchasers against the District Court’s decisions.
24. Material Related Party Transactions
(a) Key management personnel compensation
Six months
ended
30 Jun 2016
$m
Six months
ended
30 Jun 2015
$m
Salaries and other short-term employee benefits 60 69
Employee share-based compensation benefits 33
3
27
Retirement benefit costs 4 5
101 97 101
(b) Post-retirement benefit plans
The Group has sponsored a defined contribution provident fund scheme (ORSO Plan) and a
Mandatory Provident Fund scheme (MPF Scheme) for the benefits of its employees in Hong
Kong. The Group has also sponsored a defined contribution pension scheme for all
employees of LMEH, LME and LME Clear (LME Pension Scheme). The retirement benefit
costs charged to the condensed consolidated income statement represent contributions paid
and payable by the Group to the ORSO Plan, the MPF Scheme and the LME Pension
Scheme and related fees (note 5). At 30 June 2016, the contributions payable to the
post-retirement benefit plans were below $1 million (31 December 2015: $3 million).
22
NOTES TO THE CONDENSED CONSOLIDATED FINANCIAL STATEMENTS (UNAUDITED) (CONT’D)
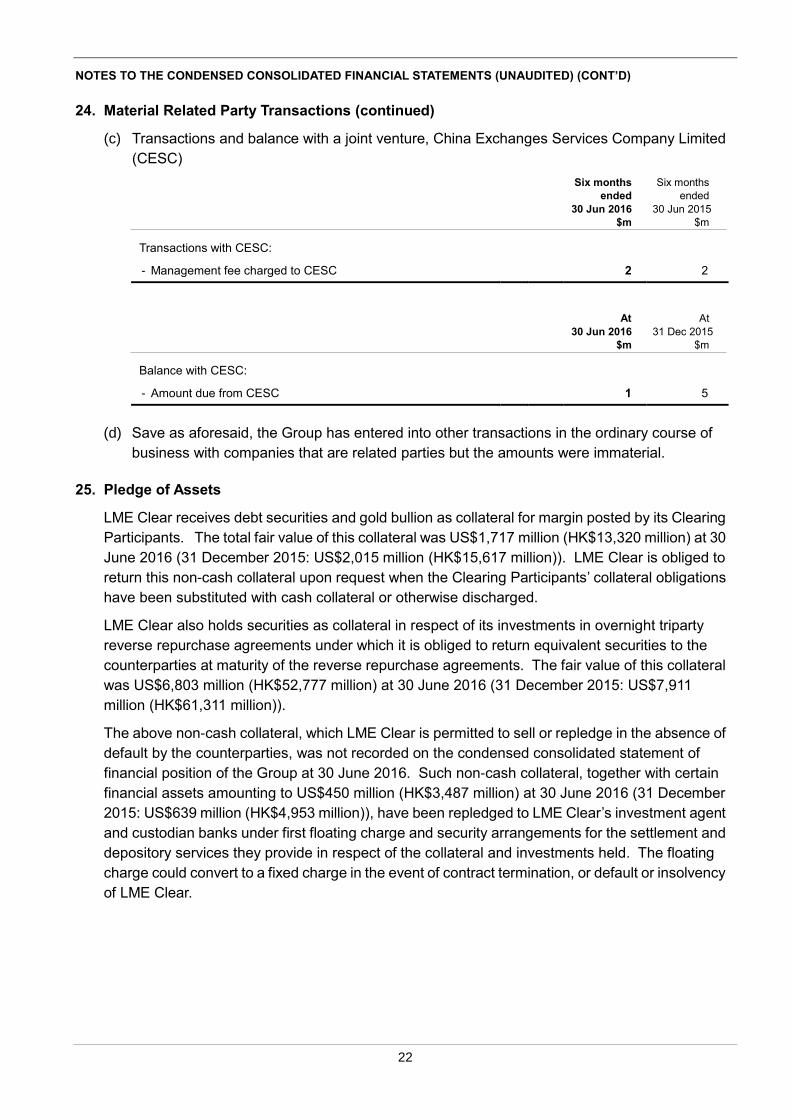
24. Material Related Party Transactions (continued)
(c) Transactions and balance with a joint venture, China Exchanges Services Company Limited
(CESC)
Six months
ended
30 Jun 2016
$m
Six months
ended
30 Jun 2015
$m
Transactions with CESC:
- Management fee charged to CESC 2 2
At
30 Jun 2016
$m
At
31 Dec 2015
$m
Balance with CESC:
- Amount due from CESC 1 5
(d) Save as aforesaid, the Group has entered into other transactions in the ordinary course of
business with companies that are related parties but the amounts were immaterial.
25. Pledge of Assets
LME Clear receives debt securities and gold bullion as collateral for margin posted by its Clearing
Participants. The total fair value of this collateral was US$1,717 million (HK$13,320 million) at 30
June 2016 (31 December 2015: US$2,015 million (HK$15,617 million)). LME Clear is obliged to
return this non-cash collateral upon request when the Clearing Participants’ collateral obligations
have been substituted with cash collateral or otherwise discharged.
LME Clear also holds securities as collateral in respect of its investments in overnight triparty
reverse repurchase agreements under which it is obliged to return equivalent securities to the
counterparties at maturity of the reverse repurchase agreements. The fair value of this collateral
was US$6,803 million (HK$52,777 million) at 30 June 2016 (31 December 2015: US$7,911
million (HK$61,311 million)).
The above non-cash collateral, which LME Clear is permitted to sell or repledge in the absence of
default by the counterparties, was not recorded on the condensed consolidated statement of
financial position of the Group at 30 June 2016. Such non-cash collateral, together with certain
financial assets amounting to US$450 million (HK$3,487 million) at 30 June 2016 (31 December
2015: US$639 million (HK$4,953 million)), have been repledged to LME Clear’s investment agent
and custodian banks under first floating charge and security arrangements for the settlement and
depository services they provide in respect of the collateral and investments held. The floating
charge could convert to a fixed charge in the event of contract termination, or default or insolvency
of LME Clear.

23
NOTES TO THE CONDENSED CONSOLIDATED FINANCIAL STATEMENTS (UNAUDITED) (CONT’D)
26. Fair Value of Financial Assets and Financial Liabilities
(a) Financial assets and financial liabilities carried at fair value
At 30 June 2016 and 31 December 2015, no non-financial assets or liabilities were carried
at fair value.
The following tables present the carrying value of financial assets and financial liabilities
measured at fair value according to the levels of the fair value hierarchy defined in HKFRS
13: Fair Value Measurement, with the fair value of each financial asset and financial liability
categorised based on the lowest level of input that is significant to that fair value
measurement. The levels are defined as follows:
Level 1: fair values measured using quoted prices (unadjusted) in active markets for
identical assets or liabilities.
Level 2: fair values measured using valuation techniques in which all significant inputs
other than quoted prices included within Level 1 are directly or indirectly based on
observable market data.
Level 3: fair values measured using valuation techniques in which any significant input
is not based on observable market data.
At 30 Jun 2016
Recurring fair value measurements: Level 1 Level 2 Total
$m $m $m
Financial assets
Financial assets measured at fair value
through profit or loss:
- equity securities 420 - 420
- debt securities 3,023 4,974 7,997
- forward foreign exchange contracts - 5 5
- base metals futures and options contracts
cleared through LME Clear
-
47,843
47,843
3,443 52,822 56,265
Financial liabilities
Financial liabilities at fair value through
profit or loss:
- forward foreign exchange contracts - 7 7
- base metals futures and options contracts
cleared through LME Clear
-
47,843
47,843
- 47,850 47,850
24
NOTES TO THE CONDENSED CONSOLIDATED FINANCIAL STATEMENTS (UNAUDITED) (CONT’D)
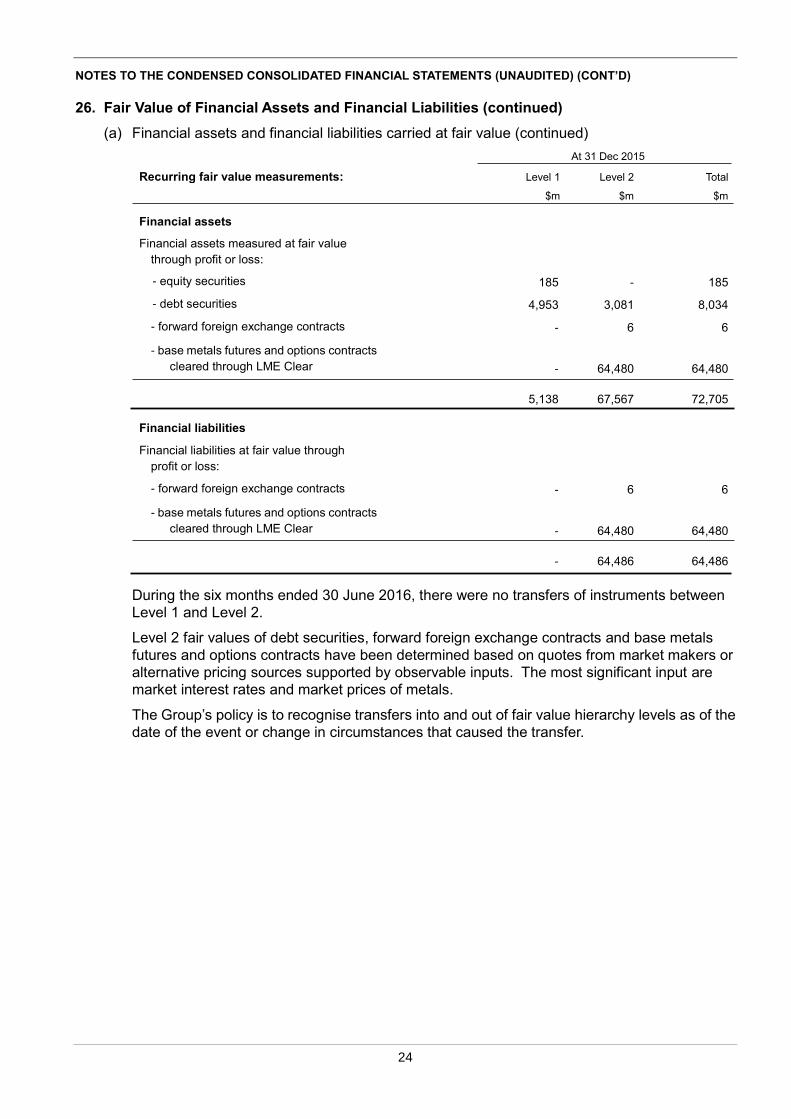
26. Fair Value of Financial Assets and Financial Liabilities (continued)
(a) Financial assets and financial liabilities carried at fair value (continued)
At 31 Dec 2015
Recurring fair value measurements: Level 1 Level 2 Total
$m $m $m
Financial assets
Financial assets measured at fair value
through profit or loss:
- equity securities 185 - 185
- debt securities 4,953 3,081 8,034
- forward foreign exchange contracts - 6 6
- base metals futures and options contracts
cleared through LME Clear
-
64,480
64,480
5,138 67,567 72,705
Financial liabilities
Financial liabilities at fair value through
profit or loss:
- forward foreign exchange contracts - 6 6
- base metals futures and options contracts
cleared through LME Clear
-
64,480
64,480
6 - 64,486 64,486
During the six months ended 30 June 2016, there were no transfers of instruments between
Level 1 and Level 2.
Level 2 fair values of debt securities, forward foreign exchange contracts and base metals
futures and options contracts have been determined based on quotes from market makers or
alternative pricing sources supported by observable inputs. The most significant input are
market interest rates and market prices of metals.
The Group’s policy is to recognise transfers into and out of fair value hierarchy levels as of the
date of the event or change in circumstances that caused the transfer.
25
NOTES TO THE CONDENSED CONSOLIDATED FINANCIAL STATEMENTS (UNAUDITED) (CONT’D)
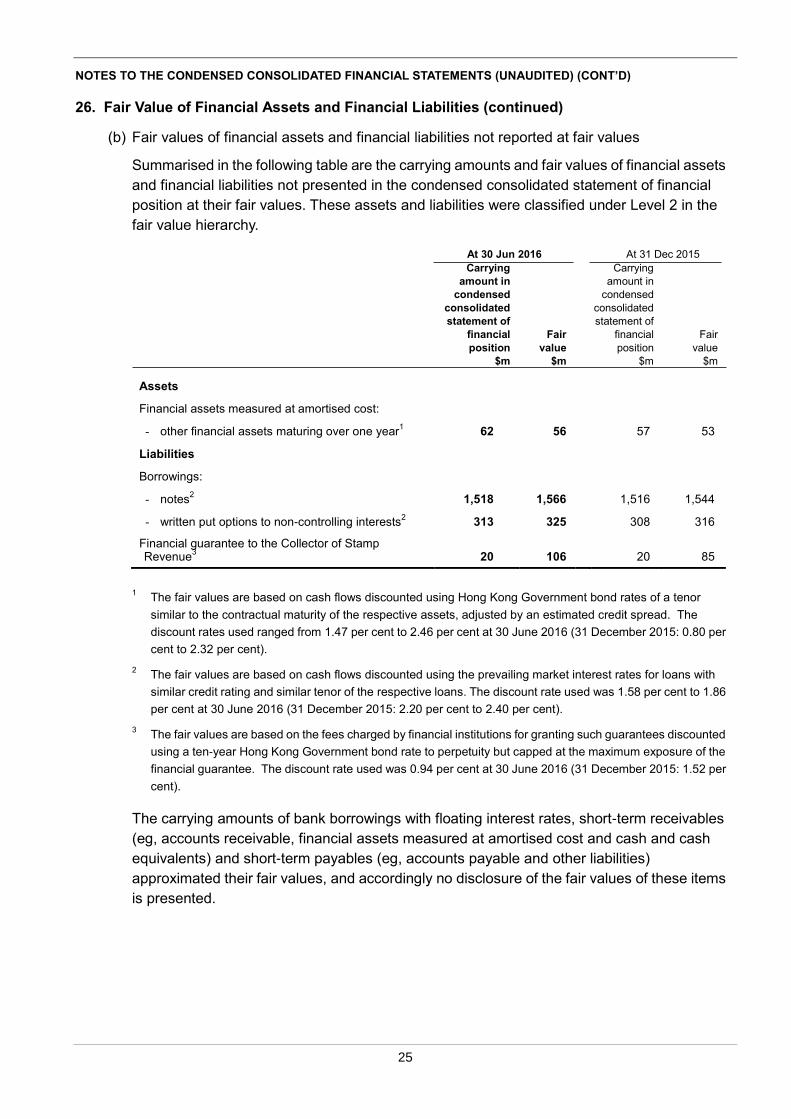
26. Fair Value of Financial Assets and Financial Liabilities (continued)
(b) Fair values of financial assets and financial liabilities not reported at fair values
Summarised in the following table are the carrying amounts and fair values of financial assets
and financial liabilities not presented in the condensed consolidated statement of financial
position at their fair values. These assets and liabilities were classified under Level 2 in the
fair value hierarchy.
At 30 Jun 2016 At 31 Dec 2015 Carrying
amount in
condensed
consolidated
statement of
financial
position
$m
Fair
value
$m
Carrying
amount in
condensed
consolidated
statement of
financial
position
$m
Fair
value
$m
Assets
Financial assets measured at amortised cost:
- other financial assets maturing over one year1 62 56 57 53
Liabilities
Borrowings:
- notes2 1,518 1,566 1,516 1,544
- written put options to non-controlling interests2 313 325 308 316
Financial guarantee to the Collector of Stamp Revenue
3
20
106
20
85
1 The fair values are based on cash flows discounted using Hong Kong Government bond rates of a tenor
similar to the contractual maturity of the respective assets, adjusted by an estimated credit spread. The
discount rates used ranged from 1.47 per cent to 2.46 per cent at 30 June 2016 (31 December 2015: 0.80 per
cent to 2.32 per cent).
2 The fair values are based on cash flows discounted using the prevailing market interest rates for loans with
similar credit rating and similar tenor of the respective loans. The discount rate used was 1.58 per cent to 1.86
per cent at 30 June 2016 (31 December 2015: 2.20 per cent to 2.40 per cent).
3 The fair values are based on the fees charged by financial institutions for granting such guarantees discounted
using a ten-year Hong Kong Government bond rate to perpetuity but capped at the maximum exposure of the
financial guarantee. The discount rate used was 0.94 per cent at 30 June 2016 (31 December 2015: 1.52 per
cent).
The carrying amounts of bank borrowings with floating interest rates, short-term receivables
(eg, accounts receivable, financial assets measured at amortised cost and cash and cash
equivalents) and short-term payables (eg, accounts payable and other liabilities)
approximated their fair values, and accordingly no disclosure of the fair values of these items
is presented.