
Concurrent Session 1, 12 th UNESCO-APEID Conference Bangkok, Thailand; 24 March 2009
26
Concurrent Session 1, 12 th UNESCO-APEID Conference Bangkok, Thailand; 24 March 2009 EFA Global Monitoring Report 2 0 0 9 Overcoming inequality: why governance matters
-
Upload
dustin-carlson -
Category
Documents
-
view
28 -
download
2
description
2. 0. 0. 9. EFA Global Monitoring Report. Concurrent Session 1, 12 th UNESCO-APEID Conference Bangkok, Thailand; 24 March 2009. Overcoming inequality: why governance matters. Education for All (EFA). - PowerPoint PPT Presentation
Transcript of Concurrent Session 1, 12 th UNESCO-APEID Conference Bangkok, Thailand; 24 March 2009
Concurrent Session 1, 12th UNESCO-APEID Conference
Bangkok, Thailand; 24 March 2009
EFA Global Monitoring Report 2 0 0 9
Overcoming inequality: why governance matters
Educa
tion f
or
All
Glo
bal M
onit
ori
ng R
eport
20
09
2
Education for All (EFA) Education as a basic human right is recognized
in Article 26 of The Universal Declaration of Human Rights
EFA was first launched in Jomtien, Thailand in March 1990 at the World Conference on Education for All; It was reaffirmed at the World Education Forum in Dakar, Senegal in April 2000
EFA is not a UNESCO programme. It is an international commitment made by governments, NGOs, civil society groups, UN agencies, multilateral & bilateral agencies, etc.
Educa
tion f
or
All
Glo
bal M
onit
ori
ng R
eport
20
09
3
The Six EFA GoalsEarly childhood care and education
Universal Primary Education (UPE)
Life Skills and Lifelong Learning
Literacy
Gender
Quality Education
All Goals should be reached by 2015, same as the Millennium Development Goals (MDGs)
Educa
tion f
or
All
Glo
bal M
onit
ori
ng R
eport
20
09
4
Key messages of the 2009 GMR
There has been strong progress towards many EFA goals, but…
Key targets for 2015 will be missed – and time is running out
Governments are failing to tackle inequality, as are current approaches to governance
Aid to education is stagnating and donors are not meeting their commitments
Educa
tion f
or
All
Glo
bal M
onit
ori
ng R
eport
20
09
5
EFA & the MDGs: mutually-dependent
EFA as a foundation for the MDGs
The Education for All agenda is broader than the MDGs
Education can help unlock progress on the MDGs:
Broad-based growth to halve extreme poverty
Reducing child and maternal mortality
Tackling child malnutrition
Strengthening democracy and citizenship
Educa
tion f
or
All
Glo
bal M
onit
ori
ng R
eport
20
09
6
EFA & the MDGs
Education for some – global and national inequalities persist
The global divide: between the world’s richest and poorest nations
The wealth gap: within countries, children from the richest households are up to 5 times more likely to be enrolled that those from the poorest
The quality divide: many children leave school lacking basic literacy and numeracy skills
Educa
tion f
or
All
Glo
bal M
onit
ori
ng R
eport
20
09
7
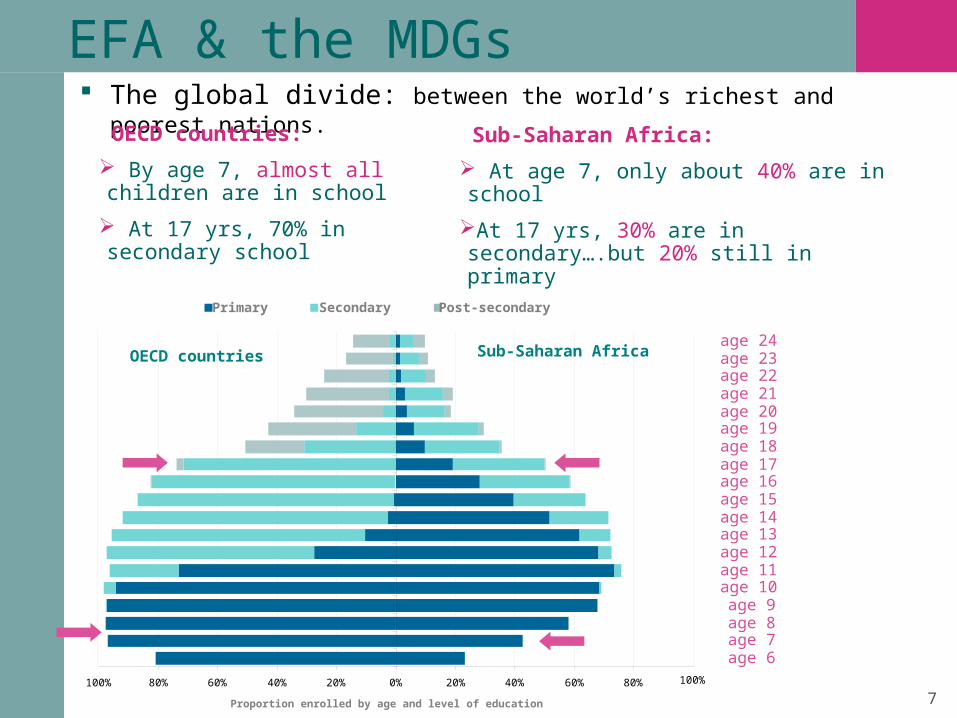
Sub-Saharan Africa:
At age 7, only about 40% are in school
At 17 yrs, 30% are in secondary….but 20% still in primary
100% 80% 60% 40% 20% 0% 20% 40% 60% 80% 100%
Proportion enrolled by age and level of education
Primary Secondary Post-secondary
OECD countries Sub-Saharan Africa
EFA & the MDGs The global divide: between the world’s richest and poorest
nations.
age 6age 7age 8age 9
age 10age 11age 12age 13age 14age 15age 16age 17age 18age 19age 20age 21age 22age 23age 24
OECD countries:
By age 7, almost all children are in school
At 17 yrs, 70% in secondary school
Educa
tion f
or
All
Glo
bal M
onit
ori
ng R
eport
20
09
8
Sub-Saharan Africa, average
South and West Asia, average
Latin America and Caribbean, average
20
40
60
80
100
Grade 1 Grade 2 Grade 3 Grade 4 Grade 5 Grade 6 Grade 7 Grade 8 Grade 9
Su
rviv
al t
o g
rad
e (%
)
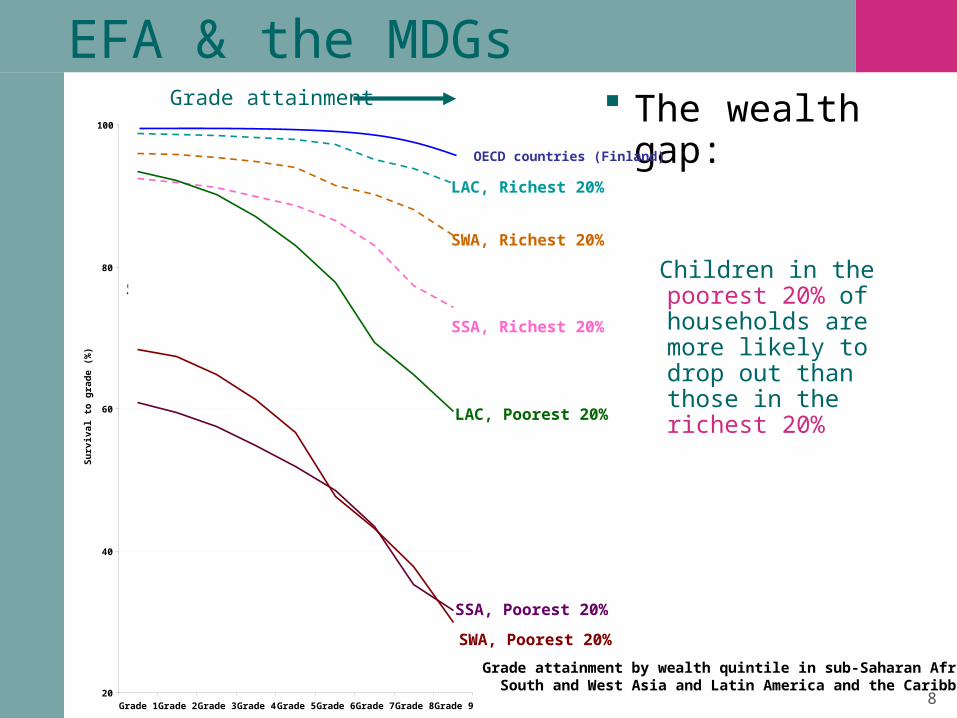
LAC, Richest 20%
SSA, Richest 20%
SWA, Richest 20%
LAC, Poorest 20%
SSA, Poorest 20%
SWA, Poorest 20%
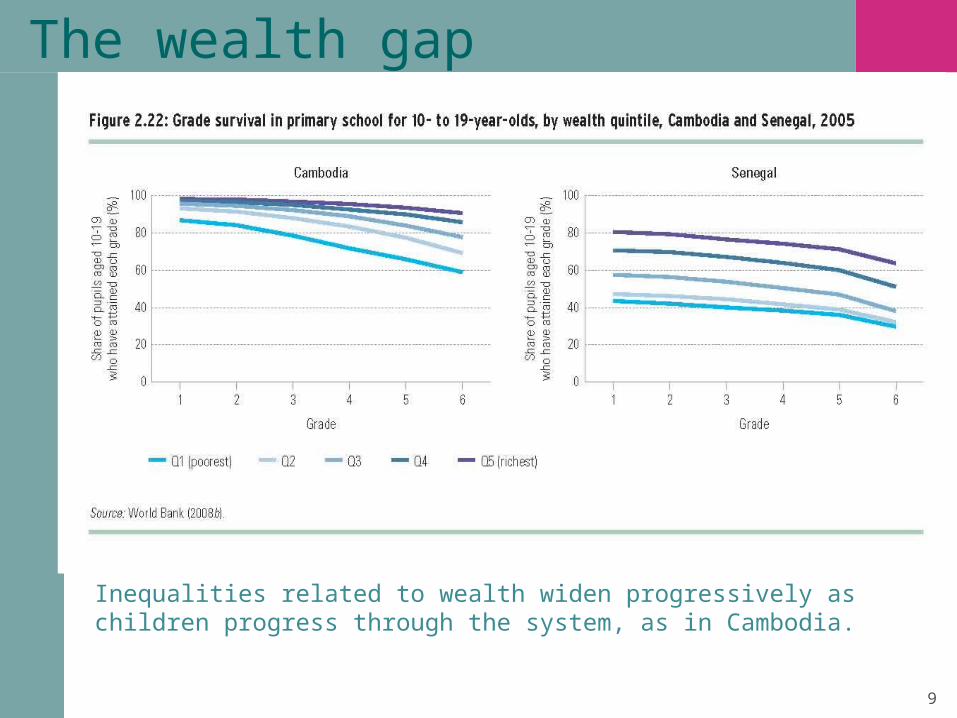
Grade attainment by wealth quintile in sub-Saharan Africa, South and West Asia and Latin America and the Caribbean
EFA & the MDGs The wealth gap:
Children in the poorest 20% of households are more likely to drop out than those in the richest 20%
OECD countries (Finland)
Grade attainment
Educa
tion f
or
All
Glo
bal M
onit
ori
ng R
eport
20
09
9
Inequalities related to wealth widen progressively as children progress through the system, as in Cambodia.
The wealth gap
Educa
tion f
or
All
Glo
bal M
onit
ori
ng R
eport
20
09
10
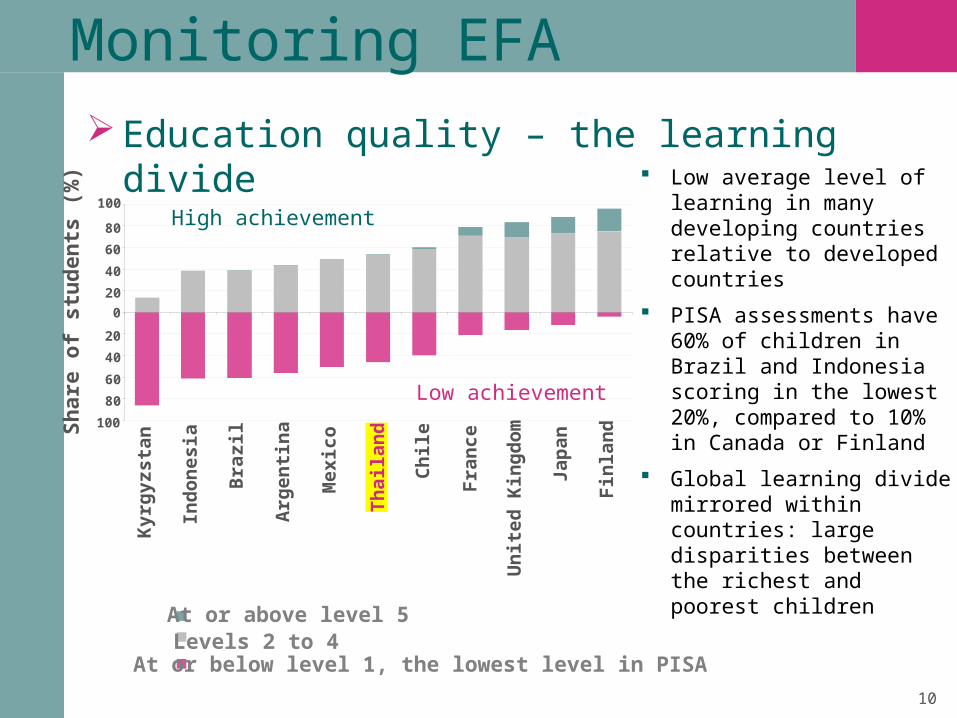
At or above level 5Levels 2 to 4At or below level 1, the lowest level in PISA
Low average level of learning in many developing countries relative to developed countries
PISA assessments have 60% of children in Brazil and Indonesia scoring in the lowest 20%, compared to 10% in Canada or Finland
Global learning divide mirrored within countries: large disparities between the richest and poorest children
Education quality – the learning divide
100
80
60
40
20
0
20
40
60
80
100
Kyr
gyz
stan
Ind
on
esia
Bra
zil
Arg
enti
na
Mex
ico
Th
aila
nd
Ch
ile
Fra
nce
Un
ited
Kin
gd
om
Jap
an
Fin
lan
d
Sh
are
of
stu
den
ts (
%)
High achievement
Low achievement
Monitoring EFA
Educa
tion f
or
All
Glo
bal M
onit
ori
ng R
eport
20
09
11
Monitoring EFA
Early childhood education and care (ECCE) is still neglected Malnutrition as a barrier to EFA: 1 in 3 children suffer
worldwide (higher in South Asia)
Economic growth not enough: Child mortality rates in East Asia & Pacific improved in the last decade, but for every 1,000 live births, 31 children still do not reach age 5
more than a third of children in Cambodia, Myanmar and Lao PDR still suffer from moderate to severe stunting
Successful programmes make a difference Philippines: nutrition programme registered improvements in
cognitive development
Rich countries also face problems United States: poor and ethnic groups lagging behind in ECCE,
leading to inequalities in educational outcomes
Educa
tion f
or
All
Glo
bal M
onit
ori
ng R
eport
20
09
12
Monitoring EFA
Steady but uneven progress in universal primary education (UPE) Since 1999, the primary net enrolment rate for
developing countries has increased at twice the rate of the pre-Dakar decade
Fewer children out-of-school in 2006 than in 2000, globally Slower population growth also means East Asia &
Pacific will have some 15 million fewer children of primary school age in 2015 than in 2006.
Progress in: Increased political leadership public investment & abolished school fees school construction measures to strengthen quality …
… but the world is not on track for UPE by 2015
Educa
tion f
or
All
Glo
bal M
onit
ori
ng R
eport
20
09
13
8.1
7.2
6.8
3.7
1.4
1.4
1.2
1.2
1.0
1.0
1.0
0.9
0.8
0.7
0.6
0.5
0.5
7.6
0.6
3.7
1.1
0.3
0.9
0.9
1.1
0.7
0.3
0.9
0.3
0.6
0.7
0.2
0.2
0.2
Nigeria
India
Pakistan
Ethiopia
BangladeshKenyaNiger
Burkina FasoGhana
Mozambique
PhilippinesYemen
MaliTurkey
BrazilSenegal
Iraq
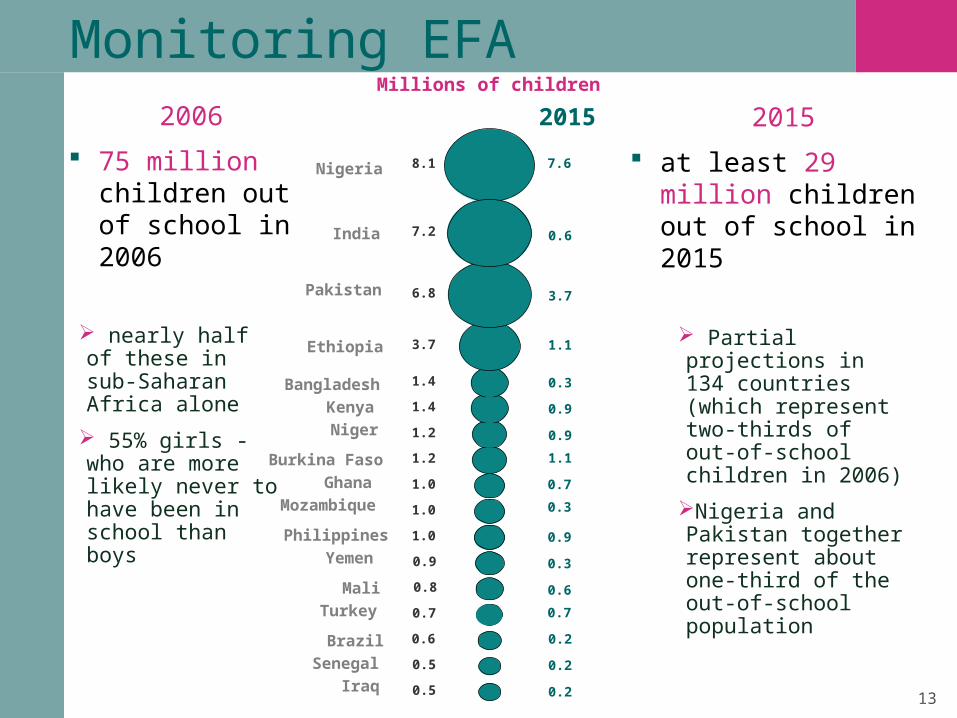
Millions of children
2006 2015 2015
at least 29 million children out of school in 2015
Partial projections in 134 countries (which represent two-thirds of out-of-school children in 2006)
Nigeria and Pakistan together represent about one-third of the out-of-school population
Monitoring EFA2006
75 million children out of school in 2006
nearly half of these in sub-Saharan Africa alone
55% girls - who are more likely never to have been in school than boys
Educa
tion f
or
All
Glo
bal M
onit
ori
ng R
eport
20
09
14
Monitoring EFA
Global, regional and national inequalities are a barrier to progress in universal primary education
Wealth-based inequalities: one country, several worlds
children from rich and poor backgrounds move in different worlds
Poor children are over-represented among out-of-school:
– over 40% of out-of-school children in the Philippines, 51% in Indonesia, 60% in Viet Nam
Other inequalities: gender location (rural v. urban) Ethnic origin
language
disability
Educa
tion f
or
All
Glo
bal M
onit
ori
ng R
eport
20
09
15
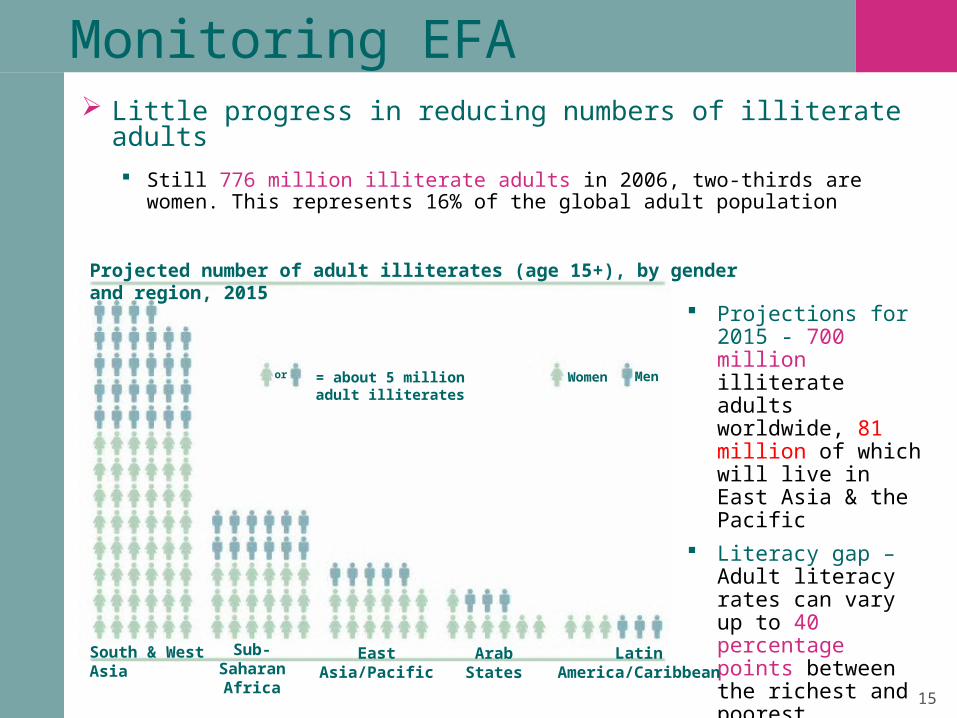
Monitoring EFA Little progress in reducing numbers of illiterate adults
Still 776 million illiterate adults in 2006, two-thirds are women. This represents 16% of the global adult population
Projections for 2015 - 700 million illiterate adults worldwide, 81 million of which will live in East Asia & the Pacific
Literacy gap –Adult literacy rates can vary up to 40 percentage points between the richest and poorest households within a given country.
Projected number of adult illiterates (age 15+), by gender and region, 2015
South & West Asia
Sub-Saharan
Africa
East Asia/Pacific Arab States
Latin America/Caribbean
= about 5 million adult illiterates
or Women Men
Educa
tion f
or
All
Glo
bal M
onit
ori
ng R
eport
20
09
16
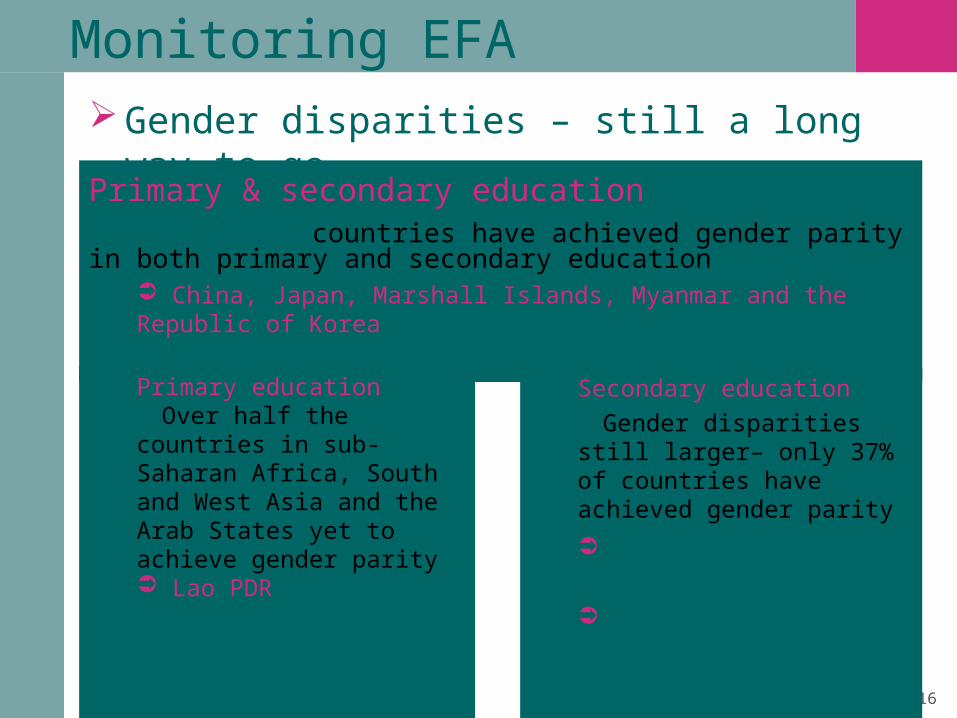
Monitoring EFAGender disparities – still a long way to go
Primary & secondary education59 out of 176 countries have achieved gender parity in both primary and secondary education
China, Japan, Marshall Islands, Myanmar and the Republic of Korea have achieved gender parity in primary and secondary levels
Primary education Over half the countries in sub-Saharan Africa, South and West Asia and the Arab States yet to achieve gender parity Lao PDR only enrolls 90 girls per 100 boys in primary education, among the lowest in East Asia & Pacific next to Papua New Guinea with 84 girls per100 boys
Secondary education Gender disparities still larger– only 37% of countries have achieved gender parity
In many countries, boys are disadvantaged
Gender gaps in secondary schools were seen in three-quarters of countries in East Asia & Pacific
Educa
tion f
or
All
Glo
bal M
onit
ori
ng R
eport
20
09
17
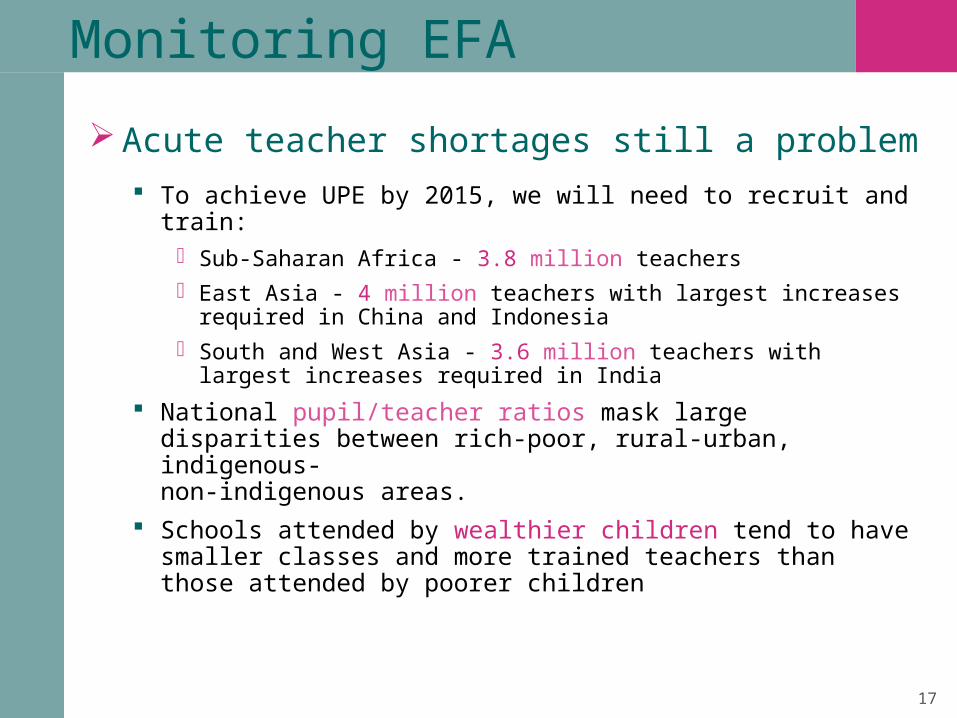
Monitoring EFA
Acute teacher shortages still a problem To achieve UPE by 2015, we will need to recruit and
train: Sub-Saharan Africa - 3.8 million teachers East Asia - 4 million teachers with largest increases
required in China and Indonesia South and West Asia - 3.6 million teachers with largest
increases required in India
National pupil/teacher ratios mask large disparities between rich-poor, rural-urban, indigenous-non-indigenous areas.
Schools attended by wealthier children tend to have smaller classes and more trained teachers than those attended by poorer children
Educa
tion f
or
All
Glo
bal M
onit
ori
ng R
eport
20
09
18
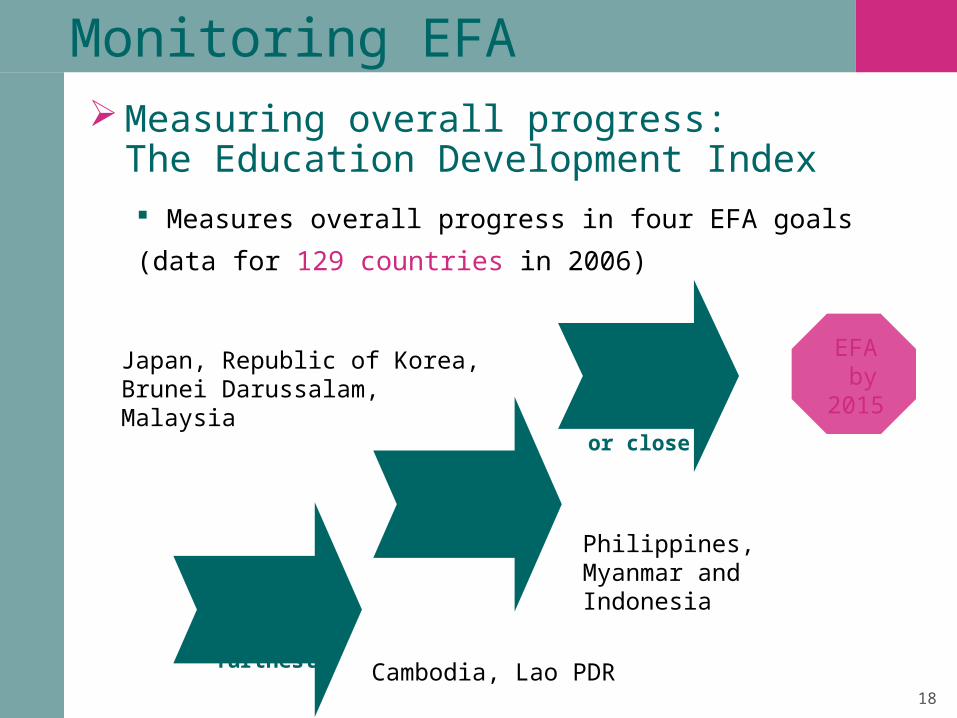
Monitoring EFA Measuring overall progress:
The Education Development Index Measures overall progress in four EFA goals
(data for 129 countries in 2006)
56 countries achieved or close
44 countries midway
29 countries furthest
EFA by
2015
Cambodia, Lao PDR
Philippines, Myanmar and Indonesia
Japan, Republic of Korea, Brunei Darussalam, Malaysia
Educa
tion f
or
All
Glo
bal M
onit
ori
ng R
eport
20
09
19
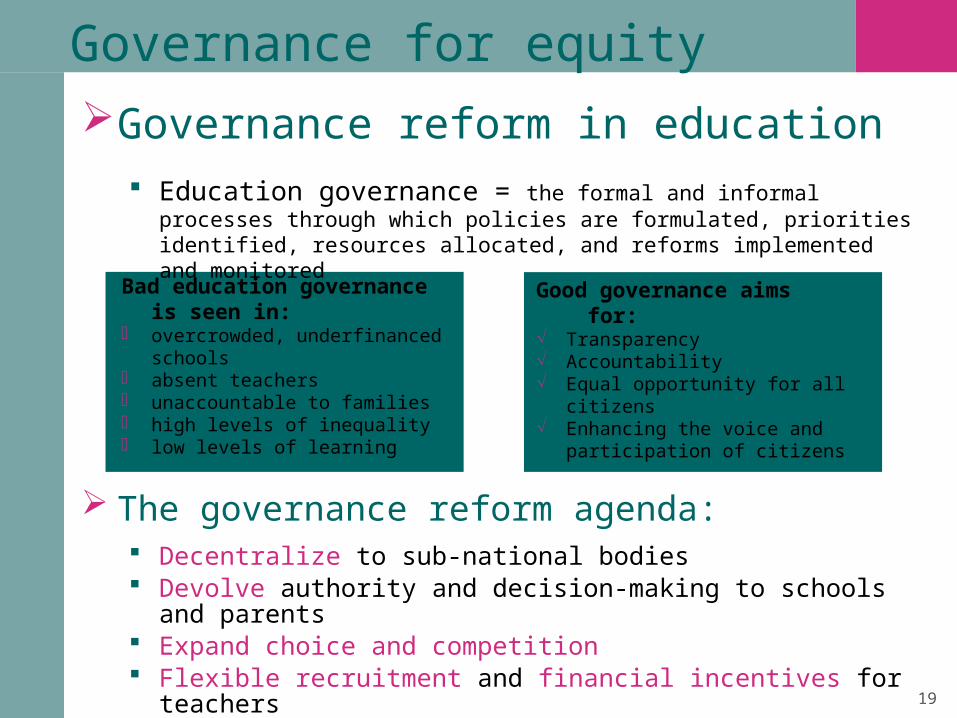
Governance for equity Governance reform in education
Education governance = the formal and informal processes through which policies are formulated, priorities identified, resources allocated, and reforms implemented and monitored
Bad education governance is seen in:
overcrowded, underfinanced schools
absent teachers unaccountable to families high levels of inequality low levels of learning
Good governance aims for: Transparency Accountability Equal opportunity for all citizens Enhancing the voice and
participation of citizens
The governance reform agenda: Decentralize to sub-national bodies Devolve authority and decision-making to schools and
parents Expand choice and competition Flexible recruitment and financial incentives for teachers
Educa
tion f
or
All
Glo
bal M
onit
ori
ng R
eport
20
09
21
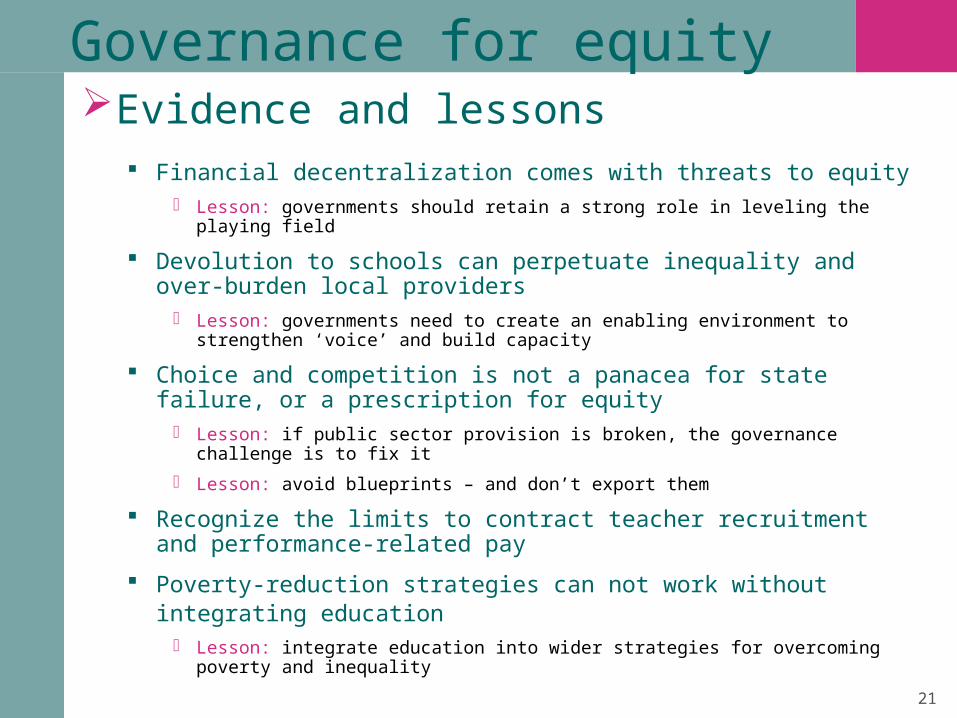
Governance for equityEvidence and lessons
Financial decentralization comes with threats to equity Lesson: governments should retain a strong role in leveling the playing field
Devolution to schools can perpetuate inequality and over-burden local providers
Lesson: governments need to create an enabling environment to strengthen ‘voice’ and build capacity
Choice and competition is not a panacea for state failure, or a prescription for equity
Lesson: if public sector provision is broken, the governance challenge is to fix it
Lesson: avoid blueprints – and don’t export them
Recognize the limits to contract teacher recruitment and performance-related pay
Poverty-reduction strategies can not work without integrating education
Lesson: integrate education into wider strategies for overcoming poverty and inequality
Educa
tion f
or
All
Glo
bal M
onit
ori
ng R
eport
20
09
22
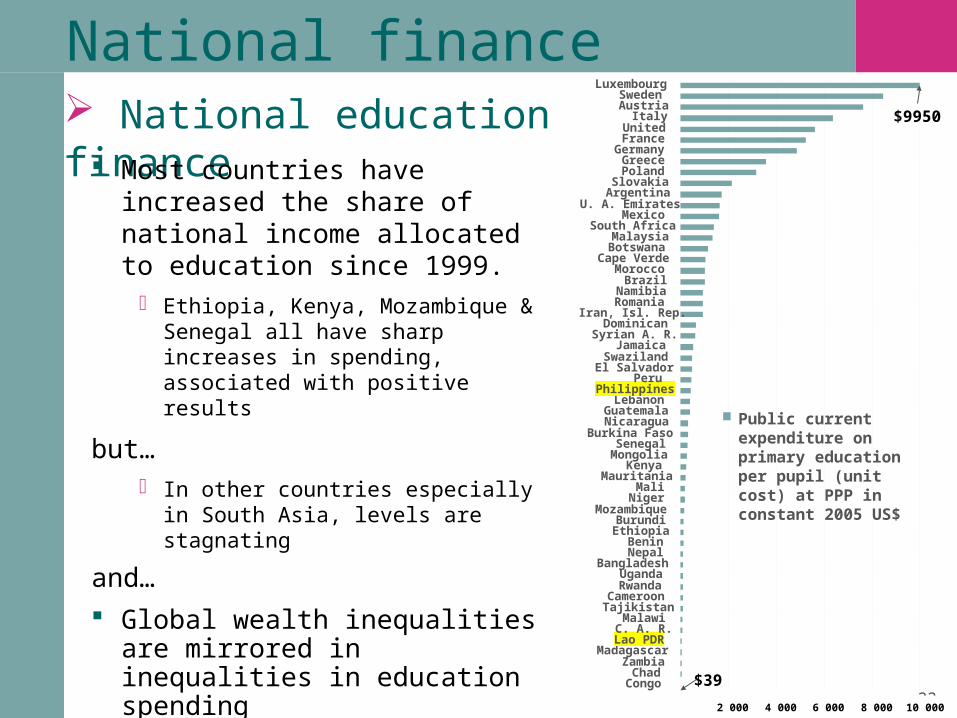
National finance National education finance
2 000 4 000 6 000 8 000 10 000
CongoChad
ZambiaMadagascar
Lao PDRC. A. R.Malawi
TajikistanCameroon
RwandaUganda
BangladeshNepalBenin
EthiopiaBurundi
MozambiqueNiger
MaliMauritania
KenyaMongoliaSenegal
Burkina FasoNicaraguaGuatemala
LebanonPhilippines
PeruEl SalvadorSwaziland
JamaicaSyrian A. R.Dominican
Iran, Isl. Rep.RomaniaNamibia
BrazilMorocco
Cape VerdeBotswana
MalaysiaSouth Africa
MexicoU. A. Emirates
ArgentinaSlovakia
PolandGreece
GermanyFranceUnited
ItalyAustria
SwedenLuxembourg
Public current expenditure on primary education per pupil (unit cost) at PPP in constant 2005 US$
$9950
$39
Most countries have increased the share of national income allocated to education since 1999.
Ethiopia, Kenya, Mozambique & Senegal all have sharp increases in spending, associated with positive results
but… In other countries especially in
South Asia, levels are stagnating
and… Global wealth inequalities are
mirrored in inequalities in education spending
Range from US$39 in Congo to $9950 in Luxembourg
Educa
tion f
or
All
Glo
bal M
onit
ori
ng R
eport
20
09
23
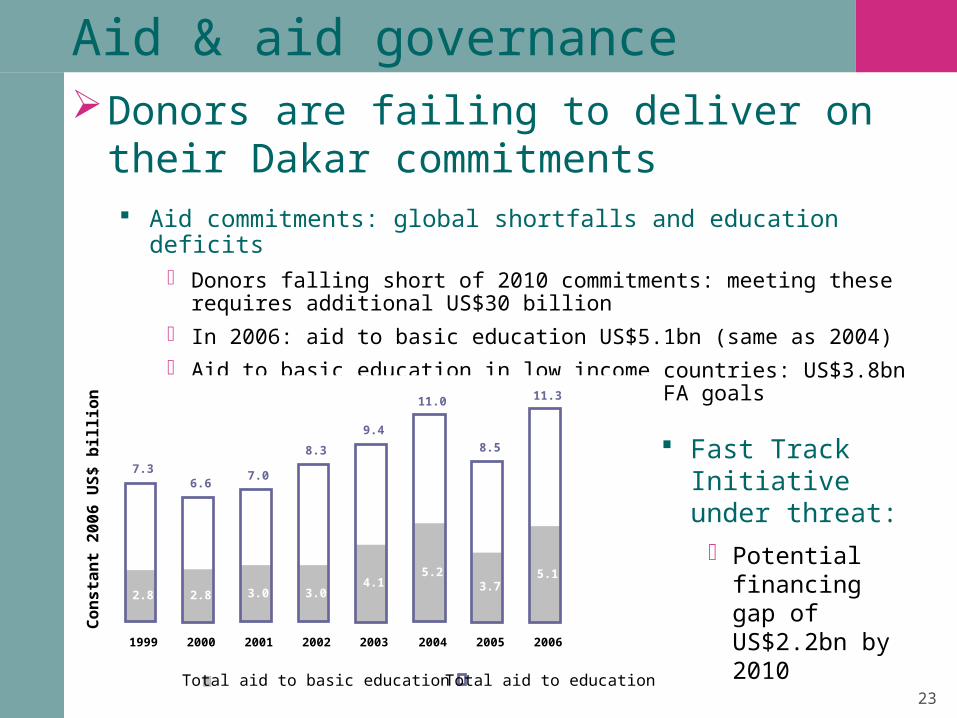
Aid & aid governanceDonors are failing to deliver on their
Dakar commitments Aid commitments: global shortfalls and education deficits
Donors falling short of 2010 commitments: meeting these requires additional US$30 billion
In 2006: aid to basic education US$5.1bn (same as 2004) Aid to basic education in low income countries: US$3.8bn but
US$11bn needed annually to meet EFA goals
Fast Track Initiative under threat:
Potential financing gap of US$2.2bn by 2010
2.8 2.8 3.0 3.04.1
5.23.7
5.1
7.36.6
7.0
8.3
9.4
11.0
8.5
11.3
1999 2000 2001 2002 2003 2004 2005 2006
Con
sta
nt
20
06
US
$ b
illion
Total aid to basic education Total aid to education
Educa
tion f
or
All
Glo
bal M
onit
ori
ng R
eport
20
09
24
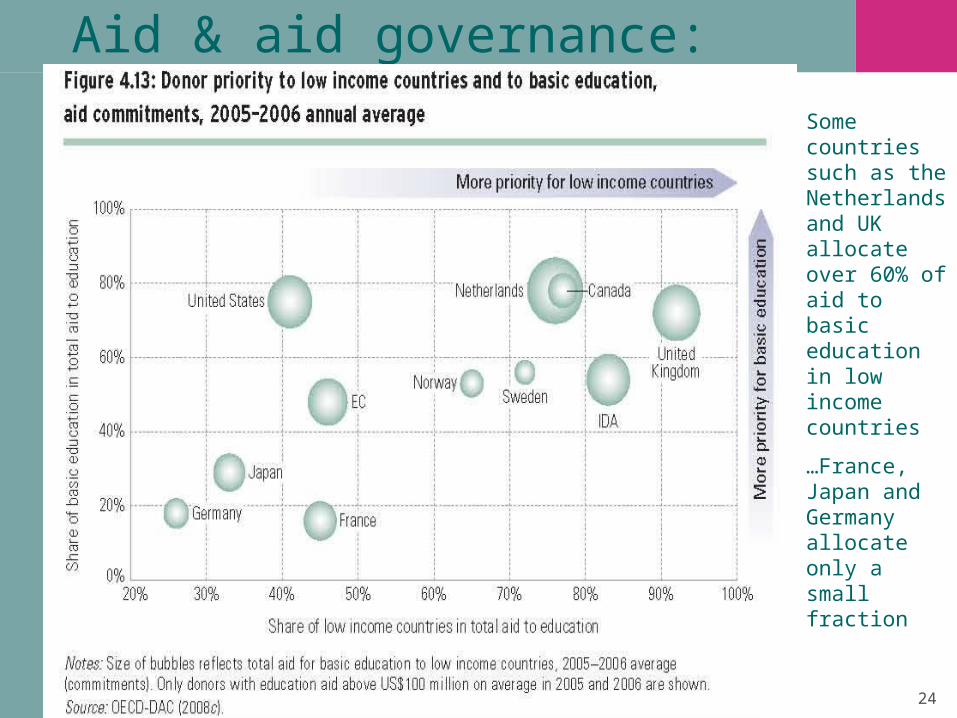
Aid & aid governance: Equity Matters Some
countries such as the Netherlands and UK allocate over 60% of aid to basic education in low income countries
…France, Japan and Germany allocate only a small fraction
Educa
tion f
or
All
Glo
bal M
onit
ori
ng R
eport
20
09
25
Aid & aid governanceThe Paris agenda: a mixed record
Improving aid governance: Paris Declaration on Aid Effectiveness (2005). Until now, progress is variable:
Shift from projects to programmes– Increase from 33% to 54% in 2005-2006
National ownership– Conditions vary
Aligning aid to national priorities & improve predictability– Some positive examples, but some donors unwilling to work
through national structures Improving donor coordination to reduce inefficiency
– Progress in some countries (Ethiopia– over half of missions were joint in 2007), but…
– In 2007, Niger hosted 600 donor missions – less than 100 were joint
– In 2005, 18 countries had to deal with 12 donors for basic education alone
Educa
tion f
or
All
Glo
bal M
onit
ori
ng R
eport
20
09
26
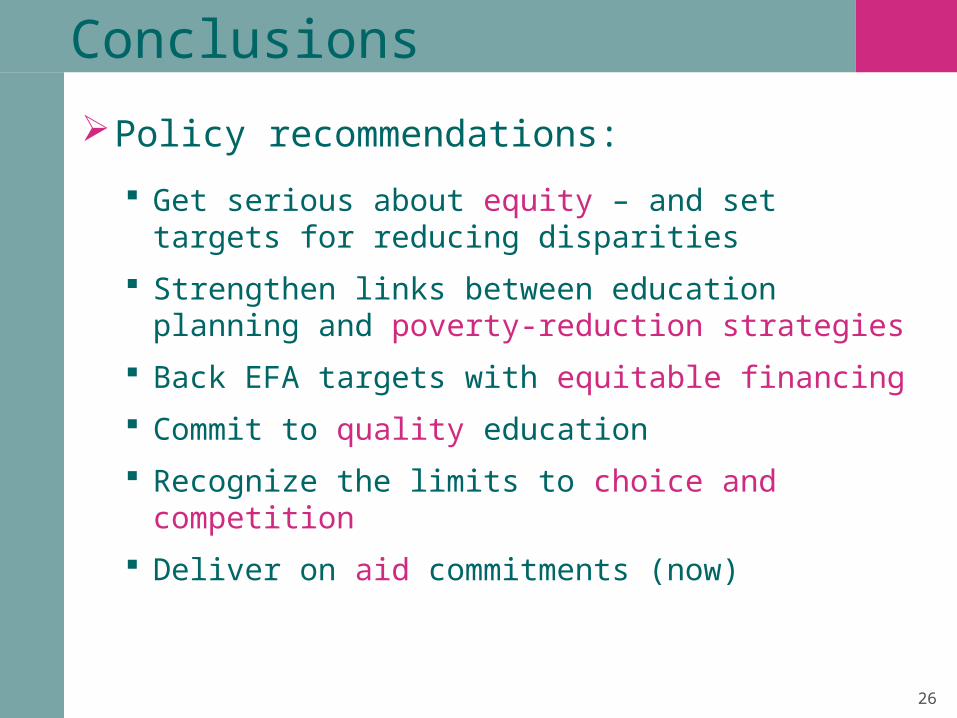
Conclusions
Policy recommendations:
Get serious about equity – and set targets for reducing disparities
Strengthen links between education planning and poverty-reduction strategies
Back EFA targets with equitable financing
Commit to quality education
Recognize the limits to choice and competition
Deliver on aid commitments (now)
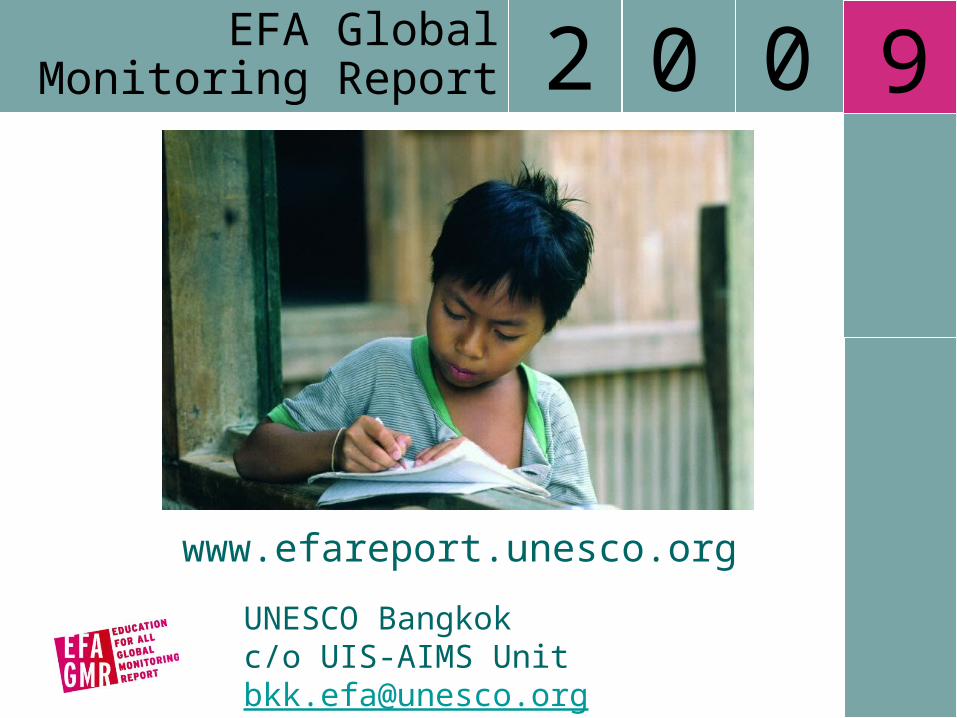
www.efareport.unesco.org
EFA Global Monitoring Report 2 0 0 9
UNESCO Bangkokc/o UIS-AIMS [email protected]


![UNESCO-APEID Presentation [DRAFT]](https://static.fdocuments.in/doc/165x107/5470563faf795946438b473c/unesco-apeid-presentation-draft.jpg)