
CONCURRENT SELF-ORGANIZING MAPS FOR PEDESTRIAN DETECTION IN THERMAL IMAGERY · ·...
12
U.P.B. Sci. Bull., Series C, Vol. 75, Iss. 4, 2013 ISSN 2286 – 3540 CONCURRENT SELF-ORGANIZING MAPS FOR PEDESTRIAN DETECTION IN THERMAL IMAGERY Adrian-Dumitru CIOTEC 1 , Victor-Emil NEAGOE 2 , Andrei-Petru BĂRAR 3 The paper presents an original approach for pedestrian detection in thermal imagery using Histogram of Oriented Gradients (HOG) for feature extraction and the neural network classifier called Concurrent Self-Organizing Maps (CSOM), previously introduced by first author. The proposed algorithm has the following main stages: (a) detection of the regions of interest (ROI); (b) feature selection using the Histogram of Oriented Gradients (HOG; (c) classification using a CSOM classifier with several neural modules for each class; (d) decision fusion of the SOM modules into the two final classes: pedestrians and non-pedestrians. For training and testing the proposed algorithm, we have used the OTCBVS - OSU Thermal Pedestrian Database provided by the Ohio State University. After optimizing HOG descriptors parameters we obtains the False Positive Error Rate (FPER) of 1.79%, the False Negative Error Rate (FNER) of 0.49% and the Total Success Rate (TSR) of 98.48 %. Keywords: pedestrian detection, thermal imagery, night vision, concurrent self- organizing maps (CSOM), histogram of oriented gradients (HOG) 1. Introduction Pedestrian detection in far infrared (called also thermal) imaging is a challenging task. Analysis of thermal imagery implies to solve several difficult problems: low image resolution, thermal noising, and lack of color, texture and depth information [7]. The thermal sensor cost has reduced significantly in the past decades as a consequence of the increasing number of applications for night- vision systems [2]. There have been a lot of works on pedestrian detection in infrared (IR) imagery. In [11], support vector machine and Kalman filtering are adopted for detection. In [12], the P-tile method is developed to detect human head first and then human torso and legs are included by local search. In [4], a two-stage template-based method with an Adaboosted classifier was presented for pedestrian detection. A generalized Expectation-Maximization (EM) algorithm to 1 PhD, Faculty Electronics, Telecommunications and Information Technology, University POLITEHNICA of Bucharest, Romania, e-mail: [email protected] 2 Prof. PhD, Faculty Electronics, Telecommunications and Information Technology, University POLITEHNICA of Bucharest, Romania, e-mail: [email protected] 3 PhD student, Faculty Electronics, Telecommunications and Information Technology, University POLITEHNICA of Bucharest, Romania, e-mail: [email protected]
Transcript of CONCURRENT SELF-ORGANIZING MAPS FOR PEDESTRIAN DETECTION IN THERMAL IMAGERY · ·...

U.P.B. Sci. Bull., Series C, Vol. 75, Iss. 4, 2013 ISSN 2286 – 3540
CONCURRENT SELF-ORGANIZING MAPS FOR PEDESTRIAN DETECTION IN THERMAL IMAGERY
Adrian-Dumitru CIOTEC1, Victor-Emil NEAGOE2, Andrei-Petru BĂRAR3
The paper presents an original approach for pedestrian detection in thermal imagery using Histogram of Oriented Gradients (HOG) for feature extraction and the neural network classifier called Concurrent Self-Organizing Maps (CSOM), previously introduced by first author. The proposed algorithm has the following main stages: (a) detection of the regions of interest (ROI); (b) feature selection using the Histogram of Oriented Gradients (HOG; (c) classification using a CSOM classifier with several neural modules for each class; (d) decision fusion of the SOM modules into the two final classes: pedestrians and non-pedestrians. For training and testing the proposed algorithm, we have used the OTCBVS - OSU Thermal Pedestrian Database provided by the Ohio State University. After optimizing HOG descriptors parameters we obtains the False Positive Error Rate (FPER) of 1.79%, the False Negative Error Rate (FNER) of 0.49% and the Total Success Rate (TSR) of 98.48 %.
Keywords: pedestrian detection, thermal imagery, night vision, concurrent self-organizing maps (CSOM), histogram of oriented gradients (HOG)
1. Introduction
Pedestrian detection in far infrared (called also thermal) imaging is a challenging task. Analysis of thermal imagery implies to solve several difficult problems: low image resolution, thermal noising, and lack of color, texture and depth information [7]. The thermal sensor cost has reduced significantly in the past decades as a consequence of the increasing number of applications for night-vision systems [2]. There have been a lot of works on pedestrian detection in infrared (IR) imagery. In [11], support vector machine and Kalman filtering are adopted for detection. In [12], the P-tile method is developed to detect human head first and then human torso and legs are included by local search. In [4], a two-stage template-based method with an Adaboosted classifier was presented for pedestrian detection. A generalized Expectation-Maximization (EM) algorithm to
1 PhD, Faculty Electronics, Telecommunications and Information Technology, University
POLITEHNICA of Bucharest, Romania, e-mail: [email protected] 2 Prof. PhD, Faculty Electronics, Telecommunications and Information Technology, University
POLITEHNICA of Bucharest, Romania, e-mail: [email protected] 3 PhD student, Faculty Electronics, Telecommunications and Information Technology, University
POLITEHNICA of Bucharest, Romania, e-mail: [email protected]

46 Adrian-Dumitru Ciotec, Victor-Emil Neagoe, Andrei-Petru Bărar
decompose infrared images into background and foreground layers is presented in [2]. A Steering Kernel Regression Weights Matrix (SKRWM) based descriptor for pedestrian detection in thermal images is proposed in [7]. In visible spectrum, human vision system (HVS) is often used as the benchmark for the robustness and accuracy of machine vision systems. A neural network approach for pedestrian detection in the visible spectrum is proposed in [9]. Recently, some premium vehicles (smart cars) are offered with an optional night vision system for pedestrian detection based on infrared image processing.
In this paper, we propose and evaluate an algorithm for pedestrian detection in far infrared imagery using a neural network classifier based on the system of Concurrent Self-Organizing Maps (CSOM) [8], [9], and [10]. For feature selection, we have compared the techniques of Histogram of Oriented Gradients (HOG) [3] and Principal Component Analysis (PCA) [1].
2. Algorithm description
The proposed pedestrian detection algorithm for thermal imagery has the following steps (Fig. 1):
A. Image enhancement using Wiener filter; B. Image binarization using cumulative histogram; C. Region of interest (ROI) detection and normalization on the binary
image previously extracted; D. Feature extraction using Histogram of Oriented Gradients (HOG); E. Classification using Concurrent Self-Organizing Maps (CSOM)
with five neural module, one for each intermediary class; F. Decision fusion into two classes: pedestrian and non-pedestrian.

Concurrent self-organizing maps for pedestrian detection in thermal imagery 47
Fig. 1 Flowchart of the proposed pedestrian detection A detailed description for each step of the algorithm follows.
A. Image enhancement using Wiener filter We have used the algorithm given in [6]. Based on experimental results
we have chosen the neighborhood size 5x5. B. Image binarization using cumulative histogram A cumulative histogram is a mapping that counts the cumulative number
of observations in all of the bins up to the specified bin. That is, the cumulative histogram Mi of a histogram mj is defined as:
∑
(1)
Based on experiments, we have chosen a threshold of 95% for image binarization.
C. Detection of regions of interest The binarized image is used to detect regions of interest (ROIs). The
image is processed with a median filter of 3x3 pixels to remove noise. Median filters of 3x1, 5x1 and 15x1 are applied, in order to remove the interconnected regions. A connected group of foreground pixels (with value of 1) defines a region of interest (ROI). The image corresponding to the rectangle which fits the regions boundaries is extracted and normalized. Finally, an image of 20 x 40 pixels has been obtained.

48 Adrian-Dumitru Ciotec, Victor-Emil Neagoe, Andrei-Petru Bărar
D. Feature selection using Histogram of Oriented Gradients We have used the feature selection method based on the Histogram of
Oriented Gradients (HOG) [3], [9]; it consists of the following steps: • Computation of the gradient magnitudes and orientations in each point of
the input image. • Division of the input image in segments. For example, we can consider
cells of 5 x 5 pixels. An input image of 40 x 20 pixels can be divided into 32 cells.
• Computation of the Histogram of Gradient Orientations (HOG) for each cell. For example, one can choose 9 orientation bins. The “weighted votes” of gradients corresponding to these bins are proportional to gradient magnitudes. After this step, each cell can be expressed using these 9 coefficients that make the histogram of oriented gradients. An input image of 40 x 20 pixels can be represented by this method by a vector of 288 = 32 x 9 features. The orientation bins are evenly spaced over 0 – 180 (unsigned gradient) or 0 – 360 (signed gradient).
• Normalization of HOG features. We have used the unsigned gradient. For feature selection comparison variant, we have chosen Principal
Component Analysis (PCA). Classification using Concurrent Self-Organizing Maps E. Classification using Concurrent Self-Organizing Maps The considered classifier is based on the model of Concurrent Self-
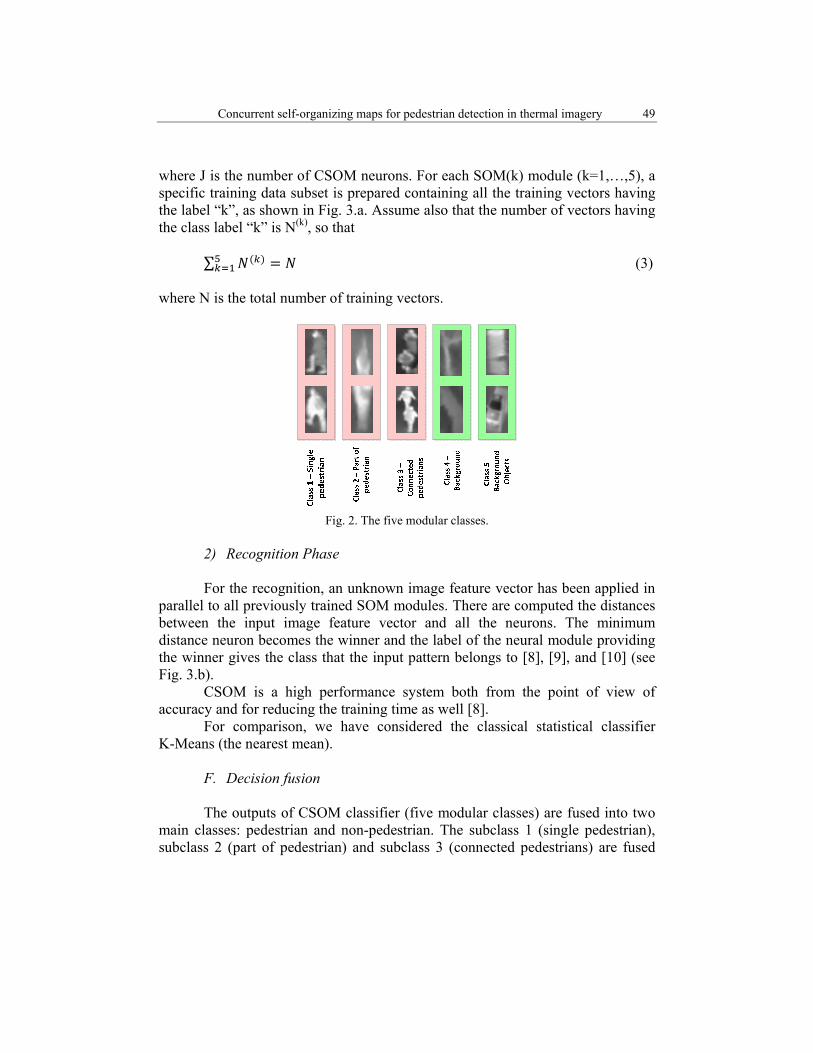
Organizing Maps (CSOM) [8], [9], [10]. It is a collection of small SOM modules, whose number is equal to the number of classes. Each module is trained to correctly classify the patterns of one class. We have divided each of the two base (final) classes (pedestrians/non-pedestrians) into several modular classes (subclasses). Thus, we have defined the following modular classes (Fig. 2): class 1 (single pedestrian), class 2 (part of pedestrian), class 3 (connected pedestrians), class 4 (background), class 5 (background objects). The CSOM consists of five SOM modules. Each of the five modules is trained using only the sample images for its corresponding class.
1) Training of each SOM(k) module (k=1,…, 5) Assume that the module SOM(k) has J(k) neurons; particularly, one can
choose
(2)
Concurrent self-organizing maps for pedestrian detection in thermal imagery 49
where J is the number of CSOM neurons. For each SOM(k) module (k=1,…,5), a specific training data subset is prepared containing all the training vectors having the label “k”, as shown in Fig. 3.a. Assume also that the number of vectors having the class label “k” is N(k), so that
∑ (3)
where N is the total number of training vectors.
Fig. 2. The five modular classes.
2) Recognition Phase For the recognition, an unknown image feature vector has been applied in
parallel to all previously trained SOM modules. There are computed the distances between the input image feature vector and all the neurons. The minimum distance neuron becomes the winner and the label of the neural module providing the winner gives the class that the input pattern belongs to [8], [9], and [10] (see Fig. 3.b).
CSOM is a high performance system both from the point of view of accuracy and for reducing the training time as well [8].
For comparison, we have considered the classical statistical classifier K-Means (the nearest mean).
F. Decision fusion The outputs of CSOM classifier (five modular classes) are fused into two
main classes: pedestrian and non-pedestrian. The subclass 1 (single pedestrian), subclass 2 (part of pedestrian) and subclass 3 (connected pedestrians) are fused

50 Adrian-Dumitru Ciotec, Victor-Emil Neagoe, Andrei-Petru Bărar
into pedestrian base class. The subclass 4 (background) and subclass 5 (background objects) are fused into non-pedestrian base class (see Fig. 3.b).
Fig. 3. CSOM classifier: a) Training phase b) Recognition phase
3. Experimental results
A. The database Evaluation of the tested method was done using the OTCBVS - OSU
Thermal Pedestrian Database provided by the Ohio State University. The images were acquired in different meteorological conditions and have the size of 360x240 pixels. The regions of interests (ROIs) were extracted and we used 2,260 ROIs for training the classifier and 1,967 ROIs for testing.

Concurrent self-organizing maps for pedestrian detection in thermal imagery 51
B. Parameters for Performance Evaluation In order to evaluate the performances of the proposed pedestrian detection
algorithm, we have chosen the following parameters:
False positive error rate (FPER)
100___
___⋅
−−
=spedestriannonofnototal
spedestrianasclassifiedspedestriannonFPER (4)
False negative error rate (FNER)
100___
___⋅
−−
=spedestriannonofnototal
spedestriannonasclassifiedspedestrianFNER (5)
Total success rate (TSR)
100___
____⋅=
candidatesofnumbertotalclassifiedcorrectlycandidatesofnumberTSR
(6) C. Pedestrian detection performances
1) Influence of HOG parameters In Tables 1, 2 and 3 the experimental results of pedestrian detection
performance as a function of HOG parameters are given.
Table 1 Performance for different HOG gradient masks using CSOM classifier
FPER FNER TSR
No. of HOG bins 5 9 18 36 5 9 18 36 5 9 18 36
Prewitt 3.20 3.26 3.20 2.75 14.07 11.11 6.17 3.70 94.57 95.58 96.40 96.85
Sobel 3.32 3.13 3.64 3.58 16.29 8.39 6.17 2.46 94.57 95.33 96.40 96.50
Simple 3.64 3.45 2.17 1.79 15.55 6.66 2.22 0.49 93.90 96.70 97.67 98.48
The simple gradient mask used to calculate HOG descriptor performs
better than Sobel and Prewitt masks in terms of FNER, FPER and TSR. The results can be explained as averaging effect of Sobel and Prewitt filters removes useful information (Table 1).

52 Adrian-Dumitru Ciotec, Victor-Emil Neagoe, Andrei-Petru Bărar
Table 2 Performance for different HOG cell dimensions using CSOM classifier
FPER FNER TSR
No. of HOG bins 5 9 18 36 5 9 18 36 5 9 18 36
δ=10 5.18 4.22 2.30 1.60 33.08 17.77 9.38 6.41 89.02 92.99 96.24 97.21
δ=5 3.64 3.45 2.17 1.79 15.55 6.66 2.22 0.49 93.90 96.70 97.67 98.48
From Table 2 one can deduce that by decreasing the size of HOG cells from 10 to 5 pixels, an increase of performance can be obtained.
Table 3 Performance for different HOG angles range using CSOM classifier
FPER FNER TSR
No. of HOG bins 5 9 18 36 5 9 18 36 5 9 18 36
0-360 2.75 3.39 2.24 2.17 9.13 8.88 2.96 2.71 95.07 95.84 96.9 97.14
0-180 3.64 3.45 2.17 1.79 15.55 6.66 2.22 0.49 93.90 96.70 97.67 98.48
From the results given in Table 3, we can conclude that the unsigned HOG descriptor proved to achieve significantly better performance by using a high number of bins.
2) Performance of different feature selection methods In Table 4 one can see the experimental results concerning the influence of
using different feature selection methods in our proposed cascade.
Table 4 Performance for different feature selection methods using CSOM classifier
Feature selection method FPER FNER TSR
Only image 2.49 3.20 97.36
PCA 2.62 11.35 95.58
HOG 1.79 0.49 98.48
HOG descriptor proves better accuracy than PCA and also HOG proves better than the variant without feature selection. In terms of FNER, the above differences are significant.
3) Performance comparison between CSOM and K-Means Table 5 presents comparative experimental results using CSOM and K-
Means.

Concurrent self-organizing maps for pedestrian detection in thermal imagery 53
Table 5 Performance comparison between CSOM and K-Means classifiers
Classifier FPER FNER TSR
K-Means 12.42 3.95 89.32
CSOM 1.79 0.49 98.48
The CSOM neural classifier performed significantly better than K-Means statistical classifier as shown in Table 5.
4) Scene analysis examples In Figs. 4, 5 and 6 we show the results of simulations performed on
different thermal images.
a) b) Fig. 4. Correct classified scene: a) Regions of interest detected in a thermal image; b) Classified regions of interests

54 Adrian-Dumitru Ciotec, Victor-Emil Neagoe, Andrei-Petru Bărar
Fig. 5. A scene with false negative miss detection
Fig. 6. A scene with false positive miss detection

Concurrent self-organizing maps for pedestrian detection in thermal imagery 55
In Fig. 4.a the region of interest detection results in a thermal image is presented, while Fig. 4.b presents the classification of the previously detected regions into pedestrian (red rectangle) and non-pedestrian (green rectangle).
Fig. 5 shows the results of pedestrian detection in a rainy scene where a false-negative detection occurs. The detection of entire pedestrian region failed.
Fig. 6 presents a scene with false-positive detection for the region in the upper image. There are also two detections that do not fit the entire pedestrian region as a consequence of bad image segmentation. The pedestrian presence is detected due to the presence of subclass of pedestrian class “part of pedestrian”.
4. Concluding remarks
1) The paper presents a neural network approach for pedestrian detection in thermal imagery using HOG feature extraction method.
2) The best performance of HOG descriptor is obtained calculating it by using simple gradient mask, a cell size of 5x5 pixels and angles in 0 – 360 range.
3) HOG descriptor proves better accuracy than PCA and also than the variant without feature selection.
4) The CSOM neural classifier performed significantly better when compared with K-Means statistical classifier.
5) There are situations when miss detection or partial detections occurs due to incorrect image segmentation. An improved segmentation algorithm can further improve accuracy results.
R E F E R E N C E S
[1] M. Bishop, Pattern Recognition and Machine Learning, Springer, New York, 2006. [2] C. Dai, Y. Zheng and X. Li, “Layered Representation for Pedestrian Detection and Tracking in
Infrared Imagery”, Proc. IEEE Conf. Comp. Vision Patt. Rec. - Workshops, 25-25 June 2005, San Diego
[3] N. Dalal and B. Triggs, “Histograms of Oriented Gradients for Human Detection”, Proc. Conf. Comp.Vision and Patt. Rec. (CPVR’05), June 20-26, 2005, San Diego, USA, vol. 1, pp. 886-893
[4] J. Davis and M. Keck. “A two-stage approach to person detection in thermal imagery”, Proc. 7-th IEEE Workshops on Application of Computer Vision, 2005, vol. 1, 5-7 Jan. 2005, Breckenridge, CO, pp. 364 – 369
[5] D.M. Gavrila, “A Bayesian, Exemplar-Based Approach to Hierarchical Shape Matching”, IEEE Trans. Patt. Anal. Mach. Intell., vol. 29 nr. 8, Aug. 2007, pp. 1408-1421
[6] R. C. González and R. E. Woods, Digital Image Processing (3rd Edition), Prentice Hall, 2008. [7] Z. Li, Q. Wu, J. Zhang and G. Geers, “SKRWM based descriptor for pedestrian detection in
thermal images”, Proc. 13th IEEE Int. Workshop on Multimedia Sign. Proc. (MMSP), 17-19 Oct. 2011, pp. 1–6
[8] V. E. Neagoe and A. Ropot, “Concurrent Self-Organizing Maps - A Powerful Artificial Neural Tool for Biometric Technology”, in Harbour Protection Through Data Fusion Technologies,

56 Adrian-Dumitru Ciotec, Victor-Emil Neagoe, Andrei-Petru Bărar
NATO Science for Peace and Security Series-C: Environm. Security, pp. 291-298, Springer, 2009
[9] V. E. Neagoe, C.T. Tudoran, and M. Neghină, “A Neural Network Approach to Pedestrian Detection”, Proc. 13th WSEAS International Conference on Computers, July 23-25, 2009, Rhodes Island, Greece, pp. 374 379
[10] V. E. Neagoe, A. Ropot, and A. Mugioiu, “Real Time Face Recognition Using Decision Fusion of Neural Classifiers in the Visible and Thermal Infrared Spectrum”, Proc. 2007 IEEE Int. Conf. Adv. Video & Sign. Surveill. (AVSS 2007), 5-7 Sept. 2007, London
[11] F. Xu, X. Liu and K. Fujimura, “Pedestrian detection and tracking with night vision”, IEEE Trans Intell. Transp. Systems, vol. 6, March 2005, pp. 63 – 71
[12] M. Yasuno, S. Ryousuke, N. Yasuda, and M. Aoki, “Pedestrian Detection and Tracking in Far Infrared Images”, Proc. IEEE Conf. Intell. Transp. Systems, 13-15 Sept. 2005, Vienna, pp. 182-187