
CONCLUSION - British Columbia · 4.5 CONCLUSION The descnpcion reveals a wide variation in...
59
4.5 CONCLUSION The descnpcion reveals a wide variation in practice. The report has described existing planning structures in a number of jurisdictions. used to identify feasible alternatives for structuring the prmess for forest land plannlng in British Columbia. Although the alternatives have not heen evaluated in this report, they have been These strategies can now be used to identify several altarnative structures which can be evaluated in light of the issues in British Columbia. Biophysical Analysis in Forest Land Planning: An Overview and Evaluation . Background Report Prepared for the British Columbia Forest Resources Commission Natural Resources Program by Chris Fletcher Simon Fraser University 30 November, 1990 148
Transcript of CONCLUSION - British Columbia · 4.5 CONCLUSION The descnpcion reveals a wide variation in...

4.5 CONCLUSION
The descnpcion reveals a wide variation in practice. The report has described existing planning structures in a number of jurisdictions.
used to identify feasible alternatives for structuring the prmess for forest land plannlng in British Columbia.
Although the alternatives have not heen evaluated in this report, they have been
These strategies c a n now be used to identify several altarnative structures which c a n be evaluated in light of the issues in British Columbia.
Biophysical Analysis in Forest Land Planning:
An Overview and Evaluation . Background Report Prepared for the
British Columbia Forest Resources Commission
Natural Resources Program by Chris Fletcher
Simon Fraser University 30 November, 1990
148

I
Contents
Contents Tables Figures
Section 1. Introduction
Section 2. Principles of Biophysical Analysis 2.0 Introduction 2.1 Biophysical Classification
2.1.1 Defining Homogeneous Areas 2.1.2 Scale
2.2 Land Use Evaluation 2.2.1 Land Use Capability, Suitability, and Feasibility 2.2.2 Rating Use Capability 2.2.3 Deriving Composite Capability Maps
2.3 Land Use Decision Making 2.4 Implementation and Monitoring 2.5 Geographic Information Systems 2.6 Case Studies
2.6.1 Tsitika Watershed Integrated Resource Management Planning 2.6.2 Land use planning in Grande Prairie, Alberta
2.7 Summary
Section 3. Classifications and Inventories: the Tools of Biophysical Analysis 3.0 Introduction 3.1 The Canada Land Inventory 3.2 Canada Committee on Ecological (Biophysical) Land Classification 3.3 The British Columbia Land Inventory
3.3.1 Prime Use Maps 3.3.2 The Agricultural Land Reserve
3.4 Biophysical Classification and Inventories in BC 3.3.3 Folio and Integrated Resource Planning
3.4.1 Biophysical classification in the Ministry of Environment 3.4.1.1 Soil and Agricultural Capability 3.4.1.2 Vegetation 3.4.1.3 Wildlife 3.4.1.4 Fisheries and Aquatic Systems 3.4.1.5 Terrain Classification 3.4.1.6 Water Resources
3.4.2.2 Biogeoclimatic Classification 3.4.2.1 Timber
3.4.2.3 Recreation and Tourism 3.4.2.4 Range Resources
3.4.2 Biophysical Classification in the BC Ministry of Forests
3.4.3 Conservation Planning in the BC Ministry of Parks 3.4.4 Mineral and Energy Potential: BC Ministry of Energy, Mines, and Petroleum
3.5 Using Biophysical Information in Land Allocation . Timber Supply Area Planning 3.6 Summary
Resources
12 5
15 15 18 23 20 29 30 32
40 32
45
47 47 51 52 54 54 56 57 59 60 61 61 65 66 6% 69 70 71 72 74 75
76 78 82

I
.. I I
Section 4. Evaluation 4.0 Introduction 4.1 Evaluative Criteria 4.2 Evaluation
4.2.1 Systematic 4.2.2 Understandability 4.2.3 Economy 4.2.4 Comprehensiveness 4.2.5 Decision orientation
Section 5. Conclusions and Recommendations 5.0 Introduction 5.1 Conclusions 5.2 Recommendations 5.3 Final Comment
Section 6. References
Table 2.1
Table 2.3 Table 2.2
Table 2.4
Table 3.1
Table 3.2 Table 3.3
87 87 88 88 90 91 92 95
97 97
102 98
103
Tables
A generalized ecological hierarchy 16 Tsitika Watershed Folio Maps 38 Land use limitations and rating scheme, Crande Prairie land use planning. 42 Ecological land use matrix for Crande Prairie plan. 43
Ecological categorization proposed by the Canada Committee on Ecological Land Classification 53
Biophysical wildlife habitat classification in British Columbia 63 Summary of biophysical classifications and inventories in British Columbia. 85
Figures
Figure 2.1 Stages of Biophysical Analysis Figure 2.2 Land capability mapping emphasizing biophysical homogeneity Figure 2.3 Mapping and evaluation emphasizing homogeneity of land use capability Figure 2.4 Weighted factor addition Figure 2.5 Added factor analysis Figure 2.6 Sorted factor or decision tree combination Figure 2.7 Land use compatibility matrices. Figure 2.8 Tsitika Watershed Land Use Summary Map Figure 2.9 Ecological classification map for Crande Prairie area. Figure 2.10 Ecological planning units for Crande Prairie, Alberta. Figure 2.11 Land use plan for Grande Prairie, Alberta.
3 6
21 9
24 25 26
41 39
44 44
I
1
Section 1. Introduction
One of the most common methods for analyzing land management options is the
biophysical overlay approach pioneered by Hills (Hills et a/. 1970) and McHarg (1969). This
approach forms the basis of the Canada Land Inventory and the British Columbia Land
Inventory systems and is a commonly used technique for preparing land use plans in British
Columbia.
The purpose of this report is to evaluate the effectiveness of biophysical overlay
methods in land use planning. The report begins with an analysis of the principles of
biophysical classification and land use evaluation. This will serve as a basis for discussion of
biophysical planning systems, and assist in formulation of criteria to be used to evaluate
currently used methods. The report will conclude with an assessment of the role of
biophysical techniques in land use planning in BC.

2
Section 2. Principles of Biophysical Analysis
2.0 Introduction
AII human activities are affected by, and in turn affect, the biophysical environment.
The principal purpose of biophysical analysis is to assist in the allocation of land and water
resources1 to appropriate uses. Biophysical analysis is one potential input into the broader
land use and management planning process. Figure 2.1 outlines the stages of planning in
general, and of biophysical analysis.
The first step in planning is to identify, with the assistance of all affected interests. the
issues and scope of the planning process. This includes discussing and choosing land use
goals and specific objectives to guide subsequent data collection and evaluation. The first
stage also involves defining the study area and the range of prospective land uses to include
in the analysis. The second step is to gather information to assist in formulation of alternative
policies or plans. These alternatives are then evaluated using criteria developed from the
stated goals and objectives. A decision is then made from among the alternatives.
Implementation of the chosen alternative involves specifying responsibilities of different
interests, and outlining applicable legislation, regulations, and relationships among adjacent
land use areas, including appropriate restrictions on use (Luff and Ojaama 1979). Finally, plan
implementation is monitored to ensure that objectives are being met.
Biophysical analysis specifically involves information collection and evaluation.
However, it has implications for all planning stages. After issues, goals, and objectives are
determined, the biophysical analysis begins with collection of the data necessaiy to classify
resources in the study area into units with homogeneous land use capability. These units are
then evaluated for each prospective land use. The single use evaluations for the area are then
synthesized into a composite evaluation. The composite evaluation could indicate the best
3
Figure 2.1 Stages of land Use Planning
I Collect inlormalion
1 Formulate dlernalirw
I 1 1
lmplmenl plan
Yonilor
1. Both l a n d p d water systems must be evaluated for their ability to provide goods and services. In this section. "W will be used Io refer Io both tewestri.l and aquatic resources.
use for each land unit from a biophysical perspective, or possibilities for multiple use based
on compatibilities and incompatibilities among uses. The synthesis stage essentially involves
generation of alternative land use allocations, and investigation of their biophysical
implications. The land use decision uses results of the biophysical analysis and other
techniques to choose the land use alternative that best meets social goals and objectives.
The steps of land planning and biophysical analysis are iterative. As each is executed.
need for misions at previous levels may become apparent. Data collection may indicate that

4
initial issue identification was too narrow, goals were unrealistic, or the biophysical
classification scheme was inappropriate. Attempts at evaluation may highlight information
deficiencies. If monitoring shows that institutional arrangements are blocking objectives. or
that the trade-offs (eg. job loss) involved in the plan are higher than anticipated, the planning
process may be reinitiated.
The purpose of this paper is to describe and evaluate biophysical classification and
evaluation, and to examine their role in the decision making, implementation. and monitoring
stages of land use planning. Issue, goal, and objective identification are not discussed in
detail: however, these steps are critical to focus and direct planning efforts. Since not all
biophysical information may be relevant to the decision at hand, data collection and analysis
must be focused to avoid excessive expense. Further, all decisions must be based on criteria
developed from stated goals and objectives. Biophysical analysis is one aspect of planning
that can assist in meeting and refining, but not in initially identifyng, social goals and
objectives.
2.1 Biophysical Classification
The goal of biophysical classification is to distinguish homogeneous units which will
respond uniformly to land use management actions. The capability of land for different uses
depends on interactions among many ecological components: climate, soils, water. bedrock,
surface material (eg. glacial till, river and lake deposits). vegetation, and wildlife. Capability
analysis requires that land be classified into units with sufficient homogeneity of ecological
interactions to allow a single capability rating. In North America. Angus Hills (Hills et a/. 1970)
and Ian McHarg (1969) were important in their recognition that the processes linking
environmental components determine how land systems affect and are affected by human
uses. Their work is illustrative of two basic approaches to biophysical classification. Hills'
approacb was to delineate areas based on their biophysical homogeneity, and then to
determine the capability for all land uses within these units. McHarg's approach was to
I
" "" ..
5
delineate areas of homogeneous use capability separately for each land use. The approach
chosen will determine data collection strategies, including decisions on which data to collect.
Besides choosing an area delineation technique, planners undertaking biophysical
analysis must also decide on the level of detail required. Data scale is therefore another
important issue in biophysical analysis, and will be discussed subsequent to area delineation.
The following subsection describes the approaches to area delineation.
2.1.1 Defining Homogeneous Areas
Approaches to unit delineation can be rooted in either homogeneity of biophysical
attributes (eg. Hills et a/. 1970). or of land use capability (eg. McHarg 1969).
Methods based on the homogeneity of biophysical attributes use the premise that
since ecological processes determine how an area will react to any land use, all uses should
be evaluated within the same biophysical units. A common procedure is to divide a study
area into units of increasing homogeneity using a hierarchical classification. For example, the
entire study area may consist of two generally distinguishable areas. Both of these areas could
be further broken down by observing phenomena at more local scales. until a homogeneous
site with uniform biophysical features and processes emerges. For example, in a classification
described by Wiken (1986). ecoregions are defined as areas where regional climate has
resulted in broadly similar patterns of vegetation. soil, and wildlife. Ecodistricts consist of
distinctive patterns of relief. geology, and landforms within ecoregions. Ecodistricts are
divided into ecosections. based on recurring patterns and ranges of landforms, soil, and
vegetation. kosites are subdivisions of ecosections with fairly uniform soil parent materials.
soil development, and hydrology. Finally, ecoelements are areas of homogeneous soil
characteristics and depth. vegetation successional patterns, and slope within ecosites2 (see
figure 2.2).
2. This nomenclature has developed from that of Hills et ai. (19701 and Lacate l1%9l. The cormponding names propod by I h m authors were h d -ion (ccorqionl. land district (ecodistrict), land system (ecomtion). land type lecorite), and site phase (ecoelement).
~

6
Figure 2.2 Land upabil ity mapping emphasizing biophysical homogeneity
map).
rn c--" Total Study Area
Ecoregion:
vegeta on. terraln broad1 similar climate.
(eg. mountains v. plains) &
E c o d ~ t r k t : distinctive pattern of relief.
feg. snguhr mountains v. lor rounded hills)
- eology. landforms
Ecosectiop: - Ecosite:
- (eg. ridge top v. midsl
wildlife capability
recreation capability capabihp
vegeta-tion
Rone (1979); Canada. FEAR0 (1900);
7
Units at each level of such a hierarchy can then be rated for their land use capability.
Classification may consist of initial disaggregation into ecologically homogeneous units,
followed by grouping of some areas into units with similar constraints or opportunities for a
land use (Hills et a/. 1970; Hopkins 1977; Luff and Ojaama 1979).
A broad distinction can be made between component and integrated biophysical
classifications (Driscoll et a/. 1984; Pojar et al. 1987). Component classification consists of
separately mapping environmental factors such as soil, vegetation, landform, and water. By
overlaying these maps, one can distinguish areas with identical components. For example. the
biophysical land classification used by the BC Ministry of Environment during the 1970s
delineates homogeneous areas with overlay maps of physiography (major geologic systems
like mountain ranges, plateaus, valley systems), vegetation, bedrock and surficial geology,
aquatic systems, and soils (Walmsley 1977). Driscoll et a/. (1984) describe a component
classification for the United States, combining soil, vegetation, aquatic, and landform
elements.
Some ecologists feel that ecosystems are functional units defined by interactions
among biophysical components and cannot be delineated simply by merging similar things
(Bailey 1987; Rowe 1980; Rowe and Sheard 1981). Such authors propose a more ecologically
based integration of biophysical features and processes, concentrating on how these factors
interact to form functional ecosystems. The systems described in Wiken (1986) and Lacate
(1969) are integrated classifications (see figure 2.2). The biogeoclimatic system, an integrated
classification developed in BC (Polar et al. 1987), places more focus on climate, vegetation,
and soils. and less on landforms when defining ecosystems. Other examples are discussed by
Hawes et al. (1976). Rowe and Sheard (1981). and Pattison (1984). The concept of integrated
classification is fairly recent. Area delineation criteria within integrated systems are frequently
inexplicit (Bastedo and Theberge 1983), or are very complex (eg. Pojar et a/. 1987).
The second basic classification approach emphasizes homogeneity of capability for a
specific land use. Approaches based on land use delineate units differently for each use

6
depending on the specific requirements and tolerances of each activity. One way to delimit
units of homogeneous use capability entails mapping each biophysical component according
to its suitability for a particular use. For example, a terrain map for agriculture might consist Of
three classes: relatively flat land good for agriculture; steeper land with some limitations. and
land too steep or rugged for agricultural use. Similar maps are constructed for each relevant
biophysical factor for each prospective land use. Oiredaying the factor capability maps for
each land use delineates areas of overall homogeneous capability for that use. Homogeneous
units could also be delineated by considering all relevant biophysical facton together as they
interact to determine use capability. Different approaches for synthesizing data into
composite ratings are discussed in section 2.2.2. Figure 2.3 outlines the land use approach to
area delineation.
A major difference between area delineations based on biophysical factors and land
uses is the degree to which non-biophysical aspects are incorporated. Development of the
biophysical area delineation philosophy and methods has focused on the underlying
ecological theory. But social, economic, and cultural factors also affect land use (Bastedo et
a/. 1984: Friend 1979: Nelson et a/. 1988). While it is possible to conceive of a system of
fixed biophysical-socioeconomic units, it would be difficult to include all factors important to
all land uses. Area delineation based on land use offers more flexibility in this respect.
Celinas (1986) discusses a method for linking fixed biophysical and socioeconomic
units to assist in planning. The "environomic" units combine the ecological land classification
of the Canada Committee on Ecological Land Classification (Rowe 1979; Wiken 1986) with the
Statistics Canada geostatistical data classification system. Delineation of environomic units
requires integration of ecological and socioeconomic data corresponding to units of similar
scale to ensure data comparability. Integration of these data early in the planning and
classification process also simplifies data collection and presentation (Gelinas 1986).
recognkes the roles of human activity in ecosystems (Bastedo et a/. 1984). and allows
monitoring of changes over time (Celinas 1986).
9
Figure 2.3 Mapping and evaluation emphasizing homogeneity of land use capability
Steps:
2 ) Collect data on these factors. 1) Determine biophysical requirements for each prospective land use.
3) Divide land into areas 01 uniform capability for each prospective use (may involve combining capability maps for each biophysical lactor into a composite map).
4) Rate capability of each unit for each use (one map lor each land use).
climate
geology
soil - vegetation /
forestry
requirements - medium
high
forestry capability
I I low I
biophysical agriculture
factors requirements -I4 medium ___c
capability agriculture
biophysical wildlife
factors -
requirements -
wildlife capability
10
Gelinas uses environomic units to highlight areas of high soil erosion hazard by cross-
referencing agricultural practices with patterns of soil moisture, precipitation, and wind. BY
overlaying this map with one showing agricultural labour distribution, he then outlines areas
with high potential for labour displacement due to erosion-induced farm failure.
There are many other possibilities. Industrial activity, environmental pollution. and
human health indicators could be cross-referenced to illuminate possible health hazards.
Sustainable timber growth (long run sustainable yield) could be compared with current harvest
levels and proportion of regional employment in the forest sector to highlight areas where
harvest “falldowns” might result in layoffs. Overlaying proposed protected areas and
forecasted resource extraction could point to priority areas for studies to determine the
likelihood of irreversible loss of ecological resources, or if alternate areas might be available
either for ecological conservation or resource extraction.
Bastedo et a/. (1984) and Nelson e! a/. (1988) describe the ABC system. which
incorporates cultural (C) with abiotic (A) and biotic (8) features and processes in describing,
analyzing, and developing management frameworks for ecologically sensitive areas. The ABC
system recognizes the important effect cultural features and processes, such as settlements,
pipelines, transportation corridors. and resource extraction (hunting, logging). can have on
biophysical systems. The ABC system therefore involves compilation and integration of data
for each category (abiotic, biotic, cultural). while recognizing the need to retain information
for specific decision making needs.
Whether the classification focus is on biophysical characteristics or land use
requirements, criteria for delineating areas must be determined early in the.classification and
mapping process. For a purely biophysical classification these could be the vegetation, soil, or
landform type. For a land use based classification, criteria might include slope, soil drainage
characteristics, and vegetation productivity. Further, criteria are required to determine the
range or variability of each feature to be included within each land unit. At larger scales, a
biophysical classification unit would incorporate less variability in landform or vegetation type
i
11
than at smaller scales. In a land use based classification, the analyst may, for example,
delineate units by estimating the range of slope over which a given use is impossible.
moderately possible, or unaffected.
Gestalt methods use non-explicit rules emanating from experience and a holistic viem,
of the environment to define homogeneous ecological systems (Hopkins 1977). Since the
ecological processes linking environmental features are often not quantified, patterns and
qualitative features recognized through experience may be used to define distinct ecosystems.
The early work of Hills is an example of gestalt classification (Hopkins 1977): Hills provided no
quantitative, and only very broad qualitative differentiating criteria. This is particularly true
when Hills combined areas initially delineated by biophysical criteria alone into interacting
biophysical and human systems of common use capability. The integration process is based
on judgement and experience, rather than clear guidelines. The degree to which a gestalt
classification reflects ecological reality depends on the experience of the analyst. Further.
people with different backgrounds and foci will likely produce different gestalt classifications
of the same area, and future users may have difficulty in understanding reasoning behind the
classification.
By following explicit rules of combination (Hopkins 1977), different analysts can arrive
at similar classifications of an area Such rules could consist of qualitative criteria, such as tree
species. soil type, or landform, or quantitative criteria. such as slope. precipitation, soil depth,
or percent tree canopy cover. Increasingly explicit rules improve chances that classifications
will be replicable. and comparable among different areas.
Perceptions differ as to which biophysical factors should form the basis of ecological
classifications. Climate is most often used to divide land at a broad level into units having
fairly uniform biological and physical processes. Vegetation is frequently used to infer climate,
Since climate data are often lacking (Pojar et a/. 1987). Landforms are felt by many (Bailey
1985; Rowe and Sheard 1981) to be the best criteria for unit delineation after broad climatic
division, since they are stable. Vegetation is a good indicator of ecological processes, but is

12
relatively changeable. However, some important classifications (eg. Pojar et a/. 1987) are
based more on vegetation as an indication of zonal climate than on landforms.
In general, a classification must be judged on its ability to meet the objectives for
which it was designed. No one ecosystem typology is better than all others. Ecosystems are
human not natural constructs, and are therefore a function of the designet's approach
(Whittaker 1978). The classification design process is not simple, nor will it ever be complete.
New knowledge and new needs require periodic revisions of classification systems.
Two classifications in BC illustrate that ecosystem delineation is not a trivial. purely
technical task with only one correct answer. The biogeoclimatic classification used by the BC
Ministty of Forests (MoF) originally had 11 zones (Kajina 1969). then 13 (Pojar 1983). and now
14 (BC MoF 1988a). Accumulating experience showed that different breakdowns would prove
more useful for developing management prescriptions. Similarly, the classification being
reviewed for the BC Ministry of Park; (MOP) system plan proposes 59 representative
landscapes for the province. Landscapes are defined by landform, vegetation, wildlife.
climate, and aquatic systems (BC MOP 1990a). The MOP landscapes incorporate visual and
scientific criteria. The ecoregion classification of the 8C Ministly of Environment (MoE)
Wildlife branch currently recognizes 33 ecoregions - areas delineated by ecological factors
similar to BC Parks landscapes - and 83 ecosections, based on minor climatic and
physiographic vatiations within ecoregions (Demarchi 1987). Either system could be used as
the basis for the BC parks system. The final decision will require consensus among earth
scientists, plant and wildlife ecologists, and climatologists. Currently. there is no clear
consensus on definitions or mathematical indices on which to base simple solutions for these
classification problems,
21.2 Scale
Different ecological features and processes at various spatial scales are relevant to
different types of land use planning. Therefore, different ecosystems, or parts of them, are of
I I
! I i ! 1
I i 1 I
13
concern to planners. Someone laying out a pipeline may not be concerned with how
vegetation, soils, terrain. wildlife, and aquatic flora and fauna form an interacting system. They
need to know something about terrain stability and perhaps flood hazard in a relatively local
area. For more extensive activities, such as timber harvesting, a broader inclusive view will be
necessav to understand the effects of harvesting on wildlife, and the cumulative effects on
watershed hydrology. A regional planner requires general information about the types and
distribution of activities suitable to the region, Someone planning a single timber harvesting
block needs site specific information to determine the volume to be harvested, formulate
management prescriptions, and highlight resource interactions. To meet different needs,
biophysical classifications must integrate different factors at different scales. Section 3
describes some biophysical classifications used in BC for various planning and management
purposes.
-
Hierarchical classifications, that is, those integrating ecosystems at different scales,
help to place smaller systems in their larger context. Homogeneous biophysical units, defined
either within a component or integrated framework (see subsection 2.1.1). form a landscape
mosaic with characteristic processes different from what one would expect by simply
combining the processes of the component units. This is because the units themselves
interact (Bailey 1985). Understanding the effects of management over space and time, and
interactions among land uses, requires an understanding of how individual biophysical factors
interact to form homogeneous ecosystems or biophysical units. and how smaller ecosystems
interact within larger ones,
Hierarchical classifications attempt to delimit ecosystems at different scales according
to the most important determinants of their features and processes (Bailey 1985, 1987). At
larger scales. macroclimate. broad temperature and precipitation regime . is the major
determinant. Classifications which delineate units according to macroclimate are termed zonal
(Bailey 1985). At smaller regional and local levels, different scales of topography ~ geologic
materials. elevation. aspect. slope - modify the effects of macroclimate (Bailey 1985: Rowe and

r=.i _ _ - ~ _ c = _ _ ~ -4"""."~ __I ~ ~ ~~ ~~~ ~~~~ ~~ ~ ~
14
Sheard 1981). The classification described in Wiken (1986) shows how climate and
topography can be used to delineate increasingly small and homogeneous units (see figure
2.2).
At each scale, the units contain different amounts of variability. Smaller scales (eg.
1:250,000 or 1, cm = 2.5 km)3 provide a broad idea of biophysical unit characteristics:
landform and soil types, predominant vegetation. At larger scales (eg. 1:20.000 or 1 cm =
200 m) one can incorporate much more detail into unit descriptions.
For example, in general. the Pacific coast of BC is, due to moist air and the
temperature moderating effects of the ocean, wetter and warmer than the northern interior
plateau to the east of the Coast Mountains. These climatic differences have resulted in
different soils, landforms, and vegetation. The coastal region topography is generally steeper
and more rugged than in the interior. having implications for transportation and industrial
activities. Consequently, these two large regions have broadly different economic potential
based on natural resources.
Within the coastal region, the shoreline areas have direct interaction with the ocean.
while more inland areas receive indirect oceanic effects (wind, moisture) and have different
topography. While these subregions interact . shore areas recetve eroded material from
inland - the interactions are stronger within the subregions than between them.
The inland area is composed of many watersheds which are similar, but again,
interactions within a watershed are stronger than between watersheds. Management actions
such as logging, mining, or hunting will have far larger effects on the watershed in which they
occur than on the coastal area in general. However, the action will have an effect on the
remaining resource inventory, and therefore the economy of the region.
The watershed may have one generally north-facing slope and one predominantly
south-facing. These two slopes will receive different amounts of sun and rain or snow, and
3. Relalirtrcak size is an in- Iunclicm of Ihe number after the colon. tR50,lMO is smaller than 1R0.000. A unit mapped a1 1:ZM,000 rill appear smaller than at 1:2O,OOO.
I
15
therefore exhibit different soil-forming processes and vegetation growth potential. The same
management treatment will have different effects on these slopes.
Each slope is a mosaic of different forest types, wetlands, meadows, and streams.
Each patch within the mosaic has different capability for any given land use and will react
differently to management actions. But activities in one patch will affect ecological processes
in surrounding, and perhaps even more distant patches; for example, if a landslide moves soil
into a stream, the effects may be felt further downstream.
Mapping of each of these levels requires use of different scales to provide planners or
managers with appropriate detail and information. Different scale maps therefore have their
own appropriate uses. Table 2.1 summarizes a general ecosystem hierarchy with common
scales and planning uses.
2.2 Land Use Evaluation
After delineating homogeneous land units, the next step of biophysical analysis is to
evaluate the ability of these units to support different uses. This subsection first discusses
different aspects of evaluation based on biophysical potential, current administrative status.
and social and economic factors. It then describes ways of integrating data on different
biophysical factors into evaluative ratings for specific land uses. Finally, the synthesis of ratings
for each land use into a composite land capability map is examined.
2.2.1 Land Use Capability, Suitability, and Feasibility
The ability of land to provide goods and services depends on the requirements of
related land use activities, and on the l a n d s biophysical characteristics. Land can either
constrain or facilitate different uses. However, limitations can be removed, and opportunities
enhanced through various management actions. Further, socioeconomic factors, such as
market location. demand, and input costs affect the advantage to a society of using particular
biophysical resources.
"1

16
Table 2.1 A generalized ecological hierarchy
Unit name and approx. size Common map scale Boundary
Criteria Uses
1:3,000.000 to Macroclimate Provincial Region’ 1:2.000,000 Large scale planning and
(ecoregion2. 100.000 km2 (mountain range, macroecosystem3) plateau, valley
physiography ovewiew
system)
1:1.000,000 to Variability Regional Landscape 1:250.000 within broad strategic mosaic1 physiography: planning
(ecosection2, in large plateau. goal setting) mesoecosystem3) - different ranges
1.000 km2 - basinsluplands (economic potential:
in mountainous region.
1:250,000 to Local landform General 1:50.000 (surficial material reconnaissance
bedrock, inventory Sitel 1-70 km2 slope aspect) - land allocation
(habitat unit2. 1:20.000 microecosystem3~
> 1 km2
Vety specific Detailed features inventory (slope change. - management soil depth) or prescriptions processes (sensitive soils, fish habitat)
Notes: 1. Miller (1978) in Bailey (1985). 2. Demarchi (1990). 3. Rowe and Sheard (1981).
. . 1
17
I : ~
Capability, suitability, and feasibility correspond generally with these three aspects of
I land evaluation (Hills et a/. 1970). Use capability can be defined as inherent productive
potential given specified management actions and intensity, and any economically and
technically feasible improvements. Use suitability is the unit’s ability in its current state to
produce specified goods and setvices. This may include current administrative status, as well
as physical condition. Use feasibility combines capability and suitability ratings with
forecasted socioeconomic conditions to rate the advantage of pursuing a certain land use.
Capability and suitability are differentiated by the economic viability of overcoming limitations
to use. If removal of an existing limitation is affordable, the land would be rated as capable
of. but not currently suitable for, producing the desired goods. The degree of effort required
to overcome the limitation can be incorporated in a Suitability rating (Hills et a/. 1970).
Some authors use different terms for these concepts (Vink 1980 202-206). or use
terms interchangeably (Steiner 1981). McHarg (1969) felt that ecological characteristics gave
value to land, which both constrained and facilitated human activities. His evaluation of land
suitability tor different uses incorporated socioeconomic factors such as distance to
manufacturing or population centers. Therefore, McHarg’s value and suitability are similar
respectively to Hills’ capability and feasibility. However, the general concepts as described by
Hills et a/. (1970) suffice in distinguishing the different land evaluation concepts. Land has
inherent productive potential (capability) for a land use, but its current physical or
administrative state may preclude optimum biophysical productivity (suitability).
Socioeconomic factors may increase or detract from opportunities to use an area (feasibility).
The remainder of this section focuses on biophysical capability. However, the methods
discussed are applicable to suitability and feasibility analysis as well. While land must be
biophysically capable before being allocated to any use, suitability and feasibility analysis are
also critical in allocating lands to appropriate uses.

18
2.2.2 Rating Use Capability
Different biophysical attributes of an area may limit or facilitate a particular land use.
Beginning with a knowledge of land use requirements. capability ratings can be determined
either by evaluating limitations relative to optimum land, that is. with no limitations. or by
compiling a list of specific opportunities offered.by the area
Perhaps the best-known Canadian example of a capability rating system is the Canada
Land Inventory (CLI). Most ratings in the CLI are based on limitations to Use; for example: Soil
fertility, soil moisture. and slope limitations to agriculture or forestry: bod and cover
availability for wildlife. Recreation ratings, conversely, are based on specific OpPOrtUnities,
such as beaches, water access. and scenic features. The CLI ratings are for use capability as
defined above; that is. inherent productive potential with economicdb and technically feasible
improvements (DREE 1970).
Land use capability is usually determined by the interaction of several biophysical
factors. Determining a single capability rating therefore requires either combining ratings of
separate environmental components into a summary index, or evaluating combinations of
factors for their use capability. An example of the first case is the combination into one index
of separate evaluations of slope characteristics and soil stability or productivity. In the second
case, slope and soil characteristics would be evaluated together in a way that recognizes the
interactions between them. As with area delineation, capability evaluations can be derived
using either explicit or non-explicit (gestalt) methods. Gestalt evaluation involves combining
separate factor evaluations according to non-explicit, experience-based criteria. However. for
users to understand the evaluation, systematic criteria are needed.
McHarg's (1969) approach was to combine separate evaluations of Soil, topography.
vegetation, surface materials, and climate into a single land use capability rating (Hopkins
1977; Westman 1985). Capability ratings with respect to individual biophysical facton may be
combined using various techniques (Hopkins 1977; Smith and Theberge 1986). Hopkins
(1977) describes ordinal, linear, and non-linear methods.
19
An ordinal scale is one in which the classes are ranked, but are not separated by
consistent intervals. For example, soil characteristics could be rated in a 7 class system. with
class 1 being of better quality than class 2, and so on. The difference between class 3 and 2.
however, is not equivalent to the difference between class 2 and 1. An example of ordinal
combination is the overlaying of maps shaded according to the use capability of each unit: no
shading for no limitations: darker shades for increasing limitations. The resultant map
theoretically shows areas of high (white or light). and of poor (dark or black) potential. This is
equivalent to adding ratings for each biophysical factor. For example, land unit A might have
a soil rating of 5 out of 7. and a terrain rating of 3, while unit B has ratings of 2 and 6.
respectively. One could conclude, through ordinal combination, that the units are of equal
capability. However, this constitutes inappropriate mathematical manipulation of ordinal
numbers (Hopkins 1977; Smith and Theberge 1987). The intervals between numerical scale
ratings (for instance, from 1 through 7) derived by ranking qualitative land characteristics, or
descriptive terms (good. medium, poor) are not necessarily equivalent, and therefore ratings
cannot be added, subtracted, multiplied, or divided. Ordinal addition ignores this issue of the
potential unequal distance between capability classes.
1 I
~
Another drawback of ordinal combination is that it does not account for interactions j among ecological factors in determining use capability. That is. for example. the effect of
slope on use capability is assumed to be the same regardless of the soil or surface material i
present. Slope stability, however, is normally a function of the interplay between steepness l and underlying material. In general, biophysical factors interact as parts of interacting !
feedback loops. For example, climate affects soil development and plant growth; plant ~
growth affects soil development and vice versa. Plant growth may affect the nature and
amount of precipitation reaching the ground, thereby further affecting soil development. It is ~
not as simple to separate the effects of ecosystem factors from one another as ordinal !
combination assumes.
j
Linear combination methods attempt to overcome one shortcoming of ordinal !

20
combination by transforming factor ratings to a scale of equal intervals. This is done by
transforming ratings to a percentage of some reference, or equally dividing the possible range
of values, for example, rainfall, or density of soil nutrientsAHopkins 1977). Weights can then
be used to alter factor ratings according to their relative importance. For example. soil
characteristics may be more important than slope in deciding capability for a given use.
Therefore, soil ratings could be multiplied by a higher factor than slope ratings. Adding
weighted ratings then results in an overall capability rating. Figure 2.4 outlines the basic steps
in weighted factor addition (Canada. FEAR0 1980). and provides two hypothetical examples.
one evaluating commercial forestry feasibility, the other evaluating conservation quality.
Addition of linear scale ratings for each biophysical component assumes that each
factor affects use capability independently, and therefore ignores factor interactions, as does
ordinal combination. It also assumes that equal changes in biophysical factors affect land use
capability equally. For example, if area A receives 10 cm less rain than area B. linear
combination assumes that the difference between the agricultural capability of area A and B
would remain constant regardless of whether area B receives 50 cm or 200 cm. This is not a
valid assumption; capability often changes in a non-linear fashion. Agricultural capability may
increase significantly as rainfall increases from 20 cm to 30 cm, but hardly at all as i t increases
from 100 cm to 110 cm.
Non-linear combination techniques attempt to overcome the questionable
assumptions of linear combination by acknowledging environmental interdependence, and
non-linear effects (Hopkins 1977). Both of these considerations may be incorporated into
ratings if the mathematical relationship between factors is known. For example, runoff and
soil loss can sometimes be aetermined given plant cover, slope, and watershed form (Hopkins
1977). However, few interactions are sufficiently well understood to allow accurate non-linear
combination in developing capability classifications.
Q l e way to overcome the limitations of combining separate factor ratings is to
develop rules of combination (Hopkins 1977). Such rules define capability classes using
21
Figure 2.4 Weighted factor addition
1) Determine important biophysical factors and a representative variable which affect . land use capability.
3) Raw each factor on a common interval scale. eg. 1-10, 1 being the lowest quality 10 beina the highest.
4) Multipl;weighs-by the corresponding rating. 5) Determine Class number by dividing the 0-100% scale equally into the desired
number of classes,
Class Definitions: (1) 81-100 (3) 41-60 (5 ) 0-20 (2) 61-80 (4) 2140
Example 1: Rating an area for commercial timber operation.1
Factor Variable Weight (96) Rating
(1 ~ 10) Weighted Ratinc (%)
Productivity Soil fertility 30
Operability SlopelRelief 30 4
wildlife habitat slope failure/ stream 20 Disturbance to fish/ Possibility of
5
6 18
12
sedimentation 10
Market Access Distance to mill 20 4 8
(Class 3) 48
Example 2: Rating an area for conservation.2
Factor Variable Weight (%) Rating Weighted (1 - 10) Rating (%)
Urgency rare species Presence of
40 7 28
4 8 Viability Area size 20
Current protection
Representation in parks system 40 6 24

22 23
explicit criteria for one or more biophysical components. For example, agricultural capability
may be deemed to depend on slope, soil permeability, and subsurface material as they
mutually affect machinety effectiveness, slope stability, and susceptibility to soil erosion and
compression. These factors could be combined into two classes. High capability areas could
be defined as those with slope less than 25%. and with slope greater than 25% combined with
either well-drained soil or non-clay subsurface material. Low capability would occur where
slopes greater than 25%. poorly-drained soils, and a clay subsurface coexist (adapted from
Hopkins (1977)).
In another example, Ferguson (1981) overlays maps of slope aspect, slope gradient.
distance from ridge tops, and soil depth to delineate homogeneous topographic land units.
Combining this information with equations linking topography and soil characteristics with tree
growth (ie. site index) he then estimates the biophysical capability of each unit for timber
production.
Evaluations based on combinations of environmental factors recognize implicitly the
interactions among factors. Judgement is used in developing the rules and corresponding
capability classes, but the criteria are explicit, and allow subsequent users to evaluate the
assumptions critically.
The Federal Environmental Assessment and Review Office guidelines for ecological
analysis (Canada. FEAR0 1980) describe different approaches to defining capability classes
with rules of combination including: the presence or absence of a single factor: the number
and type of limitations (figure 2.5); and sorted-factor analysis or a hierarchical decision tree
similar to the agricultural and forestry examples given above in which several biophysical
factors are considered together (figure 2.6).
Rules of combination using presence or absence criteria can minimize the number of
land units to be rated. For example, if a particular land use could not occur on slopes over
40%. such areas would not have to be subdivided according to other characteristics. All areas
of slope greater than 40%. regardless of soil, vegetation, or geology, would receive a poor
rating.
Provided the rules are relatively simple, an overlay system is helpful in allocating areas
to different uses. For example, one could outline a general area with timber of adequate size
for commercial use. Rules of combination might be: all areas with fish spawning habitat,
crucial ungulate winter range, and shallow soils on slopes over 80% will be excluded from
timber harvesting. Overlay maps could then be used to locate such areas within the
potentially commercial forest, and therefore assist in meeting non-timber resource objectives.
while delimiting areas for timber harvesting.
Rules of combination attempt to deal with interactions among biophysical
components. However, they do not account for interactions among different land units
(Westman 1985). This is a shortcoming of current ecological theory and knowledge. As the
understanding of ecological interactions among the biophysically distinct components of a
landscape develops, evaluative rules for rating overall land use capability according to
interactions between uses in adjacent areas may follow.
2.2.3 Deriving Composite Capability h p s
After the potential for each land use is evaluated for the entire study area, these
ratings can be synthesized into a composite land use map. Such a map might indicate the
best prospective use for each unit in the area together with compatible secondary uses
(McHarg 1969 145). Alternatively, the map could distinguish areas capable of supporting only
a single use, from those capable of supporting several (Belknap and Furtado 1967: Canada
!ANA 1973). Maps recommending best uses must show clearly the criteria used for the
decision. The second type of map is useful in pointing out areas of potential conflict
requiring further analysis of the potential for multiple use, or the need for trade-offs.
Multiple use is one of the more controversial land use planning concepts (C.R. Hall
1963; Daniels 1987). The basic premise of multiple use is that land should be used to meet as
wide a spectrum of social demands as possible. Management methods which allow multiple
24
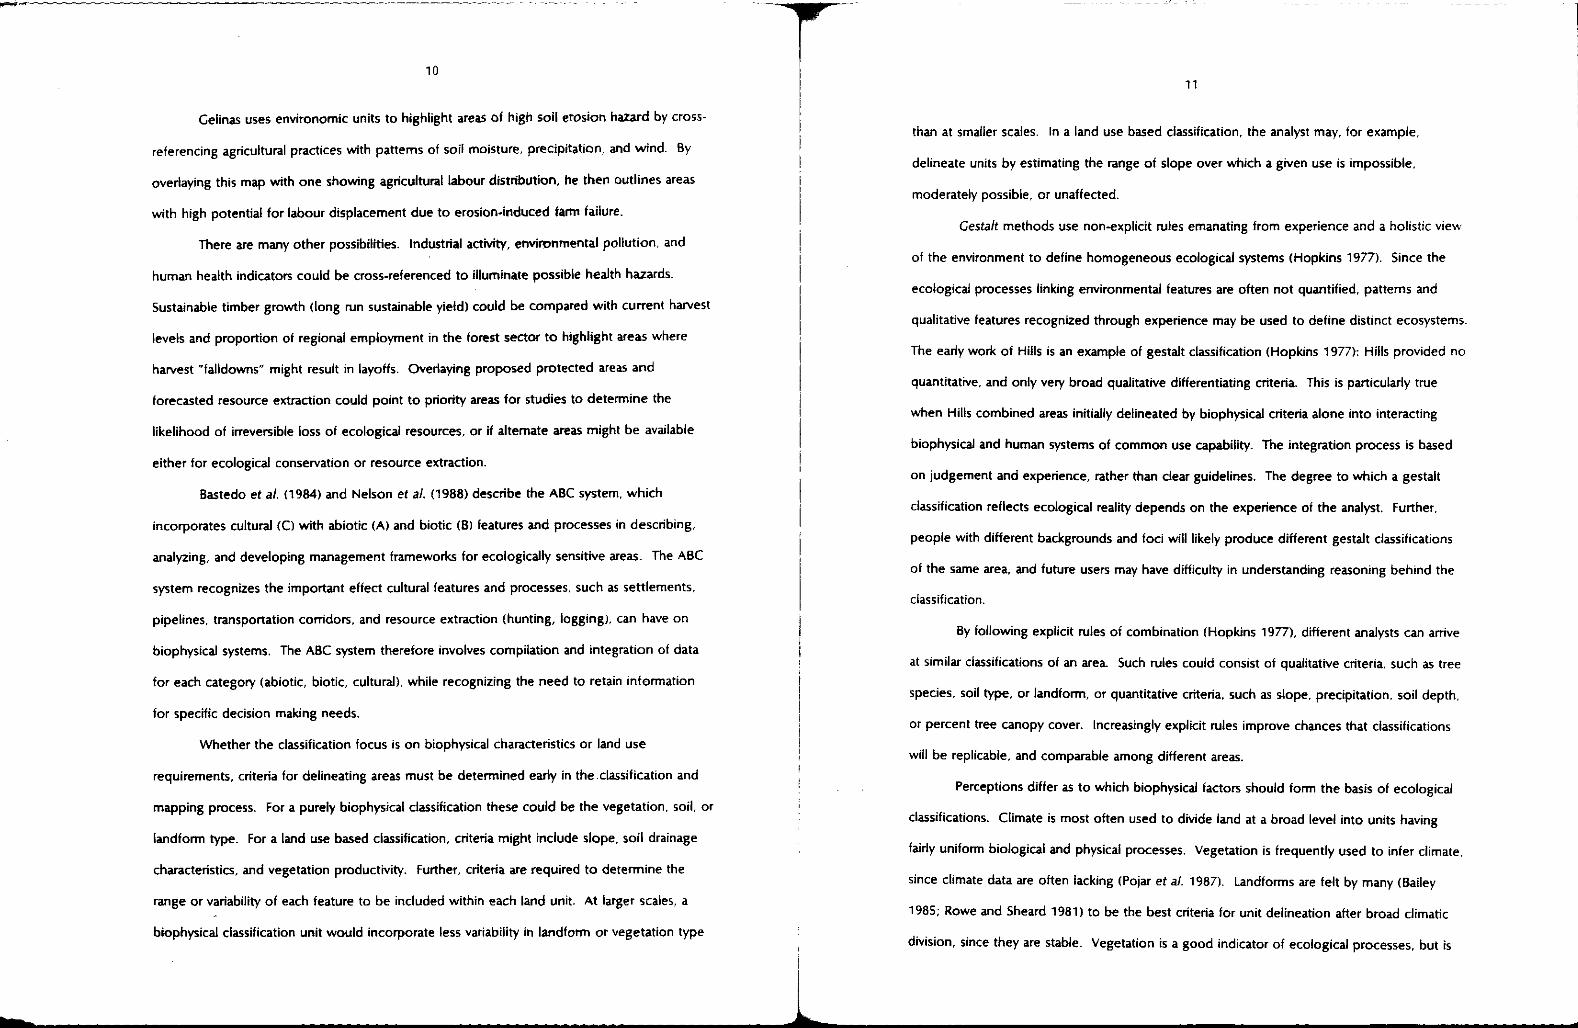
Figure 2.5 Added factor analysis
e defining land capability classes for commercial forestry'
Potential limiting factors: Climate: ~ drought or low temperature
~ maritime exposure Soil moisture: Soil depth:
~ deficiency or excess - shallow soil over bedrock - rooting depth restricted by consolidated layer (eg glacial till)
- periodic inundation - low fertility - high levels of toxic chemicals . active erosion - stoniness
Other soil factors:
Class definitions: Class 1: Class 2
no limits due to toxic chemicals or stoniness; 1 of others 2 limitations due to climate, soil moisture, soil depth. or lertilii.
Class 3: 3 or 4 limitations due to climate, soil moisture, soil depth. or
Class 4: fertility. soil moisture limitations, plus 2 limits due to climate, soil depth, soil chemicals, or fertility.
Class 5: soil moisture limitations. plus 3 or 4 limits due to climate, soil
Class 6: depth, soil chemicals. or fertility. shallow soil over bedrock and soil moisture limitations, plus 1 of soil fertility, toxic chemicals, or stoniness.
Class 7: extremely shallow mineral soil, regular flooding, or toxic chemical levels.
1, Based on the Canada Land lnventoty land capability classification for forestry (Environment Canada 1970)
uses can both increase social welfare. and decrease conflict reiative to single use land
allocation. However, not all land uses are compatible. The trade-offs necessary for multiple
use may decrease the value of pursuing incompatible uses in the same area, and a single use
allocation may be required. For example, tree farming and wilderness are not compatible. To
undertake any timber harvesting would likely compromise any wilderness values. Conversely,
retaining landscape aesthetics such that harvesting activities are not visible may make timber
25
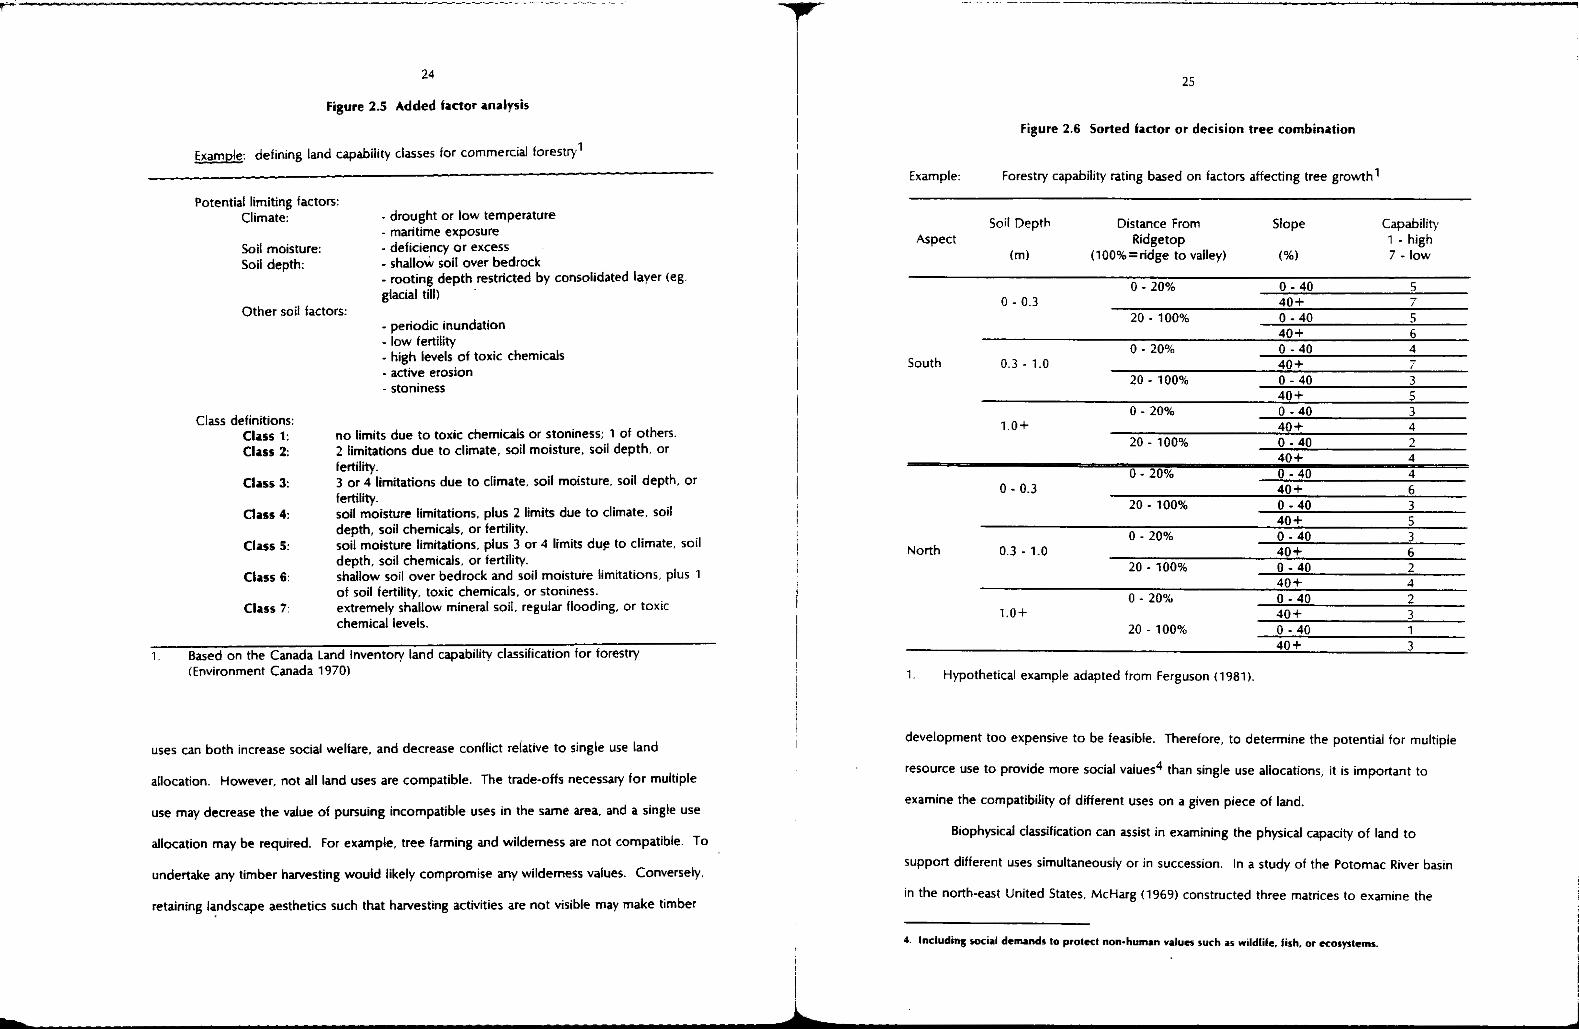
Figure 2.6 Sorted factor or decision tree combination
Example: Forestry capability rating based on factors affecting tree growth1
Soil Depth Distance From Slope Aspect
Capability
(m) Ridgetop
(100%=ridge to valley) 1 - high
(%) 7 - low
0 - 20% n .n7
0 - 40 A n + 7
5 "
20 - 100% -" . 0 - 40 5
0 - 20% South
0 ~ 40 0.3 - 1.0 40+
20 - 100% 0 - 40
4 7 3
0 - 20% 3 4
20 - 100% 0 - 40 2 1.0+
0 - 40 40 +
0 - 20% 3 4
20 - 100% 0 - 40 2 1.0+
0 - 40 40 +
1.0+ D ~ 20% 0 - 40 2
3
20 . 100%
1. Hypothetical example adapted from Ferguson (1981)
development too expensive to be feasible. Therefore, to determine the potential for multiple
resource use to provide more social values4 than single use allocations, it is important to
examine the compatibility of different uses on a given piece of land.
Biophysical classification can assist in examining the physical capacity of land to
support different uses simultaneously or in succession. In a study of the Potomac River basin
in the north-east United States, McHarg (1969) constructed three matrices to examine the
4. Including rocid demands to prolect non-human valuer such as wildlile. fish, or ecosystems

26 2 i
potential for multiple use (figure 2.7). Two matrices cross-referenced land use with ranges of
environmental factors (soil types, slope, hydrologic regimes. access. climate) to illuminate lhe
biophysical requirements of each use, and with environmental consequences (erosion.
flooding, pollution). Observation of potential conflict or complementarity among biophysical
requirements, including possible ill-effects, allowed construction of a land use com(>atibilitv
matrix. This information was then used to locate potential multiple use areas by comparing
the characteristics of biophysical units with the compatibility matrix.
Figure 2.7 Land use compatibility matrices.
**rol.wh .I M UI *MD*rmmn C"t0l
hPdI
I - fully compatibk 1 . fully compatible 1 -good
z - d i u m compatibility 2 . medium compatibility 2 - fair
3 . Io.. compatibility 3 . low compalibility 3 . poor
4 - incompatible 1 - incmpliblc 4 . bad
(Adapted from: McHarg 1969 144)
Multiple use evaluation could also involve clarifying which environmental factors could
result in conflict between uses. Knowing the relevant environmental components. managers
may be able to design activities to minimize negative interactions. For example, timber
harvesting could be designed to minimize aesthetic impacts in scenic corridors: timber cr
mineral extraction could be located and timed to retain adequate severe winter wildlife
habitat. These latter cases illustrate where land management, as opposed to land allocation,
may be able to minimize conflict. Biophysical classification can assist in outlining areas where
sensitive management may preclude the need to make exclusive land use allocations.
Two examples will illustrate how composite biophysical evaluations can provide an
understandable method for highlighting the spatial distribution of different resource values.
and thereby assist in allocating land and reducing conflict.
In the Columbia River basin in the US Pacific Northwest, the Northwest Power
Planning Council (NWPPC) is mandated to integrate demands for hydroelectric development
with those for protection of fish and wildlife habitat during power planning (Curtis 1988). The
different stakeholders involved'in these river basin issues, such as small hydro developers,
energy planning agencies, water user associations, fish and wildlife groups, and Indian tribes,
were invited by the NWPPC to outline important areas for their respective resources on maps
of the basin. One NWPPC goal was to avoid loss of any important fish or wildlife habltat to
hydro projects. The planning process resulted in reservation of over 70.000 kilometers of
waterways in the Columbia basin from hydroelectric development (Curtis 1988). While
substantially restricting the potential number of areas for development, this planning process
also highlighted areas where hydro developers could proceed without further opposition from
other interests. The construction of a composite map of potential hydroelectric sites, and
important fish and wildlife habitat therefore provided the various stakeholders with a clear
method for articulating their values, and for observing the relationships among these different
values. The maps facilitated meeting the goal of protecting habitat, and reducing chances of
future conflict.

28 29
2.3 Land Use Decision Making
Faced with a composite land use evaluation map. the decision maker can finally decide
on a land use plan for the study area. The basis of any decision must be a set of criteria or
objectives against which to compare land use alternatives. A set of objectives might include.
for example, a specific timber harvest. amount of livestock forage, and number of visitor days
df recreation potential. Planners could then examine alternative land use combinations shown
as biophysically possible on the composite evaluation map. By comparing these alternatives
to the stated objectives, the decision maker would choose the best land use combination.
Normally, biophysical objectives are themselves the outcome of a decision making
process involving trading-off demands for various biophysical. social, and economic factors.
Decision makers are asked to integrate demands for timber, wildlife and fish habitat,
recreation, ecosystem preservation, biodiversity, livestock range, agriculture. and community
water supply. Biophysical analysis provides information for making decisions once a balance is
struck among these disparate Objectives. It offers no simple methodologies or summary
indices with which to perform such trade-offs.
More so than other stages of land use planning. the decision making process is
frequently unsystematic. Documentation of reasoning is an important aspect of decision
making. To facilitate monitoring the success of the plan in meeting specific objectives.
reasons for decisions should be clearly stated. Further, use of results of the plan normally
requires knowledge of the basis for decisions. However, while the reasoning and assumptions
used in progressing from an outline of biophysical capabilities and potential resource conflicts
to a decision may be technically sound, they are frequently not documented. To be most
useful, documentation should outline how different aspects of the plan address specific
objectives. For example, how will a particular timber harvest level help to meet
socioeconomic objectives for employment or government revenue? Further, the trade-offs
involved in following the chosen plan rather than any of the alternatives should be
documented. For example, what are the differences in regional economic and recreational
benefits among alternative land use allocations? Why is one set of benefits preferable over
the others? Clear documentation of rationale for decisions is important both to facilitate
monitoring. and to enable use of plan documents in future planning exercises.
-
2.4 Implementation and Monitoring
Successful land use planning requires that responsibilities of the various interests
involved are explicitly delineated. It also requires that a monitoring and evaluation mechanism
is in place. A land use plan may be excellent from a biophysical perspective. However, if the
administrative framework is not appropriate. objectives may be frustrated, and work of
different interests may conflict or overlap (Vreeswijk 1985).
Monitoring is necessary to ensure that the implementation strategy and administrative
arrangements are adequate, that objectives are being met. and that the objectives actually

T- 30
serve to further social goals. For example, a land use plan may prescribe deferment of
iogging in part ot a watershed to preserve deer winter range. A monitoring program might
check that
1) protecting winter range actually increases survival of deer;
2 ) that the specific areas protected serve as good winter range;
3) that management responsibilities were accorded to the most appropriate
agencies or individuals; and
4) that the actual trade-offs resulting from the decision (eg. job loss) are similar to
those predicted during decision making.
Both biophysical dynamics and limited ecological knowledge mean that decisions made now
may not be good in the future, or simply might be wrong from a scientific perspective. A
monitoring mechanism is crucial to ensure that biophysical plans keep up with changing
conditions and new scientific knowledge.
2.5 Geographic Information Systems
Geographic information systems (CIS) are technologies for storing, retrieving,
manipulating, and displaying information on the spatial distribution and attributes of ecological
or socioeconomic variables. Current usage normally implies computerized systems (Gelinas
1986). Conceptually CIS offers nothing new. Its power is its ability to manipulate, analve.
and display data rapidly using sophisticated computer technology and programming.
Before computerized CIS, integration of ecological information was a laborious,
manual task. Computen facilitate the overlaying or correlating of data in numerous
permutations. One can therefore quickly differentiate biophysical units by overlaying
ecological factor maps; search for areas where two or more biophysical features or processes
coexist to help derive land use evaluations or expose potential conflict; and quantify the
implications of land allocation decisions, for example, the timber volume lost to commercial
31
harvesting through reservation of an area for wildlife habitat. Computers also allow easy
updating of information. and rapid compilation and output of maps or data tables for the
different combinations of biophysical features or land allocations explored during analysis.
Combining the data manipulation capabilities of CIS with remote sensing data ma)
increase the ability to keep biophysical inventories up to date. However. all remotely-sensed
data are not sufficiently accurate for all resource management decisions; for example most
satellite information is not accurate enough to differentiate among tree species for forest
classification. but can distinguish among different cover types such as grassland. deciduous
forest, and coniferous forest (Herbig et a/. 1986; Morin et a/. 1986). For some uses, such as
inventorying areas under different vegetation cover or land uses (recently harvested areas
versus older forest), remote sensing may allow more frequent inventoly updating than would
manual field collection.
Up to date resource inventories are particularly important for decisions that rely on
both biophysical and socioeconomic variables. Change in both socioeconomic factors (prices.
wages, interest rates) and biophysical resources (timber volume available, certainty of mineral
reserves. presence of wildlife) could affect decisions in many ways. For example, a drop in
wood prices combined with an insect infestation that decreased merchantable wood volume
may make timber development uneconomic. Or, finding that a forest stand proposed for
logging is the last good elk winter range in a watershed, because an alternate area was
destroyed in a recent disease outbreak, may tip the balance in favour of not logging. CIS and
possibly remote sensing data could be used to incorporate biophysical and socioeconomic
changes into databases. and ensure that decision making is based on current information.
Modelling of landscapes over time is possible with CIS. Attribute data can be
assigned time-dependent values rather than static or "snapshot" measurements (Herbig et a/.
1986). Further. interrelationships between ecological factors, if known, could be incorporated
in to the CIS data. For example. change in vegetation could result in change in runoff, or in
wildlife use. CIS could, therefore. facilitate interim updating of related ecological factors until

field studies were possible, as well as account for ecologicd interactions.
using a CIS, Eng et a / (1990) incorporate time into the study of the dynamics of
Severe winter ungulate range in BC. They overlay information on current habitat status.
planned logging, and projected forest growth to monitor the quantity and location Of different
habitat types Over a 30 year period. While this exercise may be conceptually possible without
a CIS, it is not practically feasible.
In essence. cis consists of sophisticated overlay technologies. Theoretically. these
technologies could be used to combine information in ordinal. linear, or non-linear fashions.
They can facilitate planning discussions by showing the spatial relationships among resource
values. When knowledge is sufficient, CIS can also assist in the analysis Of ecological or h d
use interactions, such as water runoff changes due to timber harvest. or timber volume
deferred from harvest for wildlife habitat. However, beyond delineation Of Spatial
relationships, CIS is subject to the same limitations as all data Combination techniques. as
discussed earlier (subsection 2.2.2).
2.6 Case Studies
This section describes two examples of resource plannmg incorporating biophysical
analysis. The first example, the Tsitika watershed integrated resource plan, illustrates a land
use focused analysis. The second case, a plan prepared for the vicinity of Crande Prairie,
Alberta. emphasizes delineation and evaluation of homogeneous biophysical land units.
2.6.1 Tsitika Watershed Integrated Resource Management Planning
The Tsitika River watershed has been the focus of controversy since at least the early
1970s (Vreeswijk 1985). Following public pressure to preserve part of northern Vancouver
Island from timber development, and a BC Fish and Wildlife Branch proposal in 1972 to place
the entire watershed in an ecological reserve, the Environment and Land Use Committee
(ELUO of cabinet placed the Tsitika under a resource development moratorium. In 1977,
33
ELUC formed the Tsitika Planning Committee VPC) consisting of representatives from
government agencies, the forest industry, labour unions, and a public interest group to decide
on an integrated resource management plan for the area. This plan was approved by ELUC in
!ate 1978. Debate still Yiinounds !and use and management in the Tsitika. This is
symptomatic of two things: firstly, the limits on current ecological knowledge. and secondly.
the difficulty of reaching lasting consensus on land use and management goals. The initial
Tsitika plan remains a good example of how biophysical analpis can assist integrated resource
planning: it is not meant as an illustration of the definitive planning process.
At the inception of the Tsitika planning process, ELUC instructed the TPC to identity
management objectives. and formulate a 6-year road development and timber harvesting plan
(TPC. 1978). Planning involved seven basic steps CTPC 1978: 6):
1 ) Determination of guiding objectives;
2) Inventory of biophysical resources;
3) Mapping each resource to show productivity, capability, and sensitivity;
4) Development of specific management objectives for each resource, and
prescriptions to minimize negative impacts of resource development;
5 ) Resolution of land use conflicts through both technical inquiry and public
consultation:
6 ) Approval by ELK: and
7) Implementation.
The ELUC decision that some timber halvesting should occur in the Tsitika within an
integrated management arrangement, and that public involvement should be sought,
necessarily influenced TPC's formulation of its guiding objectives. These were (TPC 1978: 7):
1 ) To ensure a sustained timber harvest;
2) To maintain fish. wildlife. and recreational resources, and set aside
representative ecological areas; and
34
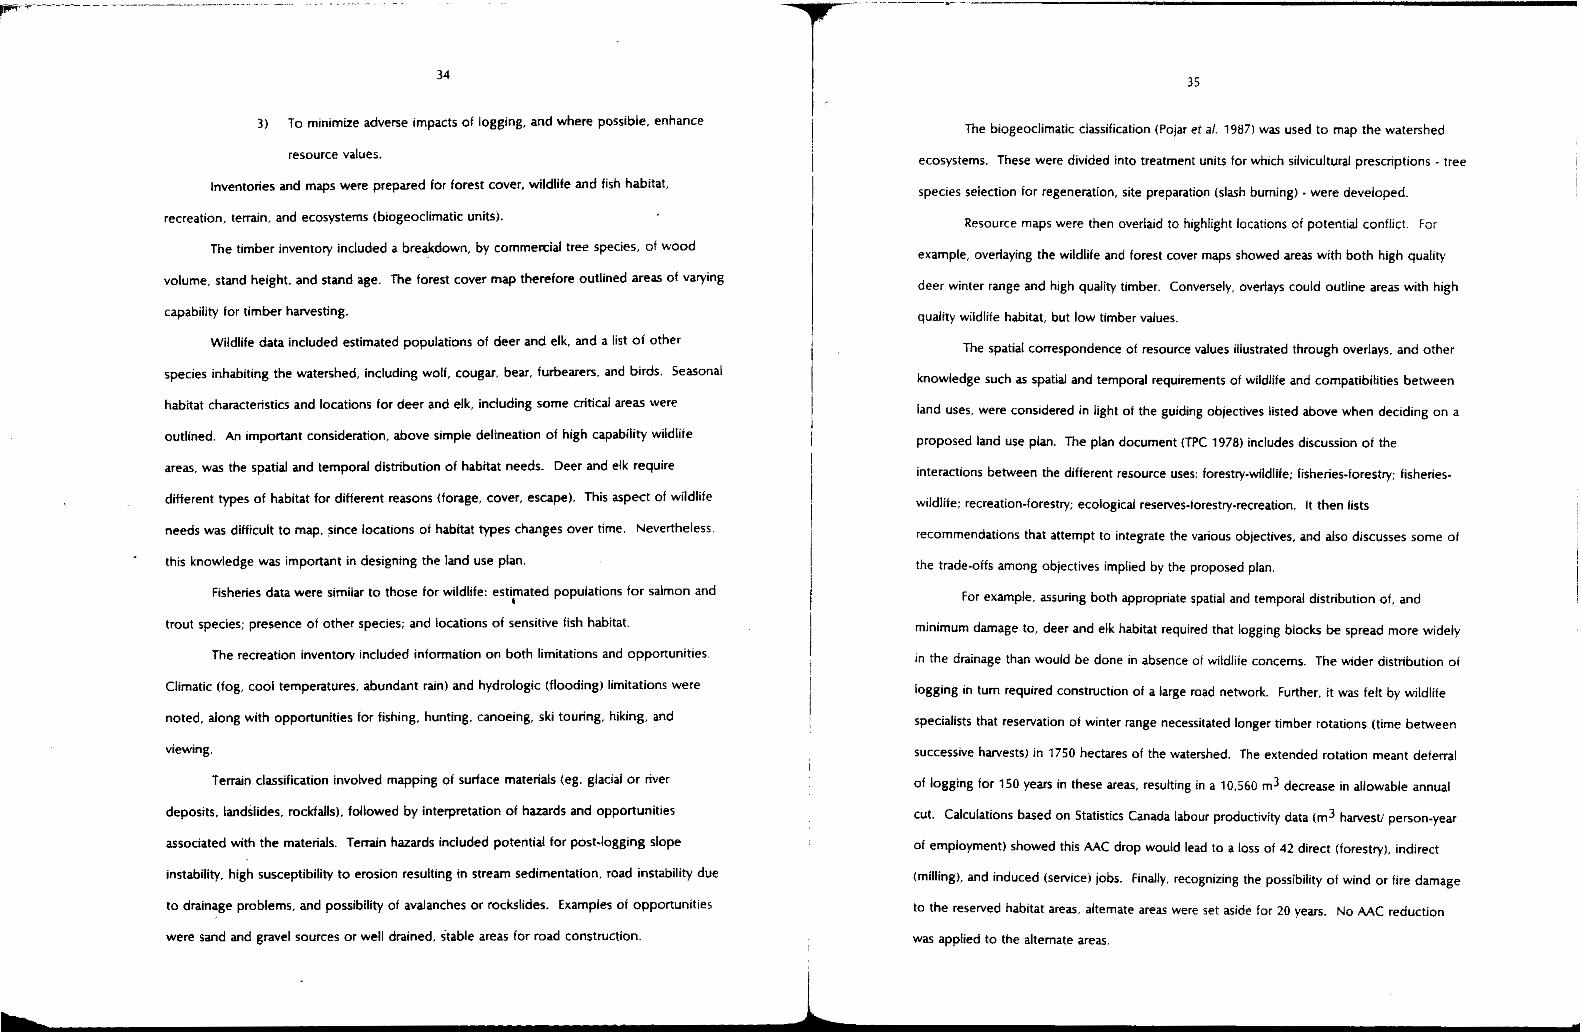
3) To minimize adverse impacts of logging, and where possible, enhance
resource values.
inventories and maps were prepared for forest cover, wildlife and fish habitat,
recreation, terrain, and ecosystems (biogeoclimatic units).
The timber inventory included a breakdown, by commeaial tree species, of wood
volume, stand height, and stand age. The forest cover map therefore outlined areas of varying
capability for timber harvesting.
Wildlife data included estimated populations of deer and elk, and-a list of other
species inhabiting the watershed, including wolf, cougar, bear, furbearers. and birds. Seasonal
habitat characteristics and locations for deer and elk, including some critical areas were
outlined. An important consideration, above simple delineation of high capability wildlife
areas, was the spatial and temporal distribution of habitat needs. Deer and elk require
different types of habitat for different reasons (forage, cover, escape). This aspect of wildlife
needs was difficult to map, since locations of habitat types changes over time. Nevertheless.
' this knowledge was important in designing the land use plan.
Fisheries data were similar to those for wildlife: estimated populations for salmon and I
trout species; presence of other species; and locations of sensitive fish habitat.
The recreation inventory included information on both limitations and opportunities.
Climatic (log, cool temperatures, abundant rain) and hydrologic (flooding) limitations were
noted, along with opportunities for fishing, hunting, canoeing, ski touring, hiking, and
viewing.
Terrain classification involved mapping of surface materials (eg. glacial or river
deposits, landslides, rockfalls), followed by interpretation of hazards and opportunities
associated with the materials. Ternin hazards included potential for post-logging slope
instability. high susceptibility to erosion resulting in stream sedimentation, road instability due
to drainage problems, and possibility of avalanches or rockslides. Examples of opportunities
were sand and gravel sources or well drained, itable areas for road construction.
35
The biogeoclimatic classification (Pojar et a/. 1987) was used to map the watershed
ecosystems. These were divided into treatment units lor which silvicultural prescriptions - tree
species selection for regeneration, site preparation (slash burning) . were developed.
Resource maps were then overlaid to highlight locations of potential conflict. For
example, overlaying the wildlife and forest cover maps showed areas with both high quality
deer winter range and high quality timber. Conversely, overlays could outline areas with high
quality wildlife habitat, but low timber values.
The spatial correspondence of resource values illustrated through overlays, and other
knowledge such as spatial and temporal requirements 01 wildlife and compatibilities between
land uses. were considered in light of the guiding objectives listed above when deciding on a
proposed land use plan. The plan document (TPC 1978) includes discussion of the
interactions between the different resource uses: forestry-wildlife; fisheries-forestry; fisheries-
wildlile; recreation-forestry; ecological reserves-forestry-recreation. it then lists
recommendations that attempt to integrate the various objectives, and also discusses some of
the trade-offs among objectives implied by the proposed plan.
For example. assuring both appropriate spatial and temporal distribution of, and
minimum damage to, deer and elk habitat required that logging blocks be spread more widely
in the drainage than would be done in absence 01 wildlife concerns. The wider distribution of
logging in tum required construction of a large road network. Further, it was felt by wildlife
specialists that reservation of winter range necessitated longer timber rotations (time between
successive harvests) in 1750 hectares of the watershed. The extended rotation meant deferral
of logging for 150 years in these areas, resulting in a 10,560 m3 decrease in allowable annual
Cut. Calculations based on Statistics Canada labour productivity data (m3 harvesV person-year
of employment) showed this AAC drop would lead to a loss of 42 direct (forestry). indirect
(milling). and induced (service) jobs. Finally, recognizing the possibility of wind or fire damage
to the reserved habitat areas, alternate areas were set aside for 20 years. NO AAC reduction
was applied to the alternate areas.

36
Potential impacts of timber development on fish habitat, primarily through stream
sedimentation from road building, were exacerbated by wildlife habitat protection
requirements for a more extensive road network. To minimize this damage, the TPC
proposed windfirm buffer strips along sensitive fish habitat, close monitoring of road
construction, and minimizing road construction within the constraints provided by wildlife
habitat concerns.
For the most part, negative interactions between recreation and timber harvesting
were thought to be minimal. Most recreation opportunities were located in areas with low
timber values. The major concerns surrounded visual impacts of logging and construction of a
log sort5 in the Tsitika estuary. In areas of visibility from lohnstone Strait and the North Island
Highway, logging was to be planned according to landscape techniques. Development in the
estuav remained an unsolved issue: the TF'C recommended further studies to investigate
biological and recreational impacts of the proposed log sort.
Finally, the plan document included a discussion on the potential impacts of both
logging and recreation on areas reserved as representative ecosystems. Logging could have
indirect impacts by affecting hydrology and microclimate on nearby areas. These impacts
would be minimized through site specific prescriptions and establishment of windfirm reserve
boundaries. Intensive or consumptive recreation activities (large campgrounds. hunting) could
directly affect ecological reserves, and were therefore to be excluded in reserved areas.
All of the above considerations and recommendations were used to help formulate a
6-year timber harvesting and road building plan, and a land use summary map Table 2.2
summarizes the composition of the resource value folio, logging development, and land use
maps. The land use summary map is shown in Figure 2.8.
In some cases, trade-offs among uses could be minimized by recognizing areas
capable of meeting several demands. For example, firebreaks to protect timber, wildlife
37
winter range, buffers between logging and fish habitat. and ecological reserves could in some
cases be combined within the same area. Loss of productive forest for timber harvesting was
further decreased by consolidating deer winter range into fewer high quality areas, rather than
more numerous dispersed ranges.
In the Tsitika watershed planning process, biophysical information was used to assist in
meeting objectives defined by the provincial government and refined by the TPC. Biophysical
analysis and map overlays helped to point out areas of critical values to wildlife, fish.
recreation, and ecosystem preservation. They were also used to highlight areas requiring
special attention during timber harvest planning to ensure that sensitive soils, fish habitat, and
ecological reserves would not be damaged. Linking the timber inventory with socioeconomic
data allowed quantification of the trade-offs involved in reserving productive forest from
harvesting. Conversely, knowledge of wildlife. fish, and recreation needs or demands
facilitated determination of the non-economic values potentially lost by logging. I
~
i It should be recalled that the guiding objectives worked out within the TPC and based
on ELUC terms of reference formed the ground work for all further decisions. To review, the
objectives were: to decide on a sustainable timber harvest, while maintaining fish, wildlife. and
recreation resources, and minimizing adverse logging impacts. Biophysical analysis did not
help to decide on these objectives: it did assist in refining and quantifying them, as well as
determining the trade-offs involved. For example, biophysical data were not crucial in
formulating the general view that wildlife populations should be maintained. Such data were,
however. crucial in determining how to maintain the populations (protect habitat): where and
when particular activities should be located (reservation of specific winter ranges for 150 years
until other forest areas could replace them); and how much commercial timber and how many
jobs would be lost due to the deferrals.
I
I
j
~
5. A 1- w n is an =*ea r h w e logs ate brought after hawesting to be organized for further trrnrpon lo mills 0. markets.

38
Table 2.2 Tsitika Watershed Folio Maps
Resource Value/ Map Contents Map Title
Forest Cover Timber specles and Inventory data (ageheight).
Wildlife Winter and summer ungulate ranges; travel corridors.
Fisheries
Recreation
Terrain
Fisheries sensitive zones; species present. Active erosion zones. Fishev prescriptions (leave strips, timing of timber operations).
Visibility zones from lohnstone Strait, North Island Highway. Campsites ~ primitive; potential for development. Unit boundaries and ratings for various activities.
Terrain description (material type and depth. slope). soil characteristics (timber harvesting sensitivity. high sedimentation probability). Engineering considerations (road building, timber harvesting)
Watershed Ecosystems Biogeoclimatic units separated into silvicultural treatment units; silvicultural prescriptions.
Development Plan Logging blocks and road construction for 6-year period.
Land Use Plan hawestable, non-harvestable areas. Sensitive Soils. Wiidlife: long-term logging deferment; short-term (alternate) deferments. Fisheries: Reserves and potential reserves. Recreation: Resewes. proposed park. proposed trails. ProDosed ecological reserves: representative ecosystems based on ecosystem map.
Source: Tsitika Planning Committee (1978) Volume 1 (Maps).
39
Figure 2.8 Tsitika Watershed Land Use Summary Map
(Source: Vreeswijk 1985)

40
2.6.2 Land use planning in Crande Prairie, Alberta
The second case study illustrates land use planning based on biophysical land unit
delineation similar to that proposed by Hills (Hills et a/. 1970). The purpose of this study was
to assist the Alberta provincial government In assessing lease and development proposals bv
evaluating the capability of different land are& to suppH various uses (Luff and Ojaama
1979). The planning process consisted of an iterative progression beginning with problem
definition and planning team appointment, followed by data collection and analysis. policy
formulation, design of alternative land use plans, plan choice, implementation, and review.
Data collection initially involved identifylng relevant information, and appropriate data
scale. The scale chosen here was quite large. 1:15.840. reflecting the local nature of the plan.
and the fairly small area (18 km2) under consideration.
The planning team based the biophysical inventov and mapping on the system of
Lacate (1969). The study area was divided into 3 land systems based on recurring patterns of
slope, landform, soils, and vegetation. These land systems were further divided into 17 land
types, each with a specific soil parent material, and homogeneous soil, vegetation. slope. and
drainage characteristics (Figure 2.9). Each land type was then rated for the types and severity
of limitations it had for different land uses. Table 2.3 shows both the types of limitations felt
by the planning team to affect land use capability. and the scheme for rating the severity of
limitations.
The iterative nature of biophysical analysis is illustrated at this planning stage.
Deciding which land uses to consider was in some ways a function of the policy option
chosen. But deciding among alternative policies required some knowledge of which uses
were possible in the area. Iterations among data collection, land use evaluation, and policy
choice ultimately resulted in a map and table of ratings for each land unit for each relevant
land use.
After developing ratings for each land type, the planning team chose a land use
objective or policy from among several alternatives. This guiding policy, based on biophysical
41
Figure 2.9 Ecological classification map for Crande Prairie area,
Land Svstem 1: Aeolian Plain
1.2 Small parabolic dunes 1.1 Large parabolic dunes
1.4 Small dune ridge 1.3 Large dune ridge
1.6 Nondune plain - pine, 1.5 Pseudo-dunes
very flat terrain 1.7 Non-dune plain ~ poplar
and pine 1.8 Non-dune plain - pine,
slightly sloping 1.9 Non-dune plain - poplar,
very flat terrain 1 ~ 1 0 Non-dune plain - poplar,
slightly sloping 1.1 1 man-made scars
Land Svstem 2: Organic Terrain
2.1 Treed bog 2.2 Sedge fen 2.3 Open water
Land System 3 : River Valley
3.2 Upper terraces 3.1 Valley walls
3.3 Point bars
(Source: Luff and Ojaama 1979)

42
Table 2.3 Land use limitations and rating scheme, Crande Prairie land use planning.
Limitations: 1. Flooding 6, Groundwater contamination 2. Seasonally high water table 7. Organic soil 3 Slope 8. Susceptibility to frost heave 4. Rapid permeability 9. Thin Ah soil horizon 5. Surface soil texture
Degree of Severity
s Slight to no limitation: free of limitations that affect intended use. limitations
M Moderate limitations: limitations that require recognition but can be Overcome are easily overcome.
through planning, design, and management. V Sewre limitations: limitations make the intended use questionable.
Source: Luff and Ojaama (1979)
data and local needs, was to maximize local recreational opportunities. protect
environmentally sensitive terrain. and provide for some needs of local industry, and public
utilities. The team decided on seven appropriate prospective land uses: Conservation; non-
facility recreation; facility recreation; public utilities (water intake and purification); industrial
park; sand and gravel extraction (road building and foundations): and private land.
The planning team next grouped land types with similar land use limitations into
"ecological planning units." This was done using a matrix of land types and use limitations
For example. the three organic terrain land types all had severe limitations to any use requiring
facilities. They were therefore combined into one ecological planning unit. In total, 6
planning units were created (Figure 2.10)
Land use plan formulation began with construction of a land use matrix cross-
referencing the ecological planning units with the prospective land uses (Table 2.4). From this
matrix and recognition of compatibility among land uses, a land use plan was proposed
(Figure 2.11). To complement the map, the plan listed responsible agencies and applicable
legislation for implementing various aspects of the plan.
43
Table 2.4 Ecological land use matrix for Grande Prairie plan'
Recrea- Recrea- Indust- Agricul- Residen- tion 12 tion 2 rial ture tial vation
Conser-
Non-dune plain A3 A A A A C
and ridges Small dunes
A A A A A C
and ridges Large dunes
X A X X X C
Valley breaks X A X X X C
Organic terrain X NS X NS X C
Seasonally flooded X AIS X AIS X C
Source: Luff and Ojaama (1979) Notes: 1. This is only part of the matrix presented by Luff and Ojaama (1979).
2. Recreation 1 and 2 are facility, and non-facility, respectively. 3. A (appropriate) . use may be compatible under some circumstances. with strict
controls.
US (appropriate seasonally) - use may be compatible under certain conditions, C (compatible) - use is compatible under normal guidelines and regulations.
X (not compatible). at certain times.
In summary. land planning in Crande Prairie consisted of biophysical inventory and
land use evaluation based on fixed land units delineated early in the data collection process.
This contrasts to the Tsitika folio plan in which maps of single resource values were overlaid to
outline areas of potential conflict needing more study, or special management prescriptions.
The Tsitika watershed planning process involved a strategic approach whereby only data
relevant to the interests at hand were compiled and analyzed. The Crande Prairie study was
more comprehensive, involving an inventov of all resources with the goal of fitting the entire
area into a uniform ecological classification. Section 4 of this paper includes an evaluation of
the relative advantages and disadvantages of these approaches.

44
Figure 2.10 Ecological planning units for Grande Prairie, Alberta. *yIIII.GIIm Wbll I YNO -5 b I E A
".. I,"..."
1 I I , '.
- .& - .. i
(Source: Luff and Oiaama 1979)
Fipre 2.11 Land use plan for Grande Prairie, Alberta.
(Source: Luff and Ojaama 1979)
i ' 2.7 Summary I
To use biophysical information in land use planning and decision making, land must I I
be divided into units having fairly uniform response to management. and an evaluation system
and criteria must b e developed. Classification of land into homogeneous units can focus
either on its biophysical characteristics, or on its capability to support particular land uses.
Biophysical information is used for many different types of planning. Therefore,
classifications can be based on different biophysical criteria. Data are also of different scales,
and therefore have different uses. Hierarchical classifications, with smaller systems nested in
larger systems, are useful for understanding both the ecological context, and the important
components at different scales.
The criteria used to delineate biophysical units and to derive emhations can be more
or less explicit. Explicit criteria are useful to ensure compatibility and replicability of data, and
to facilitate interpretation by, and communication among different resource specialists and the
public.
Evaluation of land use capability requires combination of data. Mathematically and
ecologically inappropriate data manipulation is common. Overlay systems are usually not
appropriate for summing Capability information into single indices. Ecological processes are
frequently non-linear. and few processes have been quantified. Weighting of biophysical
factors may be used to indicate their differing significance to decisions, but again, limited
quantitative knowledge should guard one against simple addition of weighted ratings. To
account tor complex ecological interactions, evaluative ratings can be constructed according
to rules of combination which consider the effects on capability of one or more biophysical
components.
Composite land capability maps can be constructed fro'm information on each land
use. Such synthesis maps are useful in highlighting areas of multiple capability where possible
conflict requires further study and focus of decision making efforts to determine the potential
for multiple use. or the need for single use land allocations..

46
Final land use decisions require development of biophysical goals and quantitative
oblectlves. Biophysical information can assist in showing where and how these gods and
objectives can be met, but not which ones to choose.
All stages of biophysical analysis can be facilitated by computerized geographic
Information systems. CIS increasesdata manipulation and presentation speed and power over
manual computation and mapping. This allows overlaying of data on different resources to
construct composite maps, easy updating of inventories, incorporating time, and modelling of
interactions among land units. Land modelling is limited by current knowledge of ecological
processes. Ability to keep inventories up to date could be increased through use of remote
sensing data. Good quality CIS analyses require accurate data preferably of comparable scale.
referenced to the same geographic base map.
47
Section 3. Classifications and Inventories: the Tools of Biophysical Analysis
3.0 Introduction
This section examines how the principles of biophysical classification and evaluation
have been put to use in British Columbia. The chapter begins with a discussion of the Canada
Land Inventory, the basis for much of the biophysical classification in BC. The rest of the
chapter iocuses on the development and use of biophysical classifications and inventories by
BC government agencies.
3.1 The Canada land Inventory
The Canada Land Inventory (CLI) was a cooperatie effort by the federal and provincial
governments designed to assist in regional economic development planning. It began with
the Agricultural Rehabilitation and Development Act (ARDA) of 1961. Terms of reierence.
objectives, and organization were finalized in 1963 (DIAND 1973, Rees 1979).
The objectives of the CLI were: to develop land capability classifications for
agriculture, forestry. recreation, and wildlife (ungulates and wildfowl), and for their present
use: to estimate the quantity and location of each land class; and to encourage use of CLI
data in planning (DREE 1970; Coombs and Thie 1979). A classification of water capability for
sport fishing was also developed in some provinces, but unlike other land uses, no maps were
produced. The CLI and corresponding provincial land inventory systems were developed to
provide reconnaissance level data: that is, for broad land allocation, not detailed management
planning. The CLI covered the settled portion of Canada, about 2.5 million square kilometers
of Canada’s total 9.2 million square kilometers (Canada Envir. 1980).
Inventory data were collected primarily by the provinces with financial and technical
assistance from the federal government. Provinces supplied appropriate federal government
agencies with data corresponding to map scales of 1:50.000. The federal government
published 1:250,000 maps for each land use (1:126.720 in BC for agriculture and forestry). BC

48
maps were of larger scale than for other provinces due to the diversity of BC's terrain. All CLI
maps were published by the end oi the 1970s (Rees 1979).
CLI ratings reflect the number and type of limitations or opportunities present. Except
for recreation. classifications rate the degree to which biophysical factors limit each land use.
Recreation classifications are based on opportunities offered by the land. All classifications
consist of 7 classes (save for sport fishing which has 4) with class 1 being of the best quality
and class 7 having no capability for the use. Capability classes indicate the degree Of
limitation or opportunity; subclasses may be used to specify the type of limitation or
opportunity. Present land use is categorized as urban. agricultural, woodland, wetland,
unproductive, and water, and can also be further described with subclasses.
Evaluative criteria were developed nationally so that capability classes would be
consistent across all provinces. The criteria - number and degree of limitations or
opportunities - were correlated to some measure of productivity for each land use during the
field work on which the CLI is based. For agriculture, this measure was the range of crops the
land would support; for forestry, the volume of annual tree growth: for wildlife. the animal
biomass supportable; and for recreation, the number of recreating people the land could
attract and sustain. Therefore. while the CLI class is determined by the degree of limitation or
opportunity, i t also provides an idea of what the land can produce
CLI ratings are based on physical criteria only. Market demand and accessibility. and
current ownership and use are not considered (DREE 1970). This helps to ensure that
information will be useful if socioeconomic factors change (Coombs and Thie 1979). CLI
ratings and maps therefore cover only one aspect of land use planning. To assist in
comprehensive planning, current land use and other socioeconomic data can be overlaid onto
the physically-based ratings using the CLI geographic information system (Rees 1979).
Capability ratings of different land uses are not comparable, Land rated as class 1 for
forestry and class 3 for agriculture is not necessarily better allocated to forestry than to
agriculture, for example. The ratings must be consulted with reference to the socioeconomic
49
and biophysical context. Allocating satisfactory agricultural land near a farming community to
timber extraction according to CLI ratings is hardly an appropriate decision. Similarly, setting
aside adequate commercial forest as wildlife habitat when a wildlife sighting has not been
documented for years may not constitute a good decision.
The CLI was conceived as a land use planning tool, not as a guide for specific
management activities (DREE 1970). It is useful for: zoning, for example. to avoid conversion
to uses that are either irreversible or physically incompatible with the land: land acquisition
and consolidation for agriculture. recreation, or wildlife habitat; land assessment when those
losing land to developments such as dams require compensation; and broad level
environmental impact studies prior to location of developments such as transportation
corridors. airports, and pulp mills (Coombs and Thie 1979). On a more general level, the CLI
offerr a basis both for public involvement, and communication among resource management
disciplines. It has also stimulated development of resource inventories, and promoted an
integrated planning outlook at a time of increasing land use conflict (Coombs and Thie 1979:
Rees 1979; Sprout 1978).
Following are brief descriptions of the bases for the CLI agriculture, forestry,
recreation, and wildlife classifications. All ratings assume "good" management practices (DREE
1970). More detailed discussion can be found In DREE (1970)
Agriculture
Ratings for agriculture consider climate and soil factors as they affect a soil's ability to
support annual crops. and forage or pasture. Subclasses express limitations due to soil depth,
drainage, moisture holding ability, nutrient status, salinity, stoniness, terrain, season length,
and annual rainfall distribution. Classes 1 through 4 are suitable for field crops. The possible
range of crops decreases, and need for soil consetvation increases from Class 1 to 4. Classes
5 and 6 are capable of supporting forage crops and grazing. Class 7 is capable of neither crop
cultivation nor pasture.

50
Forestry
Forestry ratings also use soils and climate as bases. Land is rated according to its
ability to grow commercial timber, The main criterion employed is mean annual increment. or
average growth rate, of the best tree species over a rotation (ie. the period from regeneration
to harvest). Soil physical characteristics. depth, moisture. fertility. terrain. and climate are
considered.
Recreation
Recreation ratings account for the ability of land to attract and sustain activities. That
is. ratings combine presence of recreation features and physical carrying capacity. Lands of
classes 1 through 3 can support intensive activities (large numbers of people per area): classes
4 through 6 are capable of dispersed recreation. Subclasses specily the type of opportunity
offered by the land; for instance, water access, beaches, visual aesthetics, historic sites, and
interesting landforms. The classification covers activities popular at the time the CLI was
undertaken: for example, boating, canoeing, sailing, skiing, wildlife and scenic viewing,
conaging, camping, hunting, and rock climbing.
Wildlife
The CLI consists of separate ratings for ungulates and wildfowl, primarily ducks. These
types of wildlife were chosen for their public appeal and wide distribution.
Ungulates
Like all wildlife, ungulates require food, cover, and mobility. Ratings consider how
climate, topography, and soils affect the ability of land to grow food and cover vegetation,
and of animals to move across the landscape. Subclasses specify the nature of capability
limitation, broadly divided into climate (rainfall. snow depth, wind) and land (soil and
Wildfowl
Ratings are based on wildfowl’s need for food, breeding and nesting sites, and
migration stops. Potential to produce and support wildfowl depends on landform and
topography. water availability and quality, plant cover, and climate. Highest capability occurs
in areas with fertile soil with good water retention, and topography suitable for wetland or
marsh formation. Examples of limitations are high possibility of drought, widely fluctuating
water level, excessively shallow or deep water, excessive soil permeability. soil or water aciditv
and salinity. and steep-sided lakes precluding m n h development.
3.2 Canada Committee on Ecological (Biophysical) bnd Classification
Limited availability of biophysical information precluded capability classification in
much of Canada during compilation of the CLI (Rees 1979, Wiken and lronside 1977). This
situation required development of a system to I... classify and map ecologically significant
units of land, as manifested by their inherent biological and physical characteristics” rapidly
and with minimum expense (Wiken and lronside 1977). The Subcommittee on Biophysical
Land Classification of the National Committee on Forest Land (NCFL) developed a system
which combines climate (inferred from vegetation). landforms, and soil (Lacate 1969). The
system incorporates work from Australia (Christian 1958: Christian and Stewart 1968). England,
Russia, and Canada; its Canadian antecedent is the work of Hills (Hills et a/. 1970). In 1976.
the Canada Committee on Ecological (Biophysical) Land Classification (CCELC) was formed to
carry on the work of the NCFL (Wiken and lronside 1977). The purpose of the CCELC is to
promote use of a uniform ecological classification for land use and management planning and
environmental impact assessment (Wiken and lronside 1977). By the time of the formation of
the CCELC. it was also recognized that a relatively value-free biophysical mapping system was
needed to enable land use capability analysis as social demands and preferences shift (Rees
1979).
topography).

52
Table 3.1 shows part of the hierarchical integrated classification proposed by the
CCELC. This table comblnes the biophystcal feature-onented descriptions of Wiken and
Ironside (1977) and Wiken (1986). with the process-orientation of Rowe (1979). The CCELC
hierarchy includes both broader and finer categories than shown here (Wiken 1986). Each
level is useful for different purposes; the units shown in Table 3.1 are of scales commonly
used in land planning.
Not all Canadian provinces, including BC, have adopted the CCELC categorization.
However, the system provides a guide for developing ecological classifications for specific
provincial contexts, and has found use in BC both as a conceptual backdrop for biophysical
classification in the Ministry of Environment (section 3.4.1). and in development of an
hierarchical wildlife habitat classification (section 3.4.1.3). Further, the CCELC objective of
promoting use of uniform classification for resource planning and impact assessment is worth
remembering. The difficulties of integrated resource planning can only be intensified if each
resource interest uses a different inventory method and classification. Perhaps a single
classification for all of Canada would be unrealistic given the ecological and administrative
variability. However, it may not be so unrealistic within a province. But, balanced against the
advantages of a uniform classification system are the diverse objectives and needs of different
resource agencies and users. Subsection 3.4 examines the biophysical classifications used by
some BC resource agencies. This will assist in determining where and how cooperation
among agencies in the development and use of biophysical classification may streamline
resource planning.
3.3 The British Columbia land Inventory
Within the CLI agreement, each province was to form an inventon/ committee. In BC.
this committee operated first within the Department of Agriculture, then the Resource Analysis
Unit of the Environment and Land Use Committee (ELUC). and finally the Ministry of
Environment Resource Analysis Branch which later became the Assessment and Planning I
53
Table 3.1 Ecological categorization proposed by the Canada Committee on Ecological
land Classification
and commonly used scales Level of generalization Definition and features for recognition
Ecoregion 1:3.000.000 to 1:1.000,000 Area of distinct regional climate as expressed in
development of vegetation. fauna, and soils. Bounded by large-order physiographic patterns (eg. mountain range. valley system, plateau).
Ecodistrict 1:500.000 to 1:125.000 Areas where patterns of relief, geology, and
geomorphology modily regional climate to produce distinct biophysical (landform, flora. fauna, drainage)
pattern or bedrock. patterns. Boundaries set by large-scale changes in relief
Ecosection 1:250,000 to 1:50.000
Ecosite 1:50.000 to 1:lO.OOO
More homogeneous areas within ecodistricts of
water systems. Recognizable by expression of surface recurring patterns of landform, soils. flora, fauna, and
geology (eg. hummocky till landscape: glacial outwash plain).
delimited by changes in slope and soil materials or Small area with uniform biophysical characteristics,
depth.
Sources: Rowe (1979); Wiken and lronside (1977): Wiken (1986)
Division (Rees 1979). Later sections of this paper discuss specific biophysical classifications
developed by BC government agencies. This section covers the philosophy behind, and
geology. soil. and aquatic systems . could be overlaid to delineate areas oi similar biophysical

composition, or point to coincidences between proposed human activities (eg. logging) and
natural features (eg. wildlife habitat). The overlay approach helped to retain a l l information for
use as needed in specific resource planning exercises. The Capability maps and inventory’data
were used for zoning, land acquisition, assessment, environmental impact assessment, and
interdisciplinary planning as discussed in subsection 3.1 of this report. Examples from BC
include a prime use map, the Agricultural Land Reserve, and folio planning by the Ministry of
Forests.
3.3.1 Prime Use Maps
The Land Capability Analysis committee of BC. a cooperative effort of federal and
provincial resource agencies, produced prime. or best, use maps (Rees 1979). CLI maps of
the top three capability classes for each sector (agriculture. forestry, recreatlon. wildlife. and
special uses, like native range) were overlaid to delineate prime use areas (Coombs and Thie
1979). Lower quality lands were included where capability for all uses was not high (Rees
1979). On lands where capability for more than one use was high, the Land Use Analysis
Committee used biophysical data to assist in reaching consensus on which activity should
receive priority. Compatible uses were listed in background information to the best use maps
(Rees 1979). Few details are available about specific criteria used for these land use
evaluations and trade-offs. The maps were to show prime uses from an ecological perspective
only (Rees 1979: Coombs and Thie 1979): socioeconomic linkages (markets and access).
potential effects of adjacent land uses on each other, and the rationality of the resulting land
use patterns most likely played less important roles than biophysical criteria. Prime use maps
were used for a while in the early 1970s to guide land allocation (Sprout 1978).
3.3.2 The Agricullural Land Reserve
The prime use maps and other CLI data found one of their more widely known uses in
the creation of BC’s Agricultural Land Reserves (Rees 1979): A small proportion of BC is
55
capable of supporting cultivation: less than 1 % is class 1 agricultural land. Long term food
self-sufficiency became an issue in BC, and all of Canada. in the late 1960s. Concerns about
loss of prime agricultural land to non-compatible, sometimes irreversible, uses ~ directly due
to urban. industrial, commercial, or resource development, or indirectly due to fragmentation .
led to a freeze on sub-division or non-farm use of agricultural lands in late 1972 (Canada Envir.
1978). The freeze was brought into legislation with the Land Commission Act of 1973.
The purposes of the Land Commission Act were:
1 ) to preserve agricultural land for possible future use:
2) to maintain viable farming communities (Canada Envir. 1978).
(Later amendments deleted other initially stated purposes of the Act preservation of parkland
for recreation; formation of land banks for urban and industrial development and greenbelts
around urban areas. These tasks were felt to be accomplished by other government agencies
(Canada Envir. 1978).)
The designation process for Agricultural Land Reserves (ALRs) consisted of initial
Department of Agriculture proposals based on CLI capability data, and forecasts of short term
urban expansion (Canada Envir. 1978: Rees 1979). Regional districts reviewed the proposals,
held public meetings to discuss them, and then submitted suggested revisions. Final ALR
boundaries were subject to cabinet approval. ALR designation involved four criteria:
1) inclusion of CLI class 1 to 4 agricultural land not irreversibly developed in
non-conforming uses, and greater than 0.8 hectares (2 acres) in area;
2) exclusion of enough land for about 5 years of urban expansion if other
non-agricultural land was not available:
3) inclusion of CLI class 5 and 6 agricultural land where ranching was
important. or if it could used in conjunction with class 1-4 lands: and
4) inclusion of non-agricultural land (class 7) where this would preclude
incompatible uses with potential negative effects on surrounding agricultural land (Canada
Envir. 1978).

56
All Regional Districts had finalized ALRs by 1975. An appeal process allows for both
exclusions from and inclusions to the ALR. The total ALR area in BC has fluctuated around 4.7
million hectares; the smallest area, in 1982, was 4,682,008 hectares, the largest, in 1975. was
4.723.566 hectares (BC Prov. Agr. Land Comm. 1989).
The ALR has had mixed success in meeting its objectives. It has protected high quality
agricultural land from being converted to non-farm uses. About 80% of CLI class 1 to 4
agricultural lands in BC lay within the ALR. However, the restrictive zoning has assured neither
maintenance of viable farm communities. nor actual use of land for farming (Canada Envir.
1978). High quality land is necessary to maintain viable farms, but it is not sufficient. Besides
physical soil capability, farm viability is a function of economic factors such as input costs,
produce prices, and tax regimes. A further factor is total farm area, as this affects
technologies of scale (Canada Envir. 1978).
Biophysical facton are a necessary component of land use planning. Clearly, however.
planning done without recognition of the socioeconomic context cannot meet social
objectives successfully.
3.3.3 Folio and Inlegrated Resource Planning
Inventory data compiled for the BCLl constituted the bulk of biophysical information
used in "folio" planning beginning in the 1970s (Rees 1979). Folio planning, particularly
important in timber allocation, consisted of overlaying maps of forest inventory, recreation,
fish and wildlife, water, and other relevant resources. This system facilitated interdepartmental
planning by providing a means for communication of resource interactions and potential
conflict (Rees 1979). folios were used for watershed-level planning where potential for
conflict among resource users was high. Its prime use was to highlight areas where
conflicting resource values coincided, and therefore to indicate where allocation or
management decisions were needed. Biophysical folio maps could assist in allocating land
among incompatible uses either where existence of alternate areas allowed compromises (for
57
example, logging could be allowed in one important wildlife area if sufficient habitat existed
elsewhere), or where very high importance could be attributed to an area for one use (for
example, logging might not be permitted Yn critical deer winter range. or close to fish
spawning grounds). Where differences between resource vaiues were more equwocai. the
purely biophysical folio maps were less useful on their own (ORiordan 1976). In the late
1970s. folio planning became Local Resource Use Planning (LRUP). which incorporated more
involvement of local resource users, as well as resource agencies. LRUP retains the premise of
folio planning: integrating biophysical knowledge of several resources to highlight valuable
areas and potential conflicts. The Tsitika watershed case study discussed in section 2.6 is an
example of folio, or local resource use, planning.
3.4 Biophysical Clasrifiution and Inventories in BC
Several government agencies in BC are concerned with biophysical resource
management. Some, particularly the Ministries of Environment (MoE). Forests (MoF). and
Energy. Mines. and Petroleum Resources (MoEMPR) actively develop and maintain resource
classifications and inventory systems. Others, the Ministries of Tourism (MOT). Parks (MOP).
and Crown Lands (MoCL) base their resource analyses, and in the case of MOP. their own
classification system, on the work of MoE and MoF. The MoCL recently received the mandate
10 develop inventory guidelines, procedures, and policies to help ensure consistent data
collection. storage, and display among agencies (BC MoCL 1989). This Corporate Land
inventory Strategic Plan (CLISP) should facilitate inter-agency planning by ensuring that all
relevant data can be used within a common CIS. The Mof is now developing such a system,
the Analysis Framework for Integrated Resource Management (AFIRM) (BC MoF 1989a). As
discussed in section 2.5, accurate results from CIS analysis require use of data collected at
comparable scales within a consistent mapping or coordinate system. This does not require
data collection within identical units, but does require that unit boundaries are accurate within
a coordinate system (Bailey 1988). CLlSP should assist in coordinating agency inventory
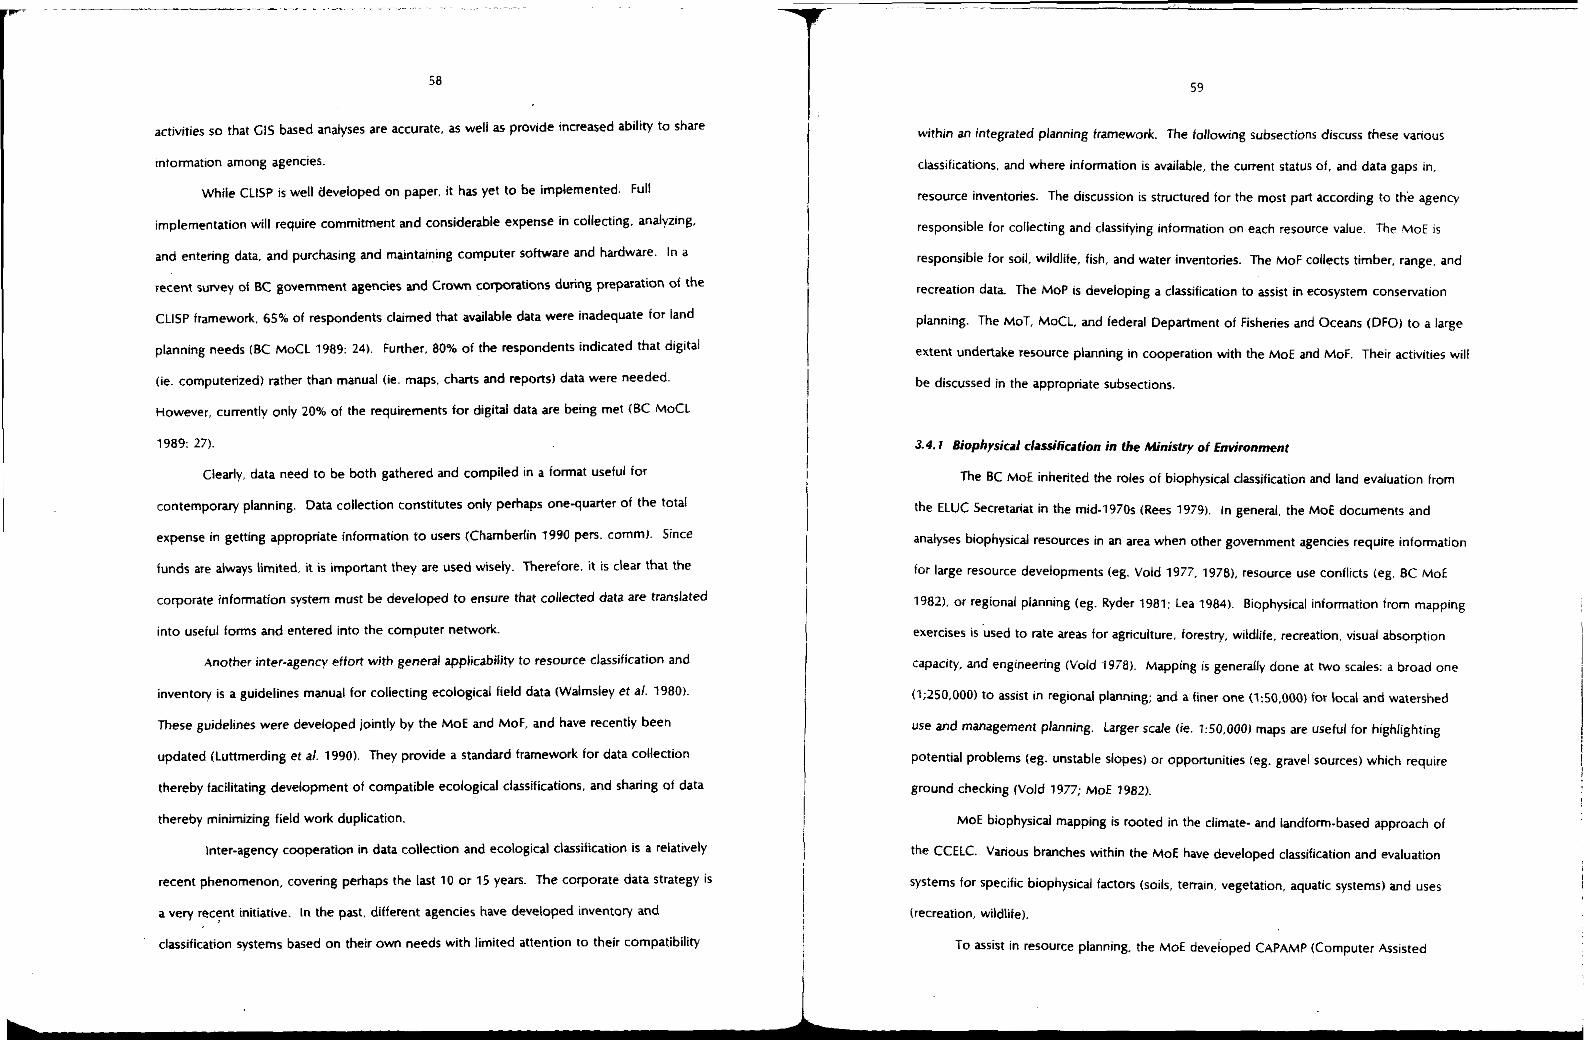
58
activities 50 that GIs based analyses are accurate, as well as provide increased ability to share
infonnatlon among agencies.
While CLlSp is well developed on paper, it has yet to be implemented. Full
implementation will require commitment and considerable expense in collecting. analyzing.
and entering data, and purchasing and maintaning computer software and hardware. In a
recent survey of BC government agencies and Crown corporations during preparation of the
CLlSP framework, 65% of respondents claimed that available data were inadequate for land
planning needs (BC MoCL 1989: 24). Further, 80% of the respondents indicated that digital
(ie. computerized) rather than manual (ie. maps, charts and reports) data were needed.
However, currently only 20% of the requirements for digital data are being met (BC MoCL
1989: 27).
Clearly, data need to be both gathered and compiled in a format useful for
contemporary planning. Data collection constitutes only perhaps onequarter of the total
expense in getting appropriate information to users (Chamberlin 1990 pes. comrn). Since
funds are always limited, it is important they are used wisely. Therefore. it is clear that the
corporate information system must be developed to ensure that collected data are translated
into useful forms and entered into the computer network.
Another inter-agency effort with general applicability to resource classification and
inventory is a guidelines manual for collecting ecological field data (Walmsley et a/. 1980).
These guidelines were developed jointly by the MoE and MoF, and have recently been
updated (Luttmerding et a/. 1990). They provide a standard framework for data collection
thereby facilitating development of compatible ecological classifications. and sharing of data
thereby minimizing field work duplication.
Inter-agency cooperation in data collection and ecological classification is a relatively
recent phenomenon, covering perhaps the last 10 or 15 years. The corporate data strategy is
a very recent initiative. In the past, different agencies have developed inventoly and
classification systems based on their own needs with limited attention to their compatibility
59
within an integrated planning framework. The following subsections discuss these various
classifications, and where information is available, the current status of, and data gaps in,
resource inventories. The discussion is structured for the most part according to the agency
responsible for collecting and classitying information on each resource value. The MoE is
responsible for soil, wildlife, fish, and water inventories. The MoF collects timber, range, and
recreation data. The M O P is developing a classification to assist in ecosystem conservation
planning. The MOT, MoCL. and federal Department of Fisheries and Oceans (DFO) to a large
extent undertake resource planning in cooperation with the MoE and MoF. Their activities will
be discussed in the appropriate subsections.
3.4.1 Biophysical classhicafion in the Ministry of Environment
The BC MoE inherited the roles of biophysical classification and land evaluation from
the ELUC Secretariat in the mid-1970s (Rees 1979). In general, the MoE documents and
analyses biophysical resources in an area when other government agencies require information
for large resource developments (eg. Vold 1977, 1978), resource use conflicts (eg. BC MoE
1982). or regional planning (eg. Ryder 1981: Lea 1984). Biophysical information from mapping
exercises is used to rate areas for agriculture, forestly. wildlife, recreation, visual absorption
capacity, and engineering Wold 19781. Mapping is generdly done at two scales: a broad one
(1;250.000) to assist in regional planning; and a finer one (1:50,000) for local and watershed
use and management planning. larger scale (ie. 1:50.000) maps are useful for highlighting
potential problems (eg. unstable slopes) or opportunities (eg. gravel sources) which require
ground checking (Vold 1977; MoE 1982).
MoE biophysical mapping is rooted in the climate- and landform-based approach of
the CCELC. Various branches within the MoE have developed classification and evaluation
systems for specific biophysical factors (soils, terrain, vegetation, aquatic systems) and uses
(recreation, wildlife).
To assist in resource planning, the MoE developed CAPAMP (Computer Assisted

60
. .
61
Planning, Assessment, and Map Production) beginning in 1980 (Kenk et a/. 1987: Sondheim
1990 pers. comm.). CAPAMP was. during its time, a sophisticated CIS used for producing
project specific resource analyses. The system consisted of soils, agricultural capability.
surficial geology, forest cover, and other biophysical data, and algorithms (mathematical
formulae) used to develop interpretations. About 50 analyses and interpretations were done
on themes such as: post-logging landslide hazards: treespecies selection for regeneration:
evaluation of ungulate habitat: irrigation requirements for agriculture; potential for chemical
contamination of lake water from farms and settlements: and effects of economic factors
(interest rates, land improvement costs) on farm viability (Kenk et a/. 1987).
In about 1987, progress in computer technology surpassed that employed in CAPAMP
(Sondheim 1990 p e r s . comm). Since then the expert-oriented CAPAMP has largely been
abandoned in anticipation of a CIS format in which many users can access data, as is one
objective of CLISP. However, data from CAPAMP have yet to be reloaded into another
computer network (Louie 1990 pers. comm). These data will hopefully be transferred to a
database accessible to the computer network developed for CLISP.
3.4.1.1 Soil and Agricultural Capabilitv
Soil inventories combine physiography, surficial materials. vegetation, and soil
development (Vold 1977, 1978). The System of Soil Classification for Canada (Canada. Agric.
1978) forms the basis of soil descriptions. In 1988, eighty-nine soils maps existed or were in
preparation for BC (Canada. Agric. 1988). These range in scale from 1:5,400 to 1 : l million,
with most in the 1:16,896 to 1:100,000 range. The soil inventory covers most of the inhabited
areas of BC: Vancouver and the Lower Mainland, south and middle interior, and Vancouver
Island. The Coast Mountains and northem interior are not inventoried.
Until recently, BCSS (the 8C Soil Information System) a computerized data bank
developedrooperatively by the MoF, MoE. BC Ministry of Agriculture and Fish, and the
federal Department of Agriculture provided a standardized framework for collection, storage,
7- I
I I I i . i
and retrieval for soils data (Sondheim and Suttie 1983). BCSlS was never widely used, and was
abandoned in early 1990 (Louie 1990 pers. cornm). However, CanSlS (the Canadian Soil
Information System) houses some digital soil information. as did CAPAMP (see subsection 3.4)
(Canada Agric 1988) The remainder is available in map form.
The CLI approach forms the basis of MoE interpretations of agricultural capability Wold
1977: BC Climatology Unit 1981). That is, the larger the range of crops the soil will support,
the higher the rating. Most land with high biophysical capability for agriculture is zoned
within the ALR (see subsection 3.3.2). Therefore, relatively little effort would be required in
regional planning exercises to delineate potential agricultural areas.
3.4.1.2 Vezetation
The MoE vegetation classification is very similar to the biogeoclimatic system
developed by the Ministry of Forests (see section 3.4.2.2). The two systems initially
developed along slightly different paths. But as the MoF classified more of the province with
the biogeoclimatic system. the MoE began using biogeoclimatic zonation as a basis for its
further delineation of vegetation landscapes (Lea 1986). The MoE approach emphasizes
topography somewhat more than the biogeoclimatic system. This difference reflects the MoE
role in land use interpretation as compared to the MoF's need tor specific management
prescriptions.

I' ~~
I ~~ ." ~.. "~ ~.
62
The MOE also sponsored development of a wetland classification useful for wildlife
planning (Beets 1982; Runka and Lewis 1981). Steen and Roberts (1988) used this system
when developing the MoF guide to wetland ecosystems in part of the Cariboo plateau. While
wetland classification is a subject on its own, wetland areas could be classified and evaluated
with the ungulate habitat system. Further, the ungulate classification has been incorporated
into a hierarchical classification (Demarchi et a/. 1990), and could be expanded to other
wildlife species. Therefore, the ungulate classification is discussed here.
Biophysical ungulate classification entails delineation of biophysical units from terrain,
vegetation, and climate so that areas can be evaluated for different species according to
inherent potential of the land. Demarchi (1990a) and Demarchi and Lea (1989a) describe the
hierarchical classification under development in the MoE Wildlife branch. This system
combines biophysical concepts reminiscent of the CCELC. and the biogeoclimatic system
used by the MoF. (The biogeoclimatic system is described in sub-section 3.4.2.2) Table 3.2
shows the hierarchy, and the planning uses of various levels.
Spatial and temporal considerations are important in wildlife habitat classification. To
fill various behavioral (eg. escape routes, calving areas) and seasonal requirements (eg. winter
habitat, migratory routes or stopovers). wildlife need different types of habitat. Therefore,
wildlife management requires knowledge of the spatial and temporal dynamics, and quantity
of particular habitat-types. This differs from timber management, tor example. where the
prime considerations are choosing the most appropriate harvesting technique, tree species, or
site preparation method. Timber managers use the biogeoclimatic system. which provides an
indication of potential growth and probable successional trend, as a guide to such decisions.
Wildlife managers can also predict the vegetational dynamics of habitat over time within a land
unit using the biogeoclimatic system. By integrating this knowledge of each land unit into
broader biophysical areas, they can predict spatial patterns. However, the biogeoclimatic
system itself does not facilitate classification of land according to the needs of wildlife.
63
Table 3.2 Biophysical wildlife habitat classification in British Columbia
Classi- fication ' Scale, Level Planning Main Uses
Level
Mapping Distinguishing Features,
Ecoregion
Ecosection
Biogeocli- matic Units
Biophysical Habitat Classes
1:2,000,000 Provincial
1:500,000 Regional
1:250,000 Regional, Timber Supply Area, Operational
1:50,000 TSA and Develop ment Planning, Operational
Watershed 1:20,000
Planning
Special 1:5,000
Projects
landform pattern). and plant and animal Broad scale climate, physiography (general
distribution. Useful for examining current and potential animal distribution over broad areas.
Sub-division of ecoregions based on climate, terrain, soil, vegetation, and animal use. Useful in examining regional wildlife distribution and needs.
Based on climatic zonation. and climatic climax vegetation. Terrain divided into groups of local landforms.
capability rating; forecasting successional Useful for determining biological productivity for
suitability changes over time. change in vegetation to predict habitat
aspect); soil classes (texture, depth, chemistry); Local landforms, and topography (slope classes,
plant communities (successional and climax). Defining units ot potential and current wildlife use.
Specific landforms and more specific soil classes than at 1:50.000; current successional stage. Predicting effects of human activity on wildlife.
Micro-climate, specific soil, parent materials and plant community. Defining specific sites of animal use.
~ -
Source: Demarchi, Clark, and Lea (1990)

64
Broader forest-level concerns are not as important for timber as for mobile wildlife (Demarchi
1990, pers comm).
. The MOE classifies land according to its inherent biophysical capability for wildlife
(Demarchi et a/ . 1983). Similar to the CLI, then, this classification does not account for the
current administrative. economic, or biophysical state of the land. Clearh/ though. other
socioeconomic factors would require consideration before allocating a land unit to wildlife
habitat.
Biophysical wildlife capability classifications facilitate both management (eg. choosing
areas for habitat enhancement or protection) and land allocation (eg. protecting habitat from
development) (Demarchi et a/. 1983). Different scales of classification can assist in these
tasks. Smaller scale maps (1:125.000 - 1:250,000) are useful in determining general spatial
distribution and links among habitat units, and to establish the regional needs for wildlife
habitat. An example is the wildlife maps for the East Kootenays (MoE 1989). Larger scale
maps (1:20,000 - 1:SO.OOO) can help to delineate areas having specific biophysical
characteristics. thereby facilitating formulation of local management plans (Demarchi and Lea
1989b). If wildlife management requirements are not compatible with other resource
management activities. a land allocation decision must be made. For example, If the habltat
unit under consideration was not critical when viewed in the regional context, another use
could take precedence in that area. Therefore, different levels of hierarchical classifications
can be linked to assist in making both management and allocation decisions.
To provide adequate information for current needs, the MoE Wildlife Branch estimates
it would have to spend approximately $18 million over 5 years on the wildlife habitat inventory
(Demarchi 1990b pers. comm). This expenditure could assist in completing 1:2SO,OOO maps
for strategic level, Timber Supply Area planning, and 1:50,000 maps for critical areas requiring
more detailed planning. Some 1:20,000 mapping could possibly be done in some areas of
particularly intensive use. To complement habitat inventories. the MoE performs research
including cooperative work with the MoF in the Integrated Wildlife Intensive Forestry Research
program (eg. Eng and McNay 1989).
3.4.1.4 Fisheries and Aquatic Systems
The BC MoE cooperates with the DFO in planning for-and managing fisheries habitat.
DFO and MoE, within the FederaV Provincial Fish Habitat Inventory and Information Program.
have developed a Stream Information Summary System (SI55). The SlSS is based on the
aquatic system inventory developed by the MoE (Chambedin 1979). The computerized SlSS
database includes information on fish (escapements. life history timing), fish habitat (stream
location, gradient, obstructions, flow), current management activities, and fish production
potential and constraints (Canada DFO 1989). Stream Summary Catalogues present summary
data from the SISS. The catalogues, published by DFO administrative units, are currently
available for 18 of 45 DFO subdistricts in BC (Canada DFO 1990).
The SISS considers salmonid species only, therefore covering only some of the fish
species in BC. From an economic perspective the SISS may include the appropriate species.
But if biological diversity concerns shift some attention to less economically critical species as
has been the case in wildlife management, the inventory may need to expand.
Geographically, stream information is sparse for areas north of Williams Lake (Lewis
1990, pers comm). The SlSS contains information on about 3000 streams (Canada DFO 1989).
but the BC MoE claims that 200 of the 4000 rivers and streams in BC are inventoried at
reconnaissance levels (1:50.000) (BC MoE 1990). This information is useful for highlighting
stream reaches which may have critical or sensitive habitat, and delineating location and timing
of fish presence, which can help when development proposals are referred to the MoE.
However. 1:50.000 maps are too broad to enable specific management recommendations
(Cadson 1990, pers comm). More detailed information (ie. 1:20,000) needed for the referral
process is limited. Fisheries branch personnel currently use topographic maps, historical
records, and experience when responding to referrals. Topographic maps give a general
indication of the probable importance of a stream to tish. and form a basis of stream reach

66
categorization in the Coastal Fisheries/Forestry Guidelines (MoFUMoE 1987).
The MOE plans to invest about 83 million between 1991 and 1992 to perfom
reconnaissance inventories (8900,000) and research on fisheries management (82.1 million).
These efforts will not complete the inventory, but the data collected will allow extrapolation
to other streams (Lewis 1990. pen comm). Research priorities include: developing regional
management targets; investigating fish population dynamics; assessing non-consumptive uses
of fish: and determining the long-term effects of environmental change on aquatic resources.
which includes use of fish as indicators of water quality (Lewis 1990, pers comm). Continued
research into the ecology of aquatic systems is needed to improve management capabilities.
and also to highlight which ecosystem data should be inventoried.
A stream inventory would assist in setting priorities for field checks, and in general
zoning for different types of management, for example , timber harvesting methods. Maps
would never replace the need for field personnel, but could promote efficient use of time.
3.4.1.5 Terrain Classification
Terrain, the combination of topography, bedrock, and geomorphology, affects
activities from agriculture and timber harvesting, to location and construction of roads,
pipelines, buildings, and other settlement infrastructure. The MoE uses a terrain classification
system (ELUCS 1976: Howes and Kenk 1988) to facilitate mapping and interpretation of
geologic hazards and opportunities for land use and management. The MoE and MoF have
cooperated in writing a manual to assist in identifying potentially unstable slopes for timber
management prescriptions (Howes 1987). Managers can use these interpretations to locate or
design harvesting to minimize sediment transfer into fish bearing streams, or loss of soil for
future timber growth. Forest companies are required to map proposed harvesting areas using
the MoE terrain classification (Howes 1990, pers. comm).
Terrain associated hazards and opportunities are a major determinant in choosing sites
67
characteristics. and slope stabilih, affect capability for StNCtUTal foundations. excavations (eg.
utility corridors). liquid and solid waste disposal, roads. and above-ground water storage
(Ryder and Howes 1984). Areas susceptible to geologic hazards such as landslides. rockfalls.
debris flows. and avalanches, should be avoided during development to minimize chances of
life and property loss (Ryder 1981). The siting of Tumbler Ridge, part of the Northeast coal
project. relied heavily on terrain information, as well as potential conflicts with fish and wildlife
habitat. and heritage resources. and recreation potential (Quin 1979).
Currently. the bulk of terrain mapping in 8C is contracted out by the MoE (Howes
1990. pen. COmm). The MoF and corporate Tree Farm License holders also do Some
mapping, as does the MoE Wildlife Branch in i ts habitat capability work. Because of this task
division. it is difficult to know exactly how much of the province has been mapped. There is
no Central data bank for terrain information in BC. Further, due to limited MoE staff and
financial resources. monitoring of mapping and related interpretations is difficult, particularly in
the case of outside contracts.
A rough estimation is that approximately one-third of BC's terrain has been mapped at
1:5O.OOO (Howes 1990, pen. comm). Larger scale (1:20,000) mapping is normally done prior
to development; less of the province is mapped at this scale than at 1:50.000. Smaller scale
maps are USUallY sufficient for long-term strategic planning, that is for example. allocating land
to different uses when determining allowable annual cuts for Timber Supply Areas (Schwab
1990, PeE. comm). However, for more site specific decision making, for example. locating
cutblocks during timber hawest development planning, 1:20,000 data are needed. It is a MoE
oblective to map all operable timber harvesting areas in coastal BC at this larger scale (Schwab
1990. pen. comm).
A useful terrain inventory should include interpretations of terrain maps - sensitive or
unstable terrain. areas prone to avalanche - since most users do not like to interpret raw
terrain maps (Schwab 1990, pers comm). An estimated cost has not been determined for
larger Scale mapping for operational planning, the smaller scale strategic level for sub-division and new settlements (Maynard 1979). Load bearing capacity, drainage
,
68
3.4.1.6 Water Resources
The MOE Water Management and Waste Management Branches are responsible for
managing water supply and quality on Crown lands. The Waste Management Branch grants
legally binding permits or approvals for activities that might affect water quality. Provincial
water quality criteria (WQC) form general guidelines to protect water for all uses, while water
quality objectives (WQO) are specific to a watershed or water body, and guide planning and
development, including permit formulation.
WQCs cover chemicals (chlorine, mercury, lead. etc.) and other environmental quality
variables, such as acidity (pH), colour, particulate matter, and nutrients and algae (Buchanan
1987). The provincial WQCs guide the setting of specific WQOs depending on the types of
uses prevalent in the watershed or body under consideration. In some areas the obiective is
to maintain current high quality. whereas in others, it is to ensure water quality does not sink
below a minimum standard.
As of July 1990, WQCs were completed for 12 substances, with reports forthcoming
on 8. WQOs were set for 26 areas, with 21 reports in progress (BC MoE 1990). Quality
objective-setting has been concentrated in areas close to industrial developments, such as
pulp mills. Of the areas with WQOs. only one is a community watershed: Hydraulic Creek
near Kelowna (Buchanan 1990. pers. comm). As WQO-setting is completed for current
priority areas, emphasis will likely shift to community watersheds
The MoE and other government agencies cooperated in developing Guidelines for
Watershed Management on Crown Lands used as Community Water Supplies (BC MoE 1980).
69
These provide general guidance during planning for timber harvesting or other developments.
However, they do not offer specific management or land allocation prescriptions as would
WQOs. The Guidelines become operational when the MoCL notifies the MoE Water
Management Branch that an area under application for development is a community
watershed (Reksten 1990). The Water Management Branch is therefore involved in integrated
resource management planning for community watersheds. As resource development and
integrated planning increase in scope in BC. the Water Management Branch role will expand.
The setting of WQOs for individual watersheds to provide more specific direction to
development planning will be an important aspect of this involvement (Buchanan 1990, pen
comm).
The setting of WQOs can play a role in developing more comprehensive Integrated
Watershed Management Plans (IWMP). The MoE and MoF have undertaken IWM planning in
some areas of BC. mostly in response to community water supply/ logging controversies
(Reksten 1990). As of March 1990, 5 IWMPs were finished or near completion, and 5
planning processes were underway (Rekste’n 1990). Pressures for development of community
watersheds are increasing. Integrated planning could form a rational basis for watershed
developments, such as logging and mining. However, staffing and budget constraints in the
MoE frequently necessitate delegating planning coordination to other agencies, particularly the
MoF. or dealing with development proposals through referrals (Reksten 1990).
3.4.2 Biophysical Classification in the BC Ministry of Forests
The BC Ministly of Forests has a legislated mandate to plan for integrated
management of timber, fish, wildlife. recreation, and water in consultation with other
government agencies (BC 1979a.b). The MoF is responsible for managing timber, range,
outdoor recreation, and wilderness on the Provincial Forests. The MoF normally refers issues
relevant to other non-timber resources to other agencies for comment. For example, during
so-called development planning, the MoF requires forest company licensees to send

70
proposed timber harvest plans to the Fish and Wildlife Branch of the EC MoE. The MoE then
may recommend aiterations to cutting boundanes, or management actions to account tor
sensitive habitat.
3.4.2.1 Timber
The MoF timber inventory contains information on forest stand volume, age, height.
stocking (per cent coverage of a site by trees), and site quality, as well as environmental
sensitivity of non-timber values to timber harvesting. Volume, age, height, and stocking data
are collected in the field periodically, and then updated annually according to forest growth
models, timber harvest records, and information on losses to fire, insects, and disease.
Environmentally sensitive area (€SA) codes are used to highlight land units with either
significant non-timber values, or high sensitivity to timber harvesting (eg. fragile soils).
The MoF timber inventory site quality estimates are based on the standing crop; if the
existing forest comprises large trees which appear to have grown quickly, the site is rated as
high quality. Unlike the CLI forestry classification, current MoF site quality ratings are not
based on observations of site components (soil, moisture). and estimates of their capability to
grow timber. Use of the standing crop as the sole indicator of site productivity can result in
incorrect estimation of timber growth potential (Louie 1990 pers. comm).
The biogeoclimatic ecosystem classification discussed in the next section forms the
basis of some work on estimating inherent biological productivity of sites (MacKinnon et a/.
1988). However, the CLI ratings still provide the only classification of timber growth potential
based on soil and climatic factors.
Vold (1977) expands CLI forestry interpretations to include limitations due to
regeneration problems, windthrow hazard, logging road construction, and erosion hazards.
These considerations affect land suitability more than inherent capability, as they all to some
extent deppd on the specific management techniques used. Biophysical analysis requires
information on inherent capability. Such data should not be lost if they are combined with

/ L
management decisions, but limits the utility of the system for land allocation decisions.
Biogeoclimatic research has focused on timber management applications. This
research provides indirect intormation that could help determine the feasibility of managing a
site for timber. For example, if the recommended harvesting method is expensive, and
seedlings of some tree species for regenerating the site are difficult to obtain or expensive.
one might conclude that the site has poor timber management feasibility. Ecosystem data
necessary for capability interpretations for other land uses are collected for biogeoclimatic
identification. However, the interpretive frameworks tor activities other than timber have not
been developed to the same extent as under the MoE biophysical system.
The initial stage of biogeoclimatic classification is now virtually complete. This stage
involved the mapping of biogeoclimatic zones, subzones, and variants, that IS , the zonation
of land primarily on the basis of climate, and writing of field guides to assist in ecosystem
identification and interpretation (Meidinger 1990 pers. comm). Mapping and classification
occurred at various scales: 1:2 million for zones, and 1:lOO.OOO to l:SOO,OOO for subzones and
variants depending on the detail needed. Each of the 6 forest regiok now has a guide for
site identification which includes site preparation, tree species selection, and in some areas,
wildlife and range interpretations. This phase of biogeoclimatic classification took about 13
vears, and cost $12-14 million (Meidinger 1990 pers. comm). The biogeoclimatic system will
continue to undergo revisions as new needs arise, and to form the basis of research and
classification of timber and non-timber (particularly wildlife and range) resources.
3.4.2.3 Recreation and Tourism
The MoF is responsible for outdoor recreation management on Provincial forests,
which cover 85% of BC. The recreation inventory comprises two classifications: the first of
recreation activity opportunities and sensitivity of recreation to other resource development;
and second, of landscape aesthetics. . The recreation activity inventory roughly follows the format of the CLI classification,
73
and subsequent work done by the MoE (Block and Hignett 1982). CLI recreation maps are
still used for planning in BC (Block and Hignett 1982). However, two limitations of the CLI
reduce its utility.
Firs:, CLI ratings combine the ability of land both to attract and support recreation.
The mapped classification focuses specifically on opportunities offered by the land. omitting
biophysical limitations to carrying capacity and use (Block and Hignett 1982). The MoE
outdoor recreation classification (Block and Hignett 1982) rectifies this by separating these
two aspects of recreation capability.
The second limitation is that since the CLI, social preferences have changed. Activities
unforeseen by the CLI compilers, such as heli-skiing, heli-hiking, and back-country skiing. are
now popular. These new demands mean that CLI maps do not provide all information
necessary for current recreation planning.
The classification used by the MoF notes the sensitivity of recreation to timber
development, not the sensitivity of land to (or carrying capacity for) recreation. In this sense
it differs from the proposed classification of the MoE (Block and Hignett 1982). Before
activities not included in the CLI are incorporated into the recreation inventory, new evaluative
criteria must be developed.
The landscape aesthetics inventory records both visual qualitv objectives. that is. the
degree to which evidence of logging is acceptable, and the sensitivity of aesthetics to
landscape modifications such as logging (BC MoF 1981). Landscape information is most
relevant for development planning along travel corridors and near recreation areas or
settlements.
Recreation and landscape aesthetics inventories are updated as Timber Supply Area
(TSN plans are reviewed and rewritten approximately every 5 years. Since about one-fifth of
the TSA plans are redrafted every year, the objective is to revise the provincial inventory every
S-YearS (Murray 1990 pers. comm). The policy of updating recreation inventories for TSA
planning began in 198Z83. A cuirent objective is to complete the inventory to reflect

74
planning needs within 5 years (1995). and to digitize these data into a CIS (Murray 1990 pers.
comm:.
Revising and filling-out the recreation inventory will require funds and staff. Currently.
the Recreation Section receives about 0.7% of the MoF budget (BC MoF 1990a). Completion
of an inventory framework that will serve as a basis for future revisions may require more
resources than have been available historically (Murray 1990 pers. comm). However, no
accurate estimates were available.
Besides the MoF, other agencies have interest in tourism planning. The BC Ministry Of
Crown Lands, together with the MOT, has sponsored recreation planning to zone areas to
guide its land leasing program. MOT objectives are less development oriented; it uses
recreation and tourism capability infomation to support its advocacy of such activities for
both their economic and leisure potential.
The work of MoCL and MOT will assist in expanding the scope of recreation
inventories and capability analyses to activities not included in the CLI, and to areas not
covered by the MoF. An example is a MoCL study attempting to define potential back-
country recreation development zones for the Whistler area in southwestern BC. In this
study, Careless (1990) overlays requirements for activities such as heli-skiing, heli-hiking. and
back-country skiing with biophysical land characteristics (terrain. climate, vegetation) to
delineate areas with biophysical capability to support the uses. He also uses current
ownership and land use to define areas with suitability for each activity, and finally,
socioeconomic factors, such as access and infrastructure, to decide on areas where recreation
would be feasible. The BC Ministry of Tourism (MOT) is compiling a catalogue of biophysical
requirements for various activities to facilitate recreation planning (Ctyzbowski 1990 pers
comm).
3.4.2.4 Range Resources
The Range'Section of the MoF Integrated Resources Branch manages research,
I
7s
classification, and inventory, as well as users. of range resources. Very little of the range
resource has been inventoried. Users of range data, including cattle ranchers and wildlife
managers, require information both on the location and productivity of range (Campbell 1990
pers. comm). This information is currently scarce. Attempts to link range productivity to
forest cover have proven fruitless; therefore an inventory and classification system specific to
range is now being developed based on the biogeoclimatic system (Campbell 1990 pers.
comm).
In addition, a habitat monitoring manual jointly written by the MoF and MoE Wildlife
Branch should be completed in late 1990 (BC MoVMoF 1990; Campbell 1990 pers. comm).
This manual will assist in standardizing range and wildlife habitat data collection, and avoiding
duplication of effort. The manual will include guidelines for collecting information on cattle
and wildlife utilization. seeding, tree planting, and herbicide use as they affect range
conditions.
In general. range classification and inventory are at an early developmental stage in
BC. How far such aciivities will extend, in terms of both theoretical development and
geographical coverage will likely depend on the importance given to range resources relative
to other forest values during budget and staffing allocations.
3.4.3 Conservation Planning in the BC Ministry of Parks
BC Parks is in the process of developing a systems plan to guide completion of the
protected area system. The Ministry of Parks (MOP) has approached this by proposing division
of BC into 59 representative landscapes (BC MOP 1990a). and a list of 519 special features (BC
MOP 1990b). Landscape delineation involved combining biogeoclimatic (Pojar et a/. 1987).
ecoregion (Demarchi 1987. Demarchi and Lea 1989a). and physiographic classifications, as
well as the criterion that the general public should be able to discem the difference among
landscapes (BC MOP 1990a). There are similarities between the landscape classification and
thoseirsed to design it, but the overlap is not complete. The MOP designations are still at the

i 6
discussion stage. Some agency interests feel that the more stridly ecologically based
ecoregion and biogeoclimatic classifications would be more sulta~le than the MOP proposai (0
guide the BC park, goal of preserving a cross-section of ecosystems. However. discrepancy
bemeen the MOP classification and the ecoregion and biogeoclimatic classifications is not
perceived as large within MOP (Munn 1990, pers comm). lnitid COnceptudiZatiOn Of the
representative landscape classification was at a small scale (1:2 million); as larger Scale
mapping and ground checking takes place, correspondence between the systems will likely
increase (Munn 1990, pers comm).
The representative landscape classification, when finalized, will assist in determining
which parts of BC are under- or unrepresented in the current park, system. This knowledge
will help in setting priorities for land acquisition, and in developing land use zoning and
management strategies in consultation with other resource agencies. The MOP is currently
working on evaluative criteria for potential representative areas. This a recent initiative in BC.
and the theoretical literature does not offer a consensus position on which criteria to use. or
how t6 combine them (Gotmark et a/. 1986; Smith and Theberge 1986). To ensure that
protective allocation of land is rational, conservation evaluation will require much work in BC.
3.4.4 Assessing Mineral and Energy Potential in the BC Ministry of Energy, Mines, and Petroleum Resources
The BC MoEMPR has the dual role oi encouraging and regulating discovery, development. and
production of energy, mineral, and petroleum resources (BC MoEMPR 1984). Mineral or
energy exploration, production, and transport (pipelines, electricity transmission) are
frequently incompatible with other land uses. Yet the social demand for minerals and energy
is undeniable. One purpose of the MoEMPR, therefore, is to ensure consideration of these
demands during land use decision making. The current ministry position is to resist park and
other protective designations in the area before mineral or energy potential has been
assessed; !hat is, to avoid making land use decisions without considering the iull range of
resource options (BC MoEMPR 1990). Several MoEMPR inbentories provide an initial overview
T I
77
of this potential.
Mineral inventory maps at 1:126.720 (1 inch to 2 miles) and 1:250.000 show both
bedrock geology and known mineral occurrences. This information is entered in the MINFILE
database. and is updated yearly. Regional Geological Survey Branch geologists (there are 8 ~r.
BC) do larger scale (1:50.000) mapping on an ongoing basis (BC MoEMPR 1988: Fontaine
1990 pers. comm). The Assessment Report Index System (ARIS) stores data on mineral claims.
ARE includes information on claim ownership and exploration and development activities at
1:126,720 or 1:250,000. The Mineral Titles Branch of MoEMPR has 1:50.000 information on
claim locations. Geochemical survey data from analysis of stream sediments are available on
1:250.000 maps and computer diskettes for roughly 40% of the province (BC MoCL no date).
Finally, the ministry compiles maps delineating major sedimentary basins (petroleum). and
broad areas having potential geothermal, mineral. or coal resources (BC MoEMPR 1984: 22-
25).
All of this information is useful in land use discussions. However, most data are for
potential not actual occurrences. Exploration i s still required to locate actual deposits
(Fontaine 1990 pers. comm). and therefore highlight areas where deciding on a land use
allocation will entail trade-offs: that is, mining will, for at least a while, make an area
unattractive for most other uses; not minlng will mean ioregoing economic returns from the
mineral resources. Funds are not always available for the ministry to undertake such
exploration, or encourage private industry to do so. Through its guidelines for mineral
exploration (BC MoEMPR 1989). the ministry attempts to ensure that exploration activities
follow legislated requirements, and have minimal negative environmental impact.
MoEMPR does not have a resource planning mandate, meaning district offices are
small with few staff available to attend inter-agency planning meetings (Fontaine 1990 pers.
comm). Inventory databases. to some extent, overcome staff limitations by providing some
mineral and energy information for use by planning staff from other agencies.

F- "
78
3.5 Using Biophysical Information in land Allocation - Timber Supply Area Planning
The biophysical classifications and inventories discussed above are widely used In
determining land use allocations in BC. Location of agricultural land reserves, and integration
of timber, wildlife, fisheries, and recreation concerns in local resource use planning processes
such as in the Tsitika watershed, were discussed earlier. Biophysical capability was an
important factor in locating Tumbler Ridge for the Northeast coal project (Quin 1979).
Candidate areas for the parks system will be evaluated largely on the degree to which they are
biophysically representative of some area of BC (BC MOP 1990a). Attempts are made to
locate roads and highways in areas of stable slopes and moderate terrain to minimize water
body sedimentation, slope destabilization, and road building costs (Howes and Kenk 1988).
Where roads cannot be optimally located, biophysical information is useful for delineating
areas requiring management strategies to minimize potential for damage (eg. buffer strips.
retaining walls).
A particularly important use of biophysical analysis in BC is in Timber Supply Area
(T5A) planning. During TSA planning, the allowable annual cut or timber harvest (AAC) for an
area is determined. The MoF apportions the AAC for the TSA to different forest companies in
fairly long-term (15-20 year) licenses. Since 65-70% of the provincial AAC comes from TSAs.
and overall the MoF has junsdiction over 85% of provincial land, it is clear that allocative
decisions at the T5A level are important determinants of resource use patterns in BC. This
sub-section examines how some of the biophysical inventories previously outlined in this
section are used in TSA decision making.
The MoF has specific responsibility for timber, range, and recreation in provincial
forests (BC 1979a). MoF is also mandated to integrate concerns of other government and
private resource interests into its plans. In general terms. the goal of TSA planning is to reach
a balance among the resource management goals and objectives pf all resource interests
either through land allocations or land management techniques, such as silviculture or
landscape planning. Four documents are produced during the TSA planning process: the
79
timber supply analysis information report provides technical data on how different land
allocation strategies and management regimes affect the timber inventory; the timber supply
analysis summarizes the information report; the options report. a focus for public comment.
summarizes timber and non-timber resource supply impacts of the various land allocation and
management options; and a draft plan discusses how the proposed plan addresses resource
management issues in the T5A. The focus of all of these documents is the timber supply
implications of alternative land allocations or management strategies; that is. for example. how
increased emphasis on wildlife protection or increased expenditure on silviculture would affect
the long run sustainable yield of commercial timber (LRSY).
A critical determination in TSA planning then, is the land base assumed to contribute
to the LRSY: that is, the "operable" forest. Several factors are considered when defining the
operable forest land base: the timber inventory (timber volume, age. and site quality);
information on environmentally sensitive areas; economic and technological considerations:
and area-specific knowledge of government and forest industry planners. Determination of
the operable forest area entails subtracting the following from the total forested area (BC MoF
1988b: Lang 1990 pers. comm; Thomae 1990 pers. comm):
1) areas not satisfactorily restocked (NSR) or with doubtful stocking (DSD) after a
disturbance;
2) areas growing non-commercial brush species (NC);
3) roads and other rights-of-way;
4) areas of low forest productivity (low sites);
5) deciduous forest areas, if these are not harvested commercially in the TSA;
6 ) areas which are physically inaccessible or have significant non - t 8m b er values
(wildlife, fish, recreation, avalanche protection, watershed), potential post-logging
regeneration problems, or soils with high sensitivity to logging. These areas can
be recorded in the timber inventory as ESAs (environmentally sensitive areas) or

80 81
delimited during discussions between MoF and other agencies or interest groups:
and
7) areas not economic to harvest given current technology and markets (ie. beyond
the 'operability !ines' drawn by MoF and industyl.
Land in the operable forest base is assumed to contribute to the allowable annual cut WAC)
for a TSA.
For some of the above reductions, including NSR, DSD. NC, low sites, &d deciduous
species, fairly clear definitions guide the process of netting down the total productive forest
to the operable area. For others, particularly defining operability lines and deciding ESA
reductions, guidelines are more vague and require judgement by government planners (Lang
1990 pers. comm: Thomae 1990, pen. comm).
For example, ESA codes specify the type (wildlife, recreation, watershed. soil.
regeneration, avalanche, inoperable), and degree (moderate or high) of constraints to timber
harvesting. Areas with €SA codes are assigned reduction factors which represent the
percentage of those areas planners feel should be removed from timber production. BC MoF
documentation provides guidelines for mapping and classifying ESAs (BC MoF 1984). but not
for assigning reduction tactors. The reduction factors van/ depending on the specific area.
and the type and significance of the concern. For example. areas with moderate soil
sensitivity may be netted down by 60%: areas with highly significant wildlife habitat may be
reduced by 90%. Further, two areas with a moderate soil sensitivity rating could have different
reduction factors (eg. BC MoF 1988b).
The judgements involved in assigning ESA significance and reduction factors, or
delineating inoperability lines are based on combined expert opinion and experience within
TSA planning committees. However, the rationale behind the judgements is not documented
in TSA reports (eg. BC MoF 1988b).
Several options are considered for the TSA land base. These normally include:
. retaining the status quo; providing access to areas previously considered inoperable; reducing
i
I
i
I
i
1
I
or extending harvest age; increasing silviculture or protection (fire. disease) expenditures;
expanding land area reserved tor fish or wildlife habitat; and maintaining or increasing
recreation opportunities (BC MoF 1990b). Each option is analyzed for its effect on: the
operable forest land area, AAC, LRSY, and currently available timber volume: type and quantity
of recreational land; range resources. if important in the TSA and wildlife populations and
habitat area (BC MoF 1990b). The provincial chief forester considers "technical and
socioeconomic" factors in deciding which option to approve (BC MoF 1989b).
The final plan documents how various issues in the TSA will be addressed through
plan activities. The TSA is zoned for various management emphases. including timber
production, wildlife, recreation and viewing, preservation, and areas requiring more in-depth
local resource use planning (BC MoF 1989b). Each zone is subject to different management
strategies. For example, a community watershed could be zoned for timber production. but
only a certain percentage of the forest cover could be removed over one time period.
Recreation emphasis areas would be subject to landscape logging techniques. In wildlife
areas. some sections would be deferred indefinitely from logging.
The priman/ socioeconomic considerations relate to direct MoF responsibilities:
current license agreements with forest companies; local economic reliance on timber for jobs
and income: and projected demands for range and recreation. The analysis reports, options
reports. and plans do not quantify the social or economic benefits or costs expected to
accrue to people or communities in the TSA due to timber harvesting, silvicultural
investments. range expansion, reservation of wildlife habitat or other potential land uses. For
example. in the Robson Valley TSA draft plan, operability lines were based on the cost of
wood delivered to mills (BC MoF 1989b). It was decided that the socioeconomic
consequences would be disastrous if'operability lines were not extended to include timber
with significantly higher than historical delivered costs. The document did not list the actual
number of jobs potentially affected if the operability lines were not extended, or estimates of
changes to mill profitability if the lines were extended. In general, assumptions that changes

02
, .. ~I
in production levels of biophysical factors ~ timber, rangeland. wildlife habitat ~ will have
socioeconomic effects underlie TSA planning. However, esttmates of the predlcted etiects are
not quantified; for example, the number of jobs potentially affected by resewation of 10,000
ha for wildlife habitat. The possible effects of market demands and product prices on
socioeconomic variables are not discussed or documented. Furthtr; the location of assumed
G i
" ,
. ,
benefits or costs is not listed; for example, will jobs be created or lost in the TSA, or
elsewhere.
The land allocation and management alternative chosen during TSA planning is
important in determining the nature and quantity of biophysical and socioeconomic benefits
that will be produced in BC. Deciding how much land to apportion to various uses involves
consideration of a wide range of information, including timber and non-timber inventories, as
well as some economic and technological factors. However, the assumptions and analytical
techniques used to combine this information are not always explicit. Further, the
socioeconomic benefits and costs expected from a plan are not quantified. Therefore, the
socioeconomic trade-offs among various plans are not clear.
3.6 Summary
A wide range of information in manuals. classifications, and inventories is available to
assist biophysical planning in BC. Soils, minerals, terrain, fisheries, wildlife, outdoor recreation.
vegetation, representative landscape. and biogeoclimatic information, as well as the somewhat
dated CLI ratings are currently used. The BC government classifications and inventories
discussed are summarized in Table 3.3. The variety of information is due largely to the wide
range of resource planning and management objectives among government agencies, and the
diverse approaches and foci of resource specialists often working in relative isolation.
Most biophysical mapping and classification systems can be used at different scales for
either bropd land use planning, or management design. Resource inventories. however, are
mostly on scales designed for regional and sub-regional (watershed) land use planning. Few
83
inventories are adequate for current planning, an indication of the relatively recent recognition
for their need. Therefore, integrated resource planning often relies as much on experience
and intuition as on inventory data.
A notable gap in the l iFt of inventories used by resource planners in BC is
socioeconomic information. Resource specialists tend to base their analyses on biophysical
data. Socioeconomic benefits and costs are not specified, but are assumed to follow from
biophysical resource production.
This section has not included a comprehensive overview of resource classifications
and inventories used in BC. The diversity of interests and government agencies involved. as
well as the rapidly developing focus on biophysical resource inventories within government
agencies. made this an elusive and ultimately unreachable objective. However, this ovewiew
of biophysical classifications and inventories in BC highlights first, the diversity of iniormation
needed for resource planning; and second, the unlikely prospect, given limited human and
financial resources, that all desired information could be collected at any one time.
The Forest Resource Commission (FRC) in its interim report noted that at least 10 BC
agencies have resource inventories which are largely inadequate and incompatible (BC FRC
1990). This paper supports these conclusions. But to them it adds the following two points.
First, those involved in resource management administration in BC well know the limitations of
the existing information base, and the historic incompatibilities in data collection, compilation,
and storage. However. they have been working at rectifying these shortcomings, as the
MoCL Corporate Land Information Strategic Plan, and several inter-agency initiatives, such as
ecosystem sampling, habitat monitoring, and wildlife/ forestry research, show.
Second, the complexity of resource management precludes a conclusion that
inventories simply need to be completed. or made adequate. Both the number of interests
involved and the dynamic nature of biophysical and socioeconomic systems mean inventories
can never be complete. Restricted budgets mean some, not all, information bases could be
improved to comply more closely with current planning needs. Deciding on which resources

84
to concentrate will itself require planntng. Resource planning requires an inventory process or
program, not stmply inventories 01 static information. These ideas are expanded in the
following section which examines the advantages and limitations of biophysical analysis in
general, and of cunent practice in BC.
85
Table 3.3 Summary of biophysical classifications and inventories in British Columbia.
Resource Agencies Classifications/ Responsible Guidelines
Comments
Conservation BC MOP ' Representative Classifications are in public comment and review stage.
Fish habitat
Range
Recreation
Terrain
Timber
Fish and BC MoE
Wildlife Branch
Canada Dept of Fisheries and Oceans
BC MoF
BC MoF (also MoCL. MOT. and MOP)
BC MoE (with MoF and forest industry)
BC MoF
landscapes; Representative Features IBC MOP 1990rbl
Stream Information System (SISS) (Canada DFO 13891
Coastal Fish, Fwertv G u i d e l i m IBC MoUMOF 19171
Hlbit.1 Monit~ing Guidelines (BC MoUMoF 19901
Outdoor R u -
fication (Block nat ion Classi-
and Hignett 1982;
BC ORC 19901
Terrain Classi- fication System for BC (Kenk and H w e s 19881
F o m t Cover
Currently, 59 landscaper and 519 features. Criteria for evaluating candidate areas or features for protection to be developed.
SISS contains data on fish (population. life history). and management activities. Some data arc digitized: some available in Stream Summary Catalogues (Canada. DFO 19901
Salmonid species only.
m u c h to allow extrapolation of data from suneyed Emphasis on reconnaissance inventory ~1:5O,OOOl and
to v n r u n q c d streams. Pmridc general guidelines for logging operations. S t r e a m reacher classified according to topography. and presence of fish.
MoF has contract wt to develop a range classification Little inventory work done.
b a s e d on the biogeoclimatic system.
MoF responsible lor recreation on provincial forests I855 of BC). Recreation inventory updated during TSA plannang #e. every 5 years. Goal to have prorincial coverage by approx. 1995.
Mapping done by MoE. MoF. forest companies. and contractors. No central data repository. Approximately 1/3 of BC mapped at 1:50.000.
Many planning n d r for more detailed mapping.
Includes tree species, volume, age. and site quality ( h r c d on current stand. not site capability). Entire province is inventoried.

86
Table 3.3 (cont.)
Rc50UrCe Agencies Classifications! Comments
Responsible Guidelines
87
Ttmber tcon1.i
Wildlife BC MoE IBC MoF
assists1
Water BC MoE Water Mgmt. Branch IBC MoF assists1
Energy. BC MoEMPR Minerals
Data and BC MoCL Computer System Coordination
Biqeoclimatic Zone and subzone mapping 11:1OO,ooO lo 1:SOO.O001.
(Pojar et d. g u i k to ecosystem identification completed for
et d. 19081
1 ~ 7 ; hcl(innon province. Include m u u e m e n t interpretations - for regamtion): m e range and wildlife. primarily silricukml (site preparation and tree species
Biophysical Habitat Emphasis on uylulater. with interest expanding 10
Classification non-game species.
(De-chi cf d. Estimated SI8 million to complete 1:250.000
and Lea 19871 MoE and MoF cooperate in Integrated Wildlife
Habitat Monitoring Intensive Forestry Research program Guidelines IBC MoU MoF 19901
Water Qmli WQCs x t for l a substances; 8 forthcoming. Criteria IWQCI WQOs set fw 26 areas; 21 in preparation. Water Q u d i Obi+ctires CWQO) for resource development in watersheds.
Guiddines outline ~eneral planning considerations
Guidelines for Integrated Watershed Management Phnr completed Community Water- for 5 community watersheds; 5 in prqrers .
sheds (BC MoE 19801
Staffing and budget limitations preclude IWM planning in some areas.
Minerd Inventory 1:126,720 and 1:250,OW maps of k n a n mineral Mapping (MINFILE) occurrences. Computer database for about 50% Of
province IBC MoEMPR 19891. Updated yearly.
A s ~ . s m e n t Report Claim locations, exploration and development Index System (ARIS) activities. 1:126.720 and 1:250,wO maps and computer
D-mhi reconnaissance, and t:50,000 critical area mapping.
Regional geolqi- caI mapping. Geochemical w n e y data
Caporate Land Information Strategic Plan (CLISPI (BC M o C L 19891
database. Mineral Tenure Branch h a s 1:5O.O00 data On
claim locations. t:so,ooo mappins of bedrock geology and mineral potential. 1:250,OoO data on geochemical stream sampling. M a p and computer diskettes available for 40% of BC.
coal of CLISP is to develop policies. guidelines. and procedum to standardize resource data collection. analysis, and storage. lo facilitate information sharing among resource management agencies. CLlSP is conceptually developed. but not fully implemented.
Section 4 Evaluation
4.0 Introduction
The purpose of this section is to evaluate biophysical analysis as a technique for
assis!ing in !he allocation of land among competing uses. Five evaluative criteria are
described, and then applied to biophysical analysis in general. and to its current practice in
BC.
4.1 Evaluative Criteria
The following criteria for evaluating analytical methods were adapted from McAllister
(19801 and Bastedo and Theberge (1983):
1) Systematic: The steps taken and criteria used in progressing from issue
identification through data collection and decision making should be explicitly documented.
This is important to ensure other analysts can replicate the analysis, and that information and
decisions are defensible. Standardized data are also required to facilitate CIS analyses and
inter-agency planning.
2) Understandable: Information, concepts, and logic should be understandable and
easily communicated to decision makers and the public. TNs t in information is often a
function of how well understood it is.
3) Economically effective: The time and money spent collecting and analyzing
information should be justified by the degree to which planning and decision making are
facilitated.
4) Comprehensive: n le technique should incorporate all factors relevant to the issue
or problem.
5) Decision-oriented (applicable): Both the method and information should facilitate
decision making. The method should provide guidelines or rules on which to base
interpretations and decisions. information must be of the appropriate type and detail.

88
4.2 Evaluation
Corporate Land Information Strategic Plan by the BC MoCL (1989) may help to improve
coordination of data compilation.
Classification of land into homogeneous ecological or land capability units is also
frequently unsystematic. Lack of systematic classification criteria precludes replication Of
classifications, and understanding of how boundaries were located. For example, integrated
ecological classifications, such as for ecoregions (Demarchi 1990) and representative
landscapes (BC MOP 1990) attempt to delineate ecologically homogeneous areas as a basis fo!
wildlife habitat and ecosystem conservation planning respectively. The general biophysical
components considered are described (climate. soils. geology, topography, vegetation. .
I
89
wildlife). However, exactly how these components are combined to formulate biophysical
classes is not made explicit. Since there is no single widely accepted approach to biophysical
classication. future understanding of ecosystem delineations requires that criteria are explicit
Classification criteria for delineating area of homogeneous capability based OP
specific land use requirements are otten more explicit than for integrated classifications. For
example, the BC MoF Inventory Manual (BC MoF 1984) outlines how to classify
environmentally sensitive areas (ESAs) not suited to timber harvesting. Similarly. CLI
classifications provide definitions for specific land use capability ratings. Specification of
criteria for capability is easier than for ecosystem boundaries. since land use capability
normally hinges on one or a few, rather than many, variables. However. many capability
classifications are still based on broad qualitative criteria, leaving much up to the iudgement of
an analyst. More explicit criteria increase the ability to replicate the classification, and to
evaluate its accuracy in predicting use capability.
Finally, the way in which biophysical information is used in land use allocation or
management decisions is often inexplicit. An example discussed in this paper is the
delineation of operable land during TSA planning. BC MoF manuals outline ESA classification
methods, but provide no guidance on the extent to which ESAs should affect the timber
harvest. Deciding on appropriate €SA reduction factors relies on local knowledge, precluding
province- or region-wide prescriptions. However, while these locally defined reduction factors
are listed in TSA information reports, methods used in their derivation are not documented.
For broader decisions, such as among alternative TSA plans, the use of biophysical
information is again unsystematic. There are no guidelines outlining how land use decisions
should be documented; for example, the types of resource trade-offs to be listed, or
requirements for describing links between proposed land uses (timber harvesting, wildlife
habitat) and expected benefits (number or jobs or animals). Future use and evaluation of
information compiled or produced, and of decisions made during biophysical analyses is
difficult when methodologies are unknown.

91
4.2.2 Understandability
The general concept that biophysical capability is a basic requirement for the success
and sustainability of any land use is easily comprehended. For example. basing the BC
Agricultural Land Reserve on the biophysical capability of high quality agricultural land to grow
crops was easy to understand: successful farming requires good soil.
Information presented in simple map overlays can show clearly the location of
different resource values to help allocate land to appropriate uses, and highlight potential
conflict. Such techniques have been used in local resource use planning in BC. such as in the
Tsitika watershed, and during power planning in the US Pacific Northwest, to facilitate
involvement of the various stakeholders in highlighting resource values and evaluating land
use alternatives. Knowledge of potential conflict can help to focus planning and study efforts
in order to find solutions. Biophysical analysis therefore CM provide clear. comprehensible
techniques and rationale for some land allocation and management decisions, the involvement
of stakeholders in resource planning, and the setting of study priorities.
However, the process of classifying and evaluating biophysical resources, and of
deciding among competing land uses is sometimes complex and often not easy to
understand. For example, combining many variables onto one map, manipulating data
without clear reasoning, or presenting large quantities of data can hide information and cause
confusion rather than claiily a land use issue. Further, such lack of clarity might cause those
interests already skeptical with a proposed development, or with the planning process in
general, to become increasingly suspicious.
For decision makers and the public to understand the methodologies and rationale of
biophysical analysis, resource planners must communicate their techniques and tools. There is
some relatively easy to understand literature on some management tools used in BC, such as
the biogeoclimatic classification (Klinka et a/. 1990b). However, in general there is a lack of
information on how resource managers manipulate and use biophysical information. A
simplified description of land use allocation processes and techniques used would greatly
increase the comprehensibility of biophysical planning in BC.
4.2.3 Economic effectiveness
Biophysical analysis has good potential to increase the economic effectiveness of
planning and decision making. It can also assure that the fundamental requirements for
biophysical productivity or resilience to damage are met, and thereby help to avoid the
expense of land degradation and failed ventures. For example, an important consideration in
locating Tumbler Ridge for the Northeast coal project was to avoid areas subject to flooding,
thereby minimizing potential for property damage.
Initial biophysical analysis can improve planning effectiveness by focusing research and
decision making efforts. An overview of resource values can assist in identification of
potential conflict areas requiring more detailed study to devise special management
techniques. or allocate land to avoid conflict. For example, the proposed Robson Valley TSA
plan (BC MoF 1989b) outlined high conflict areas for intensive local resource use planning.
This allowed analytical resources to be utilized more cost effectively by concentrating them on
conflict areas. as opposed to disspersing them on the whole TSA. Another example is the
Whistler back country recreation study. Here. Careless (1990) showed that some land use
conilicts were unnecessary since requirements for different uses were met in different areas.
By outlining relatively conflict free areas for resource development, such studies can help
ensure development planning efforts and resources are used productively, and not diffused in
unnecessary conflicts.
For biophysical analysis to be economically effective, the information collected must
be relevant to the decision making problem and useable by planners and decision makers.
Development of biophysical inventories could be economically ineffective if: (I) unneeded
information is collected: (2) critical data gaps were ignored in favour of supplementing less
critical or already more adequate information: or (3) if data were collected but not interpreted
and entered into accessible databases in a format useful to resource planners and managers.

93
needed to maintain the population. the value of one habitat unit would be lower than if
habitat was limited. In an area of relatively scarce habitat, a unit of low quality may be critlcal
to the moose. Similarly, licensing an area for timber extraction when demand and prices do
not justify logging may result in economic losses. If binding contracts are entered that require
a certain annual timber harvest, and facilities are built to process the increased supply, regional
employment may suffer in the long run if the timber harvest is not sustainable. Information
on inherent biophysical capability does not recognize these l ink between land use value and
relative supply and demand.
The ability of land to support any land use economically. legally. and administratively
depends on non-biophysical attributes, such accessibility of markets, current land use or
tenure arrangements, and existing investment in infrastructure. The difference between
inherent biophysical capability and administrative suitability or economic feasibility is crucial in
planning. The ability for biophysical resources to support a use does not always justify the
expense of building new infrastructure or acquiring the land entailed in switching to another
use. For example. the BC ALR may have met physical objectives of protecting agricultural land
from irreversible non-agricultural development. But due to a lack of economic considerations.
its objective of encouraging actual agriculture use of ALR land remains unmet (Canada.
Environment 1978).
Socioeconomic and cultural implications of alternative land use plans should be an
important consideration in all planning processes involving public resources in BC. Currently.
these implications play a minor role in resource planning. For example, MoF Timber Supply
Area plans are concerned primarily with timber supply. as well as other biophysical resources
such as wildlife. range, and recreation. Changes in timber supply do affect socioeconomic
variables such as employment and public revenue. However, managing for timber supply and
assuming socioeconomic benefits will follow is a crude way of incorporating socioeconomic
concerns into resource management. More explicit inclusion of socioeconomic and cultural
considerations would clarify trade-offs involved in alternative land use allocations.

94 95
Land use decisions will be only as good as the information on vvhich they based.
~articulady on laqe time and space scales. current ecological knowledge severely limits
accurate prediction of all land use and management effects. Interactions among land units in
the form of material and energy transfer, and the ecological effects of dsturbances such as
fire, wind, insect infestations, and climate change'have only mently become the focus of
research in North America (Tumer 1989 Urban et al. 198n. Additional+, the effects of
alternative management practices on different biophysical resources has received limited
attention in BC. In some cases. conflicts may stem more from the way resource development
is practiced than from inherent incompatibilities between land uses. For example. different
timber harvesting techniques have the potential of resolving some conflicts between industrial
forestry and recreation, fisheries, or wildlife. Continued research into ecological processes.
and alternative management techniques is needed to improve our predictive and design
capabilities.
The extent of resource development in BC implies the need for extensive inventories
of many ecological features and processes to determine land capabiii and highlight potential
inter-resource conflicts. Whik classlfication and inventory methodologies exist lor most
resources, inventories are far from adequate. as the discussion in section 3 indicated. Fish and
wildlife habitat, temin, range. recreation, timber, and representative landscape and features
inventories. as well community watershed planning and water quality objective-setting all
require work Some inventories may need to be revised and greatly expanded in light of
changing values. For example. the wildlife inventory will need to include non-game species,
and the timber inventory made require reworking to incorporate old-growth values.
Continuously shifting priorities mean inventories will h a y s be partially out of date. But. as
we move from a focus on resource development to integrated management, compiling and
maintaining inventories of all resources will require more priority than in the past.
While work is required on resource inventories. it should be recalled that biophysical L
systems are dynamic, and that socioeconomic variables affecting resource planning change
rapidly relative to abilities to update inventories. The ability for remote sensing and aerial
technologies to facilitate resource data updating could be used to help keep biophysical
inventories in pace with biophysical and social change (eg. Morin et a/. 1986).
4.2.5 Decision orientation
A major deficiency of biophysical analysis is that it is not decision oriented. Results of
analyses consist of large quantities of information, but there are no clear or consistent rules to
guide decision making. For example, guidelines such as "maintain ecological sustainabiliv or
"avoid excessive soil erosion" do not tell decision makers how to interpret the data presented
to them. Decisions must be based on explicit criteria.
Decision rules must follow from social, political, and scientific discussion through
which resource use and mamgement issues, broad goals. and more specific quantitative
objectives are defined. Biophysical information does not in itself indicate the optimum land
allocation. For example. CLI ratings cannot be used to conclude that land rated as class 2 for
agriculture and class 3 for forestry is better allocated to agriculture. Evaluative ratings'for
different land uses are not comparable in this way. Decision rules must be based on values
that guide how biophysical information is used during decision making. If. tor example, a
value decision is made that good agricultural land is too valuable to convert to other uses, the
biophysical information can be used to locate and reserve such land.
Decision rules require quantitative or specific qualitative standards. In development of
the BC ALR, the decision rule was to set aside all CLI class 1 - 4 agricultural land. For many
S o c i a l issues. for example. maintaining biological diversity or choosing areas for representative
ecosystems. such rules do not yet exist. Furthermore, many issues involve a complex a m y of
biophrjical and socioeconomic considerations. Currently, there is no gened agreement on
decision rules or techniques for comparing the relative advantages of different land uses, or
for combining biophysical and other information into inherent capability, current suitability, or
socioeconomic feasibiliy ratings. If, lor example, society comes to view maintenance of

regional biodiversity as a goal. scientists may be able to develop measurement tools. and
therefore offer clear guidance to decision makers. However, neither consensus on biophysicd
objectives, nor on measurement techniques currently exist.
More specifically. decision orientation is low when the data scale is inappropriate to
specific decision making needs. Problems can result if small sole reconnaissance maps
(1:250,000) are used to locate forest harvest blocks. settlements, mills. or roads in any but the
broadest sense. Even 1:SO.OOO scale maps constitute only reconnaissance too ls useful for
focusing field work. In BC. there are many requirements for large scale (1:2,000 - 15,000)
data (BC MoCL 1989). Therefore, a complete inventory of the province at 1:250.000 or even
1:50.000 will not address all planning and decision making needs.
. .
97
Section 5. Conclusions and Recommendations
5.0 Introduction
This section begins with a summary of the evaluation of biophysical analysis developed
in the previous section. Several recommendations directed to government agencies and other
interests involved in planning the use and management of public resources are then
discussed.
5.1 Conclusions
The advantages of biophysical analysis to resource planning are:
1) It can assist land use planning by inventotying important resource values in a cost
effective manner, and by focusing resemh and decision making efforts. This requires that
only relevant data are collected, that collected data are interpreted and compiled in a format
useful to planners and decision makers. and that efforts are coordinated to avoid duplication,
and ensure &tical data gaps are filled.
2 ) I t s underlying principle, that land should be used according to its biophysical
capability, provides an understandable basis for land use decision making. This advantage
relies on simple. clear communication and classification techniques, and presentation of all
relevant data including decision criteria
The limitations and concerns relevant to biophysical analysis are:
1) I t s practice is often unsystematic. Decision criteria are frequently unclear or
unavailable, and data collection and classifications of different disciplines are not coordinated.
Standardization of data collection has been a priority in BC. However, work still remains to
ensure data interpretation and compilation are systematic.
2 ) Biophysical analysis does not incorporate all variables relevant to land use planning,
such as the relation between supply and demand, current land use and tenure, and

98
employment effects of different land allocations. Additionally, knowledge about the
biophysical processes that determine land use capabirii and the nature of intenctions among
uses as well as about the ecological effects of alternative resource management techniques, is
limited. For example, the long term effects of V ~ ~ O U S types of logging on soil productivity, or
the effects on wildlife of different timber harvest patterns over time and space, are uncertain.
3) Biophysical analysis tends to be data oriented rather than decision oriented. It
provides information for consideration. but little guidance on how to use the information for
land use decisions. The applicability of biophysical anaiysis to planning and decision making
also requires accessible, relevant information. and appropriately scaled data. Biophysical
analysis provides information to help determine the best way to meet stated social goals and
objectives. Biophysical information cannot dictate which goals or objectives to choose.
However, even given stated social values. there is no general agreement on decision rules or
techniques for compuing the relative advantages of different land uses, or for combining
biophysical and other information into evaluative ratings.
5.2 Recommendations
The following recommendations focus on ways of ensuring that land use planning and
biophysical analysis in BC are more systematic. understandable. economically effective,
comprehensive, and decision oriented.
1) Initiatives to coordinate and standardize resource data collection, interpretation. and
compilation, such as the Corporate Land Information Strategic Plan and ecosystem description
and habitat monitoring guidelines, should be encouraged.
Systematic data collection and processing will ensure data compatibility, facilitate data
compilation within a central, accessible database. and allow sharing of field work time and
resources among agencies. Standardization is particularly crucial in integrated resource
planning and management which involves many government agencies, industries. and other
.)
" . . ~~ . . .
99
interest groups. Additionally, accurate results from CIS analyses depend on standardized data.
Efforts should continue to ensure that all public and private interests involved in resource
management in BC participate in coordinated data management.
2) Biophysical analyses performed by or for government resource agencies should follow
systematic procedures. and include documentation of data sources. biophysical factors
considered, rules used for combining data into capability classifications, and assumptions
incorporated into recommendations and decisions. Guidelines manuals for these procedures
should be published.
Systematic procedures and documentation will allow both effective evaluation and
monitoring of implemented decisions, and use of the analysis in other planning processes.
3) The provincial government should provide clear information to facilitate understanding
by the public and resource planners of government agency responsibilities for resources. the
condition and extent of resource information. and research, planning, and management
initiatives.
The fundamental basis of biophysical analysis - outlining inherent land capabilities . is
generally understandable to decision makers and the public. However, administratively and
technically. biophysical resource management is a complex endeavor involving many interests
with both parallel and overlapping mandates. Land use planning and management discussions
will be hindered if the people and organizations involved are unclear about the existence,
location. or quality of resource information. Analytical work may be duplicated. Furthermore.
setting priorities for filling gaps in resource inventories (see recommendation 4) will be
difficult if the cumnt state of biophysical information is uncertain. The resource mapping
inventory of BC government resource information (BC MoCL 1990) should be more widely
publicized, and where possible. expanded to include private sector data. Compilation by the
Ministry of Crown Lands of a relatively simple overview of resource management

100
responsibilities and initiatives, a part of the Corporate hnd Information Strategy, would
inform and clarify land use discussions in BC.
4) Priorities should be set on a government-wide basis for biophysffal data gathering,
interpretation, and compilation. Efforts should be concentrated on resource mas. for
example, eco-tem conservation, range, and outdoor recreation, for Hmich classifications and
inventories are currently most limited, and therefore most needed to enable comprehensive
planning. Infomation gathering and processing priorities will help ensure that large gaps in
the resource data base are filled.
5) Resource information should be a d a b k in forms useful to decision makers and
managers. This will q u i r e that data of appropriate scak are collected. that raw data are
interpreted to correspond to land UK planning needs, and that this information is available
within an accessible computer network.
Compiling inventory information in a widely accessible geographic infomation system
will also facilitate more Comprehensive planning. Due to limited staff and financial resources,
many agencies are not represented at planning meetings. While computerized data do not
replace involvement of people, such data can facilitate consideration of a broad range of
resources in land use and management discussions.
6) Socioeconomic and cultural variables should receive more attention during land use
planning.
Biophysical analyxis provides a rquired basis for planning by outlining the inherent or
existing potential for land to sustain an aaivity. However, factors such as current
administrative or legal status; forecasted market demand. commodity prices, or resource
development costs; and employment effects of alternative land allocations, affect the
feasibility and advantage of pulzuing a given land use. More direct and where possible
i
. . ~~ ~ ~~
~~~ ~~ ~ ~ ~ ~~~
I ! 101
quantitative, expression of the links between social goals and objectiies. and production
targets for biophysical factors (timber. range, minerals, wildlife) would clarify trade-offs. and
help ensure social values are addressed. For example, sustaining timber growth at 75 million
m2 per year is, in itself. an inappropriate objective, unless this timber growth w i l l support
social goals and objectives, such as for employment or foreign trade. To ensure land planning
is based on a Comprehensive accounting of relevant factors. biophysical analysis must be
complemented by socioeconomic and cultural analyses.
7) Support for research into the ecological processes underlying biophysical resource
systems should continue.
Ecological knowledge forms the basis for determining both which biophysical factors
most affect the capability for land to sustain different activities, and how different land uses
affect each other. This knowledge is necessary to ensure that inventories provide a
comprehensive accounting~of the appropriate biophysical factors and processes; for example.
that site quality data in the timber or wildlife habitat inventory actually represent capability to
support timber or wildlife. Research is particularly needed in developing evaluative criteria for
natural area conservation. and understanding how the interactions among areas under
different land use or management activities affect both inherent capability and current
suitability for a land use. For example. research might provide insight into how timber harvest
panem affects probability of insect infestation, which will in turn affect the forest's suitability
for commercial timber extraction.
8 ) Biophysical analysis should be integrated into a broader land use planning process in
which goals and objectives for land and resources are determined through broad social
discussion. This discussion should include all affected interests, and be informed by scientific
research and analysis from a wide range of disciplines.
Biophysical analysis is only one technique needed for land planning. It can illuminate

102
resource values and thereby help to meet enunciated objectives. Biophysical information
cannot be used by itself for making decisions; biophrjical decision rules must be based on
prwiously defined social values.
9) Research into decision criteria and associated land evaluation techniques should be
encouraged.
For some currently important social issues such as b i o d i i i t y cowervation, protecting
representative ecosystems, and sustainable dwelopment..clear definitions are required from
which goals and objectives can be explicitly articulated. Additionally. techniques for
combining biophysical and other information to evaluate land for different uses are needed to
enable systematic M e s , and to facilitate alloution of land to meet stated objectives.
5.3 Final Comment
While biophysical analysis has limitations as a land use planning technique, its
importance should not be underestimated. Biophysical capability - that is, ability of land to
produce desired goods and services without being degraded - is a fundamental requirement
for all land use activities. Information on biophysical resources is a necessay. but not
sufficient input into land planning.
Biophysical analysis can benefit resource planning primarily by helping to focus human
and financial resources where they are most needed, by offering an understandable framework
for various stakeholders to desm'be and discuss respectively important resource values. and by
assuring land can suppon the proposed use. For these benefits to be experienced.
biophysical analysis must be pncticed systematically and economically. and must be
complemented with relevant socioeconomic and cultural information. Further, the ability for
biophysical analysis to assist in decision making will be improved both if goals and objectives
for resourcesae explicitly articulated, and decision techniques are developed through
mutually informed social discussion and scientific research.
103
Section 6. References
Bailey. Robert C. 1985. The factor of scale in ecosystem mapping. Environmental Management 9271-275.
Bailey. Robert C. 1987. Suggested hierarchy of criteria for multi-scale ecosystem mapping Landscape and Urban Planning 14: 313-319.
Bailey, Robert C. 1988. Problems with using overlay mapping for planning and their implications for geographic infomution systems. hvironmenlal Management 12(1): 11-17.
Bastedo. lames D. and john B. Theberge. 1983. An appraisal of interdisciplinary resource surveys (ecological land classification). Landscape Planning 10: 317-334.
Bastedo. lamie D.. 1. Cordon Nelson. and lohn B. Theberge. 1984. Ecological approach to resource survey and planning for environmentally significant areas: the ABC approach. Environmental Management M2): 125-134.
Beets, M.L. 1982. A wetland classification system that just might work pp. 29-35. In: H.A Stelfox and C.R Ironside (compikn) Landlwildlife integration No.2. Ecological Land Classification Series, No. 17. Ottawa, Ont.: lands Directorate, Environment Canada.
klknap. Raymond K and john C. Furtado. 1967. Three appmches to envimnmental resource analysis. Washington, D.C.: The Conservation Foundation.
British Columbia. 1979a Ministry of forest Act. Revised Statutues of BC. c. 272.
British Columbia 1979b. forest A c t Revised Statutues of BC. c. 140.
British Columbia. Forest Resources Commission (BC FRC). 1990. An interim repon of the British Columbia Forest Resources Commission. luly, 1990. 7 pp.
British Columbia Climatology Unit, Air Studies Branch. 1981. Climatic Capability Classification for Agriculture in British Columbia. APD Technical Paper 4. Victoria. BC.: Assessment and Planning Division. BC Ministry Of Environment. 23 pp.
British Columbia. Minisv of Crown Lands. Land Information Strategic Committee. (BC MoCL).
Columbia. Volume 1 Land information infrastructure. Victoria, BC. 77 pp. 1989. A corporate landinformation strategic plan for the government of British
British Columbia. Ministry of Crown Lands. Surveys and Resource Mapping Branch (BC MoCL). 1990. Resource mapping inventory. Victoria. BC. (microfiche).
British Columbia. Ministry of Crown Lands. M a p s BC (BC MoCL). no date. Catalogue of regional geochemical s u ~ c y map packages. Victoria, BC.
British Columbia. Ministry of Energy, Mines, and Petroleum Resources. Land Use Committee (BC MOEMPR). 1984. Land use policy of the Ministry of €nergy, Mines. and Petroleum Resources. Information paper. Vilctoria, BC. 27 pp.

104
British Columbia Ministry of Energy, Mines, and Petroleum Resources (BC MoEMPR). 1989a. British Columbia guidelines for mineral exploration. Victoria. BC. 61 pp.
British Columbia Ministry of Energy, Mines, and Petrokum Resources. Mined Resources Division. Geological Survey Branch (BC MoEMPR). 198%. .!+ontion in British Columbia 1988. Victoria. BC.
British Columbik Ministry of Energy, Mines, and Petmkum Resources (BC MoEMPR). 1990. British Columbia mineral land use policy. Mineral Market 2(2): 17, 25.
British Columbia Ministry of Environment. Resource AnaIy5is Branch. (BC MoE). 1977. Aquatic System hentory and Analysis. Victoria, BC. 39 pp. + appendices.
British Columbia Ministry of Environment (BC MoE). 1980. Guidelines for watched management of Crown lands used as community water supplies. Victoria, BC. 44 pp. + appendices.
British Columbia Ministry of Environment. Assessment and Planning Division (BC MoE). 7982. Biophysical resources of the Tahsish-Kwois. APD Bulletin 26. Victoria. BC. 11 3 pp.
British Columbia Ministry of Environment. Wildlife Bmch (BC MoE). 1989. Regional wildlife habitat map. East Kootemy (1:2S0,000). Victoria, BC.
British Columbia Ministry of Environment (BC MoE). 1990a Submission to the BC Forest Resources Commission.
British Columbia. Ministry of Environment. Resource Quality Section, Water Quality Bmch (BC MoE). 1990b. Schedule for reports on water q d i owlves and criteria. 9 luly. 1990.
British Columbia. Minishy of Forests Inventory Branch (BC MoF). 1981. Forest landscape handbook. Victoria, BC. 100 pp.
British Columbia. Ministry of Forests Inventory Branch (BC MoF). 1984. Forest inventory manual. Chapter two, *Environmentally sensitive areas." 129 pp.
British Columbia. Ministry of Forests. Research Branch (BC MoF). 1988a Biogeoclimatic Zones of British Columbia 1988. Victoria, BC. 1:2.000.000 map.
British Columbia.Ministry of Forests (BC MoF). 198Bb. Sunshine Coast TSA timber supply analysis information report. 44 pp.
British Columbia. Ministry of Forests (BC MoF). 1989a The analysis framework for integrated resource management (AFIRM). Basic concepts. Inventory Branch, BC MoF. Dralt report. 6 pp.
British Columbia. Ministry of Forests (BC MoF). 1989b. Draft resource management plan X1 for the Robson Valley Timber Supply Area. 85 pp.
British Columbia. Ministry of Forests (BC MoF). 1990a. Annual report of the Ministry of Forests for the fiscal year ended March 31, 7989. Victoria, BC. 91 pp.
British ColuGbia Minishy of Forests (BC MoF). 1990b. Sunshine Coast Timber Supply Area Options Report. 22 pp. + app.
105
British Columbia. Ministry of Forests, Ministry of Environment (BC MoFIMoE). 1990.
Victona. BC. Editoriai draft. Procedures for environmental monitoring in range and wildlife habitat management.
British Columbia. Ministry of Forests and Lands. Ministry of Environment (BC MoFUMoE). 1987. Coastal fisheries Foresrry Guidelines. Victoria, BC. 11 pp. + XI1 app.
Buchanan, R. 1. 1987. Water quality management in British Columbia: a summary. Water Quality Section, Water Management Branch, BC Ministry of Environment. Unpublished paper. 12 pp.
Campbell. David. 1990. Personal communication with range officer. Range Section, Integrated Resources Branch. BC Mini* of Forests. Victoria. BC. 2 October, 1990.
Canada. Agriculture Canada. Canada Soil Survey Committee, Subcommittee on Soil Classification (Canada Agric.). 1978. The Canadian System Of Soil Classification Agric. Canada Publication 1646. Ottawa: Supply and Services.
Canada. Agriculture Canada (Canada Agric.). 1988. Index of soil surveys in British Columbia 1988. Summary brochure.
Canada. Environment Canada (Canada Envir). 1972. Land classification for forestry. The Canada Land Inventory. Report NO. 4. Ottawa. Ont. 72 pp.
Canada. Environment Canada lands Directorate (Canada Envir.). 1981. Land capability CldsifiCdtiOn for wildlife - waterfowl. Summary Report. The Canada Land Inventory Report No. 16. Ottawa, Ont.
Canada. Lands Directorate. Environment Canada. Federal Environmetnal Assessment Review . Office (Canada FEARO). 1980. Ecological land survey guidelines for environmental impact analysis. Ecological Land Classification Series, No. 13. Ottawa, Ont. 42 pp.

106
Canada. Fisheries and Oceans. Habitat Management Division (Canada DFO). 1989. Federal/ provincial fish habitat inventory and information program, Steam information summy. system (SISS). Vancouver, BC. 6 p. brochure.
Canah Fisheries and Oceans. Habiit Management DiVision (Canada Dm). 1990. Federal/ provincial fish habitat inventory and information program, Steam summuy CdtdOgUeS. Vancouver. BC. 2 p. brochure
Canada. Indian and Northern Affairs (IANA). 1973. ,hnvfmnn7ef7td/ adp is : a review Of selected techniques. Document No. 1042OUC.
Careless. Ric. 1990. Tourism resource sustlinrMe dtvclopment plu\ning: th Whistler case study. Paper presented at the Globe '90 conference. Vancouver, BC. March 19-23. 1990. 14 pp.
Carlson, Glen. 1%. Personal communication with habitat protection biologist, fish and Wildlife, BC Ministry of Environment. Surrey. BC. 23 Is/. 1990.
Chambedin. T.W. 1980. Aquatic System Inventory fBiophysical Stream SurveysJ. APD Technical Paper 1. Victoria. BC.: Assessment and Planning Division, Ministly of Environment. 33 pp.
Chambedin. T.W. 1990. Personal communication with regional manager, Fish and Wildlife. BC Ministry of Environment. Smithes, BC. 12 October, 1990.
I ! i
I
i Christian, C.S. 1958. The concept of land units and land systems. Proceedings. Ninth Pacific
Science Congress. 20 74-81.
Christian, C.S. and C.A Stewart. 1968. Methodology of integrated surveys. pp. 233-280 In: UNESCO. Aerial Surveys and Integrated Studies. Paris.
Coombs, Donald B. and I. Thie. 1979. The Canada Land Inventory system. In: M w i n T. Beatty, Guy w. Peterson, and Lester D. Swindale (eds.) Planning the Uses and Management of Land. Madison, WI: Soil Science Sociev of America, Inc.
Curtis, Ruth L. 1988. Beyond reach - Council moves to protect prime fish and wildlife habitat. Northwest Energy News (Northwest Power Planning Council) 76): 7-10,
Daniels. Stwen E. 1987. Rethinking dominant use management in the forest-planning era. Environmental Law 17: 483-505.
Davis, J.R. 1984. A systematic approach to data collection for planning. lournal of Environmental Management 1 9 119-131.
Demarchi, D.A. 1982. The use of the biophysical program and capability concepts in mapping ungulate habitats in British Columbia pp. 44-53. h : H.A Stelfox and C.R. lronside (compilers) Landlwildlife integration No.2. Ecological Land Classification Series, No. 17. Ottawa. Ont: Lands Directorate, Environment Canada.
Demarchi. D.A. 1985. A regional wildlife ecosystem classification for British Columbia. pp.
Ecological Land Classification Series, No. 22. Ottawa, Ont.: Lands Conservation 11.19. In: H.A Stelfox and G.R. lronside (compiles) Landlwildlife integration No.3.
Branch, Canadian Wildlife Service, Environment Canada.
107
Demarchi, D.A. 199Oa. Biophysical habitat classification in British Columbia: a system ior mapping mountainous ecosystems. Draft paper prepared for the Landscape Approaches to Wildlife and Ecosystem Management Conference, UBC. M a y 1990. 14 PP.
Demarchi. D.A. 1990b. Personal communication with habitat classification specialist. Wildlife Branch. Ministry of Environment. Victoria, BC. 6 luly, and 10 September. 1990.
Uemarchl, D.A.. 8. Fuhr. B.A. Pendergrast. and AC. Stewart. 1983. Wildlife capability classification for British Columbia: an ecological (biophysicall approach for ungulates. MOE Manual 4. Victoria, BC.: Surveys and Resource Mapping Branch, Ministry of Environment.
Demarchi. D.A. and E.C. Lea. 1989a Biophysid habitat classification in British Columbia: an interdiscipiinanl approach to ecosystem evaluation. pp. 275-276. In: Dennis E. Ferguson. Penelope Morgan, and Fredreic D. fohnson (compilers). Proceedings - land classifications based on vegetation: applications for resource management. November
Forest Sewice. Intermountain Researth Station. 17-19. 1987. Moscow. Idaho. Cened Technical Report INT-257. Ogden, UT: USDA
Demarchi. D.A. and E.C. Lea. 1989b. An exampk of biophysical h a b i t mapping in British C O h b k . pp.271-274. In: Dennis E. Ferguson, Penelope Morgan, and Fredreic D.
applications for resource management. November 17.19, 1987, MOSCOW, Idaho. johnson (compikrs). Proceedings - land classifications based on vegetation:
Research Station. General Te&nid Report INT-257. Ogden. UT: USDA Forest Service. Intermountain
Demahi. D.A.. D. auk, and T. Lea. 1990. Ecological (biophysical) inventoryt, classification and mapping conducted by the British Columbia Ministry of Environment. Draft paper pmpared for WMlifdForestry Symposium, Prince George, BC. March. 1990. i o pp.
Department of Regional Economic Expansion (DREE). 1970. The Canada Land Inventory: objectives. scope. and organization. Report No. 1. Ottawa, Ont.
DriSCOll. Richard 5.. Daniel L. Merkel. David L. Radloff. Dale E. Snyder, and James S. Hagihara 1984. An Ecological Land Chsification for the United States. USDA Forest Service Miscellaneous Publication Number 1439. Washington. DC. 56 pp.
Eng, MarYin A.. R. Scott McNay. 1989. Development of a habitat assessment and planning took a problem reference and project working plan. Integrated Wildlife Intensive
41 PP. Foreshy Research IWIFR-40. Victoria, BC.: BC Ministries of Environment and Forests.
Eng. Mawin A.. R Scott McNay. and Rick E. Page. 1990. Integrated management of forestty and wildlife habitat with the aid of a CIS-based habitat assessment and planning tool. pp. 185-190. In: Forestly Canada. Making it work. Symposium Proceedings. CIS '90 Conference. Vancouver, BC. March 19-23, 1990.
Environment and Land Use Committee Secretatiat (ELUCS). 1976. ,Jerrain classification system. Victoria. BC.: Resource Analy%is Branch, BC Minisq of Environment. 56 pp.

108
Friend, A. 1979. Ecological mapping and socioeconomic statistics. pp.115-126. In: C.D.A. Rubec (ed.) Applications of ecological fbiophysicalJ land classification in Canada. Ecological Land Classification Series No. 7. Ottawa, Ont.: Lands Directorate. Environment Canada.
Ferguson, Bruce K 1981. The use of overlays in site quality mapping. &nadidn lourndl of Forest Research 11: 361-369.
Fontaine. lanet. 1990. Persond communication with coordinator, Land-Use Policy. Mined Resources Branch, Mined RCSOUKW Division, British Cdumbu Minlstly of Energy, Mines, and Petroleum Resources. Victoria. BC. 18 October, 1990.
Gelinas, R. 1986. Development and application of 'environomic units': hybrid nup units designed to integrate environmental and soao-economic data for land modelling. pp. 69-85. In: R. Gelinas, D. Bond. and B. Smit (eds.). Perspectives on land modelling. Montreal Que.: Polyxience Publications Inc.
Cotmark, Frank, Matti Ahlund, and h4ats O.C. Eriksson. 1986. Are indices reliable for assessing conservation value of natural-ueas? An aviur case study. Biological Conservation 38: 55-73.
Green, R.N., P.I. Courtin. K Klinka. R.I. Sko, and C.A Ray. 1984. Site diagnosis, tree species selection. and sbhburning guidelines for the Vancouver Forest Region. Land Management Handbook 8. Victoria, BC: BC Ministry of Fomts.
Glyzbowski. Alex. 1990. Personal communication with manager, resource planning. Tourism Planning and Resource Management, BC Minimy of Tourism, Victoria, BC. 17 luly, 1990.
Hall, George R. 1963. The myth and reality of multiple use forestry. Natural Resources loumal 3 (October): 276-290.
Hall. Peter. 1975. Urban and regional planning. New Yo&: Wiley. 312 pp.
Harrison, E.F. 1981. The managerial decision-making process. Boston M A : Houghton Mifflin. 390 pp.
Hawes. R.A.. D.S. Lacate. and LM. lavkulich. 1976. A landscape approach useful to regional land use planning. Victoria, BC.: Environment and Land Use Committee.
Herbig, R.A. 1986. Application of CIS technology to the HEP habitat layers model. pp. 211- 223. In: R Gelinas, D. Bond. and B. Smit (eds.). Perspectives on land modelling. Montreal Que.: Polyraence Publications Inc.
Hills. C. Angus, David V. Love, and Douglas S. Lacate. 1970. Developing a Better Environment Ecological land-use Planning in Ontario. Toronto, Ont.: Ontario Economic Council. 182 pp.
Hopkins. Lewis D. 1977. Methods for generating land suitability maps: a comparative evaluation. loumal of the American Institute of Planners 43: 386-400.
Howw. Don E. 1987. A terrain evaluation method for predicting terrain susceptible to post- logging landslide activity. Victoria, BC.: Recreational Fisheries Branch. Ministry of Environment. 38 pp.
109
Howes, Don E. 1990. Personal communication with sensitivity mapping specialist. Policy and
1990. Planning Branch. Ministry of Environment, Victoria, BC. 17 July and 11 September,
Howes, Don E. and E. Kenk (eds.) 1988. Terrain classification system for British Columbia (Revised edition). MOE Manual 10. Recreational Fisheries Branch. Ministry of Environment and Surveys and Mapping Branch. Ministry of Crown Lands. Victoria. BC. 90 PP.
.Inselberg, A€., K Klinka. and C. Ray. 1982. Ecosystems of MacMillan Park on Vancouver Island. Land Management Report 12. Victoria, BC: BC Ministry of Forests.
lakimchuk. RD. 1982. The "what" and "why of habitat inventory. pp. 7-15. In: H.A Stelfox and C.R. ironside (compilers) Landlwildlife integration No.2. Ecological Land Classification Series. NO. 17. Ottawa, Ont.: Lands Directorate, Environment Canada.
Kenk. E.. M.W. Sondheim. and H. Qwsnei. 1987. UIPAMP Vo/ume 7. BC Ministry of Environment and Parks Thematic Mapping Geognphic Information System. Data entry
purpose en*. MoEP Manual 10. Victoria. BC.: BC Ministry of Environment and Parks and validation procedures for soil. agricu/ture capability, surticial geology, and the all
fimminS. 1. p. 1979. Ec~bgic;lr classification of forest land m Canada and northwestem USA.: On the 1977 Vancower symposium. pp. 51-56. In: C.D.A. Rubec (ed.) .4Vka t iOnS Of CCOlOgiCd fbiophysical) land classification in Canada. Ecological Land Cl;lrsifica.tion Seriks No. 7. Ottawa, Ont.: hds Directonte. Environment Canada.
uink K. RN. Gmn. P.J. Couttin, and F.C. Nuudoder. 1984. Site diagnosis, tree species seleaion. and slashburning guidelines for the Vancouver forest Region. Land Magemem Handbook 25. Victoria, BC BC Ministry of Forests.
ainka. K.. RE. Carter, and M.C. Feller. 199Oa Cutting old-growth forests: ecological
loumal. 32 pp. considerations for forest regeneration. Paper submitted to Northwest Environmental
Klinka, IC. R.N. Gmn. D.V. Meidinger, and D.S. Mclennan. 1990b. Biogeoclimatic ecosystem classification. Victoria. BC: BC Ministry of Forests. 8 pp. brochure
Lacate. D. 5. tcompikr). 1969. Guidelines for biophysical land classification. Subcommittee on Biophysical Land Classification, National Committee on Forest Land. Department of Fisheries and Foreshy. Publication No. 1264. Ottawa, Ont.: Canadian Forestry Service.
Lea, E.C. 1964. Biophysical resources of the East Kootenay area: vegetation. Volume 1. MOE Technical Report 5. Ministry of Environment. Victoria, BC. 75 pp.
Lea, E.C. 1986. Vegetation of the Wells Gray study area. MOE Technical Report 21. Ministry of Environment. Victoria. BC. 96 pp.

117
110
Lewis, Peter. 1990. Personal communication with Head, Habitat Assessment Unit. Mabital
Victoria, BC. 11 September, 1990. Management Section. Recreational Fisheries Branch. BC Ministry of Environment.
Louie, R. 1990. Personal communication with head, Sdk Unit, Policy and PLanning Branch. British Columbia Minlstry of Environment. Victoria, BC. 12 October. 1990.
Luff, D.O. and P.M. Ojuma 1979. The value of & d o g i d (biophysiul) land classification in land use planning: an Alberta example. pp. 303-316 In: C.D.A. Rubec (4.) Applications of ecological (biophysical) land classification in Canada. Ecological h d Classification Series No. 7. Ottawa, Ont.: Lands Directorate. Environment Canada.
Luttmerding, H.A., D.A. Demarchi, E.C. Lea, T. vold, and D.V. Meidinger. 1990. Describing ecosystems in the field. 2nd ed. Victoria. BC.: BC Ministries of Environment and Forests.
MacKinnon, A., D. Meidinger, and K Klinlu. 1988. Use of the biogeoclimatic ecosystem classificaiton system in British Columbia Victoria. BC.: Research Branch, BC Ministry of Forests. Unpublished report. 45 pp.
McHarg, Ian L 1969. Design With Nature. Garden City. NY: The Natural Histov Press. 198 pp.
Maynard, Denny. 1979. Terrain capability for residential settlementc: summary report Victoria, BC.: Resource An+a Branch, BC Ministry of Environment. 61 pp.
Meidinger, Del. 1990. Personal communication with classification program comiator,
of Forests. Victoria, BC. 11 September, 1990. integrated Resource Maragement Section, Research Branch, British Columbia Ministry
Mitchell, W.R.. R.E. Green, D.Uoyd. F. Russell, W.Erickson, and D. Walken. 1981. identification and interpretation of ecosystems of the westem Kamloops forest region. First approximation. Land Management Handbook 2. Victoria, BC.: BC Ministry of Forests.
Morin, R.L.. E.E. Derenyi, R.W. Wein. and R Yazdani. 1986. Updating landscape data for
Celinas, D. Bond, and B. Smit (eds.). Perspectives on land modelling. Montreal Que.: natural resource management through LANDSAT imagery. pp. 167-171. in: R.
Polyrcience Publications inc.
Munn. Bill. 1990. Personal communication with park system planner. Planning and Conservation Setvices, British Columbia Ministry of Parks. Victoria. BC. 26 September, 1990.
Murray, Ted. 1990. Personal communication with recreation analysis specialist, Recreation Section, Integrated Resources Branch, British Columbia Minimy of Forests. Victoria, BC. 11 Speternber, 1990.
ORiordan. 1. 1976. Approaches to land use planning in British Columbia Presented to Pacific Northwest Regional Economic Conference. Victoria, BC. 5 pp. .
Outdoor Recreation Council of British Columbia (ORC). 1990. Keeping track of outdoof recreation. Brochure co-published with BC Ministy of Forests.
Pattison, Alan M. 1984. Biophysical land systems: an alternative approach for synthesizing biophysical data tor land use planning. Natural Resources Management Program Report 19. Bumaby. BC: Simon Fraser University. (unpublished)
Polar, I. (ed.) 1983. Forest ecology. pp. 221-318 In: Susan B. Watts ted.) forestry Handbook for M i s h Columbia. 4th ed. Vancouver, BC: The fares* Undergraduate Society, Faculty of Forestry, University of British Columbia.
Poiar, I., K. Klinka. and D. V. Meidlinger. 7987. Biogeoclimatic ecosystem classification in British Columbia. Forest kology and Management 22: 119-154.
Quin, A.L. 1979. The use of ecological infmation in settlement planning - a case example. pp. 335-W. In: C.D.A. Rubec (ed.) Applications of ecological (biophysical) land classification in Canada. Ecological Land Classification Series No. 7. Ottawa. Ont.: Lands Directorate, Environment Canada.
Rees. William E. 1979. The Canada Land inventory and its impact on regional planning. pp.
Federal State: the Canadian kprience. Montreal, Que.: McCtaw-Hill. 159-171. In: I. Robinson and W. Perk (eds.) Ur6an and Regional Planning in a
Rehten. Don. 1990. integrated watershed management planning. Victoria BC.: Water Management B m c h , BC Ministry of Environment. Unpublished report. 13 March, 1990.
Rowe, 1. S. 1979. Revised working paper on methodology/ philosophy of ecological land classification in Canada. pp. 23-29. Io: C.D.A Rubec (ed.) Applications of ecological (biophysicah land classification in Canada. Ecological bnd Classification Series No. 7. Ottawa, Ont.: h d s Directorate, Environment Canada
Rowe, J.S. 1980. The common denominator of land classification in Canada: an ecological approach to mapping. forestry Chronicle 5 6 19-20.
Rowe, I. Stan and John W. Sheard. 1981. Ecological land classification: a suwey approach Environmental Management: S(5): 451-464.
Runka. C.C.. and T. Lewis. 1981. Preliminary wetland managers manual ~ Carib00 Resource
Division. BC Ministry of Environment. Management Region. APD Technical Paper 5. Victoria, BC.: Assessment and Planning
&der. lune M. 1981. Biophysical resources of the fast Kootenay area: terrain. APD Bulletin 7. Victoria. BC.: Assessment and Planning Division. Ministry of Environment. 152 pp.
Rydtr, lune M. and Don E. Howes. 1984. T e e n information: a user's guide to terrain maps in British Columbia. Victoria, BC.: BC Ministry of Environment. 16 pp.
Schwab, 1. 1990. Personal communication with geomorphologist, Forest Sciences Section, British Columbia Ministry of Forests. Smithers, EC. 12 September, 1q90.
Smith, Paul C. R. and John B. Theberge. 1987. Evaluating natural areas using multiple criteria: theory and practice. €nvironmental Management 11(4): 447-460.
112
Sondheim. M. 1990. Personal communication with head, Ceomatics Unit, TopdGIS Section. Surveys and Resource Mapping Branch, British Columbia Ministry of C r o w lands. 18 October. 1990.
Sondheim. M. and K Sottie. 1983. User manual f o r the British Columbia Soil Information System. BCSlS Volume 1. Victoria, BC:. BC Ministry of Forests. 70 pp,
Spandli, Imre. 1990. Personal communication with manager, Inventory Section. BC Ministry of Forests. Victoria, BC. 10 September, 1990:
Sprout, P.N. 1978. The Canada Land Inventory period 1965-1975. pp. 183-191. In: K.W.C. Valentine, P.N. Sprout. T.E. Baker, and LM. Lavkulich (&.) The Soil Landscapes of British Columbia. Victoria, EC.: Resources Analysis EM&, BC Minishy of Environment.
Steen, 0. A. and A L Roberts. 1988. Guide to wetland ecosystems of the very dy montane interior Douglas-fir subzone eastern fraser Plateau variant (IDfb2) in the Cariboo forest Region. Land Management Report 55. Victor*Bc.: BC Ministry of Forests.
Steiner, Frederick. 1983. Resource suitabiiity: methods for analysis. Environmental Management 7(5): 401-420.
Thomae. Oliver. 1990. Personal communication with resource officer, Planning, British Colurnbm Minishy of Forests. Sqamiih, EC. 25 October, 1990.
Tsitika Planning Committee. 1978. Tsitika Watershed lntegrated Resource Plan. Summary Report. Victoria, BC. 52 pp. + app.
Tumer. Monica C. 1989. Landscape ecology: the effect of pattem on process. Annual Review of Ecological Systematics 20: 171-97.
Urban, Dean L.. Robert V. ONeill. and Hennan H. Shugan Jr. 1987. Landscape ecology Bioscience 37(2): 119-127.
Vink. A.P.A. 1983. Landscape Ecology and Land Use. London, England: Longman House. 264 PP.
Vold, Teje. 1977. Biophysical soil resources and land evaluation of the northeast coal study area, 1976-1977. Volume 1. Victoria EC.: Resource Analysis Branch. Ministry of Environment.
Vold. Teje. 1978. Reconnaissance biophysical soil inventories in British Columbia: a case study of the northeast coal area pp. 403411. In: H.C. Lund, Vemon 1. LaBau. P.F. Ffolliott. D.W. Robinson (tech. coords.) lntegrated Inventories of Renewable Natural Resources: Proceedings of a Workshop. General Technical Report GTR-AM-55. Fort Collins. CO.: USDA Forest Service. Rocky Mountain Forest and Range Experiment Station.
113
Walmsley, M. E. 1977. Biophysical land classification in British Columbia: the philosophy, techniques. and application. In: I. Thie and C. Ironside (eds.) Ecological (biophysical) classification in Canada. Ecological Land Classification Series NO. 7, onawa, Ont.: Lands Directorate, Environment Canada. pp. 3-22.
Walmsley, M. E., C. Utzig, T. Void, D. Moon. and I. van Bameveld. 1980. Describing ecosystems in the field. Technical Paper 2. British Columbia Ministry of Environment Resource Analysis Branch. Land Management Report 7. Victoria, BC.: BC Ministw of Forests. 224 pp.
Westman. Walter E. 1985. Ecology, Impact Assessment, and Environmental Planning. Toronto Ont.: john Wiley and Sons. pp. 201-268.
Whittaker, Robert H. 1978. Approaches to classifying vegetation. pp. 3-31. In: R.H. Whittaker (ed.) Classification ofplant communities. Hague: Junk.
Wiken. E.B. and C. Ironside. 1977. The development of ecological (biophysical) land classification in Canada. Landscape Planning 4: 273-282.
Wiken, E.B. 1986. Terrestrial ecozones of Canada. Ecological Land Classification Series No 19. Ottawa Ont.: Lands Directorate. Environment Canada. 26 pp.
Vreeswijk. W.I. 1985. Integrated resource management plan implementation: The Tsitika watenhed example, British Columbia Natural Resource Management Program Report Number 25. Bumaby. BC.: Simon Fraser University. (Unpublished). 128 pp. .