Conceptualizing%2
48
1 www.Quant.KU.edu Conceptualizing and Modeling Contextual Effects in Longitudinal Studies Todd D. Little University of Kansas Director, Quantitative Training Program Director, Center for Research Methods and Data Analysis Director, Undergraduate Research Methods and Data Analysis Minor Member, Developmental Psychology Training Program www. uant. .edu Colloquium presented 02-19-2010, University of Arizona
-
Upload
robert-lanza -
Category
Documents
-
view
213 -
download
1
description
http://mcclellandinstitute.arizona.edu/sites/mcclellandinstitute.arizona.edu/files/Conceptualizing%20and%20Modeling%20Contextual%20Effects.pdf
Transcript of Conceptualizing%2

1www.Quant.KU.edu
Conceptualizing and
Modeling Contextual Effects
in Longitudinal StudiesTodd D. Little
University of KansasDirector, Quantitative Training Program
Director, Center for Research Methods and Data Analysis
Director, Undergraduate Research Methods and Data Analysis Minor
Member, Developmental Psychology Training Program
www. uant. .edu
Colloquium presented 02-19-2010, University of Arizona

2www.Quant.KU.edu
Context

3www.Quant.KU.edu
Context
• The circumstances in which an event occurs; a setting.
–The set of features that influences the performance or the
outcome of a process
• The conditions that are relevant to an event, fact, etc.
– From contextus a putting together
– From contexere to interweave, braid
– circumstances, times, conditions, situation, ambience, frame of reference, background, framework, relation, connection
• Ecology
–The relationship between organisms and their environment.

4www.Quant.KU.edu
Context

5www.Quant.KU.edu
Social Ecology

6www.Quant.KU.edu
Physical Ecology

7www.Quant.KU.edu
Personal Ecology

8www.Quant.KU.edu
Contexts as• Direct effects
– Varies at the level of the individual and influences the individual directly
• Indirect (mediated) effects– Varies at the level of the individual and influences the individual
through its effect on an intervening variable
• Mediating effects– Distal context influences proximal context which influences the
individual
• Moderating effects– Interactive influences that change the strength of any of the above
effects
– Discrete vs. Continuous
• Hierarchically nested effects– Larger units of context that can have direct, indirect, mediating, or
moderating effects.

9www.Quant.KU.edu
Types of Variables

10www.Quant.KU.edu
Context and Measurement
• We should measure persons and contexts well
–Measures should be appropriate for the construct
• Contexts should be quantified (borrow from sociology, for example)
• Developmental measures should address change
– The tragic legacy of test-retest reliability
– Measures and analyses should not be haphazard
• Avoid: ―Hey, this new method is cool, let‘s try it on this data?‖
• Question -> Measurement -> Statistical Model
• Avoid short forms of existing scales (use intentionally missing design)– (‗allure of the bloated specific‘ idea)
• Develop or modify to make sure the measurement tool is right
• Take time to refine and pilot measures (even well-established ones).
"Whatever exists at all exists in some amount. To know it
thoroughly involves knowing its quantity as well as its quality"
- E. L. Thorndike (1918)

11www.Quant.KU.edu
Context of Measurement
• Homotypic vs. heterotypic expressions across ages
– e.g., Aggression
• Surface-structure vs. deep-structure of behavior
– e.g., helping as resource-directed behavior
• Typological (subgroups) differences
– Identification issues and procedures
• Muthen‘s m-Plus, Nagin‘s Proc Traj, Bergman‘s Sleipner
• n-adic (dyadic, triadic, etc.) overlay on all of the
various modeling approaches
– e.g., SRM, APIM, Siena

12www.Quant.KU.edu
Context of Change
• Interindividual differences vs. Intraindividal differences
–Ergodicity conundrum
• Associations (within and between time)–Covariances and Correlations vs. Regressions
–Direct and Indiect effects
• Auto-regressive vs. Cross-lagged
– 1st-order vs. 2nd-order
–Linear vs. non-linear
• Means and Variances
• Mediation vs. Moderation vs. Additive Effects
• B = ƒ(age) vs. Δ = ƒ(time)

13www.Quant.KU.edu
Context of Growth
• Most growth trends are locally linear
–May have insufficient range to model nonlinear trends
• Shouldn‘t blind us to the nonlinearities that will likely exist
• Most growth trends are globally nonlinear
–Remember this when:• Invoking theory
• Describing trends in data
• Drawing conclusions and implications
–Design studies to capture appropriate forms of nonlinearity• Quadratic or cubic forms
– Measure well before and well after the ‗bend‘
– Use optimal design logic when planning measurements
• Piecewise linear (or nonlinear) models

14www.Quant.KU.edu
Context of Time
• Age in years, months, days.
• Experiential time: Amount of time something is experienced
– Years of schooling, length of relationship, amount of practice
– Calibrate on beginning of event, measure time experienced
• Episodic time: Time to and from onset of a life event
– Toilet trained, driver license, puberty, birth of child, retirement
– Early onset, on-time, late onset: used to classify or calibrate.
– Time since onset or time from normative or expected occurrence.
• Measurement Intervals (rate and span)
– How fast is the developmental process?
– Intervals must be equal to or less than expected processes of change
– Measurement occasions must span the expected period of change
– Cyclical processes
• E.g., schooling studies at yearly intervals vs. half-year intervals

15www.Quant.KU.edu
Transforming to Episodic Time

16www.Quant.KU.edu
Transforming to Accelerated Longitudinal

17www.Quant.KU.edu
Context of Validity in Longitudinal Work
• Threats to Validity
– Maturation
• In pre-post experiment effects may be due to maturation not the treatment
• For longitudinal studies, maturation is the focus.
– Regression to the mean
• Only applicable with measurement error
– Instrumentation effects (factorial invariance)
• Testable
– Test-retest effects
• Use intentionally missing data designs to estimate and mitigate
– Selection Effects
• Sample Selectivity vs. Selective Attrition, both are mitigated by MAR assumption and modern missing data imputation.
• Age, Cohort, and Time of Measurement are confounded
– Sequential designs attempt to unconfound these.

18www.Quant.KU.edu
The Sequential Designs

19www.Quant.KU.edu
Design
Independent
Variables Confounded Effect
Cohort-
Sequential
Age &
Cohort
Age x Cohort Interaction is
confounded with Time
Time-
Sequential
Age & Time Age x Time Interaction is
confounded with Cohort
Cross-
Sequential
Cohort &
Time
Cohort x Time Interaction is
confounded with Age
What‘s Confounded?

20www.Quant.KU.edu
Context and Temporal Design
• Changes (and causes) take time to Unfold
• The ability to detect an effect depends on the
measurement interval
• The ability to model the shape of the effect
requires adequate sampling of time intervals.
• The ability to model the optimal effect
requires knowing the shape in order to pick
the optimal (peak) interval.
• Lag within Occasion: Lag as Moderator
analyses (Selig, Preacher, & Little, under review)

21www.Quant.KU.edu
Types of Change Effects

22www.Quant.KU.edu
• Panel models– Focus on stability / prediction of interindividual differences (rank order), at
expense of information about means
– Commonly used & well understood
– Can use with 2 time points. Is more complex/informative with 3 or more
• Growth curve models– Focus on intraindividual stability / change, as well as interindividual
variability in intraindividual growth
– Need at least 3 time points (for nonsaturated linear model). Easy to accommodate more or various numbers across people
– Typically says nothing about direction of influence
• P-techniques– Focus on moment-to-moment covariation within an individual
– Need at least 1 person, but many time points.
– Can combine results across people to drawn nomothetic generalizations
– Introduction of lag (dynamic P) allows conclusions of temporal primacy
Three General Techniques of
Longitudinal Modeling

23www.Quant.KU.edu
Mediator vs. Moderator
• Mediator is the middle-person, letter carrier,
delivery agent
–X predicts M, X predicts Y, and M predicts Y
–M to Y accounts for X to Y via (X-to-M-to-Y)
–Mediation still occurs when X to Y is necessary, and
X-to-M-to-Y is still significant.
• Moderator is an interaction!
–It Depends. If A then B, if not A then C
–Depending on B, A to C changes in strength
• Mediator is the carrier, Moderator is the changer

24www.Quant.KU.edu
Pieces of the Mediation Puzzle
(Y)(X)
C
(the regression weight or
total effect of X on Y)
(Y)
(M)
(X)
a b
C’
(the semi-partial regression weight or
direct effect of X on Y, controlling for M and the X to M
indirect path to Y via M)

25www.Quant.KU.edu
Depicting Moderation in Path Diagram
(Y)
(M)
(X)(The magnitude of this path varies by level of the
moderator)
Note: Although this is how we draw the model in our
diagram, the actual model fit is different (involves
predicting Y from X, Moderator, and X-M interaction).

26www.Quant.KU.edu
Four General Approaches to Mediation
• Baron & Kenny‘s Causal Steps approach
– Do a series of regressions and determine if C’ is < C.
– No good test of significance of the change and it‘s the wrong parameter!
• Product of Coefficients approach (Sobel test)
– Determine if ab is significant.
– Relies on normal theory standard errors
• SEM estimation of indirect effect
– Determine if ab is significant
– Uses ML estimation to determine effect; use chi-squared difference test
for assessing significane
• Bootstrap approach
– Determine if ab is significant
– Relies on resampling to determine the appropriate standard error to test
for significance

27www.Quant.KU.edu
Advice for testing mediation
• Do pilot work to detect the time interval that must elapse for X
to have an effect on M and for M to have an effect on Y.
• Waves of assessment should be separated by these
empirically determined time intervals.
• Use latent variables; measurement error can wreak havoc on
indirect effects.
• Specify the developmental time frame over which the
mediation supposedly unfolds.
• Represent this time period in its entirety.
• Use the overall indirect effect, not just time-specific indirect
effects, to represent the mediation effect of interest.

28www.Quant.KU.edu
Advice for testing mediation
• Ensure that the measurement (CFA) model fits well.
• If it does not, we cannot trust anything else.
• Test longitudinal factorial invariance
• If the latent variables do not have the same
interpretation over time, there is little point in
proceeding.
• Test equilibrium with the CFA model
• Constrain latent variable variances and
covariances to be equal over time and evaluate
loss of fit (or not).

29www.Quant.KU.edu
Cole and Maxwell (2003)
• Include lagged X → Y effects and correlated residuals at each occasion (not pictured).
• Permit lagged residuals to intercorrelate to account for shared method variance.
X1 X2 X3 X4 X5x x x x
m m m m
a a a a
Y1 Y2 Y3 Y4 Y5y y y y
b b b b
M1 M2 M3 M4 M5

30www.Quant.KU.edu
The minimum design: Half Longitudinal
If the assumption of stationarity can be made (and this is a big ―if‖), the
minimum design for mediation is:
Advantages:
1. Explicitly models change
in both Y and M
2. Permits experimental
manipulation of both
X and M.
X1 X2x
m
a
Y1 Y2y
b
M1 M2

31www.Quant.KU.edu
Interrelationships of Positive Affect,
Possession of Ability, and Unknown Causes
Positive
Affect (3)
1*Unknown
causes
(2)
Agency
(1)
1* 1*
32www.Quant.KU.edu
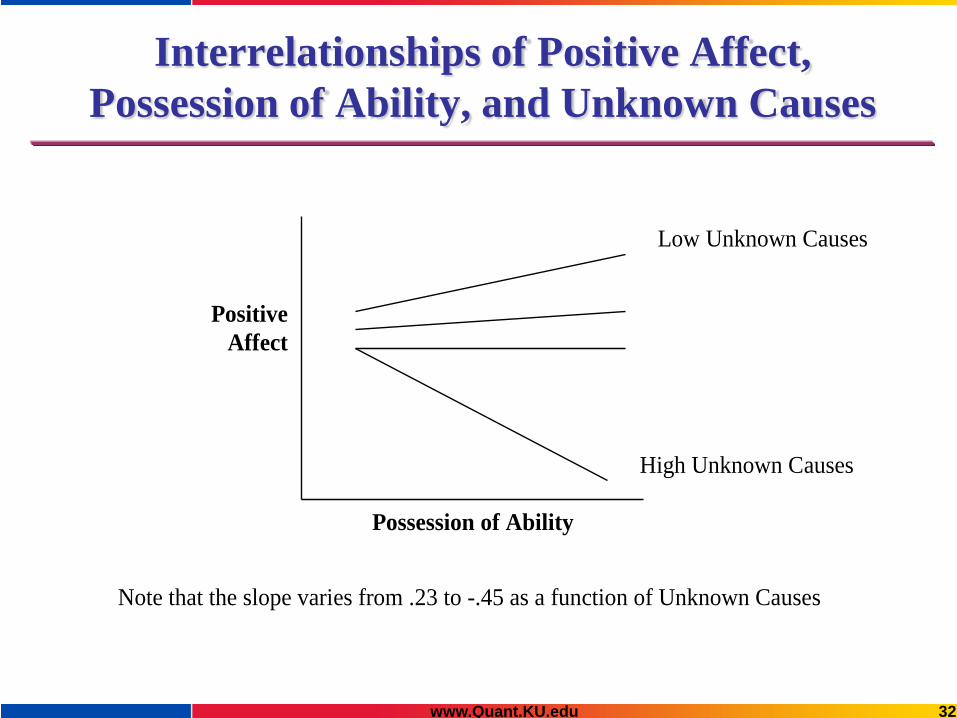
Positive
Affect
Possession of Ability
High Unknown Causes
Low Unknown Causes
Note that the slope varies from .23 to -.45 as a function of Unknown Causes
Interrelationships of Positive Affect,
Possession of Ability, and Unknown Causes

33www.Quant.KU.edu
Orthogonalizing: Step 1
Interact = MainEffect1*MainEffect2;
AgeSQ = age*age;
Proc REG data=work;
Model Interact = MainEffect1 MainEffect2;
Output out=work r = _Interact_;
Proc REG data=work;
Model AgeSQ = age;
Output out=work r = _AgeSQ_;
Note that r is the residual which equals:
r = observed y – predicted y

34www.Quant.KU.edu
Use Residuals in Analyses: Step 2
Proc REG data=work;
Model DV = MainEffect1 MainEffect2 _Interact_;
Proc REG data=work;
Model DV = age _AgeSQ_;
Note _Interact_ is uncorrelated with the two main
effects and _AgeSQ_ is uncorrelated with age. This
was done in step 1

35www.Quant.KU.edu
Extension to SEM: Step 1
• Compute all possible interactions among indicators
– V14 = V1*V4
– V15 = V1*V5
– V16 = V1*V6
– V24 = V2*V4
– V25 = V2*V5
– V26 = V2*V6
– V34 = V3*V4
– V35 = V3*V5
– V36 = V3*V6

36www.Quant.KU.edu
Extension to SEM: Step 2
• Orthogonalize all interaction terms
with respect to each main effect
indicator
• For example:
Proc REG data=work;
Model V14 = V1 V2 V3 V4 V5 V6;
Output out=work r = _V14_;

37www.Quant.KU.edu
Interrelationships of Positive Affect,
Possession of Ability, and Unknown Causes
Positive
Affect (3)
1*Agency
(1)1*
1 2 3
1*Unknown
causes
(2)
4 5 6
Interaction
(4)1*
1*4 1*5 1*6 2*4 2*5 2*6 3*4 3*5 3*6

38www.Quant.KU.edu
The Residual Matrix
e
e e
e e e
e e
e e e
e e e e
e e e
e e e e
e e e e e
V14 V15 V16 V24 V25 V26 V34 V35 V36
V14
V15
V16
V24
V25
V26
V34
V35
V36

39www.Quant.KU.edu
Interrelationships of Positive Affect,
Possession of Ability, and Unknown Causes
Positive
Affect (3)
1*Agency
(1)1*
1 2 3
1*Unknown
causes
(2)
4 5 6
Interaction
(4)1*
1*4 1*5 1*6 2*4 2*5 2*6 3*4 3*5 3*6
-0.28
(Z=8.27)
(13.5.Moderation)

40www.Quant.KU.edu
i2
School
A
C1 C2 C3
School
B
C4 C5 C6
School
C
C7 C8 C9
i1 i3 i4 i5 i6 i13 i14 i15 i16 i17 i18
i7 i8 i9 i10 i11 i12 i19 i20 i21 i22 i23 i24
C4 C6
C6C4
Katherine Maysn‘s Example of
Nested Data Structures

41www.Quant.KU.edu
Negative Individual, Positive Group

42www.Quant.KU.edu
Positive Individual, Negative Group

43www.Quant.KU.edu
No Individual, Positive Group

44www.Quant.KU.edu
No Group, Mixed Individual
45www.Quant.KU.edu
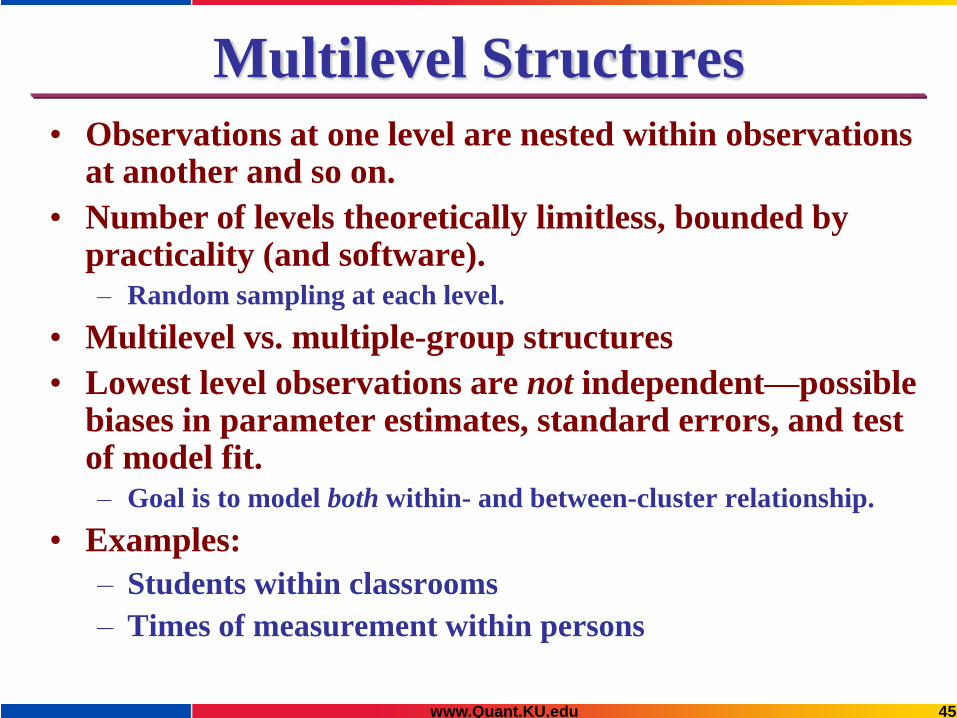
Multilevel Structures
• Observations at one level are nested within observations at another and so on.
• Number of levels theoretically limitless, bounded by practicality (and software). – Random sampling at each level.
• Multilevel vs. multiple-group structures
• Lowest level observations are not independent—possible biases in parameter estimates, standard errors, and test of model fit.– Goal is to model both within- and between-cluster relationship.
• Examples:
– Students within classrooms
– Times of measurement within persons

46www.Quant.KU.edu
www.Quant.KU.edu
• Info and Registration links for our annual
Summer Institutes
– (SEM, Longitudinal SEM, Multilevel,
Categorical, Social Network with Siena,
Statistical Analysis with R, Meta-analysis, IRT).
• KUant Guides and other online resources

47www.Quant.KU.edu
• Card, N. A., & Little, T. D. (2007). Longitudinal modeling of developmental processes. International Journal of Behavioral Development, 31, 297-302– Introduction to special issue, but first part identifies basic issues in longitudinal
modeling and then points you to the innovations covered in the special issue.
• Little, T.D. (2011). Longitudinal SEM. New York, NY: Guilford Press– My forthcoming book on longitudinal modeling.
• Little, T. D., Card, N. A., Preacher, K. J., & McConnell, E. (2009). Modeling longitudinal data from research on adolescence. In R. Lerner & L. Steinberg (Eds.)., Handbook of Adolescent Psychology (4th Ed.). Wiley.– Provides a broad summary of the three classes of techniques
• Card, N. A., Little, T. D., & Bovaird, J. A. (2007). Modeling ecological and contextual effects in longitudinal studies of human development. In T. D. Little, J. A., Bovaird, & N. A. Card (Eds.), Modeling contextual effects in longitudinal studies (pp. 1-11). Mahwah, NJ: LEA– Introduction to our book that points you to a lot of really great chapters
covering many of these issues in detail
Recommended readings

48www.Quant.KU.edu
• Cole, D. A., & Maxwell, S. E. (2003). Testing mediational models with longitudinal data: Questions and tips in the use of structural equation modeling. Journal of Abnormal Psychology, 112, 558-577.– Convincing argument for testing mediation over time rather than concurrently
• Little, T. D., Card, N. A., Bovaird, J. A., Preacher, K. J., & Crandall, C. S. (2007). Structural equation modeling of mediation and moderation with contextual factors. In T. D. Little, J. A. Bovaird, & N. A. Card (Eds.), Modeling ecological and contextual effects in longitudinal studies (pp. 207-230). Mahwah, NJ: Lawrence Erlbaum Associates.– The first half of this chapter describes testing mediation in SEM and the
second half covers moderation
• Maxwell, S. E., & Cole, D. A. (2007). Bias in cross sectional analysis of longitudinal mediation. Psychological Methods, 12, 23-44.– If the first paper wasn‘t convincing, then this one surely should get the point
across
Recommended readings