Conceptual Design of a Single-Aisle Turboelectric ... Tuesday presentations Final/19...
34
Conceptual Design of a Single - Aisle Turboelectric Commercial Transport with Fuselage Boundary Layer Ingestion Dr. Jason R. Welstead Aeronautics Systems Analysis Branch NASA Langley Research Center James L. Felder Propulsion Systems Analysis Branch NASA Glenn Research Center 1 Presented by: Michael D. Patterson Aeronautics Systems Analysis Branch, NASA Langley Research Center
Transcript of Conceptual Design of a Single-Aisle Turboelectric ... Tuesday presentations Final/19...

Conceptual Design of a Single-Aisle Turboelectric Commercial Transport with Fuselage Boundary Layer Ingestion
Dr. Jason R. WelsteadAeronautics Systems Analysis Branch
NASA Langley Research Center
James L. FelderPropulsion Systems Analysis Branch
NASA Glenn Research Center
1
Presented by: Michael D. Patterson
Aeronautics Systems Analysis Branch, NASA Langley Research Center

Concept Germination
2
SUGAR VOLT SUGAR Freeze N3X
AIAA-2013-4402

Concept Description
• STARC-ABL: Single-aisle Turboelectric AiRCraft with Aft Boundary Layer propulsion
• Conventional single aisle tube-and-wing configuration– Includes N+3 technologies for 2035 timeframe– Mach 0.7, 3500 nm design range, 900 nm economic mission– Used Refined SUGAR mission as reference– 154 passengers (dual class)
• Twin underwing mounted N+3 turbofan engines with attached generators
• Partially turboelectric• Rear fuselage ducted, BLI electrically driven propulsor
3
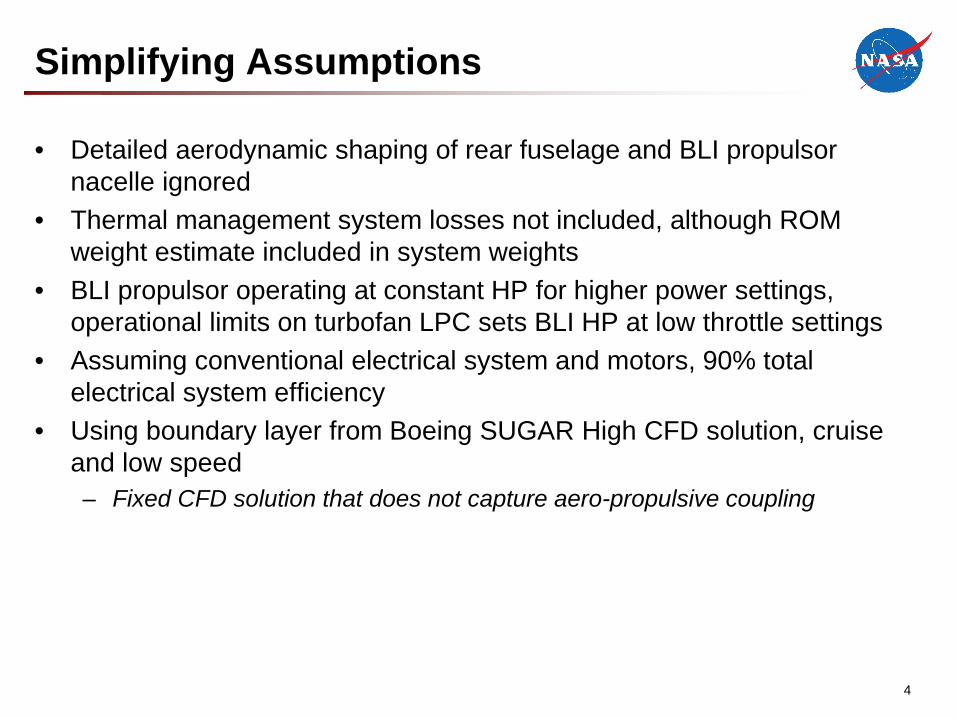
Simplifying Assumptions
• Detailed aerodynamic shaping of rear fuselage and BLI propulsor nacelle ignored
• Thermal management system losses not included, although ROM weight estimate included in system weights
• BLI propulsor operating at constant HP for higher power settings, operational limits on turbofan LPC sets BLI HP at low throttle settings
• Assuming conventional electrical system and motors, 90% total electrical system efficiency
• Using boundary layer from Boeing SUGAR High CFD solution, cruise and low speed– Fixed CFD solution that does not capture aero-propulsive coupling
4

• Two turbofan wing engines and the tailcone thruster sized at the top of climb (TOC) or the rolling takeoff (RTO) condition, which ever is the more limiting
• Turbofan engines are based on the Georgia Tech public domain version of the GE hFan with the motor replaced by a generator and total engine resized to balance power and meet thrust requirements
• 750V normal conducting (non-cryo) electrical system
Propulsion System Design Assumptions
5
GT Turbofan PR/Tt EfficiencyFan 1.45 93.9%
LPC 1.45 92.0%
HPC 27.9 90.6%
HPT 2800 R 92.5%
LPT 1690 R 94.1%
TailconeFan 1.25 95.7%
Electrical /TMS Comp.
Spec Pwr / Spec Wt
Efficiency
Generator 8 hp/lb 96%Motor 8 hp/lb 96%Inverter 10 hp/lb 98%Cable 3.9 kg/m 99.6%Circuit Protection
33 kg/MW
TMS 0.68 kW(th)/kg
Specific power targets for currently funded 3 year research efforts

Boundary Layer Modeling• For each height in the boundary layer the mass-averaged MN and Pt were
calculated• Increasing the amount of ingested boundary layer increases the captured
momentum deficit in the wake– The power required to capture the entire boundary layer was excessive – 3500 hp at TOC captures 46% of the boundary layer which captures 72% of the
momentum deficit
6
0.0
0.2
0.4
0.6
0.8
1.0
0 0.2 0.4 0.6 0.8 1
Nor
mal
ized
Bou
ndar
y La
yer H
eigh
t
Integrated Pt and MN Ratio to Freestream
Ratio of Mass Avg Pt & MN of Inlet Flow to Freestream Vs Normalized BL Height
PtRatio (1525in) PtRatio (1560 in) PtRatio (1595in)
MNratio (1525in) MNratio (1560in) MNratio (1595in)
0.0
0.2
0.4
0.6
0.8
1.0
0.0 0.2 0.4 0.6 0.8 1.0Frac
tion
of B
ound
ary
Laye
r Cap
ture
d
Fraction of Total Momentum Deficit Captured
Fraction of Momentum Deficit Captured Vs Fraction of Boundary Layer Captured
Baseline System

Propulsion System Performance
7
N3CCBaseline
Turbofans*Generator Turbofans*
STARC-ABLBLI Tailcone
PropulsorTotal Propulsion
SystemTOC RTO TOC RTO TOC RTO TOC RTO
Thrust** 6800 34 920 4060 22 780 3210 5560 7260 28 350
TSFC 0.441 0.2922 0.3875 0.3032
Thrust/hp 0.64 0.99 0.60 0.86 0.92 1.6 0.72 0.96OPR 58 51 58 49.6 1.25 1.08BPR 11.3 11.9 6.4 6.9 14.4 13.3
Fan PR/%Nc 1.45/100%
1.39/ 93.2%
1.45/100%
1.49/100%
1.25/100%
1.08/62.1%
LPT Power (hp) 5960 19 490 4940 14 840
Fan Power (hp) 5320 17 705 3005 12 900 3500 3500
Gen/Motor (hp) 3870 3870 3500 3500* The thrust and horsepower values for the baseline and generator turbofans are the total of both turbofans.** The aircraft thrust requirements are TOC Fn = 6800 lb, RTO Fn = 28,340 lb

Total Propulsion System Weight
Subsystem Units Baseline Turbofan
STARC-ABL Propulsion System
Non-electrical lb 16 750 10 370Electrical lb - 1990TMS lb - 910Total lb 16 750 13 270
8
• STARC-ABL propulsion system adds 2900 lb of additional electrical and TMS equipment
• Additional non-electrical weight of the BLI fan and nacelle• Weight reduction (mainly in the fan and nacelle) of the underwing generator
turbofans off-sets the weight of STARC-ABL additional equipment• Baseline and generator turbofan weights calculated using Georgia Tech
methodology that relies mainly on: • Regression fits based on corrected flow rates and number of stages• Fixed dry engine to nacelle weight ratio
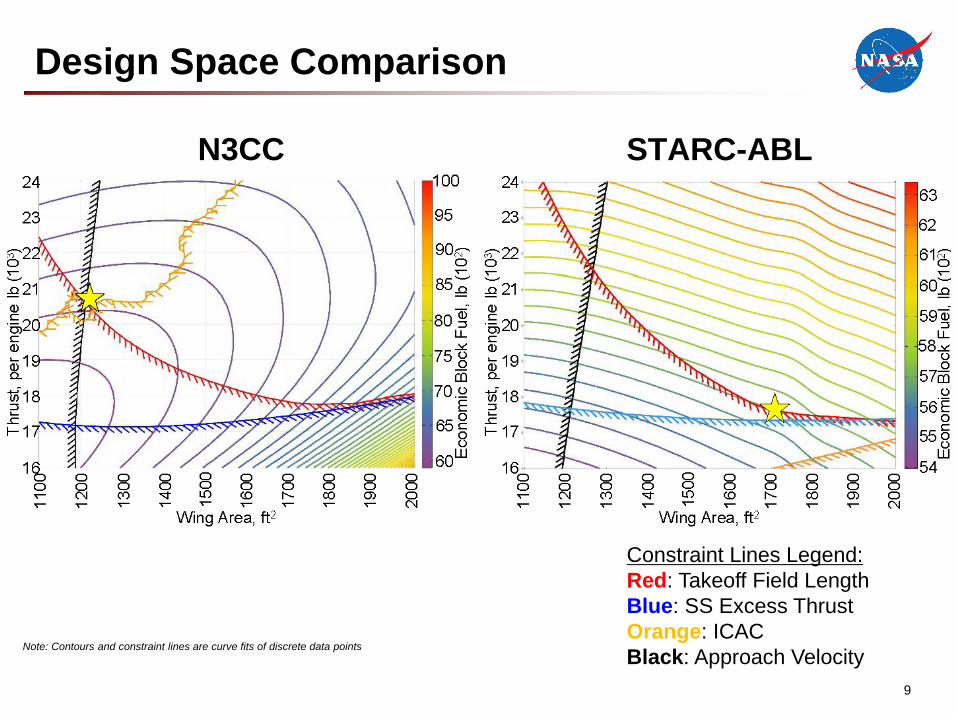
N3CC STARC-ABL
9
Constraint Lines Legend:Red: Takeoff Field LengthBlue: SS Excess ThrustOrange: ICACBlack: Approach Velocity
Design Space Comparison
Note: Contours and constraint lines are curve fits of discrete data points

Quick Summary of Results
• Significant reductions in system fuel burn– 15% reduction in start of cruise (SOC) TSFC– 7% reduction in economic mission block fuel– 12% reduction in design mission block fuel
• Fuselage propulsor details– Only bottom 46% of boundary layer ingested– BLI propulsor placed at most aft fuselage position– Driven by an all-electric motor, nominally operating at 3500 HP– Electrical system modeled assuming ~10% total system losses
• System details– Reduction in turbofan weight offsets additional weight of motors, electrical
system, and additional propulsor– STARC-ABL architecture fundamentally changes the design space shape
10
Source of System Level Benefits
• Modeled benefits– Reduced turbofan size and weight– Decreased turbofan nacelle wetted area– Increased propulsive efficiency in rear fuselage propulsor from ingested low-
momentum flow– Initial estimate shows a reduction in the total propulsion system weight
• Not modeled benefits– Reduction in wake dissipation, only secondary effect (MIT D8 experimental
results)– Aerodynamic shaping of rear fuselage and nacelle producing forward axial
force (thrust) due to static pressure field– Ability of motor and generators to vary load and speed on turbomachinery
for enhanced efficiency and operability across flight regime
11

System Sensitivities
12
System Sensitivities
13
System Sensitivities
14
-15%
-13%
-11%
-9%
-7%
-5%
-3%
-1%
-100% -80% -60% -40% -20% 0% 20%Perc
ent c
hang
e in
TSF
C fr
om T
urbo
fan
% Change from Baseline Design
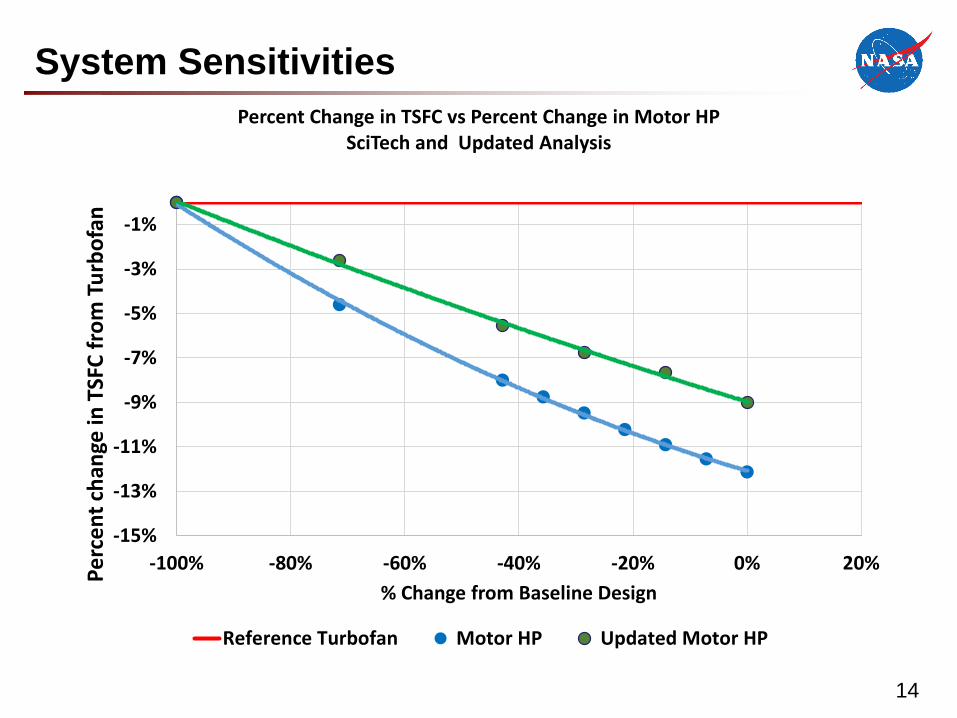
Percent Change in TSFC vs Percent Change in Motor HP SciTech and Updated Analysis
Reference Turbofan Motor HP Updated Motor HP

System Sensitivities
15
-30%
-25%
-20%
-15%
-10%
-5%
0%
5%
10%
-100% -80% -60% -40% -20% 0% 20%% P
ropu
lsio
n Sy
stem
Wei
ght C
hang
e fr
om
Turb
ofan
% Change from Baseline Design
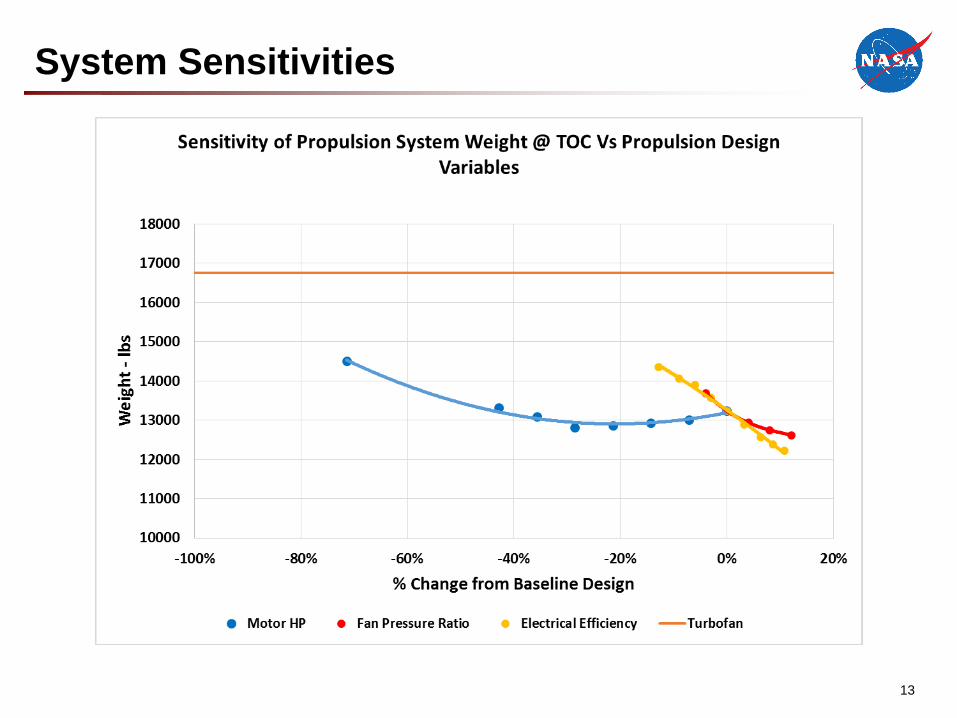
Percent Change in System Weight vs Percent Change in Motor HP For SciTech and Updated Analysis
Reference Turbofan Motor HP Updated Motor HP

Conclusions
• STARC-ABL concept provides a significant fuel burn reduction even with conservative technology and electrical efficiency assumptions
• Ingesting the entire boundary layer requires an excessive amount of horsepower while offering little additional benefit, ingesting only the lowest momentum portion of the boundary layer provides the greatest benefit
• The rear fuselage BLI propulsor fundamentally changes the shape of the design space compared to a similar technology conventional tube-and-wing configuration, especially by removing the initial cruise altitude capability (ICAC) constraint
• Drastic reduction in underwing turbofan size and weight, while meeting TOC and RTO thrust constraints, offsets the additional weight of the rear fuselage propulsor architecture
16
Future Work
• Aerodynamic shaping of the rear fuselage and nacelle to optimize flow and capture any synergistic aerodynamic effects (thrust)
• Design the thermal management system and include better estimates of weight and efficiency losses
• Optimization of configuration, propulsion system, and throttle schedule simultaneously for increased performance benefits– Increased degrees of freedom allow for decoupling of core components
allowing each to perform in their optimal region– Will provide better guidance on throttle scheduling through the different
regions of the flight envelope– Propulsion system can be designed in conjunction with entire configuration
17

Questions?
18

1919

Propulsion System Concept Description
• Normal conduction (non-superconducting) electrical system• Constant 3500 HP to BLI propulsor except at low system throttle settings• Moderate BLI propulsor fan pressure ratio of 1.25• Conservative N+3 technology assumptions on propulsion architecture• BLI propulsor ingests lower portion of boundary layer
20
62"
111"
24"
90"
81"
Not drawn to scale
System Sensitivities
• Three system sensitivities performed– BLI propulsor design horse power– Total system electrical transmission efficiency– BLI propulsor fan pressure ratio
• Top of climb (TOC) condition shown• Original baseline turbofan design shown as a single orange line
21
Design Space Exploration
• Explored design space shape through contour plot– Created matrix of ~1500 data points by varying wing area and thrust– Contour plots generated to visually understand how the design space
changes due to STARC-ABL architecture– Contours colored by 900 nm mission block fuel– Constraint lines indicating infeasible designs
• Red: Balanced takeoff field length, must be less than 8190 feet• Black: Approach velocity, must be less than 140 knots• Orange: Initial cruise altitude capability (ICAC), must be greater than 5
feet above top of climb (TOC) altitude• Blue: Second segment climb thrust requirement, must be greater than 0
pounds of excess thrust
22
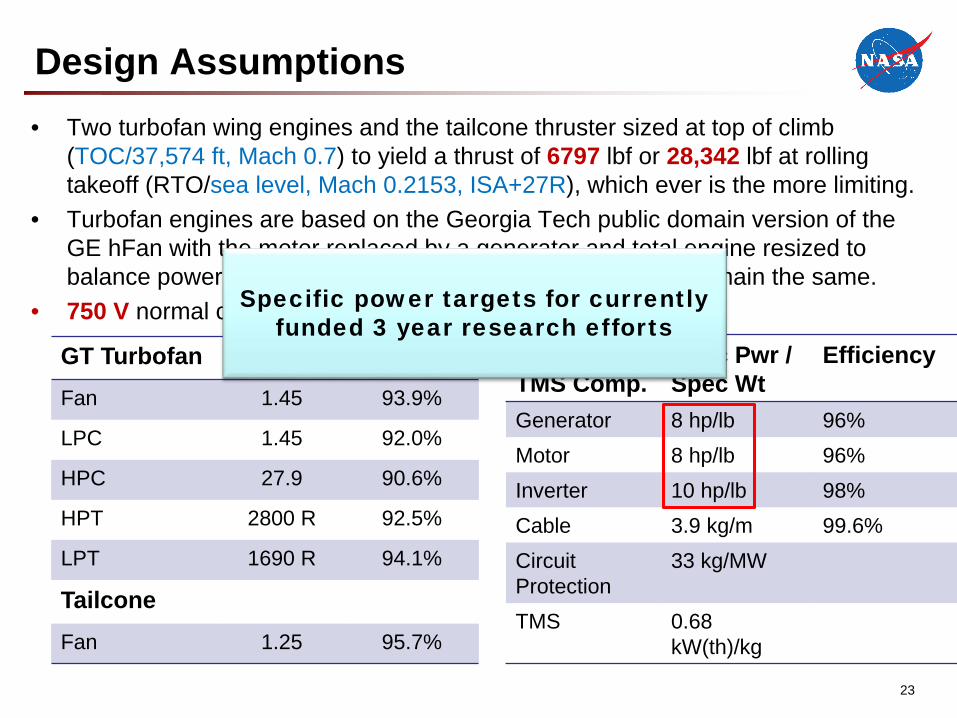
Design Assumptions• Two turbofan wing engines and the tailcone thruster sized at top of climb
(TOC/37,574 ft, Mach 0.7) to yield a thrust of 6797 lbf or 28,342 lbf at rolling takeoff (RTO/sea level, Mach 0.2153, ISA+27R), which ever is the more limiting.
• Turbofan engines are based on the Georgia Tech public domain version of the GE hFan with the motor replaced by a generator and total engine resized to balance power and meet required thrust. Other technology remain the same.
• 750 V normal conducting (non-cryo) Electrical System
23
GT Turbofan PR/Tt EfficiencyFan 1.45 93.9%
LPC 1.45 92.0%
HPC 27.9 90.6%
HPT 2800 R 92.5%
LPT 1690 R 94.1%
TailconeFan 1.25 95.7%
Electrical /TMS Comp.
Spec Pwr / Spec Wt
Efficiency
Generator 8 hp/lb 96%Motor 8 hp/lb 96%Inverter 10 hp/lb 98%Cable 3.9 kg/m 99.6%Circuit Protection
33 kg/MW
TMS 0.68 kW(th)/kg
Specific power targets for currently funded 3 year research efforts
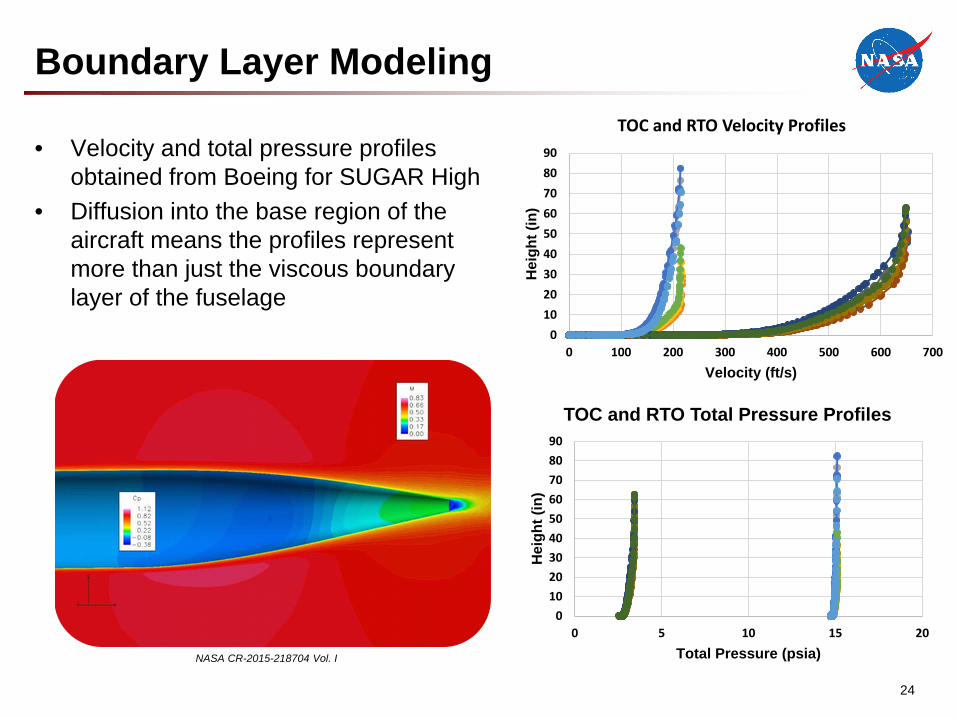
Boundary Layer Modeling
• Velocity and total pressure profiles obtained from Boeing for SUGAR High
• Diffusion into the base region of the aircraft means the profiles represent more than just the viscous boundary layer of the fuselage
24
0102030405060708090
0 100 200 300 400 500 600 700
Hei
ght (
in)
Velocity (ft/s)
TOC and RTO Velocity Profiles
0102030405060708090
0 5 10 15 20
Hei
ght (
in)
Total Pressure (psia)
TOC and RTO Total Pressure Profiles
NASA CR-2015-218704 Vol. I
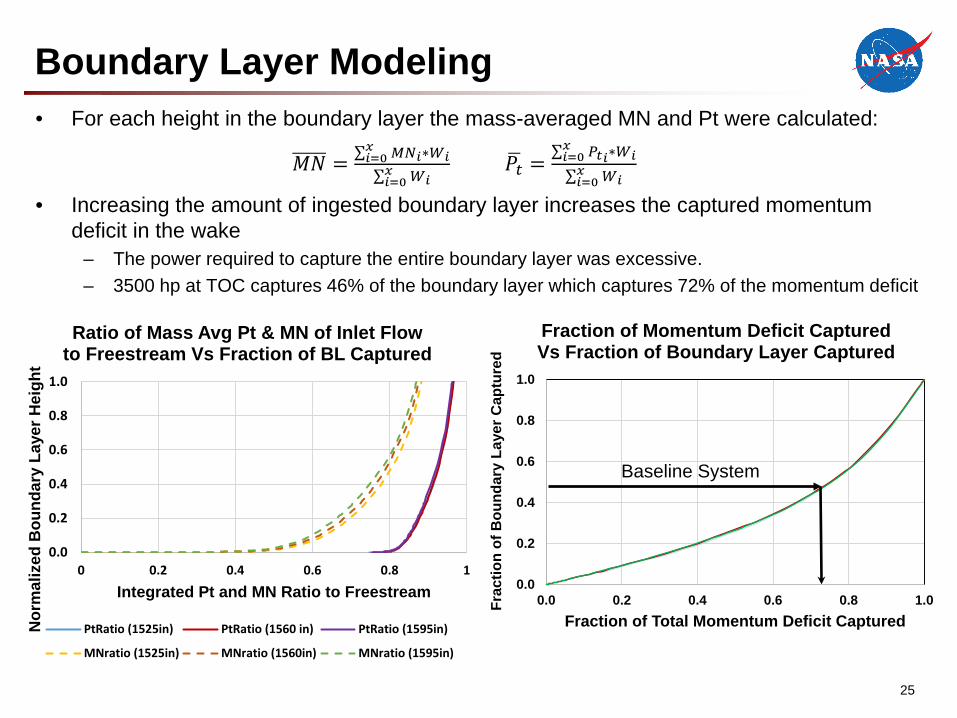
Boundary Layer Modeling• For each height in the boundary layer the mass-averaged MN and Pt were calculated:
𝑀𝑀𝑀𝑀 = ∑𝑖𝑖=0𝑥𝑥 𝑀𝑀𝑀𝑀𝑖𝑖∗𝑊𝑊𝑖𝑖∑𝑖𝑖=0𝑥𝑥 𝑊𝑊𝑖𝑖
�𝑃𝑃𝑡𝑡 =∑𝑖𝑖=0𝑥𝑥 𝑃𝑃𝑡𝑡𝑖𝑖∗𝑊𝑊𝑖𝑖∑𝑖𝑖=0𝑥𝑥 𝑊𝑊𝑖𝑖
• Increasing the amount of ingested boundary layer increases the captured momentum deficit in the wake
– The power required to capture the entire boundary layer was excessive. – 3500 hp at TOC captures 46% of the boundary layer which captures 72% of the momentum deficit
25
0.0
0.2
0.4
0.6
0.8
1.0
0 0.2 0.4 0.6 0.8 1
Nor
mal
ized
Bou
ndar
y La
yer H
eigh
t
Integrated Pt and MN Ratio to Freestream
Ratio of Mass Avg Pt & MN of Inlet Flow to Freestream Vs Fraction of BL Captured
PtRatio (1525in) PtRatio (1560 in) PtRatio (1595in)
MNratio (1525in) MNratio (1560in) MNratio (1595in)
0.0
0.2
0.4
0.6
0.8
1.0
0.0 0.2 0.4 0.6 0.8 1.0Frac
tion
of B
ound
ary
Laye
r Cap
ture
d
Fraction of Total Momentum Deficit Captured
Fraction of Momentum Deficit Captured Vs Fraction of Boundary Layer Captured
Baseline System

System Analysis Results• Comparison of N3CC and the STARC-ABL Concepts
26
Parameter Units N3CC STARC-ABL % ChangeMTOW lb 129 260 133 370 3.2%
OEW lb 73 690 80 480 9.2%
Wing Area sq. ft 1220 1680 37.7%
Thrust (total, SLS) lb 41 020 35 280 -14.0%
AR - 11.02 8.29 -24.8%
SOC CL - 0.59 0.45 -23.7%
L/D @ SOC CL - 21.4 22.3 4.2%
SOC TSFC lb/hr/lb 0.437 0.373 -14.6%
900 nm Block Fuel/seat lb/seat 39.53 36.86 -6.8%
3500 nm Block Fuel lb 22 050 19 350 -12.2%

Propulsion System Non-electric Size and Weight
BLI Propulsor
Fan Diameter 81 in
Nacelle Max Diameter 90 in
Nacelle Length 111 in
Bare Weight 1370 lb
Nacelle Weight 700 lb
Total Pod Weight 2070 lb
27
62"
111"
24"
90"
81"
Generator Turbofan
Fan Diameter 52 in
Nacelle Max Diameter 58 in
Nacelle Length 115 in
Bare Engine Weight 2510 lb
Nacelle Weight 1630 lb
Total Pod Weight 4140 lb
Baseline Turbofan
Fan Diameter 70 in
Nacelle Max Diameter 78 in
Nacelle Length 156 in
Bare Engine Weight 4460 lb
Nacelle Weight 3910 lb
Total Pod Weight 8370 lb

Propulsion System Electrical System Properties
28
Component Assumption Efficiency Size WeightElectric Motor 8 hp/lb 96% 3500 hp 440 lbInverter 10 hp/lb 98% 3500 hp 350 lbGenerator (2) 8 hp/lb 96% 2@1937 hp 480 lbCable 2 x 93' @ 750 V / 1926 amps
3.85 kg/m 99.6% 1.44 MW 480 lb
Circuit Protection 0.5 * Cable Wt 240 lbThermal Management System (ROM)
0.68 kW(th)/kg 279 kw(th) 910 lb
Total Electrical + TMS 2930 lb
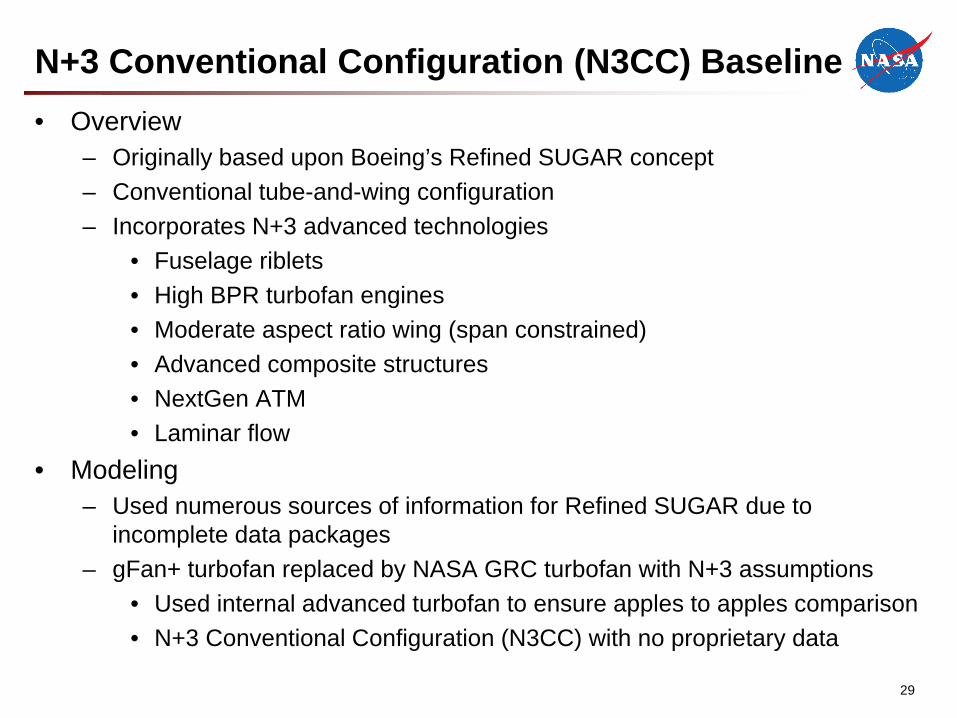
N+3 Conventional Configuration (N3CC) Baseline• Overview
– Originally based upon Boeing’s Refined SUGAR concept– Conventional tube-and-wing configuration– Incorporates N+3 advanced technologies
• Fuselage riblets• High BPR turbofan engines• Moderate aspect ratio wing (span constrained)• Advanced composite structures• NextGen ATM• Laminar flow
• Modeling– Used numerous sources of information for Refined SUGAR due to
incomplete data packages– gFan+ turbofan replaced by NASA GRC turbofan with N+3 assumptions
• Used internal advanced turbofan to ensure apples to apples comparison• N+3 Conventional Configuration (N3CC) with no proprietary data
29
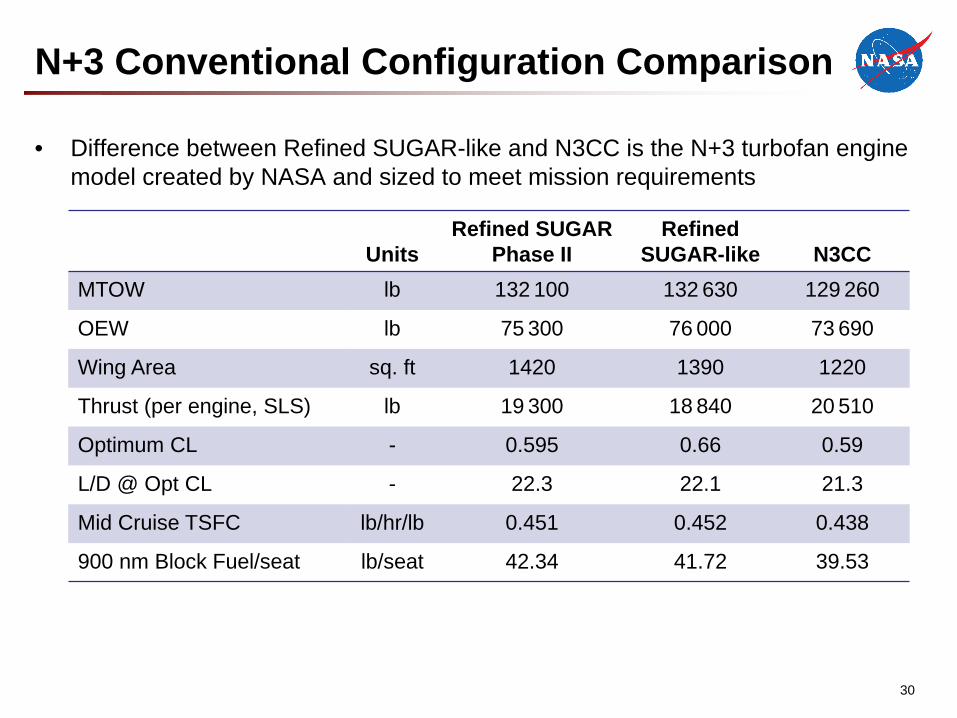
N+3 Conventional Configuration Comparison
• Difference between Refined SUGAR-like and N3CC is the N+3 turbofan engine model created by NASA and sized to meet mission requirements
30
UnitsRefined SUGAR
Phase IIRefined
SUGAR-like N3CCMTOW lb 132 100 132 630 129 260
OEW lb 75 300 76 000 73 690
Wing Area sq. ft 1420 1390 1220
Thrust (per engine, SLS) lb 19 300 18 840 20 510
Optimum CL - 0.595 0.66 0.59
L/D @ Opt CL - 22.3 22.1 21.3
Mid Cruise TSFC lb/hr/lb 0.451 0.452 0.438
900 nm Block Fuel/seat lb/seat 42.34 41.72 39.53

Refined SUGAR Data Sources
• Boeing SUGAR Phase I Final Review Presentation (April 20, 2010)• Boeing SUGAR Phase I Final Report (NASA CR2011-216847)• Boeing SUGAR Phase II Final Report (NASA CR2012-217556)• Boeing SUGAR Phase II Final Update Presentation (Sept. 24, 2014)• gFan+ like engine deck from Georgia Tech (via Doug Wells)
31

Conclusions
• Top of Climb TSFC was sensitive to all three rear fuselage propulsor design variables, motor horsepower, fan pressure ratio, and electrical efficiency, but slopes of FPR and electrical efficiency were greater
• Total propulsion system weight is highly sensitive to electrical efficiency and rear fuselage propulsor fan pressure ratio
• Reducing the motor HP by up to 40% has little effect on propulsion system weight, but the TSFC increases
32
Acknowledgments
• This work was funded under the Systems Analysis & Integration element of the Advanced Air Transport Technologies project. The authors would like to thank Mark Guynn and Bill Haller for their support of this work, and Chris Droney of Boeing Research and Technology for the fuselage CFD data that enabled this study.
33

Overview
• Concept description• Quick summary of results• N+3 Conventional Configuration
– Description of baseline– Comparison of baseline to Refined SUGAR concept
• Simplifying assumptions• Propulsion system modeling
– Boundary layer modeling– System performance– Weight estimates
• System design space exploration• Results
– Turboelectric concept benefits– System sensitivities
• Future work• Conclusions
34