Concentric Rings K-space Trajectory for Hyperpolarized C ...
31
Concentric Rings K-space Trajectory for Hyperpolarized C-13 MR Spectroscopic Imaging Wenwen Jiang Electrical Engineering and Computer Sciences University of California at Berkeley Technical Report No. UCB/EECS-2014-58 http://www.eecs.berkeley.edu/Pubs/TechRpts/2014/EECS-2014-58.html May 9, 2014
Transcript of Concentric Rings K-space Trajectory for Hyperpolarized C ...

Concentric Rings K-space Trajectory for
Hyperpolarized C-13 MR Spectroscopic Imaging
Wenwen Jiang
Electrical Engineering and Computer SciencesUniversity of California at Berkeley
Technical Report No. UCB/EECS-2014-58
http://www.eecs.berkeley.edu/Pubs/TechRpts/2014/EECS-2014-58.html
May 9, 2014

Copyright © 2014, by the author(s).All rights reserved.
Permission to make digital or hard copies of all or part of this work forpersonal or classroom use is granted without fee provided that copies arenot made or distributed for profit or commercial advantage and that copiesbear this notice and the full citation on the first page. To copy otherwise, torepublish, to post on servers or to redistribute to lists, requires prior specificpermission.

Concentric Ring K-Space Trajectory for Hyperpolarized 13C MR
Spectroscopic Imaging
by Wenwen Jiang
Research Project
Submitted to the Department of Electrical Engineering and Computer Sciences, University of Cal-
ifornia at Berkeley, in partial satisfaction of the requirements for the degree of Master of Science,
Plan II.
Approval for the Report and Comprehensive Examination:
Committee:
Advisor’s Name
Research Advisor
Date
Second Reader’s Name
Second Reader
Date
Wenwen Jiang
Michael Lustig
Wenwen Jiang
Steve Conolly
Wenwen Jiang
2/4/2014
Wenwen Jiang
1/27/2014

Concentric Rings K-Space Trajectory for
Hyperpolarized 13C MR Spectroscopic Imaging
Wenwen Jiang
Will be submitted to Magnetic Resonance in Medicine as a Full Paper
Abstract
Purpose: To develop a robust and rapid imaging technique for hyperpolarized 13C MR Spectro-
scopic Imaging (MRSI) and investigate its performance.
Methods: A concentric rings readout trajectory with constant angular velocity is proposed for
hyperpolarized 13C spectroscopic imaging and its properties are analyzed. Quantitative analy-
sis of design tradeo↵s are presented for several imaging scenarios in terms of resolution, spectral
bandwidth, acquisition time and SNR e�ciency. Analysis comparing parallel imaging accelerated
Cartesian sampling and concentric rings in terms of reconstruction noise amplification are also
presented. Finally, the first application on 13C phantoms and in vivo animal hyperpolarized 13C
MRSI studies were performed to demonstrate the feasibility of the proposed method.
Results: The concentric rings MRSI trajectory has the advantages of acquisition timesaving com-
pared to echo-planar spectroscopic imaging (EPSI), and robustness to system timing delay and
eddy currents compared to spiral MRSI. It provides a su�cient spectral bandwidth with a rela-
tively high SNR e�ciency compared to EPSI and spiral techniques. It will also be beneficial for
parallel imaging by reducing noise amplificiation.
Conclusion: The concentric rings trajectory is a robust and rapid imaging technique that fits very
well with the speed, bandwidth, and resolution requirements of hyperpolarized 13C MRSI.
Key words: Hyperpolarized 13C, Spectroscopic Imaging, Concentric Rings, Non-Cartesian Tra-
jectory, Parallel Imaging
1

Introduction
In vivo detection of 13C labeled substrates by MRSI allows for observation of specific enzyme-
catalyzed reactions that reflect altered metabolism in cancer [1]. This was recently made possible
by creating hyperpolarized nuclear spins in the liquid state suitable for injection through a process
called dissolution dynamic nuclear polarization (DNP). This process greatly improves the signal
sensitivity by a factor of 10,000+ [2], thereby allowing the direct monitoring of 13C metabolites in
vivo as long as the data acquisition is fast enough to capture the short-lived signal ( 1min). The
first phase I clinical trial using this technology was recently performed in the Surbeck Laboratory of
Advanced Imaging at UCSF, where 31 prostate cancer patients were studied using hyperpolarized
13C MRI. The study showed no adverse e↵ect and demonstrated promising initial imaging results
for detecting and staging tumors [3].
Despite these advances, the short-lived e↵ect of hyperpolarization still poses severe challenges for
imaging. It is therefore necessary to develop rapid and robust imaging techniques. Furthermore,
these techniques must also resolve metabolite signals at multiple resonance frequencies. Techniques
have been developed that rely on fast spectroscopic sequences that exploit the most out of the system
hardware [4, 5, 6, 7, 8, 9, 10, 11], imaging-based sequences with spectral separation techniques
[12, 13, 14], parallel imaging using coil arrays [15, 16, 17], and exploiting structure and redundancy
in the data[18, 19].
Fast spectroscopic sequences are advantageous because they provide comprehensive spectral infor-
mation about all metabolites. This is especially important when using multiple hyperpolarized
agents [20] or for agents with more complex spectra such as [1,2-13C] pyruvate [21], which present
major design challenges for imaging-based sequences [12, 13, 14]. In comparison to these sequences,
fast spectroscopic sequences are also more robust to B0 inhomogeneities.
Currently, both Cartesian (Echo-Planar Spectroscopic Imaging or EPSI [4, 5, 22]) and non-Cartesian
(spiral [7, 8, 23] and radial [6] spectroscopic imaging) techniques have been investigated for acceler-
ated hyperpolarized 13C MRSI. EPSI uses bipolar trapezoid magnetic field gradients during signal
detection and o↵ers larger k-space coverage. However it su↵ers from relatively long scan times due
2

to the number of phase encodings. In addition, minor system imperfections can induce undesirable
ghosting artifacts. To prevent ghosting, Flyback EPSI can be used but at the expense of a more
limited spectral bandwidth (SBW). This limits the number of metabolites that can be observed
without aliasing. Spiral spectroscopic imaging is an alternative that provides a scan-time-e�cient
imaging scheme, but is highly susceptible to system imperfections (such as gradient timing delay
and eddy currents) [24].
To provide scan-time-e�ciency and robustness to system imperfections, we propose using concen-
tric rings trajectory (CRT) as the data acquisition method for 13C MRSI. It has the following
advantages: I. the acquisition time is halved compared with EPSI, given the same imaging pre-
scriptions; II. the slew rate (a hardware limitation for magnetic field gradients) requirement is less
demanding than the time-optimal spiral trajectory; III. CRT is robust to linear eddy currents and
system delays; IV. the sampling trajectory results in lower g-factor noise amplification in parallel
imaging than EPSI. CRT for MRI was first proposed by Wu et. al, [25, 26]. They implemented CRT
on magnetization-prepared imaging and corrected for the o↵-resonance blurring by retracing the
central k-space.They also analyzed the unique contrast and robustness properties of CRT. Later,
Kwon et. al, [27] implemented the concentric cylinders trajectory on 3D magnetization-prepared
imaging. In their study, Kwon et. al, demonstrated the feasibility of the 3D concentric cylinder for
magnetization-prepared imaging. In another recent work, Furuyama et. al, [28] implemented CRT
in a standard PRESS based spectroscopy sequence for proton MRSI. They demonstrated feasibility
in the healthy human brain in vivo, taking advantage of the trajectory robustness and two-fold
acceleration over EPSI. None of these works have reported quantitative comparisons between CRT
and other MRSI trajectories to evaluate resolution, spectral bandwidth and SNR e�ciency. More-
over, for the hyperpolarized 13C MRSI application, some practical challenges and unique properties
which are well-suited to CRT have not been exploited yet.
In this work, we demonstrate the e�cacy of CRT through a quantitative comparison between
CRT, EPSI and spiral MRSI, and a hyperpolarized 13C MRSI CRT sequence which was used for
13C phantom and hyperpolarized 13C in vivo animal applications. We also extended the analysis
of CRT to parallel imaging for additional acceleration.
3
Methods
Concentric Rings Trajectory Design for MRSI
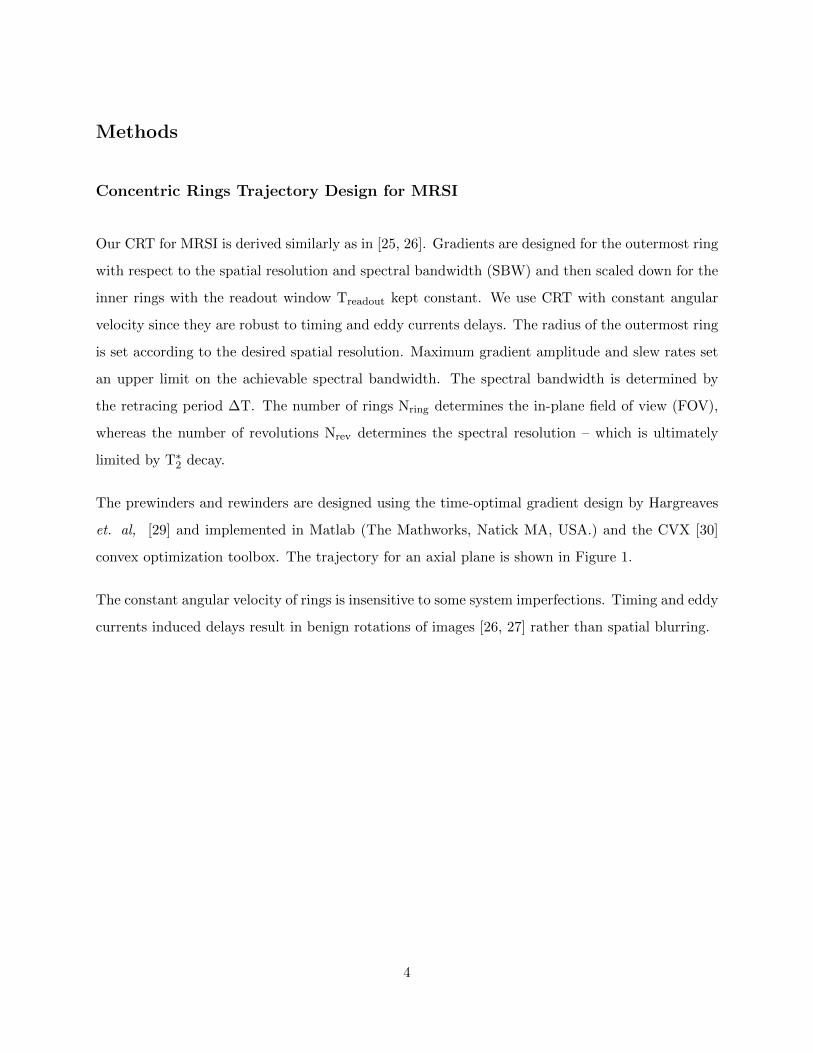
Our CRT for MRSI is derived similarly as in [25, 26]. Gradients are designed for the outermost ring
with respect to the spatial resolution and spectral bandwidth (SBW) and then scaled down for the
inner rings with the readout window Treadout
kept constant. We use CRT with constant angular
velocity since they are robust to timing and eddy currents delays. The radius of the outermost ring
is set according to the desired spatial resolution. Maximum gradient amplitude and slew rates set
an upper limit on the achievable spectral bandwidth. The spectral bandwidth is determined by
the retracing period �T. The number of rings Nring
determines the in-plane field of view (FOV),
whereas the number of revolutions Nrev
determines the spectral resolution – which is ultimately
limited by T⇤2
decay.
The prewinders and rewinders are designed using the time-optimal gradient design by Hargreaves
et. al, [29] and implemented in Matlab (The Mathworks, Natick MA, USA.) and the CVX [30]
convex optimization toolbox. The trajectory for an axial plane is shown in Figure 1.
The constant angular velocity of rings is insensitive to some system imperfections. Timing and eddy
currents induced delays result in benign rotations of images [26, 27] rather than spatial blurring.
4

−1.5 −1 −0.5. 0 0.5 1 1. 5
−1
Kx (cm-1)
Ky
(cm
-1)
1
1.5
−0.5.
0.5
0
0 2 4 6 8−0.2
0
0.2
time (ms)
RF
0 2 4 6 8 100−2
−1
0
1
time (ms)
Gz
0 2 4 6 8 100−4
−2
0
2
4
time (ms)
Gx
0 2 4 6 8 100−4
−2
0
2
4
time (ms)
Gy
100
0 20 40 60 80 100 120
1.5
0
-1.5
−1
−0. 5
0
0. 5
1
1.5
time (ms)
Kx (cm-1)
Ky (
cm
-1)
Figure 1: Concentric rings trajectory and sequence design: top-left shows the spatial concentric
rings k-space trajectory; top-right shows the spatial and spectral k-space trajectory; bottom shows
the concentric rings GRE sequence for axial images5

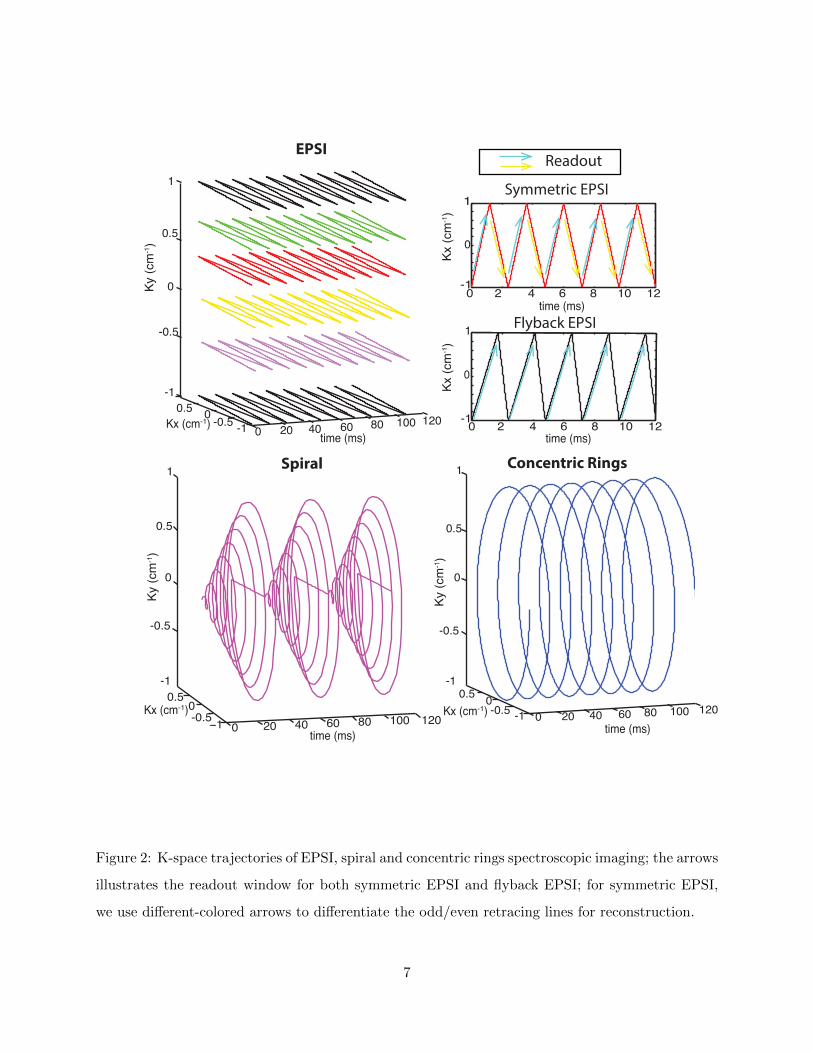
Comparison of the Concentric Rings Trajectory with EPSI and Spiral
For MRSI sequences, especially in hyperpolarized studies, optimizing the total scan time, spectral
bandwidth, and SNR is crucial for capturing the intrinsic contrast and biochemical information. A
quantitative study of CRT using these key parameters was performed in order to compare against
three other commonly used MRSI schemes: EPSI (both symmetric and flyback EPSI) and spiral
spectroscopic trajectories. Figure 2 illustrates the k-space trajectories for the di↵erent methods. In
symmetric EPSI k-space is scanned in a zigzag trajectory and is collected in both directions (green
and yellow arrows in the symmetric EPSI in Fig. 2). In our analysis we compare against a design
in which the spectral bandwidth is determined by the time between scans in the same direction,
e,g, between green arrows. This guarantees Nyquist sampling of the spectrum and is the preferred
method in the hyper polarized 13
C community. We refer to this approach as Nyquist-Constrained
symmetric EPSI[5]. However, it is possible to exploit Papoulis’s generalized sampling theory and
double the spectral bandwidth of the current symmetric design, as it was initially implemented in
proton MRSI. In this situation the spectral BW is defined by the time between alternate scanning
directions, e.g. between green and yellow arrows. We refer to this approach as as ”critical symmetric
EPSI”. We elaborate on this approach in the Reconstruction and Data Processing section.
For a fair comparison, we fixed some specific prescriptions when evaluating acquisition time, SBW
and SNR e�ciency with respect to the spatial resolution. The parameter range were chosen ac-
cording to typical routine hyperpolarized pre-clinical prescriptions for [1-13C]pyruvate that are
performed in our institution: FOV = 16 ⇥ 16 cm2, spectral resolution = 10 Hz (i.e., the readout
window Treadout
= 100 ms), spatial resolution is in the range from 0.36 cm to 1 cm. All designs
assume a gradient amplitude limit of 40 mT/m and maximum slew rate of 150 mT/m/ms.
6
Ky (
cm
-1)
Ky (
cm
-1)
Ky (
cm
-1)
time (ms)
time (ms)time (ms)
Kx (cm-1)
Kx (cm-1)Kx (cm-1)
0 20 40 60 80 100 120−1-0.50
0.5
-1
-0.5
0
0.5
1
0 20 40 60 80 100 120-1
-0.50
0.5-1
-0.5
0
0.5
1
0 20 40 60 80 100 120-1
-0.50
0.5
-1
-0.5
0
1
0.5
-1
0
1
0 2
0 2 4 6 8 10 12
4 6 8 10 12
-1
0
1
Symmetric EPSI
Flyback EPSI
Readout
time (ms)K
x (
cm
-1)
Kx (
cm
-1)
time (ms)
EPSI
Spiral Concentric Rings
Figure 2: K-space trajectories of EPSI, spiral and concentric rings spectroscopic imaging; the arrows
illustrates the readout window for both symmetric EPSI and flyback EPSI; for symmetric EPSI,
we use di↵erent-colored arrows to di↵erentiate the odd/even retracing lines for reconstruction.
7
Acquisition Time Comparison
The acquisition time should be as short as possible to “freeze” the 13C signal while hyperpolarized
compounds undergo metabolic conversion and before they decay back to equilibrium. For comparing
acquisition time we fixed the SBW = 500 Hz, TR = 200 ms, spectral resolution = 10 Hz and FOV
= 16⇥ 16 cm2. The total acquisition time Tacquisition time
is simply the product of TR, the number
of phase encodings Npe
and the number of interleaves in time Ninterleaves
.
T
acquisition time
= TR⇥N
pe
⇥N
interleaves
(1)
SNR E�ciency Comparison
In our SNR e�ciency comparisons we fixed some parameters: SBW = 500 Hz, spectral resolution =
10 Hz and FOV = 16⇥ 16 cm2. We considered the duty cycle and the k-space sampling uniformity
e↵ects on SNR e�ciency. (We do not consider T1 e↵ects and the number of excitations. Unlike
conventional imaging, hyperpolarized 13C imaging often uses a progressive flip angle [31], which
equalizes the magnetization for each excitation. This results in an SNR that is independent of
the number of excitations and this is elaborated in the following parallel imaging with concentric
rings section. Since relatively small number of excitations are considered here, T1 e↵ects can
be neglected. When the acquisition is long, T1 decay during the scan will reduce the available
magnetization. It’s worth mentioning that spirals and rings will have the advantage over EPSI
since they require less acquisitions. )
SNR e�ciency depends on the duty cycle:
SNR
e↵,duty
=
rT
active time
T
readout
, (2)
where Tactive time
is the total duration of the active readout gradients while Treadout
is the duration
of readout window.
It is also dependent on the uniformity of the sampling trajectory. Non-uniform sampling acquisitions
8
are less SNR e�cient than uniform ones. This was nicely demonstrated in [32], where the e↵ective
SNR e�ciency is given by:
SNR
e↵,uniformity
=A
kR~
k
D(~k) d~kR~
k
1
D(
~
k)
d
~
k
, (3)
where D(~k) is the density of the corresponding sampling position, and A
k
is the k-space coverage.
We define the overall SNR e�ciency to be the product of the above two formulas and compute the
SNR e�ciency for di↵erent trajectories.
For flyback and symmetric EPSI, we are required to use ramp sampling (as otherwise the SBW
requirement is not achievable). For the spiral trajectory, we designed constant slew rate spiral
trajectories for di↵erent imaging resolution in order to minimize the total acquisition time, which
is essential for hyperpolarized 13C imaging.
Spectral Bandwidth
Spectral bandwidth (SBW) relates to the number of metabolites we can observe without spectral
aliasing. For example, in hyperpolarized [1-13C]pyruvate studies at 3T, 500 Hz SBW is a reasonable
range to display the pyruvate and the products of [1-13C]lactate and [1-13C]alanine. Here we fixed
spectral resolution = 10 Hz spectral resolution and FOV = 16 ⇥ 16 cm2. SBW is determined by
�T, which is the retracing period (in Equation 4) to the same k-space position.
SBW =1
�T
(4)
Parallel Imaging with Concentric Rings
Parallel imaging is favorable for hyperpolarized 13C imaging because the shorter scan times reduce
SNR losses due to T1 decay and metabolism during the acquisition. In non-hyperpolarized imaging,
undersampling of k-space in parallel imaging reduces the acquisition time but at the trade-o↵ of
9

losing SNR, as Equation 5 shows [33]
SNR
und
=SNR
full
g
pR
(5)
SNRund
and SNRfull
are the undersampled and fully sampled SNR respectively, and R is the
acceleration factor. The G factor, g, is spatially variant noise enhancement that depends on the
receiver coil array and sampling pattern.
However, the inherent signal of hyperpolarized 13C imaging is limited. With undersampling, the
given amount of total magnetization can be distributed into fewer excitations where each excitation
has more signal. In fact, reduced acquisition times may translate into higher image SNR due to the
reduced T1 relaxation [15]. As a result, parallel imaging does not result in losing inherent signal
if a progressive flip angle [31] is applied (shown in Equation 6). This results in an undersampled
SNR of
SNR
und
=SNR
full
g
. (6)
Given the same phase-array coil sensitivity, the G-factor is determined by the sampling pattern. A
Monte-Carlo technique, which is also known as pseudo replica method [34], was used to calculate
g-factor maps of a simulated 8-channel phased-array coil and 4-fold undersampling with CRT
and rectilinear Cartesian (i.e., EPSI) trajectories. Fully encoded series of images with identical
parameters was simulated. Out of this image series, an SNRfull
map of the fully encoded image
can be derived by taking the mean and the standard deviation on a pixel-by-pixel basis throughout
the image series. Undersampling was achieved by uniformly skipping phase encodings for both
CRT and Cartesian counterparts. Similarly, after reconstruction an SNRund
map of under sampled
encoded image can be generated and a g-factor map is computed by the Equation 5.
The g-factor maps were 256⇥ 256 and cropped to display circular FOV. CRT’s g-factor maps were
generated by using fully sampled 128 rings and undersampled 32 rings respectively, while the Carte-
sian (EPSI) g-factor map was generated by fully sampled 256 phase encodings and undersampled
64 phase encodings. We used conjugate gradient SENSE (CG-SENSE) [35] without regularization
for the reconstruction. The number of pseudo replicas is 50 for both sampling patterns.
10

Sequence Design Parameters for Concentric Rings Trajectory
CRT was implemented into the readout window of a gradient echo (GRE) 2D slice-selective pulse
sequence. The spectroscopic imaging module consists of readout window duration Treadout
= 100
ms, corresponding to a spectral resolution of �f = 10 Hz, and a SBW = 500Hz, which sets the
duration of each revolution to �T = 2ms. The in-plane isotropic spatial resolution was 3.67mm,
which is limited by the slew rate and by the SBW. For the 13C phantom study, the flip angle (FA)
was set to be constant for each excitation. In the hyperpolarized studies, a progressive flip angle
technique [31] was applied in order to equalize the signal across excitations. Temporal interleaves
were implemented by rotation of the readout trajectory in order to increase spectral bandwidth,
and this is also one specific di↵erence for CRT compared with EPSI.
Experiments All the phantom and in vivo studies were conducted on a 3.0 T GE clinical scanner
(GE Healthcare, Waukesha, WI) with maximum gradient amplitude of 40 mT/m and maximum
slew rate of 150 mT/m/ms. All the animal studies conducted were approved by our Institutional
Animal Care and Use Committee (IACUC).
Hyperpolarized 13C in vivo Spectroscopic Imaging
In vivo experiments were performed on rats. For all the rats, a tail vein catheter was placed
immediately before the hyperpolarized MR study. Next, the anesthetized rats were placed on a
water-filled, temperature-controlled pad that was heated to approximately 37 C� and positioned
inside of the coil.
Initially, T2
-weighted 1H anatomic MR images were acquired in sagittal, axial, and coronal views.
The subsequent hyperpolarized 13C scans were prescribed on the chosen slices. A mixture of [1-13C]
pyruvic acid and the trityl radical (tris methyl sodium salt; GE Healthcare) was polarized using the
HyperSense polarizer (Oxford Instruments, Oxford, UK). After the mixture was polarized, it was
rapidly dissolved into a pH-balanced Tris bu↵er solution targeting a hyperpolarized 100 mmol/L
pyruvate solution with a neutral pH. Next, the solution was quickly transported to the MR scanner
and 2.2 mL was injected into the rat over 12 s. The imaging data acquisition was initiated 30 s after
11

the start of the pyruvate injection to coincide with the peak lactate signal. A slice-selective pulse
sequence with a variable flip angle excitation pulse using CRT was performed using a TE/TR =
3.4/200 ms, readout window Treadout
= 100 ms, and 11 rings. Additional sequence prescriptions for
rat studies include: FOV= 8⇥8 cm2, slice thickness of 10 mm, resolution = 3.8⇥3.8 mm2, and 500
Hz SBW. The data was reconstructed by 3D gridding and spatially zero padded to be a 44⇥44⇥50
matrix. The total scan time was 2.2 s. For this study, the total scan time could be reduced by 35%
by decreasing TR.
Reconstruction and Data Processing
Image reconstruction and postprocessing were carried out in Matlab. We applied density compen-
sation to the non-Cartesian raw data, 3D gridded it into Cartesian data, and then performed
an FFT. Gridding and FFT were done by using Fessler’s non-uniform fast Fourier transform
(NUFFT) toolbox [36] with min-max Kaiser-Bessel kernel interpolation and twice oversampling.
The matrix size of the reconstructed CRT image after 3D gridding (2D spatial + 1D spectral)
was 2Nring
⇥ 2Nring
⇥Nrev
. The same reconstruction method is also applicable for symmetric EPSI
(Nyquist-constrained) and flyabck EPSI. For parallel imaging, iterative SENSE [35] reconstruction
and Monte-Carlo method were performed to compute the g-factor maps.
Critical Symmetric EPSI Reconstruction
Currently, the Nyquist-constrained symmetric EPSI reconstruction is to separate the odd and even
numbered retracing lines, perform the inverse Fourier transform separately and average the separate
signals for better SNR [5]. But this kind of design and reconstruction over prescribes the SBW,
while not critically using up the sampling limits. Papoulis’s generalized sampling theory [39] asserts
that in some cases aliasing artifact-free signals can be reconstructed even if the Nyquist criterion
is violated in some regions of the Fourier domain.
As is explicitly demonstrated in [40, 41], critical symmetric EPSI reconstruction can be regarded
as a matrix inversion problem that even if the Nyquist criterion is violated in some regions of the
12

spectral domain, but at the cost of noise amplification.
In Figure 3, we demonstrate the symmetric EPSI reconstruction algorithm. Here we only plot the
Kx-t joint domain since Ky (phase encoding direction) is uniform. Basically, the critical design of
symmetric EPSI trajectory is to make sure the temporary sampling rate at Kx = 0 fulfills Nyquist
rate of the required spectral bandwidth (as the black star in Figure 3). Regarding to the non-
uniform samples, each Kx
i
’s non-uniformity is di↵erent, with di↵erent delay �t
i
. We separate the
odd/even retracing lines based on the labels. For odd or even lines respectively, they are uniformly
sampled but at the rate of 2/SBW. We apply 1D inverse Fourier Transform in temporary domain
to odd and even numbered retracing lines separately. The di↵erence between odd and even lines
reconstruction is the linear phase combination (due to the delay in the sampling domain). Then,
we apply the matrix inversion to recover the full spectra as shown in the following equation.
The noise amplification is resulting from inverting the matrix
0
@1 1
1 e
i�ti⇤SBW⇡
1
A, and it is shown in Figure 3 by color bar (as neatly explained in [40]).
13

0 1 2 3 4 5 6 7 8 9 10−1.5
−1
−0.5
0
0.5
1
1.5
Kx (
cm
-1)
time (ms)
non-uniform samples
uniform samples ∗
Critical Symmetic EPSI
Kx1
Kx2
∗ ∗ ∗ ∗
1/SBW
1
1 432
2.5
2
1.5
Figure 3: EPSI Recontruction: The area between the light blue dashed lines is the k-space used for
the reconstruction; red and green samples are non-uniform Kx
i
, samples in temporal domain. With
the above method we described, the SBW could be doubled but at the cost of noise amplifcation.The
colorbar indicated the noise amplification at di↵erent Kx
i
.
14

For example, we now exam a single k-space point at the Kx
1
as Figure 4.
2/SBW
2/SBW
Δt1
IFT
½S1(f ) ½S1(f-SBW/2)
SBW/2-SBW/2
½S1(f+SBW/2)
Kx1 S1odd(f )
IFT
½S1(f )
SBW/20-SBW/2
½S1(f+SBW/2)e-iΔt1SBWπ ½S1(f-SBW/2)eiΔt1SBWπ
Kx1
2/SBW
2/SBW
Δt1{{
S1even
(f )
frequency
frequency
0
time (ms)
time (ms)
Figure 4: At Kx
1
, we separate odd and even samples at each retracing lines and perform 1DFT
respectively. Then we will see the spectral replica resulting from both odd and even lines recon-
struction. But there is a phase shift between the odd and even samples, which determines the
inversion matrix.
The time interval between the odd and even data points (�t1
) is not equal to the interval between
the even and the odd points (T��t1
) and is dependent on Kx
1
; However, the time between odd(or
even) points, T (i.e., the prescribed 2/SBW), is a constant and independent on Kx
1
. The interval
0 f SBW/2 spectrum S1
(f) can be recovered by the matrix inversion of the following equation:
0
@ 1 1
1 e
i�t1⇤SBW⇡
1
A
0
@ S
1
(f)
S
1
(f � SBW/2)
1
A =
0
@ S
1odd
(f)
S
1even
(f)
1
A
The interval �SBW/2 f 0 spectrum S1
(f) can be recovered by the matrix inversion of the
similar equation:
0
@ 1 1
1 e
�i�t1⇤SBW⇡
1
A
0
@ S
1
(f)
S
1
(f + SBW/2)
1
A =
0
@ S
1odd
(f)
S
1even
(f)
1
A
Due to the di↵erent delay �t
i
, the linear phase compensation is di↵erent for Kx
i
. After we apply
the appropriate phase compensation to all the Kx
i
, 2D inverse Fourier Transform is applied on
Kx-Ky domain to reconstruct the whole spatial-spectral signal.
15
With this reconstruction method, we could exploit the intrinsic SBW by a factor of two with
current Nyquist-constrained symmetric EPSI waveforms. So the SBW analyses from Figure 5
could be doubled for symmetric EPSI. However, we have to notice that the noise amplification of
the matrix inversion could be large depending on the non-uniformity of delay �t
i
at di↵erent Kx
i
.
At larger Kx, that is for higher resolution, the condition worsens and the penalty is the higher
sensitivity to noise. The overall noise amplification is the summation of the noise amplification at
all the Kx coordinates as the plot shows. The finer the resolution, the larger noise amplification is.
In addition, the precise coordinates of sampled data are important for image reconstruction using
the this technique.
Results
Comparison of the Concentric Rings Trajectory with EPSI and Spiral
In the following, we compared CRT with EPSI and spiral MRSI trajectories in terms of resolution,
acquisition time, SNR e�ciency, and spectral bandwidth.
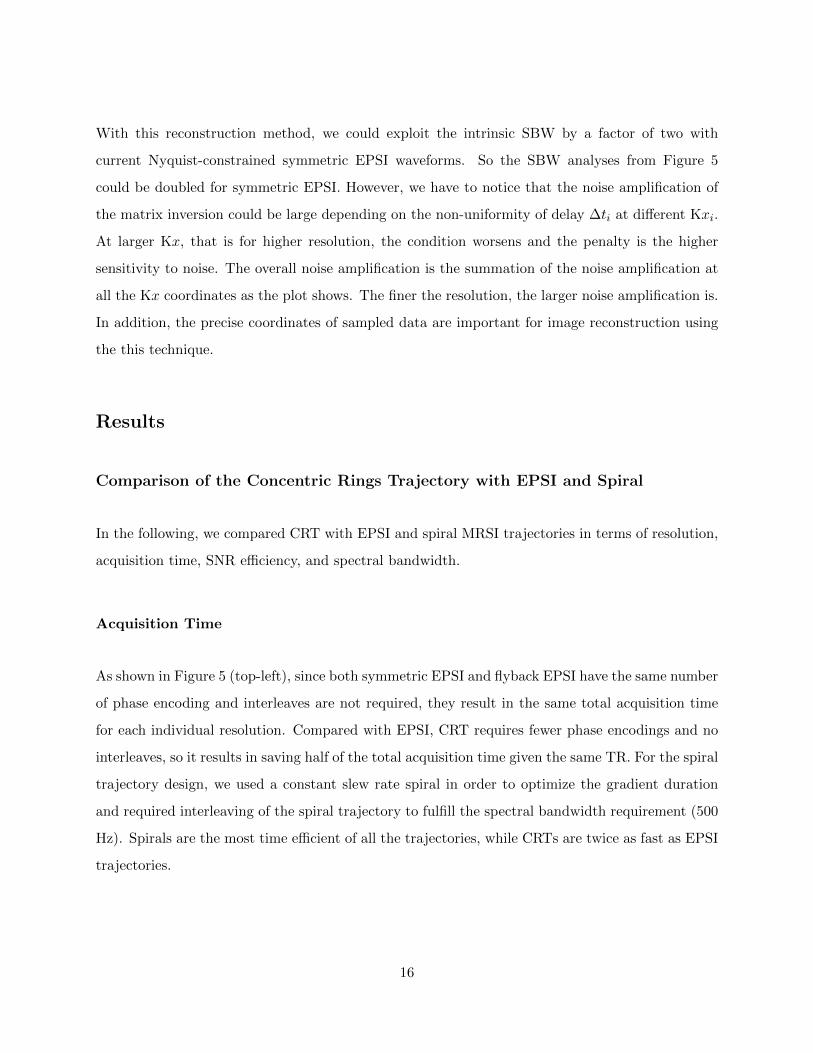
Acquisition Time
As shown in Figure 5 (top-left), since both symmetric EPSI and flyback EPSI have the same number
of phase encoding and interleaves are not required, they result in the same total acquisition time
for each individual resolution. Compared with EPSI, CRT requires fewer phase encodings and no
interleaves, so it results in saving half of the total acquisition time given the same TR. For the spiral
trajectory design, we used a constant slew rate spiral in order to optimize the gradient duration
and required interleaving of the spiral trajectory to fulfill the spectral bandwidth requirement (500
Hz). Spirals are the most time e�cient of all the trajectories, while CRTs are twice as fast as EPSI
trajectories.
16

SNR E�ciency
Figure 5 (top-right) shows the SNR e�ciency of di↵erent trajectories with various resolution pre-
scriptions. The SNR loss for flyback EPSI is mostly due to its low duty cycle. The finer the
resolution is, the lower the duty cycle will be and SNR e�ciency goes lower as the flyback portion
requires more time. Though the duty cycle for symmetric EPSI is 100% (including ramp sam-
pling), the non-uniform k-space sampling resulting from the ramp part of the trapezoid waveform
reduces the SNR e�ciency to some extent. The SNR e�ciency is very high for symmetric EPSI
but not 100%. As the resolution gets coarser, the ramp portion is smaller, so the SNR e�ciency is
higher. For the constant slew rate spiral trajectories, the SNR e�ciency decreases as the resolution
becomes coarser with a fixed FOV since there is proportionally less outer k-space sampling where
spirals are more uniform than inner k-space. And non-uniformity results in the most of the SNR
loss of spirals while duty cycle results in a smaller fraction of the loss. Benefiting from the design
of constant slew rate, the spiral trajectories provide even better SNR e�ciency than flyback EPSI
and CRT. CRT o↵ers a constant SNR e�ciency ofp3
2
, which is better than flyback EPSI with the
chosen prescriptions. The loss of SNR e�ciency for CRT is caused by the non-uniformity.
Spectral Bandwidth
EPSI traverses a rectilinear line in k-space for each retracing period, CRT traverses a circle, while
spiral traverses the whole spatial k-space in each period. Given the same traversing velocity (deter-
mined by the gradient waveforms), accordingly, the achieved SBW for EPSI, CRT, and spirals are
decreasing in order, as shown in Figure 5 (bottom-left) without interleaves. To exploit the max-
imum spectral bandwidth, both symmetric EPSI and flyback EPSI result in the same waveform
design thus achieving the same spectral bandwidth. They are only slightly better than CRT since
flyback EPSI requires flyback time and symmetric EPSI (Nyquist constrained) does not critically
exploit the whole spectral bandwidth.
However, CRT and spiral trajectories are more scan-time-e�cient compared with EPSI. If we
take advantage of scan-time-e�ciency by applying interleaves in temporal domain, we can increase
17
SBW. In Figure 5 (bottom-right), the SBW of all trajectories was computed by accounting for the
interleaves in time domain constrained for the same total acquisition time. Considering this tradeo↵,
spiral trajectories o↵er the best SBW, while CRT’s spectral bandwidth is doubled compared to
EPSI. The non-monotonicity of the spiral trajectories SBW with respect to resolution in this
analysis is due to using an integer number of interleaves.
Simulation of Parallel Imaging with the Concentric Rings
As the g-factor maps (in Figure 6) confirm, the non-rectilinear circular sampling pattern of CRT
results in more incoherent noise amplification than Cartesian counterparts such as EPSI. Noise
is amplified by 3-4 times at more discrete locations for the Cartesian undersampling pattern due
to the worse conditioning. For CRT, the noise is more uniformly distributed spatially, resulting
in a noise amplification of no more than 2.5 for this simulated 8-channel array with 4⇥ under-
sampling. (In conjunction with appropriate regularization, the g-factor can be further improved.)
The non-Cartesian sampling pattern of concentric rings is advantageous because it makes the noise
amplification incoherent thus lowering the g-factor of the whole space.
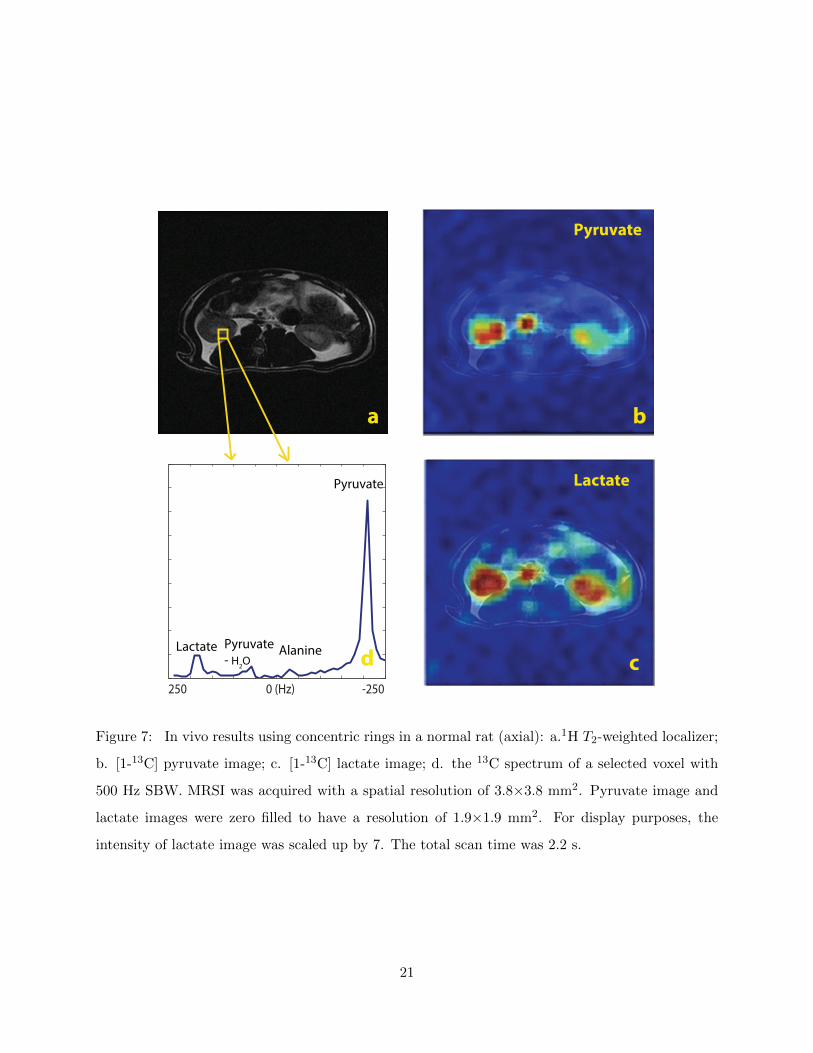
Hyperpolarized 13C In Vivo Spectroscopic Imaging with Concentric Rings
The imaging plane was chosen at the abdomen of rat in axial view ( in Figure 7). The kidneys of
rats showed the high uptake of pyruvate and its conversion to alanine and lactate. Spatially, the
structure of kidneys and arteries along with metabolic conversion were captured.
18

0.4 0.5 0.6 0.7 0.8 0.9 10
500
1000
1500
2000
2500
3000Spectral Bandwidth
Resolution (cm)
SB
W (
Hz)
Concentric Rings
Symmetric EPSI
Flyback EPSI
Spiral
0.4 0.5 0.6 0.7 0.8 0.9 10
1
2
3
4
5
6
7
8
9Acquisition Time
Resolution (cm)
Acq
uis
ito
n T
ime
(s)
Concentric Rings
Symmetric EPSI
Flyback EPSI
Spiral
0.4 0.5 0.6 0.7 0.8 0.9 10
500
1000
1500
2000
2500
3000Spectral Bandwidth with Interleaves
Resolution (cm)
SB
W (
Hz)
Concentric Rings
Symmetric EPSI
Flyback EPSI
Spiral
0.4 0.5 0.6 0.7 0.8 0.9 10.65
0.7
0.75
0.8
0.85
0.9
0.95
1SNR Efficiency
Resolution (cm)
SN
R E
ffic
ien
cy
Concentric Rings
Symmetric EPSI
Flyback EPSI
Spiral
Figure 5: Comparison of concentric rings, EPSI and spiral spectroscopic imaging: top-left shows
the acquisition time; top-right shows the SNR e�ciency; bottom-left and bottom-right show the
SBW and SBW with spectral interleaves. CRT requires half of the total acquisition time compared
with EPSI trajectories, o↵ers about 87% SNR e�ciency, and provides much wider spectral band-
width than flyback EPSI and symmetric EPSI. Although nominally spirals are the most e�cient
trajectories, o↵ering the best acquisition time and spectral bandwidth benefit while sacrificing the
least SNR, they are limited by susceptibility to gradient infidelities.
19

0.5
1
1.5
2
2.5
3
3.5
4
Figure 6: G-factor map of 4⇥ undersampled concentric rings trajectory (on the left) and Carteisan
trajectory counterpart, such as EPSI, (on the right) for a simulated 8-channel array. The isotropic
non-Cartesian undersampling pattern of the concentric rings trajectory results in less coherent noise
amplification than the Cartesian counterpart.
20
Pyruvate
AlanineLactate
Pyruvate
Lactate
a
c
b
250 -2500 (Hz)
Pyruvate- H
2O d
Figure 7: In vivo results using concentric rings in a normal rat (axial): a.1H T
2
-weighted localizer;
b. [1-13C] pyruvate image; c. [1-13C] lactate image; d. the 13C spectrum of a selected voxel with
500 Hz SBW. MRSI was acquired with a spatial resolution of 3.8⇥3.8 mm2. Pyruvate image and
lactate images were zero filled to have a resolution of 1.9⇥1.9 mm2. For display purposes, the
intensity of lactate image was scaled up by 7. The total scan time was 2.2 s.
21

Discussion
CRT provides a competitive alternative to 13C existing spectroscopic imaging acquisition methods.
Our CRT sequence requires half the number of excitations compared to EPSI. This has an advantage
in two-fold acquisition time savings. In addition, the T1 decay is reduced, which leads to overall
higher SNR [15]. The acquisition time saving can be traded o↵ for an increased spectral bandwidth
through interleaving. We also showed that even though CRT samples k-space non-uniformly, its
SNR e�ciency is stillp3
2
⇡ 0.87 of uniform sampling.
Unlike spiral or critical EPSI, the concentric rings trajectory is robust to system imperfections.
Any gradient timing delay or eddy currents will results in some artifacts. In spirals, delays cause
spatial blurring. In critical EPSI, the e↵ect is odd-even echo inconsistency which results in spectral
aliasing. This is analogous to ghosting artifacts in EPI [37]. For CRT, simple delays are translated
to benign image rotations. More importantly, no spectral aliasing is observed with appropriate
prescriptions.
One of the advantages of using CRT is robustness to flow that was also reported in [25]. Pulsatile
flow is blurred by CRT. In contrast, EPSI trajectories can su↵er from significant pulsatile flow
artifacts where flow results in replicas in phase encoding direction.
Combining CRT with parallel imaging for hyperpolaizated 13C imaging is also very promising.
Undersampling is achieved by acquiring fewer rings than what are necessary for in plane full-FOV.
We showed in Monte Carlo simulations that with CRT the resulting g-factor due to undersampling
is lower than for Cartesian undersampling. The reason is that CRT undersamples isotropically
in-plane, whereas Cartesian imaging can accelerate only in the phase-encoding directions. As
a result, CRT acquisitions can better utilize the multi-dimensional spatial variation of the coils
sensitivities to improve the conditioning of the reconstruction. Furthermore, for hyperpolaizated
13C we do not su↵er from the usualpR loss of SNR due to subsampling. The reason is that the
total magnetization can be redistributed optimally to fewer number of excitations. Hyperpolarized
13C parallel imaging with CRT is essential for the large FOV applications, e.g., metastatic cancer
imaging.
22

There are some possible extensions of CRT for 13C MRSI: (1) the shorter scan time could be
amortized for dynamic MRSI to track perfusion and metabolism kinetics; (2) 3D MRSI to cover a
larger volume in vivo; (3) variable-density undersampling designs for parallel imaging, maintaining
the inner k-space fully sampled to capture the intrinsic contrast and outer k-space undersampled
for resolution and acceleration; (4) compressed sensing, taking advantages of intrinsically sparse 13
C spectra [18, 19]. These improvements could further reduce the total scan time.
Conclusion
Our preclinical studies have demonstrated the potential and feasibility of using concentric rings in
hyperpolarized 13C MRSI for a two-fold acceleration over EPSI, with inherent robustness to flow
artifacts, gradient system delay and eddy currents. Parallel imaging will also benefit from this
trajectory for hyperpolarized 13C imaging. Compared with existing methods, the concentric rings
trajectory provides flexible and robust trade-o↵ between acquisition time and spectral bandwidth,
thereby acting as an e↵ective alternative for hyperpolarized 13C MRSI .
Acknowledgement
The authors would like to thank Dr. Robert Bok for his assistance in animal studies, Peter Shin
for his help to implement the EPSI waveforms, and Ralph Hurd for his kindness of providing the
13C phantom. This work was supported by NIH grants R00-EB012064; P41-EB013598, a UCSF
Department of Radiology and Biomedical Imaging Seed Grant, and the Sloan Research Fellowship.
References
[1] Kurhanewicz J, Vigneron DB, Brindle K, Chekmenev EY, Comment A, Cunningham CH,
DeBerardinis RJ, Green GG, Leach MO, Rajan SS et al. Analysis of cancer metabolism by
23

imaging hyperpolarized nuclei: prospects for translation to clinical research. Neoplasia (New
York, NY) 2011; 13:81.
[2] ArdenkjærLarsen JH, Fridlund B, Gram A, Hansson G, Hansson L, Lerche MH, Servin R,
Thaning M, Golman K. Increase in signal-to-noise ratio of > 10,000 times in liquid-state nmr.
Proceedings of the National Academy of Sciences 2003; 100:10158–10163.
[3] Nelson SJ, Kurhanewicz J, Vigneron DB, Larson PEZ, Harzstark AL, Ferrone M, van
Criekinge M, Chang JW, Bok R, Park I, Reed G, Carvajal L, Small EJ, Munster P, Wein-
berg VK, ArdenkjaerLarsen JH, Chen AP, Hurd RE, Odegardstuen LI, Robb FJ, Tropp J,
Murray JA. Metabolic imaging of patients with prostate cancer using hyperpolarized [1-
13c]pyruvate. Science Translational Medicine 2013; 5:198ra108.
[4] Cunningham CH, Vigneron DB, Chen AP, Xu D, Nelson SJ, Hurd RE, Kelley DA, Pauly JM.
Design of flyback echo-planar readout gradients for magnetic resonance spectroscopic imaging.
Magnetic resonance in medicine 2005; 54:1286–1289.
[5] Yen YF, Kohler S, Chen A, Tropp J, Bok R, Wolber J, Albers M, Gram K, Zierhut M,
Park I, Zhang V, Hu S, Nelson S, Vigneron D, Kurhanewicz J, Dirven H, Hurd R. Imaging
considerations for in vivo 13c metabolic mapping using hyperpolarized 13c-pyruvate. Magnetic
Resonance in Medicine 2009; 62:1–10.
[6] Ramirez MS, Lee J, Walker CM, Sandulache VC, Hennel F, Lai SY, Bankson JA. Radial
spectroscopic mri of hyperpolarized [1-(13) c] pyruvate at 7 tesla. Magn Reson Med 2013; .
[7] Mayer D, Levin YS, Hurd RE, Glover GH, Spielman DM. Fast metabolic imaging of systems
with sparse spectra: application for hyperpolarized 13C imaging. Magn Reson Med 2006;
56:932–7.
[8] Josan S, Hurd R, Park JM, Yen YF, Watkins R, Pfe↵erbaum A, Spielman D, Mayer D.
Dynamic metabolic imaging of hyperpolarized [2-(13) c]pyruvate using spiral chemical shift
imaging with alternating spectral band excitation. Magn Reson Med 2013; .
[9] Leupold J, Mansson S, Petersson JS, Hennig J, Wieben O. Fast multiecho balanced ssfp
metabolite mapping of (1)h and hyperpolarized (13)c compounds. MAGMA 2009; 22:251–6.
24

[10] Wiesinger F, Weidl E, Menzel MI, Janich MA, Khegai O, Glaser SJ, Haase A, Schwaiger M,
Schulte RF. Ideal spiral csi for dynamic metabolic mr imaging of hyperpolarized [1-
13c]pyruvate. Magn Reson Med 2012; 68:8–16.
[11] Gordon JW, Niles DJ, Fain SB, Johnson KM. Joint spatial-spectral reconstruction and k-t
spirals for accelerated 2d spatial/1d spectral imaging of (13) c dynamics. Magn Reson Med
2013; .
[12] von Morze C, Reed G, Shin P, Larson PEZ, Hu S, Bok R, Vigneron DB. Multi-band frequency
encoding method for metabolic imaging with hyperpolarized [1-(13)c]pyruvate. J Magn Reson
2011; 211:109–113.
[13] Lau AZ, Chen AP, Ghugre NR, Ramanan V, Lam WW, Connelly KA, Wright GA, Cunning-
ham CH. Rapid multislice imaging of hyperpolarized 13c pyruvate and bicarbonate in the
heart. Magn Reson Med 2010; 64:1323–31.
[14] Cunningham CH, Chen AP, Lustig M, Hargreaves BA, Lupo J, Xu D, Kurhanewicz J,
Hurd RE, Pauly JM, Nelson SJ, Vigneron DB. Pulse sequence for dynamic volumetric imaging
of hyperpolarized metabolic products. J Magn Reson 2008; 193:139–146.
[15] Arunachalam A, Whitt D, Fish K, Giaquinto R, Piel J, Watkins R, Hancu I. Accelerated
spectroscopic imaging of hyperpolarized c-13 pyruvate using sense parallel imaging. NMR in
Biomedicine 2009; 22:867–873.
[16] Tropp J, Lupo JM, Chen AP, Calderon P, McCune D, Grafendorfer T, OzturkIsik E, Lar-
son PE, Hu S, Yen YF, Robb F, Bok R, Schulte R, Xu D, Hurd R, Vigneron D, Nelson S.
Multi-channel metabolic imaging, with sense reconstruction, of hyperpolarized [1-13c] pyruvate
in a live rat at 3.0 tesla on a clinical mr scanner. J Magn Reson 2011; 208:171–177.
[17] Ohliger MA, Larson PEZ, Bok RA, Shin P, Hu S, Tropp J, Robb F, Carvajal L, Nelson SJ,
Kurhanewicz J, Vigneron DB. Combined parallel and partial fourier mr reconstruction for ac-
celerated 8-channel hyperpolarized carbon-13 in vivo magnetic resonance spectroscopic imaging
(mrsi). J Magn Reson Imaging 2013; 38:701–13.
25

[18] Larson PEZ, Hu S, Lustig M, Kerr AB, Nelson SJ, Kurhanewicz J, Pauly JM, Vigneron DB.
Fast dynamic 3d mr spectroscopic imaging with compressed sensing and multiband excitation
pulses for hyperpolarized 13c studies. Magn Reson Med 2011; 65:610–9.
[19] Hu S, Lustig M, Balakrishnan A, Larson PEZ, Bok R, Kurhanewicz J, Nelson SJ, Goga A,
Pauly JM, Vigneron DB. 3d compressed sensing for highly accelerated hyperpolarized 13c
mrsi with in vivo applications to transgenic mouse models of cancer. Magnetic Resonance in
Medicine 2010; 63:312–321.
[20] Wilson DM, Keshari KR, Larson PEZ, Chen AP, Criekinge MV, Bok R, Nelson SJ, Macdon-
ald JM, Vigneron DB, Kurhanewicz J. Multi-compound polarization by dnp allows simulta-
neous assessment of multiple enzymatic activities in vivo. J Magn Reson 2010; 205:141–147.
[21] Chen AP, Hurd RE, Schroeder MA, Lau AZ, Gu Yp, Lam WW, Barry J, Tropp J, Cun-
ningham CH. Simultaneous investigation of cardiac pyruvate dehydrogenase flux, krebs cycle
metabolism and ph, using hyperpolarized [1,2-13c2]pyruvate in vivo. NMR Biomed 2012;
25:305–311.
[22] Mansfield P. Spatial mapping of the chemical shift in nmr. Magn Reson Med 1984; 1:370–86.
[23] Adalsteinsson E, Irarrazabal P, Topp S, Meyer C, Macovski A, Spielman DM. Volumetric
spectroscopic imaging with spiral-based k-space trajectories. Magnetic resonance in medicine
1998; 39:889–898.
[24] Kim DH, Spielman DM. Reducing gradient imperfections for spiral magnetic resonance spec-
troscopic imaging. Magnetic Resonance in Medicine 2006; 56:198–203.
[25] Wu HH, Lee JH, Nishimura DG. Mri using a concentric rings trajectory. Magnetic Resonance
in Medicine 2008; 59:102–112.
[26] Wu HH. “MAGNETIC RESONANCE IMAGING USING A CONCENTRIC RINGS K-
SPACE TRAJECTORY”. PhD thesis, Stanford University, September 2009.
[27] Kwon KT, Wu HH, Shin T, Cukur T, Lustig M, Nishimura DG. Three-dimensional
magnetization-prepared imaging using a concentric cylinders trajectory. Magnetic Resonance
in Medicine 2013; pp. n/a–n/a.
26

[28] Furuyama JK, Wilson NE, Thomas MA. Spectroscopic imaging using concentrically circular
echo-planar trajectories in vivo. Magnetic Resonance in Medicine 2012; 67:1515–1522.
[29] Hargreaves BA, Nishimura DG, Conolly SM. Time-optimal multidimensional gradient wave-
form design for rapid imaging. Magnetic resonance in medicine 2004; 51:81–92.
[30] CVXResearch I. CVX: Matlab software for disciplined convex programming, version 2.0.
http://cvxr.com/cvx, August 2012.
[31] Zhao L, Mulkern R, Tseng CH, Williamson D, Patz S, Kraft R, Walsworth RL, Jolesz FA,
Albert MS. Gradient-echo imaging considerations for hyperpolarized 129 xe mr. Journal of
Magnetic Resonance, Series B 1996; 113:179–183.
[32] Tsai CM, Nishimura DG. Reduced aliasing artifacts using variable-density k-space sampling
trajectories. Magnetic resonance in medicine 2000; 43:452–458.
[33] Pruessmann KP, Weiger M, Scheidegger MB, Boesiger P. Sense: Sensitivity encoding for fast
mri. Magnetic Resonance in Medicine 1999; 42:952–962.
[34] Breuer FA, Kannengiesser SA, Blaimer M, Seiberlich N, Jakob PM, Griswold MA. General for-
mulation for quantitative g-factor calculation in grappa reconstructions. Magnetic Resonance
in Medicine 2009; 62:739–746.
[35] Pruessmann KP, Weiger M, Bornert P, Boesiger P. Advances in sensitivity encoding with
arbitrary k-space trajectories. Magnetic Resonance in Medicine 2001; 46:638–651.
[36] Fessler JA, Sutton BP. Nonuniform fast fourier transforms using min-max interpolation. Signal
Processing, IEEE Transactions on 2003; 51:560–574.
[37] Bernstein MA, King KF, Zhou XJ, “Handbook of MRI Pulse Sequence”. Elsevier Academic
Press, MA, USA, 2004.
[38] Bernstein MA, Zhou XJ, Polzin JA, King KF, Ganin A, Pelc NJ, Glover GH. Concomitant
gradient terms in phase contrast mr: Analysis and correction. Magnetic Resonance in Medicine
1998; 39:300–308.
27

[39] Papoulis A. Generalized sampling expansion. Circuits and Systems, IEEE Transactions on
1977; 24:652–654.
[40] Moriguchi H, Duerk JL. Bunched phase encoding (bpe): A new fast data acquisition method
in mri. Magnetic Resonance in Medicine 2006; 55:633–648.
[41] GregoryMetzger XH. Application of interlaced fourier transform to echo-planar spectroscopic
imaging. J Magn Reson 1997; 125:166–170.
28