Concentrations and environmental fate of Ra in cation-exchange regeneration brine waste disposed to...
18
Concentrations and environmental fate of Ra in cation-exchange regeneration brine waste disposed to septic tanks and accumulation in sludge, New Jersey Coastal Plain, USA Zoltan Szabo a, * , Eric Jacobsen a , Thomas F. Kraemer b , Bahman Parsa c a U.S. Geological Survey, 810 Bear Tavern Road, W. Trenton, NJ 08628, USA b U.S. Geological Survey, 12201 Sunrise Valley Road, Reston, VA 20192, USA c N.J. Department of Health and Senior Services, CN-308, Trenton, NJ 08625, USA Accepted 9 November 2007 Available online 21 February 2008 Abstract Concentrations of Ra in liquid and solid wastes generated from 15 softeners treating domestic well waters from New Jersey Coastal Plain aquifers (where combined Ra ( 226 Ra plus 228 Ra) concentrations commonly exceed 0.185 Bq L 1 ) were determined. Softeners, when maintained, reduced combined Ra about 10-fold (<0.024 Bq L 1 ). Combined Ra exceeded 0.185 Bq L 1 at 1 non- maintained system. Combined Ra was enriched in regeneration brine waste (maximum, 81.2 Bq L 1 ), but concentrations in septic- tank effluents receiving brine waste were less than in the untreated ground waters. The maximum combined Ra concentration in aquifer sands (40.7 Bq kg 1 dry weight) was less than that in sludge from the septic tanks (range, 84e363 Bq kg 1 ), indicating Ra accumulation in sludge from effluent. The combined Ra concentration in sludge from the homeowners’ septic systems falls within the range reported for sludge samples from publicly owned treatment works within the region. Published by Elsevier Ltd. Keywords: 226 Ra; 228 Ra; 40 K; Alpha-particle radioactivity; Gamma-ray spectroscopy; Ground water; Cation exchange; Acidity; Septic system; Sludge 1. Introduction In 2000, the U.S. Environmental Protection Agency (USEPA) finalized a maximum contaminant level (MCL) of 0.555 Bq L 1 (15 pCi L 1 ) for gross alpha-particle activity and 0.185 Bq L 1 (5 pCi L 1 ) for combined Ra (sum of 226 Ra and 228 Ra) (USEPA, 2000a). Radium is a known human carcinogen that poses health risk when ingested (Mays et al., 1985; USEPA, 1999). Both 226 Ra, an alpha-particle emitter, and 228 Ra, a beta-particle emitter, have sufficiently long half-lives (1602 and 5.75 years, respectively) to accumulate on a time scale of years when extracted from water or brine, whereas 224 Ra, with a half-life of 3.64 days, is less likely to accumulate (unsupported) to levels of concern. * Corresponding author. Tel.: þ1 609 771 3929; fax: þ1 609 771 3915. E-mail address: [email protected] (Z. Szabo). 0265-931X/$ - see front matter Published by Elsevier Ltd. doi:10.1016/j.jenvrad.2007.11.009 www.elsevier.com/locate/jenvrad Available online at www.sciencedirect.com Journal of Environmental Radioactivity 99 (2008) 947e964
-
Upload
zoltan-szabo -
Category
Documents
-
view
214 -
download
0
Transcript of Concentrations and environmental fate of Ra in cation-exchange regeneration brine waste disposed to...

Available online at www.sciencedirect.com
Concentrations and environmental fate of Ra in cation-exchange
erseyined.non-
eptic-ion incatings falls
ystem;
www.elsevier.com/locate/jenvradJournal of Environmental Radioactivity 99 (2008) 947e964
regeneration brine waste disposed to septic tanks andaccumulation in sludge, New Jersey Coastal Plain, USA
Zoltan Szabo a,*, Eric Jacobsen a, Thomas F. Kraemer b, Bahman Parsa c
a U.S. Geological Survey, 810 Bear Tavern Road, W. Trenton, NJ 08628, USAb U.S. Geological Survey, 12201 Sunrise Valley Road, Reston, VA 20192, USA
c N.J. Department of Health and Senior Services, CN-308, Trenton, NJ 08625, USA
Accepted 9 November 2007
Available online 21 February 2008
Abstract
Concentrations of Ra in liquid and solid wastes generated from 15 softeners treating domestic well waters from New JCoastal Plain aquifers (where combined Ra (226Ra plus 228Ra) concentrations commonly exceed 0.185 Bq L�1) were determSofteners, when maintained, reduced combined Ra about 10-fold (<0.024 Bq L�1). Combined Ra exceeded 0.185 Bq L�1 at 1maintained system. Combined Ra was enriched in regeneration brine waste (maximum, 81.2 Bq L�1), but concentrations in stank effluents receiving brine waste were less than in the untreated ground waters. The maximum combined Ra concentrataquifer sands (40.7 Bq kg�1 dry weight) was less than that in sludge from the septic tanks (range, 84e363 Bq kg�1), indiRa accumulation in sludge from effluent. The combined Ra concentration in sludge from the homeowners’ septic systemwithin the range reported for sludge samples from publicly owned treatment works within the region.Published by Elsevier Ltd.
Keywords: 226Ra; 228Ra; 40K; Alpha-particle radioactivity; Gamma-ray spectroscopy; Ground water; Cation exchange; Acidity; Septic s
Sludge
1. Introduction
L) ofm ofestedhave
actedels of
In 2000, the U.S. Environmental Protection Agency (USEPA) finalized a maximum contaminant level (MC0.555 Bq L�1 (15 pCi L�1) for gross alpha-particle activity and 0.185 Bq L�1 (5 pCi L�1) for combined Ra (su226Ra and 228Ra) (USEPA, 2000a). Radium is a known human carcinogen that poses health risk when ing(Mays et al., 1985; USEPA, 1999). Both 226Ra, an alpha-particle emitter, and 228Ra, a beta-particle emitter,sufficiently long half-lives (1602 and 5.75 years, respectively) to accumulate on a time scale of years when extrfrom water or brine, whereas 224Ra, with a half-life of 3.64 days, is less likely to accumulate (unsupported) to levconcern.
* Corresponding author. Tel.: þ1 609 771 3929; fax: þ1 609 771 3915.
E-mail address: [email protected] (Z. Szabo).
0265-931X/$ - see front matter Published by Elsevier Ltd.
doi:10.1016/j.jenvrad.2007.11.009
Concentrations of Ra isotopes in water samples from the aquifers of the New Jersey Coastal Plain have beengical1997Newothyzabo
unitss thatdingset al.,rs fore me-rinestheyCl in
et al.,aste
ludgeantial
into
waterthatthe
urcestions
Ra inse ofangetemssedi-mentight
948 Z. Szabo et al. / Journal of Environmental Radioactivity 99 (2008) 947e964
identified as frequently exceeding the combined Ra MCL. In a series of studies conducted by the U.S. GeoloSurvey (USGS) in cooperation with the New Jersey Department of Environmental Protection (NJDEP) fromto 2002, concentrations of Ra isotopes in water samples from the 2 major unconfined aquifer systems in theJersey Coastal Plain, the KirkwoodeCohansey in southeastern New Jersey and the PotomaceRaritaneMagimmediately adjoining the Fall Line (see Fig. 1 for general location), were determined (Focazio et al., 2001; Set al., 2005). Combined Ra activities were greater than 0.185 Bq L�1 in 31% of samples.
Water softeners (cation-exchange units) are widely available and are convenient whole-house Ra treatmentfor domestic well water, because the units efficiently remove Ra (about 90% removal) along with constituentcause water hardness, such as Ca and Mg, as well as other cationic constituents such as Fe (Lucas, 1987). The finregarding widespread elevated Ra concentrations in ground water in New Jersey (Kozinski et al., 1995; Szabo2005), as well as elsewhere in the country (Focazio et al., 2001) have led to the increased use of water softenepurposes of Ra removal (NJDEP, 2004). Proper maintenance includes regular regeneration of the cation-exchangdia with sodium (Na) or potassium (K) chloride (Cl) brine solutions (Bowie, 1995). The waste (regeneration) b(presumably bearing large concentrations of Ra) commonly are flushed to septic systems. It is assumed that thereare diluted and dispersed to the environment. The regeneration brine wastes are suspected to be a major source ofwater in shallow aquifers where unsewered residential development has taken place (Thomas, 2000; Barringer2006). The concentrations of Ra within the various waste media and the environmental fate of the Ra-bearing whave been little studied, warranting this investigation. There is also a potential issue related to the hauling of sfrom private septic tanks to publicly owned treatment works (POTWs), whether Ra from this source is a substcontribution to the overall load at the southern New Jersey POTWs depending on whether or not Ra is sequesteredsludges within the septic tanks.
The disposal of waste residuals from treatment processes designed to remove radionuclides from drinkinghas long been of concern (Parrotta, 1991). The national assessment of radionuclide concentrations, includingof Ra, in waste sludge from POTWs found that the highest concentrations of Ra were present in sludge fromAtlantic Coastal Plain region (ISCORS, 2003). The contribution of Ra to the POTW sludge from private sowas addressed indirectly by considering them as a source, but independent measurements of Ra concentrawere not made.
This study characterizes Ra concentration in waste media associated with the cation-exchange treatment ofdrinking water in the (rarely studied) private-well setting in the Coastal Plain of New Jersey (Fig. 1). The phastudy detailed in this article examined the fate of Ra from entry into the home, sequestration onto the cation-exchresin, sequestration into cation-exchange regenerative brine waste, and disposal of the brine wastes into septic sys(Fig. 2). The Ra concentrations in sludge were compared to Ra concentrations in native soils and vadose-zonements that were sampled at locations near the homes from where the sludge was obtained to provide initial assessof the relative importance of Ra in the sludge relative to the soil in the local areas that are typical of those that mreceive sludge-bearing soil amendments.
2. Sampling and analytical methods
whereithoutrowlyivate-Jerseyta de-esternbeachns of, and
2.1. Sampling location
Residential sites were considered where cation-exchange treatment units were used to soften domestic well water andregeneration brine waste disposal was to septic tanks that had not been evacuated for at least a year. Control sites wcation-exchange treatment systems were not included as part of the sampling effort, because the objective of this narfocused study was to characterize the concentration and fate of Ra in water-treatment waste disposal media. The prwell sampling network consisted of 18 sites, 15 of which were in the Coastal Plain of southern and central New(Fig. 1). The wells were completed either in the unconsolidated iron-rich, occasionally feldspathic, Cretaceous-age delposits forming the PotomaceRaritaneMagothy aquifer system along the Fall Line (unconformity) that forms the northwboundary of the Coastal Plain (Fig. 1) or in the areally extensive quartzose Miocene and Tertiary age seaward dippingand river sand deposits forming the KirkwoodeCohansey aquifer system farther to the south and east. Detailed descriptiothe geology, hydrology, and chemistry of these aquifers were provided by Zapecza (1989), Kozinski et al. (1995)Kauffman et al. (2001).

2.2. Sampling procedures
994),acting
11407
11406
151520
151522330958330682
291448
51506
231406
230786 231363
231410
110916
231412
231407 MONMOUTH
Areal extent of the unconfined Kirkwood-Cohansey aquifer system
Site and number
EXPLANATION
110916
FALL LINE
75°
40°30’
40°
39°
74°
0
0
10
10
20 MILES
20 KILOMETERS
110694
330681151059151056
Soil core site and number330681
39°30’
74°30’75°30’
370498
41°
Potomac-Raritan-Magothy aquifer system adjoins the Fall Line
151053
Fig. 1. Sampling-site locations for Ra in ground water, in waste products, and in soils, New Jersey Coastal Plain, 2003e2004.
949Z. Szabo et al. / Journal of Environmental Radioactivity 99 (2008) 947e964
Most aspects of the ground-water low-level trace-element sampling techniques recommended by Horowitz et al. (1Ivahnenko et al. (1996), and Olson and DeWild (1999), including acid (5% HCl) purges and soaks of all equipment cont

the samples, to preserve sample integrity were incorporated into the sampling program, including that for the waste media.Table 1 summarizes the sampling equipment used, the equipment cleaning process, the type of samples collected, and sample
ed re-usingted asof theashed
staltic0-mmsitingnative
bailera stiff. The
Pumping fromwell
Septicsystem
NOT TO SCALE
EXPLANATION
Water table
Ground-water flow
1. Initial radium source from aquifer: well water for drinking, into the home --> 2. Human ingestion exposure endpoint: treated drinking water after flow through treatment unit--> 3. Radium-brine waste: regeneration brine waste discharge from treatment unit--> 4. Septic system: 4a. Septic system effluent (liquid), and/or 4b. Septic sludge (solid)--> 5. Environmental dispersion: Shallow ground water (at the water table) from shallow observation well downgradient of shallow soil in leachfield receiving briny effluent waste.
2
1
3
4ab
5
Treatmentsystem waste
Water tablesampling point
Media 1-4detailed this article
Fig. 2. Sampling scheme, including Ra in ground water and in components of treatment in the home including treated water, regeneration waste
brine, septic effluent after brine disposal to septic systems, and sludge. Dispersal of the septic waste effluents to the environment is described in
a companion study (Szabo et al., submitted for publication).
950 Z. Szabo et al. / Journal of Environmental Radioactivity 99 (2008) 947e964
preservation.
2.2.1. Brine wastes from cation-exchange regenerationThe regeneration cycle for the cation-exchange treatment units was initiated manually as close as possible to the schedul
generation brine cycle set by the automatic timers included with the units. The volume of water treated was estimated eitherwater meters already existing in the systems or on the basis of household size, assuming average water use per resident (repor340 L/day (85 gallons/day) in New Jersey; Hutson et al., 2004), and the operating parameters of the system. About one-thirdregeneration brine waste flow was diverted and composited throughout the 20e30 min regeneration period into an acid w20-L polyethylene container.
2.2.2. Septic-tank liquidsSeptic-tank liquids were pumped directly from 4 to 5 points in the septic tank (Miller, 1996) using a high-volume peri
pump with pre-cleaned Teflon-lined polyethylene tubing. The septage effluent (liquids) then were filtered through a 10mesh polyethylene or nylon bag to remove solid particles, discharged directly into a pre-cleaned polyethylene bucket (compoand homogenization), and pumped through a 0.45-mm polysulfone filter into sample bottles in a manner similar to samplingground water as described by Ivahnenko et al. (1996).
2.2.3. Septic-tank solidsSamples of the moderately thick settled sludge were collected from the bottom of the septic tank by scooping with a
with a 1-way valve or by pumping with a vacuum. Sludge/sediment from the bottom of each tank was collected into2.5-cm PVC tube with a ball-type check valve (ColeeParmer F/07090-11 or equivalent) to prevent backflow (Table 1)

average thickness of the settled sludge/sediment layer within the septic tank was determined by measurement of the level ofsludge within the PVC bailer. The tube was drained into a 30-L polyethylene bucket lined with a 100-mm mesh nylon filter
996).sablechest
, andHach
o, butlong
ptions
licateckets,ment
tationod or
Table 1
Filtration and sampling equipment, sampling bottles, and generalized equipment cleaning scheme for sampling
Pore size
(micron)
Manufacturer,
product
Design Surface
area (m2)
Material Pre-cleaning
Filters
0.45 Gelman 12175 Tortuous-path capsule 0.071 Polysulfone 16-h 5% HCl soak and
DI rinse (Olson and DeWild, 1999)
100 ColeeParmer K-1523-70 2 L Bag filter 0.18 Nylon DI rinse
Type Sample type Preservation
Sampling bottles
High-density polyethylene, acid washed, 0.25 L Trace elements, major cations Nitric acid to pH 2
High-density polyethylene, acid washed, 1 L and 8 L Radionuclides Nitric acid to pH 2
High-density polyethylene, 0.5 L Chloride None
High-density polyethylene, opaque, 0.125 L Nutrients Stored at 4 �C
High-density polyethylene, acid washed, 20 L Sludge Dried at 104 �C for analysis
Polyethylene, wide-mouth, 0.25 L Sediment Air dried for analysis
Type Sample type Pre-cleaning
Tubing, pumping equipment
High-density Teflon-lined polyethylene tubing
(Jensen Inert TTL 0308-0102)
All pumped samples, including
septic-tank effluent
Sequential soapy water, 5% HCl,
and DIW rinse (Ivahnenko et al., 1996)
Mechanical bladder pump (Geoprobe MB470) Ground water 5% HCl and DIW rinse of Teflon bladder
Corrugated rubber tubing with 2-way steel flow splitting valve Septage (sludge, effluent) Rinse with native septage
Polyethylene bailer with 1-way valve Septage (sludge, effluent) DIW rinse
Hand pump, tubing, and check valve (ColeeParmer F/07090-11) Septage (sludge, effluent) DIW rinse
HCl, hydrochloric acid; DIW, de-ionized water. Any use of trade, product or firm names is for descriptive purposes only and does not imply
endorsement by the U.S. Government or the State of New Jersey.
951Z. Szabo et al. / Journal of Environmental Radioactivity 99 (2008) 947e964
bag. Multiple grab samples were collected from up to 5 locations from the bottom of the tank and composited (Miller, 1The nylon filter bags were allowed to drain liquid for 1e2 h. The composited sludge was oven dried at 104 �C. Dispomasks, gloves, and Tyvek suits were worn during sample collection with dosimeters (Global Dosimetry Solutions) wornheight.
2.2.4. Ground-water samplingThe private supply wells were purged for a period of 30e60 min until physical and chemical properties were stabilized
water turbidity was lowered to levels on the order of 0.5e2.0 NTU. Turbidity was monitored every 3e5 min by use of aRatio/2100P Portable Turbidimeter (Ivahnenko et al., 1996; Wilde and Radtke, 1999).
2.2.5. Soil coringSoil coring of the unsaturated zone overlying the KirkwoodeCohansey aquifer system was completed at 5 sites adjacent t
not exactly co-located with, the domestic well sites sampled from that aquifer (Fig. 1). Split-spoon samples of the soil, 0.61-mwere collected in butyl acetate liners. Samples (200 g) most representative of overall lithology on the basis of field descriwere selected for gamma-ray spectroscopy after extrusion and air drying in the laboratory.
2.2.6. Quality assuranceFor quality control and to determine variability that may have occurred in constituent concentrations during sampling, rep
samples were collected of one or more matrix at 12 sites. For composited wastes, the replicates were collected from the bufilling each sample bottle partway, and then alternating to the other bottle, back and forth, till both bottles were filled. Equipblanks were collected before fieldwork was initiated to insure adequacy of cleaning procedures.
2.3. Analytical methods
Concentrations of Ra radionuclides were determined after chemical separation from the water sample by co-precipiwith barium or lead sulfate (Table 2). Concentrations of 226Ra were determined either by the planchet counting meth

the 222Rn de-emanation method (Krieger and Whittaker, 1980); the latter is the more sensitive technique (USEPA, 1997). Con-centrations of 228Ra were determined by the beta counting of the ingrown 228Ac progeny (Parsa and Hoffman, 1992; USEPA,
n datatimes
ction,dmin-
withon ofafter
scopyn ap-
alysesndard
Table 2
Description of methods for analysis of ground water, cation-exchange regeneration brine waste, septic effluent, and soil and sludge samples col-
lected by the U.S Geological Survey at domestic well sites, New Jersey Coastal Plain, 2003e2004
Constituent Laboratory reporting level Method Citation
226Ra 0.0037 Bq L�1 222Rn de-emanation (EPA 903.1) USEPA (1997)226Ra Variable,
0.0111e0.0185 Bq L�1Planchet count after barium sulfate co-precipitation
(EPA 903.0)
Krieger and Whittaker (1980)
228Ra Variable,
0.0185e0.037 Bq L�1Beta counting of 228Ac ingrowth after barium or
lead co-precipitation (EPA 904.0)
USEPA (1997), Parsa and
Hoffman (1992)224Ra Variable,
0.0111e0.0185 Bq L�1Gamma spectroscopy after barium or
lead co-precipitation
Parsa (1998),
Focazio et al. (2001)
Gross alpha
(48e72 h and
30 day holding time)
Variable,
0.037e0.111 Bq L�1Low-background proportional count (EPA 900.0)
after evaporation for low dissolved solids ground
water or drinking water samples or after
co-precipitation for high dissolved solids brine
or septic effluent samples
Parsa (1998), USEPA (1997)
Gross beta
(48e72 h and
30 day holding time)
Variable,
0.037e0.148 Bq L�1Low-background proportional count after
evaporation (EPA 900.0)
Krieger and Whittaker (1980)
pH 0.1 standard units Field electrode Wilde and Radtke (1999)
Specific conductance 1 microsiemen per
centimeter (mS cm�1)
Field electrode Wilde and Radtke (1999)
Major cations and iron Variable by analyte;
0.001e0.02 mg L�1Inductively coupled plasma-optical spectroscopy
(ICP-OES)
Harris et al. (1997)
Uranium, select
trace elements
Variable by analyte;
typically 0.0002 mg L�1Inductively coupled plasma-Mass spectrometry
(ICP-MS)
Faires (1993)
Nitrate plus nitrite;
nitrite; ammonia;
chloride
0.1; 0.01; 0.02, all
as mg L�1 N; and
0.1 mg L�1, respectively
Ion chromatography Fishman and Friedman (1989)
Ra isotopes, equivalent,
in soil or sludge
Variable, about
1.7e3.5 Bq kg�1Gamma spectroscopy with density correction Nemeth and Parsa (1992)
1 Bq L�1¼ 27.027 pCi L�1.
952 Z. Szabo et al. / Journal of Environmental Radioactivity 99 (2008) 947e964
1997). The relatively high laboratory reporting level (LRL) of 228Ra was a limitation in obtaining quantifiable concentratiofor media containing low Ra concentrations such as the treated drinking water, as the LRL for 228Ra typically was 3e5higher than that of 226Ra.
Gross alpha-particle and beta-particle activity was generally analyzed within 48 h (maximum, 72 h) after sample colleas recommended for monitoring programs by USEPA (USEPA, 2000b) and required by the State of New Jersey (NJ Aistrative Code, 2002) on the basis of the studies of Parsa (1998). Activities were determined using planchet counting230Th and 137Cs as the standards, respectively. A modification of the co-precipitation technique was used for preparatithose samples with specific conductance greater than about 1000 mS/cm. More than half the samples were re-counted30 days.
Background soil samples and dried sludge were analyzed for equivalent Ra by detecting progeny with gamma spectrousing a plate detector (about 10% efficiency) and polyethylene sample containers with fixed geometry with density correctioplied (Nemeth and Parsa, 1992). Analytical precision was poor for low-weight sludge samples (less than 100 g), and those anare not reported here. Concentrations of non-radioactive inorganic constituents in liquid phases were determined by stamethods (Table 2). Dilution was used for liquid samples with specific conductance greater than 2000 mS/cm.
2.4. Statistical and mass-balance methods
rationed onantialartile
To characterize the Ra in the sampled media, the quartiles (median, and the 25th and 75th percentile) of the Ra-concentdata are reported, as are the minima or maxima. Concentration ratios were computed and mass ratios were estimated (basthe estimated flows; see Supplementary information) as the Ra was transferred from media to media. Because of the substvariability (as with the concentration data), ratio and mass transfer results are presented in terms of the median and inner-qurange.

3. Results
atoryvari-catesgen-
dard-10%)ivity,et ofgrosserlap
fromn forticalples
s thesults
ered,ivelytions(the
L�1).wasents
istentand
ctionrticleL�1.
rticleearlyners
ped by
953Z. Szabo et al. / Journal of Environmental Radioactivity 99 (2008) 947e964
3.1. Quality assurance (equipment blanks and replicates)
Neither radionuclide of Ra was detected in the equipment-blank samples. Sequential replicate and laborduplicate samples reasonably reproduced results for the initial environmental samples, considering the highlyable nature of the media sampled. The median relative percent differences (RPDs) from the grouping of replifrom the more dilute media of ground water and treated water as well as the more concentrated media of reeration brine wastes and septic effluents were less than the median values of the relative analytical 2-standeviation precision estimate of the individual sample analyses for these media (Table 3). One set of 10 (replicate results for samples from the more dilute media for concentrations of 228Ra, gross alpha-particle actand gross beta-particle activity were outside the range of overlap of the respective precision estimates. One s7 (14%) replicate results for samples from the more concentrated media for concentrations of 228Ra andalpha-particle activity, and 3 sets of 6 (50%) for gross beta-particle activity were outside the range of ovof the respective precision estimates.
The maximum RPDs for gross alpha-particle and beta-particle activities, and for 226Ra and 228Ra werereplicate samples of regeneration brine waste and septic effluent, and the value of the median relative precisiogross alpha-particle and gross beta-particle activities with the high total dissolved solids (TDS) was greater (analyprecision was lower) in the waste media than in more dilute media; the analytical methods perform best in samwith TDS typical of drinking water (Krieger and Whittaker, 1980). The moderate analytical precision indicateneed for repeat testing to gain increased confidence in the individual results. Differences among replicate rewere generally on the order of the (modest) analytical precision.
3.2. Ra concentrations and radioactivity in untreated ground water
The maximum concentrations of 226Ra plus 228Ra were 1.54 and 0.333 Bq L�1 (41.5 and 9.0 pCi L�1) in filtuntreated water from the KirkwoodeCohansey and PotomaceRaritaneMagothy aquifer systems, respect(Fig. 3). (Analytical results for all the samples are presented by Deluca et al., 2006.) The combined Ra concentrain 10 of the 15 wells sampled were greater than 0.1 Bq L�1 and in 6 (40%) were greater than 0.185 Bq L�1
USEPA 5 pCi L�1 MCL). The median combined Ra concentration for all the sites was 0.152 Bq L�1 (4.1 pCiBoth the median value of the combined Ra concentrations and the frequency at which the 0.185 Bq L�1 MCLexceeded are about the same as for the data from the New Jersey Coastal Plain regional-scale aquifer assessm(Kozinski et al., 1995; Szabo et al., 2005). The median pH of the ground-water samples was 4.9, also conswith the previously determined median. The maximum concentrations of 226Ra and 228Ra were 0.8060.729 Bq L�1, respectively (Table 4), and the maximum gross alpha-particle activity 72 h after sample collewas 4.22 Bq L�1 in filtered untreated water from the KirkwoodeCohansey aquifer system. The gross alpha-paactivities in 6 of the 15 wells sampled were greater than 0.555 Bq L�1 (Fig. 4) and in 3 were greater than 1 BqThe median alpha-particle activity for all the sites was 0.41 Bq L�1 (11 pCi L�1). The highest gross alpha-paactivities correspond to the highest concentrations of 226Ra. In the aquifers of the New Jersey Coastal Plain, nall of the gross alpha-particle activity is derived from 226Ra and 224Ra (Szabo et al., 2005), and thus homeow
Table 3
Median relative analytical precision estimate and relative percent difference for replicates for analyses of radionuclides or radioactivity, grou
dilute (ground water and treated water) or more concentrated sample type (brine waste, septic-tank effluent), for homeowner study, New Jersey
Coastal Plain, 2003e2004
Quality-assurance measure 226Ra (%) 228Ra (%) Alpha activity (48e72 h) (%) Beta activity (48e72 h) (%)
Dilute samples
Median relative analytical precision estimate 37 38 46 20
Median relative percent difference, replicates 16 6 20 24
More concentrated samples
Median relative analytical precision estimate 8 21 52 30
Median relative percent difference, replicates 16 16 23 15
Relative precision was biased high by low results for treated water.

test their drinking water for gross alpha-particle activity (NJDEP, 2004) instead of individual Ra isotopes. The max-�1 the
water
temsntra-
ethodalue,oval,alue,tivity.le ra-mumt one
binede not
*
*
*
*
*
*
** *
0.1
1
10
100
SITES SAMPLED
1109
16
0114
06
0114
07
3306
82
3309
58
1515
22
1515
20
0515
06
2914
48
Ground water (well)TreatedRegeneration brine wasteSeptic effluent
0.01
0.001
2314
06
2314
12
2314
07
2314
10
2313
63
2307
860.0001
Not
mai
ntai
ned
Mai
ntai
ned
Kirkwood-Cohanseyaquifer system
Potomac-Raritan-Magothy aquifer system
5 pCi/L MCL
ND ND ND
ND No data
Not
mai
ntai
ned
ND
* Only 226Ra determined
226 R
AD
IU
M P
LU
S 228R
AD
IU
M, B
EC
QU
ER
EL
S P
ER
L
IT
ER
Fig. 3. Concentrations of 226Ra plus 228Ra, by media in the treatment process, for sites in the KirkwoodeCohansey and PotomaceRaritane
Magothy aquifer systems, New Jersey Coastal Plain, 2003e2004. The upper horizontal dashed line indicates 0.185 Bq L�1, the USEPA 5 pCi L�1
MCL.
954 Z. Szabo et al. / Journal of Environmental Radioactivity 99 (2008) 947e964
imum gross beta-particle activity 72 h after sample collection was 1.76 Bq L in filtered untreated water fromKirkwoodeCohansey aquifer system. Both 228Ra and 40K contribute substantially to the beta-particle activity offrom the southern New Jersey aquifer systems (Welch et al., 1995).
3.3. Ra concentrations and radioactivity in cation-exchange treated water
The concentrations of combined Ra or of 226Ra in the water after passage through the cation-exchange systypically were below 0.1 Bq L�1 (only 2 samples had concentrations greater than this value, Fig. 3); and concetions were often at or below the LRL of 0.0037 Bq L�1 for 226Ra determined by the 222Rn de-emanation m(USEPA, 1997) (Table 2). Typical removal of 226Ra was on the order of 90% (median, 91%; 75th percentile v96%). The substantial removal of Ra also decreased the amount of alpha-particle radioactivity (median rem71%; 75th percentile value, 94%) and beta-particle radioactivity (median removal, 82%; 75th percentile v90%). At site 230786, where KCl was used as the salt for the regeneration brine, the gross beta-particle acincreased post treatment, but otherwise also was typically lowered (see Fig. SI-1, Supplementary information)
At 3 sites (of 15 or 20%) in the Coastal Plain, cation-exchange did not substantially reduce the alpha-particdioactivity (first quartile, 37% removal), and the Ra concentration was little reduced either (as indicated by maxivalues in Table 5). The details for these 3 sites (sites 110916, 330958, and 231363) are visible in Figs. 3 and 4. Asite, a non-maintained cation-exchange treatment unit provided cation-exchange ‘‘treated’’ water that had comRa concentration greater than 0.185 Bq L�1 (the USEPA MCL). In 2 of these 3 situations, homeowners wer
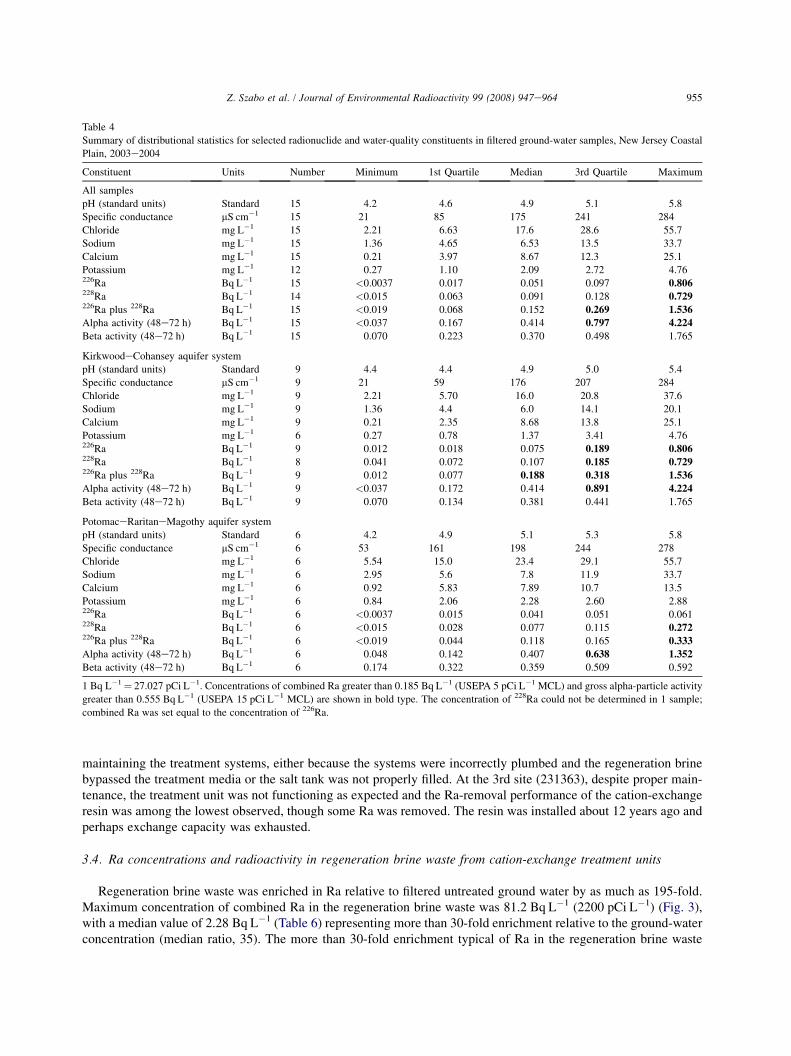
maintaining the treatment systems, either because the systems were incorrectly plumbed and the regeneration brineain-
angeo and
-fold.g. 3),
ateraste
Table 4
Summary of distributional statistics for selected radionuclide and water-quality constituents in filtered ground-water samples, New Jersey Coastal
Plain, 2003e2004
Constituent Units Number Minimum 1st Quartile Median 3rd Quartile Maximum
All samples
pH (standard units) Standard 15 4.2 4.6 4.9 5.1 5.8
Specific conductance mS cm�1 15 21 85 175 241 284
Chloride mg L�1 15 2.21 6.63 17.6 28.6 55.7
Sodium mg L�1 15 1.36 4.65 6.53 13.5 33.7
Calcium mg L�1 15 0.21 3.97 8.67 12.3 25.1
Potassium mg L�1 12 0.27 1.10 2.09 2.72 4.76226Ra Bq L�1 15 <0.0037 0.017 0.051 0.097 0.806228Ra Bq L�1 14 <0.015 0.063 0.091 0.128 0.729226Ra plus 228Ra Bq L�1 15 <0.019 0.068 0.152 0.269 1.536
Alpha activity (48e72 h) Bq L�1 15 <0.037 0.167 0.414 0.797 4.224
Beta activity (48e72 h) Bq L�1 15 0.070 0.223 0.370 0.498 1.765
KirkwoodeCohansey aquifer system
pH (standard units) Standard 9 4.4 4.4 4.9 5.0 5.4
Specific conductance mS cm�1 9 21 59 176 207 284
Chloride mg L�1 9 2.21 5.70 16.0 20.8 37.6
Sodium mg L�1 9 1.36 4.4 6.0 14.1 20.1
Calcium mg L�1 9 0.21 2.35 8.68 13.8 25.1
Potassium mg L�1 6 0.27 0.78 1.37 3.41 4.76226Ra Bq L�1 9 0.012 0.018 0.075 0.189 0.806228Ra Bq L�1 8 0.041 0.072 0.107 0.185 0.729226Ra plus 228Ra Bq L�1 9 0.012 0.077 0.188 0.318 1.536
Alpha activity (48e72 h) Bq L�1 9 <0.037 0.172 0.414 0.891 4.224
Beta activity (48e72 h) Bq L�1 9 0.070 0.134 0.381 0.441 1.765
PotomaceRaritaneMagothy aquifer system
pH (standard units) Standard 6 4.2 4.9 5.1 5.3 5.8
Specific conductance mS cm�1 6 53 161 198 244 278
Chloride mg L�1 6 5.54 15.0 23.4 29.1 55.7
Sodium mg L�1 6 2.95 5.6 7.8 11.9 33.7
Calcium mg L�1 6 0.92 5.83 7.89 10.7 13.5
Potassium mg L�1 6 0.84 2.06 2.28 2.60 2.88226Ra Bq L�1 6 <0.0037 0.015 0.041 0.051 0.061228Ra Bq L�1 6 <0.015 0.028 0.077 0.115 0.272226Ra plus 228Ra Bq L�1 6 <0.019 0.044 0.118 0.165 0.333
Alpha activity (48e72 h) Bq L�1 6 0.048 0.142 0.407 0.638 1.352
Beta activity (48e72 h) Bq L�1 6 0.174 0.322 0.359 0.509 0.592
1 Bq L�1¼ 27.027 pCi L�1. Concentrations of combined Ra greater than 0.185 Bq L�1 (USEPA 5 pCi L�1 MCL) and gross alpha-particle activity
greater than 0.555 Bq L�1 (USEPA 15 pCi L�1 MCL) are shown in bold type. The concentration of 228Ra could not be determined in 1 sample;
combined Ra was set equal to the concentration of 226Ra.
955Z. Szabo et al. / Journal of Environmental Radioactivity 99 (2008) 947e964
bypassed the treatment media or the salt tank was not properly filled. At the 3rd site (231363), despite proper mtenance, the treatment unit was not functioning as expected and the Ra-removal performance of the cation-exchresin was among the lowest observed, though some Ra was removed. The resin was installed about 12 years agperhaps exchange capacity was exhausted.
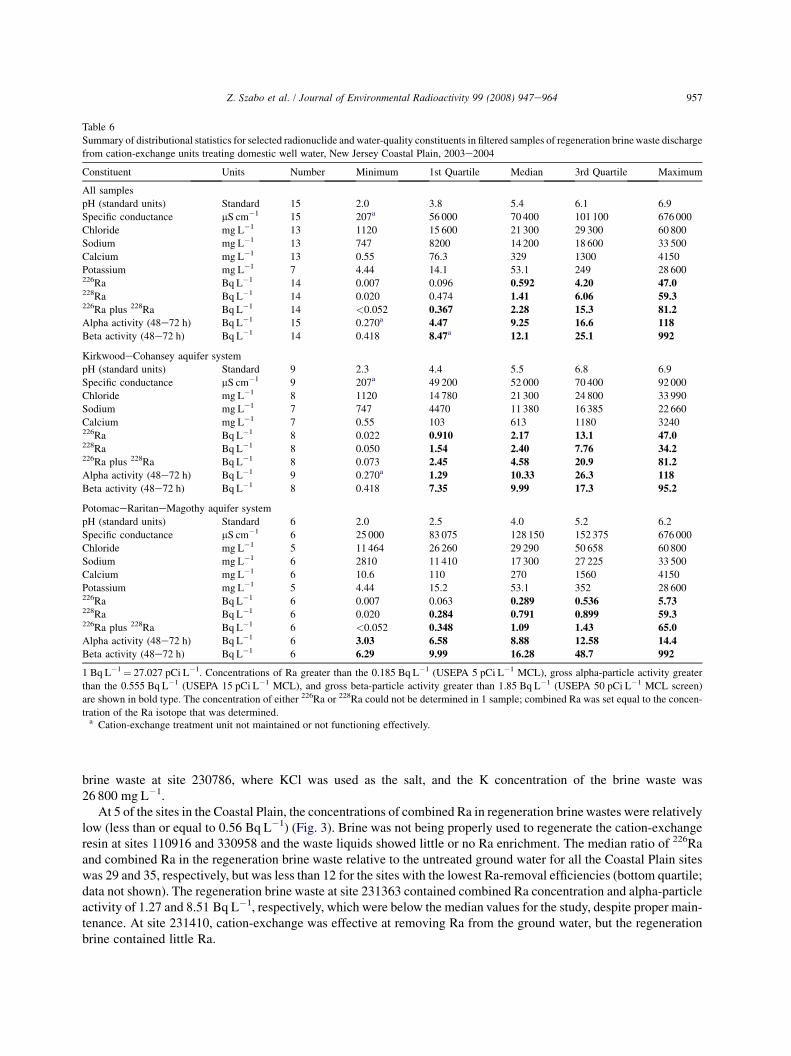
3.4. Ra concentrations and radioactivity in regeneration brine waste from cation-exchange treatment units
Regeneration brine waste was enriched in Ra relative to filtered untreated ground water by as much as 195Maximum concentration of combined Ra in the regeneration brine waste was 81.2 Bq L�1 (2200 pCi L�1) (Fiwith a median value of 2.28 Bq L�1 (Table 6) representing more than 30-fold enrichment relative to the ground-wconcentration (median ratio, 35). The more than 30-fold enrichment typical of Ra in the regeneration brine w

relative to the ground water is consistent with the typical 90e95% Ra-removal rate from the incoming ground water.226 228 �1 spec-
stem,tivityKirk-ation
0.001
0.01
0.1
1
10
100
1,000G
RO
SS
A
LP
HA
-P
AR
TIC
LE
A
CT
IV
IY
TY
, B
EC
QU
ER
EL
S P
ER
L
IT
ER
15 pCi/L MCL
Ground water (well)TreatedRegeneration brine wasteSeptic effluent
Kirkwood-Cohanseyaquifer system Potomac-Raritan-
Magothy aquifer system
SITES SAMPLED
1109
16
0114
06
0114
07
3306
82
3309
58
1515
22
1515
20
2314
07
2314
10
2313
63
0515
06
2914
48
2314
06
2314
12
2307
86
Fig. 4. Gross alpha-particle activities, by media in the treatment process, for sites in the KirkwoodeCohansey and PotomaceRaritaneMagothy
aquifer systems, New Jersey Coastal Plain, 2003e2004. The horizontal dashed line indicates 0.555 Bq L�1, the USEPA 15 pCi L�1 MCL.
956 Z. Szabo et al. / Journal of Environmental Radioactivity 99 (2008) 947e964
The maximum concentrations of Ra and Ra in regeneration brine wastes were 47.0 and 59.3 Bq L , retively, with the former from a treatment system that derived water from the KirkwoodeCohansey aquifer syand the latter, from the PotomaceRaritaneMagothy aquifer system (Table 6). Maximum gross alpha-particle acwas 118 Bq L�1 (3180 pCi L�1) in regeneration brine waste from a treatment system that derived water from thewoodeCohansey aquifer system (Fig. 4). The maximum gross beta-particle activity was 992 Bq L�1 in regener
Table 5
Summary of distributional statistics for selected radionuclide and water-quality constituents in treated (cation exchange) drinking water, New Jersey
Coastal Plain, 2003e2004
Constituent Units Number Minimum 1st Quartile Median 3rd Quartile Maximum
All samples
pH (standard units) Standard 14 4.9 6.1 6.7 7.0 7.9
Specific conductance mS cm�1 14 95.8 200 245 285 521
Chloride mg L�1 8 5.58 35.2 41.5 55.7 75.4
Sodium mg L�1 15 2.5 13.4 28.2 47.3 88.2
Calcium mg L�1 14 0.01 0.09 0.69 11.4 184a
Potassium mg L�1 6 0.095 0.18 0.91 2.62 89.6226Ra Bq L�1 15 <0.0037 <0.0037 <0.0037 0.006 0.152a
228Ra Bq L�1 6 <0.015 <0.0015 0.011 0.078 0.276a
Alpha activity (48e72 h) Bq L�1 15 <0.019 0.0032 0.062 0.150 1.500a
Beta activity (48e72 h) Bq L�1 15 <0.037 0.042 0.078 0.231 2.664
1 Bq L�1¼ 27.027 pCi L�1. Concentrations of Ra greater than 0.185 Bq L�1 (USEPA 5 pCi L�1 MCL), gross alpha-particle activity greater than
0.555 Bq L�1 (USEPA 15 pCi L�1 MCL), and gross beta-particle activity greater than 1.85 Bq L�1 (USEPA 50 pCi L�1 MCL screen) are shown
in bold type. The concentration of 228Ra was generally too low to allow quantification and was not determined in every sample.a Cation-exchange treatment unit not maintained.
brine waste at site 230786, where KCl was used as the salt, and the K concentration of the brine waste was�1
ivelyange26Rasitesrtile;rticle
ain-ation
Table 6
Summary of distributional statistics for selected radionuclide and water-quality constituents in filtered samples of regeneration brine waste discharge
from cation-exchange units treating domestic well water, New Jersey Coastal Plain, 2003e2004
Constituent Units Number Minimum 1st Quartile Median 3rd Quartile Maximum
All samples
pH (standard units) Standard 15 2.0 3.8 5.4 6.1 6.9
Specific conductance mS cm�1 15 207a 56 000 70 400 101 100 676 000
Chloride mg L�1 13 1120 15 600 21 300 29 300 60 800
Sodium mg L�1 13 747 8200 14 200 18 600 33 500
Calcium mg L�1 13 0.55 76.3 329 1300 4150
Potassium mg L�1 7 4.44 14.1 53.1 249 28 600226Ra Bq L�1 14 0.007 0.096 0.592 4.20 47.0228Ra Bq L�1 14 0.020 0.474 1.41 6.06 59.3226Ra plus 228Ra Bq L�1 14 <0.052 0.367 2.28 15.3 81.2
Alpha activity (48e72 h) Bq L�1 15 0.270a 4.47 9.25 16.6 118
Beta activity (48e72 h) Bq L�1 14 0.418 8.47a 12.1 25.1 992
KirkwoodeCohansey aquifer system
pH (standard units) Standard 9 2.3 4.4 5.5 6.8 6.9
Specific conductance mS cm�1 9 207a 49 200 52 000 70 400 92 000
Chloride mg L�1 8 1120 14 780 21 300 24 800 33 990
Sodium mg L�1 7 747 4470 11 380 16 385 22 660
Calcium mg L�1 7 0.55 103 613 1180 3240226Ra Bq L�1 8 0.022 0.910 2.17 13.1 47.0228Ra Bq L�1 8 0.050 1.54 2.40 7.76 34.2226Ra plus 228Ra Bq L�1 8 0.073 2.45 4.58 20.9 81.2
Alpha activity (48e72 h) Bq L�1 9 0.270a 1.29 10.33 26.3 118
Beta activity (48e72 h) Bq L�1 8 0.418 7.35 9.99 17.3 95.2
PotomaceRaritaneMagothy aquifer system
pH (standard units) Standard 6 2.0 2.5 4.0 5.2 6.2
Specific conductance mS cm�1 6 25 000 83 075 128 150 152 375 676 000
Chloride mg L�1 5 11 464 26 260 29 290 50 658 60 800
Sodium mg L�1 6 2810 11 410 17 300 27 225 33 500
Calcium mg L�1 6 10.6 110 270 1560 4150
Potassium mg L�1 5 4.44 15.2 53.1 352 28 600226Ra Bq L�1 6 0.007 0.063 0.289 0.536 5.73228Ra Bq L�1 6 0.020 0.284 0.791 0.899 59.3226Ra plus 228Ra Bq L�1 6 <0.052 0.348 1.09 1.43 65.0
Alpha activity (48e72 h) Bq L�1 6 3.03 6.58 8.88 12.58 14.4
Beta activity (48e72 h) Bq L�1 6 6.29 9.99 16.28 48.7 992
1 Bq L�1¼ 27.027 pCi L�1. Concentrations of Ra greater than the 0.185 Bq L�1 (USEPA 5 pCi L�1 MCL), gross alpha-particle activity greater
than the 0.555 Bq L�1 (USEPA 15 pCi L�1 MCL), and gross beta-particle activity greater than 1.85 Bq L�1 (USEPA 50 pCi L�1 MCL screen)
are shown in bold type. The concentration of either 226Ra or 228Ra could not be determined in 1 sample; combined Ra was set equal to the concen-
tration of the Ra isotope that was determined.a Cation-exchange treatment unit not maintained or not functioning effectively.
957Z. Szabo et al. / Journal of Environmental Radioactivity 99 (2008) 947e964
26 800 mg L .At 5 of the sites in the Coastal Plain, the concentrations of combined Ra in regeneration brine wastes were relat
low (less than or equal to 0.56 Bq L�1) (Fig. 3). Brine was not being properly used to regenerate the cation-exchresin at sites 110916 and 330958 and the waste liquids showed little or no Ra enrichment. The median ratio of 2
and combined Ra in the regeneration brine waste relative to the untreated ground water for all the Coastal Plainwas 29 and 35, respectively, but was less than 12 for the sites with the lowest Ra-removal efficiencies (bottom quadata not shown). The regeneration brine waste at site 231363 contained combined Ra concentration and alpha-paactivity of 1.27 and 8.51 Bq L�1, respectively, which were below the median values for the study, despite proper mtenance. At site 231410, cation-exchange was effective at removing Ra from the ground water, but the regenerbrine contained little Ra.

3.5. Ra concentrations and radioactivity in septic-tank liquids
weret the
nitial1 sitef then theange,ngedxceptquids
958 Z. Szabo et al. / Journal of Environmental Radioactivity 99 (2008) 947e964
Concentrations of combined Ra in the septic-tank liquids ranged from 0.026 to 0.243 Bq L�1 (Fig. 3) andtypically about two-thirds (median, 65%; inner-quartile range, 40e104%) that of the untreated ground water aindividual sites. At 5 sites, the combined Ra concentration in the septic-tank liquid equaled or exceeded the iground-water concentration. The 226Ra was higher in the septic system liquid than the ground water at onlyand concentrations of 226Ra were typically about one-third (median, 32%, inner-quartile range, 16e64%) oground-water concentration. Gross alpha-particle radioactivity distribution pattern followed the same trend iseptic-tank liquids as the 226Ra; the median activity was also about one-third (median, 31%; inner-quartile r14e123%) of the ground-water activity (Fig. 4). The gross beta-particle activity in septic-tank liquids, which rafrom 0.108 to 2.775 Bq L�1 (median, 0.715 Bq L�1), was greater than that of the ground water (Tables 4 and 7), efor 2 sites. The concentrations of K ranged from 7.58 to 31.2 mg L�1 (median, 14.1 mg L�1) in the septic-tank liwhereas they ranged from 0.27 to 4.76 mg L�1 (median, 2.09 mg L�1) in the ground water.
Table 7
Summary of distributional statistics for selected radionuclide and water-quality constituents in septic system effluent (liquid component of septage)
receiving ion-exchange regeneration brine from water softening units used to treat domestic well water, New Jersey Coastal Plain, 2003e2004
Constituent Units Number Minimum 1st Quartile Median 3rd Quartile Maximum
All samples
pH (standard units) Standard 11 6.2 6.7 6.8 7.0 7.4
Specific conductance mS cm�1 12 1000 1205 1630 2150 19 790
Chloride mg L�1 12 64.6 174 425 603 6330
Sodium mg L�1 12 37.4 141 280 402 3990
Calcium mg L�1 12 6.56 21.2 26.5 34.8 69.4
Potassium mg L�1 9 7.58 9.57 14.1 15.0 31.2226Ra Bq L�1 12 <0.0037 0.012 0.032 0.066 0.117228Ra Bq L�1 10 0.026 0.057 0.102 0.128 0.242226Ra plus 228Ra Bq L�1 12 0.026 0.036 0.158 0.191 0.243
Alpha activity (48e72 h) Bq L�1 12 <0.037 0.147 0.245 0.382 1.924
Beta activity (48e72 h) Bq L�1 12 0.108 0.478 0.715 0.962 2.775
KirkwoodeCohansey aquifer system
pH (standard units) Standard 7 6.2 6.8 7.0 6.9 7.4
Specific conductance mS cm�1 8 1000 1207 1920 2150 3000
Chloride mg L�1 8 64.6 318 458 603 736
Sodium mg L�1 8 37.4 224 289 402 612
Calcium mg L�1 8 6.56 22.2 30.5 43.5 69.4
Potassium mg L�1 5 7.58 9.57 10.3 17.5 31.2226Ra Bq L�1 7 0.015 0.0301 0.0478 0.0799 0.117228Ra Bq L�1 6 0.043 0.0977 0.102 0.110 0.174226Ra plus 228Ra Bq L�1 7 0.026 0.0523 0.158 0.191 0.237
Alpha activity (48e72 h) Bq L�1 8 <0.037 0.0499 0.207 0.307 0.454
Beta activity (48e72 h) Bq L�1 8 0.108 0.464 0.721 0.962 1.563
PotomaceRaritaneMagothy aquifer system
pH (standard units) Standard 4 6.5 6.7 6.8 6.9 7.0
Specific conductance mS cm�1 4 1150 1210 1290 5965 19 790
Chloride mg L�1 4 155 173 255 1830 6330
Sodium mg L�1 4 114 141 153 1120 3990
Calcium mg L�1 4 16.8 20.1 22.6 25.9 31.8
Potassium mg L�1 4 8.99 12.8 14.4 14.8 15.0226Ra Bq L�1 4 <0.0037 <0.0037 0.0037 0.0153 0.044228Ra Bq L�1 4 0.026 0.0326 0.0839 0.160 0.242226Ra plus 228Ra Bq L�1 4 0.0321 0.0357 0.107 0.194 0.243
Alpha activity (48e72 h) Bq L�1 4 0.178 0.248 0.332 0.776 1.924
Beta activity (48e72 h) Bq L�1 4 0.482 0.522 0.638 1.248 2.775
1 Bq L�1¼ 27.027 pCi L�1. Concentrations of Ra greater than 0.185 Bq L�1 (USEPA 5 pCi L�1 MCL), gross alpha-particle activity greater than
0.555 Bq L�1 (USEPA 15 pCi L�1 MCL), and gross beta-particle activity greater than 1.85 Bq L�1 (USEPA 50 pCi L�1 MCL screen) are shown
in bold type. The concentration of 228Ra could not be determined in 2 samples; combined Ra was set equal to the concentration of 226Ra.

All liquid samples from the septic tanks were considerably different in chemical composition than the native�1 dian,
eater
at orudgeationzonesite
cen-bouteaterivity.d for
d theof Raf the
959Z. Szabo et al. / Journal of Environmental Radioactivity 99 (2008) 947e964
ground water. Especially notable were the high concentrations of Cl (maximum, 6330 mg L ; me425 mg L�1), Ca and Na (Table 7). The pH of the septic effluent was typically at least 1e2 full pH units grthan typical ground water in the sandy Coastal Plain aquifers, ranging from 6.2 to 7.4 (median, 6.8).
3.6. Ra concentration in sludge, soil, and sediment
The combined Ra concentration in soils and sandy sediments from the unsaturated zone and sediments frombelow the water table ranged from 10 to 40.7 Bq kg�1 dry weights (Table 8). The combined Ra concentration in slfrom the septic tanks ranged from 84 to 363 Bq kg�1 dry weights (Table 9). The maximum combined Ra concentrin the sludge is about 10-fold greater than the maximum combined Ra concentration in the sandy soil and vadose-sediments, but the sludge-to-soil combined Ra ratio was about 37 for well site 330682 and nearby soil coring330681 (Fig. 1). Even the minimum combined Ra concentration in the sludge is greater than the maximum contration in the soil or sediment. In contrast with the soil or sediment where the 226Ra to 228Ra ratio was typically a1.0, 226Ra was clearly the predominant source of radioactivity in 2 of the samples of sludge. Combined Ra was grthan 40K in all samples of sludge, whereas, in the soils and sediments, 40K was the predominant source of radioactThe combined Ra concentration in sludge from the homeowners’ septic systems falls within the range reportesludge samples from POTWs from the Atlantic Coastal Plain (ISCORS, 2003).
4. Discussion
4.1. Mass transfer of Ra from wastes to the environment
The mass of Ra being processed in the home ultimately depends upon the amount of water used in the home anconcentration of Ra in the ground water entering the home as potable water from the well. The concentrationsare substantially different in each of the media evaluated in the home treatment system environment. Because o
Table 8
Concentration of equivalent 228Ra and equivalent 226Ra at selected depths in sandy sediment from soil, from the unsaturated zone overlying the
water table or from the water table, in the KirkwoodeCohansey aquifer system at 5 sites in the southwestern part of the New Jersey Coastal Plain
Site
number
Sample depth
below land
surface (m)
Gross lithologic description Equivalent 228Raa
(as 228Ac) (Bq kg�1)
Equivalent 228Raa
(as 212Pb) (Bq kg�1)
Equivalent 226Raa
(as 214Pb) (Bq kg�1)
40K (Bq kg�1)
151056 4.6 Fine, medium, and
coarse sandb16.7� 4.8 18.5� 2.6 22.2� 2.9 137� 55
151056 7.6 Medium sand 20.4� 2.2 20.0� 1.8 18.9� 1.8 96.2� 25.9
151059 1.5 Coarse sand and gravel 13.0� 2.9 13.3� 1.5 9.2� 1.8 40.7� 29.6
151059 8.2c Coarse sandb 7.0� 1.8 4.1� 1.1 4.8� 1.1 <32
330681 5.8 Medium to coarse sand <9.9 4.8� 1.5 4.8� 1.5 170� 29
151053 6.7 Medium sand with gravel <7.4 2.3� 0.9 5.5� 1.1 <35.5
151053 9.8c Medium sandb <7.4 2.7� 0.9 4.1� 1.1 21.8� 18.9
110694 2.1 Medium sand with gravel 12.2� 2.9 9.6� 1.5 11.8� 1.8 85.1� 37.0
110694 3.7 Medium sand with gravel 13.3� 2.6 12.2� 1.8 1.1� 1.8 114� 37
110694 5.2 Medium and coarse sand
with gravel
8.1� 2.6 6.3� 1.5 8.5� 1.5 74.0� 25.9
110694 8.2c Medium and coarse sand
with gravel
<10.4 5.9� 1.5 9.6� 1.8 99.9� 37.0
110694 9.8c Medium and coarse sand
with gravel
6.3� 2.2 4.1� 1.1 4.1� 1.1 32.6� 21.8
1 Bq kg�1¼ 27.027 pCi kg�1. Concentrations of 40K greater than 111 Bq kg�1 (3000 pCi kg�1) are shown in bold type.a Equivalent radionuclide concentration is reported in terms of the radionuclide or radioactive progeny used to determine concentration by gamma
spectroscopy.b Samples split in laboratory for duplicate analyses; results matched within standard 2-sigma errors.c Samples at or just below the water table.

dynamic nature of the volume of waste at any time in the septic tank and the likely temporal variation in the Racult,rther
leastgs. 3teredlative% ofg thelargeabout
t 3 ofwnerd Rat unitater,
-tank
thana and226Raratio
y thatan is
n thefield,iquid
Table 9
Concentration of equivalent 228Ra and equivalent 226Ra in sludge collected from septic tanks in the New Jersey Coastal Plain, 2003e2004
Site number Sample weight
after drying a,b (g)
Sample description
after dryingaEquivalent 228Rac
(as 228Ac) (Bq kg�1)
Equivalent 228Rac
(as 212Pb) (Bq kg�1)
Equivalent 226Rac
(as 214Pb) (Bq kg�1)
40K (Bq kg�1)
110916d 339.5 Black fine powder 82.9� 2.5 118.0� 2.7 64.8� 1.8 112.5� 10.4
330682e 110.8 Thick black sand 91.8� 3.1 108.8� 2.6 255� 5.2 148.3� 17.8
151522 212.0 Black fine powder 62.9� 2.1 82.0� 2.9 54.6� 1.7 76.2� 11.8
231363 137.3 Black and tan fines 44.9� 2.26 51.4� 4.8 41.5� 2.6 <0.8
370498d,e,f 104.3 Coarse brown debris
and fibers
6.3� 1.2 <1.7 88.1� 1.6 84.7� 17.8
1 Bq kg�1¼ 27.027 pCi kg�1. Concentrations of Ra and K greater than 111 Bq kg�1 (3000 pCi kg�1) are shown in bold type.a Oven dried at 104 �C.b Samples less than 100 g had high relative errors and are not reported here.c Equivalent radionuclide concentration is reported in terms of the radionuclide or radioactive progeny used to determine concentration by gamma
spectroscopy.d Samples split in laboratory for duplicate analyses; results matched within standard 2-sigma errors.e Samples from septic tank not evacuated for about 10 years.f Samples from bedrock area in northwestern New Jersey; water-quality data are available from Deluca et al. (2006).
960 Z. Szabo et al. / Journal of Environmental Radioactivity 99 (2008) 947e964
concentration in the septic-tank effluent, evaluating the environmental fate of the waste-borne radium is diffiespecially without high quality flow data, and the estimates presented here are considered a tool in guiding furesearch efforts.
4.1.1. Estimates of mass transfer of Ra from the treatment system to the septic tankThe cation-exchange treatment systems, when maintained, effectively removed Ra, typically resulting in at
a 10-fold reduction, and in some cases nearly a 100-fold reduction relative to the untreated ground water (Fiand 4). The Ra was re-concentrated into the brine during the resin regeneration process and did not remain sequeson the resin. The concentration of Ra in the brine typically was enriched about 30-fold (maximum, 195-fold) reto the concentration in untreated ground water. Even though the brine used in regeneration composed less than 5the total volume of liquids leaving the home and entering the septic tank, greater than 95% of the Ra departinhome to the septic tank was supplied by this small volume. The effluent in the septic tanks is a mixture ofvolumes of treated water containing hardly any Ra and a small volume of water (about 200 L) containing95% of the Ra passing through the home.
A somewhat unexpected issue of concern identified in this random survey of a small number of homes was tha15 (20%) cation-exchange treatment systems were not functioning effectively at Ra removal despite homeobelief to the contrary, and 1 of the non-functioning cation-exchange units was providing water with combineconcentration greater than 0.185 Bq L�1. At sites 110916 and 330958, because the cation-exchange treatmenwas not functioning, the ‘‘treated’’ water contained nearly all of the Ra initially entering the home from ground wand this discharged ‘‘treated’’ water, not regeneration waste brine, was the predominant source of Ra in the septiceffluent. At sites 231363 and 231410, the regeneration brines also contained less Ra than expected.
The combined Ra concentrations in the septic-tank liquids (range, 0.026e0.243 Bq L�1) were typically lowerthat found in the untreated ground water, the original source of the Ra. The median concentration ratios of 226R228Ra in regeneration brine wastes relative to the septic-tank effluents were 66 and 34, respectively. The medianand 228Ra mass ratios were 3.3 and 1.7, respectively (Table 10). The combined Ra mass concentration and massmedian values were about the same as the results for 228Ra (35 and 1.7, respectively). The mass ratio results implfor most of the sites, somewhat more Ra mass is discharged to the septic tank in regeneration waste brine threcovered from the septic-tank effluent (median recovery for combined Ra in effluent, 62%).
4.1.2. Estimates of Ra accumulation within the septic system sludgeOf the Ra discharged to the septic tank in regeneration brine, a large portion at the ‘‘typical’’ site resides i
effluent. Some of the Ra mass is discharged to the aquifer as liquid outflow of septic-tank effluent to the leachhowever, and some associates with reactive particles that settle and accumulate as sludge. (The fate of the l
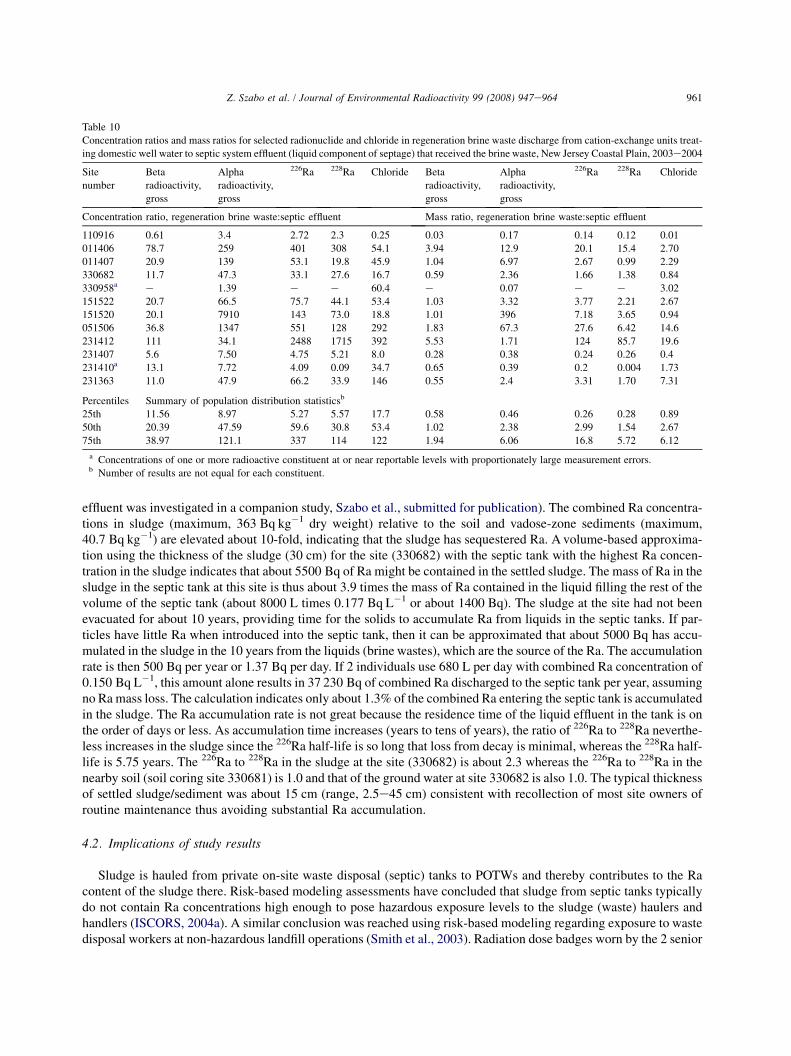
effluent was investigated in a companion study, Szabo et al., submitted for publication). The combined Ra concentra-�1 um,
ima-cen-n thef thebeen
f par-accu-ationon ofminglatedis onrthe-half-n thenessrs of
e Racallys and
asteenior
Table 10
Concentration ratios and mass ratios for selected radionuclide and chloride in regeneration brine waste discharge from cation-exchange units treat-
ing domestic well water to septic system effluent (liquid component of septage) that received the brine waste, New Jersey Coastal Plain, 2003e2004
Site
number
Beta
radioactivity,
gross
Alpha
radioactivity,
gross
226Ra 228Ra Chloride Beta
radioactivity,
gross
Alpha
radioactivity,
gross
226Ra 228Ra Chloride
Concentration ratio, regeneration brine waste:septic effluent Mass ratio, regeneration brine waste:septic effluent
110916 0.61 3.4 2.72 2.3 0.25 0.03 0.17 0.14 0.12 0.01
011406 78.7 259 401 308 54.1 3.94 12.9 20.1 15.4 2.70
011407 20.9 139 53.1 19.8 45.9 1.04 6.97 2.67 0.99 2.29
330682 11.7 47.3 33.1 27.6 16.7 0.59 2.36 1.66 1.38 0.84
330958a e 1.39 e e 60.4 e 0.07 e e 3.02
151522 20.7 66.5 75.7 44.1 53.4 1.03 3.32 3.77 2.21 2.67
151520 20.1 7910 143 73.0 18.8 1.01 396 7.18 3.65 0.94
051506 36.8 1347 551 128 292 1.83 67.3 27.6 6.42 14.6
231412 111 34.1 2488 1715 392 5.53 1.71 124 85.7 19.6
231407 5.6 7.50 4.75 5.21 8.0 0.28 0.38 0.24 0.26 0.4
231410a 13.1 7.72 4.09 0.09 34.7 0.65 0.39 0.2 0.004 1.73
231363 11.0 47.9 66.2 33.9 146 0.55 2.4 3.31 1.70 7.31
Percentiles Summary of population distribution statisticsb
25th 11.56 8.97 5.27 5.57 17.7 0.58 0.46 0.26 0.28 0.89
50th 20.39 47.59 59.6 30.8 53.4 1.02 2.38 2.99 1.54 2.67
75th 38.97 121.1 337 114 122 1.94 6.06 16.8 5.72 6.12
a Concentrations of one or more radioactive constituent at or near reportable levels with proportionately large measurement errors.b Number of results are not equal for each constituent.
961Z. Szabo et al. / Journal of Environmental Radioactivity 99 (2008) 947e964
tions in sludge (maximum, 363 Bq kg dry weight) relative to the soil and vadose-zone sediments (maxim40.7 Bq kg�1) are elevated about 10-fold, indicating that the sludge has sequestered Ra. A volume-based approxtion using the thickness of the sludge (30 cm) for the site (330682) with the septic tank with the highest Ra contration in the sludge indicates that about 5500 Bq of Ra might be contained in the settled sludge. The mass of Ra isludge in the septic tank at this site is thus about 3.9 times the mass of Ra contained in the liquid filling the rest ovolume of the septic tank (about 8000 L times 0.177 Bq L�1 or about 1400 Bq). The sludge at the site had notevacuated for about 10 years, providing time for the solids to accumulate Ra from liquids in the septic tanks. Iticles have little Ra when introduced into the septic tank, then it can be approximated that about 5000 Bq hasmulated in the sludge in the 10 years from the liquids (brine wastes), which are the source of the Ra. The accumulrate is then 500 Bq per year or 1.37 Bq per day. If 2 individuals use 680 L per day with combined Ra concentrati0.150 Bq L�1, this amount alone results in 37 230 Bq of combined Ra discharged to the septic tank per year, assuno Ra mass loss. The calculation indicates only about 1.3% of the combined Ra entering the septic tank is accumuin the sludge. The Ra accumulation rate is not great because the residence time of the liquid effluent in the tankthe order of days or less. As accumulation time increases (years to tens of years), the ratio of 226Ra to 228Ra neveless increases in the sludge since the 226Ra half-life is so long that loss from decay is minimal, whereas the 228Ralife is 5.75 years. The 226Ra to 228Ra in the sludge at the site (330682) is about 2.3 whereas the 226Ra to 228Ra inearby soil (soil coring site 330681) is 1.0 and that of the ground water at site 330682 is also 1.0. The typical thickof settled sludge/sediment was about 15 cm (range, 2.5e45 cm) consistent with recollection of most site owneroutine maintenance thus avoiding substantial Ra accumulation.
4.2. Implications of study results
Sludge is hauled from private on-site waste disposal (septic) tanks to POTWs and thereby contributes to thcontent of the sludge there. Risk-based modeling assessments have concluded that sludge from septic tanks typido not contain Ra concentrations high enough to pose hazardous exposure levels to the sludge (waste) haulerhandlers (ISCORS, 2004a). A similar conclusion was reached using risk-based modeling regarding exposure to wdisposal workers at non-hazardous landfill operations (Smith et al., 2003). Radiation dose badges worn by the 2 s

authors during sampling activity did not indicate detectable dose, although the field-portable gamma scintilometerthan
thernf the
ncern988;
ORS,rthera re-plied
fromat as
eatedted’’
as re-fold)
binedncen-
thegion.ppear
erseyyticalQA)
ng ance ins wasuntysion.ry ofthodsaste-holasman-rsity)gues
962 Z. Szabo et al. / Journal of Environmental Radioactivity 99 (2008) 947e964
registered a small increase in radiation (10e30% relative to background) in the immediate vicinity (less0.3 m) of containerized sludge. Radium enrichment in sludge derived from homeowner septic tanks in souNew Jersey, based on results of this study, do not appear to pose concern greater than or separate from, that oRa concentrated in the sludge at the POTWs in the region.
The disposal of sludge as amendments to soils raises multiple radiation exposure scenarios, with special cofor incorporation of Ra into plants and/or food crops growing in the soil (Tracy et al., 1983; Bettencourt et al., 1Linsalata et al., 1989; ISCORS, 2004a), leaching of the Ra (and metals) to ground water (Jacobsen, 2000; ISC2004a), and exposure to the gaseous 222Rn progeny (of 226Ra) emanating from the soil (ISCORS, 2004a,b). Fuground-water monitoring is proposed as a tool for understanding potential water-quality degradation, perhaps atsearch site, using a random nested design (Jacobsen, 2000), and mobilization of Ra from soils receiving land-apsludge in southern New Jersey is the focus of ongoing investigations (NJDEP, 2006a,b).
5. Conclusions
Cation-exchange treatment systems, when maintained, effectively removed combined Ra from ground watersthe Coastal Plain aquifers in New Jersey that contained combined Ra (226Ra plus 228Ra) at concentrations as gre1.54 Bq L�1 (42 pCi L�1). At least a 10-fold reduction relative to the presence of these constituents in untrfiltered ground water was observed. At one site, a non-maintained cation-exchange treatment unit provided ‘‘treawater that had combined Ra concentration greater than 0.185 Bq L�1 (the USEPA 5 pCi L�1 MCL). The Ra wconcentrated into the regeneration brine, which typically was enriched about 20- to 30-fold (maximum, 195-relative to the concentration in untreated ground water, and was discharged to on-site septic systems. ComRa concentrations in the effluent in the septic tanks ranged from 0.026 to 0.243 Bq L�1. The combined Ra cotration in sludge from the septic tanks ranged from about 0.084 to 0.363 Bq g�1, about a 10-fold increase fromconcentration in the sandy aquifer sediments, but within the range noted for sludge at POTWs within the reRadium enrichment in sludge derived from homeowner septic tanks, based on results of this study, does not ato pose concern greater than or separate from, that of the Ra in the sludge at the POTWs.
Acknowledgements
This project was completed cooperatively by the United States Geological Survey (USGS) and the New JDepartment Environmental Protection (NJDEP) Division of Science, Research and Technology. Additional analsupport was provided by the USGS Toxics Hydrology Program and the National Water Quality Assessment (NAWProgram. We thank NJDEP colleagues Dr. R. Lee Lippincott for administering the sampling program and for takiactive role in sampling-site selection, and Patricia Gardner, Eleanor Krukowski, and Jenny Goodman for assistandevising the initial plan for the multi-media sampling program. Additional assistance in finding sampling locationprovided by numerous local associations including Delaware Valley Regional Planning Commission, Salem CoWatershed Taskforce, Middlesex County Department of Health, and Stillwater Township Environmental CommisAssistance in developing sampling protocol for the regeneration brine waste was provided by Thomas BarKel-Tren Water Care. Assistance in testing the sampling of sludge using a variety of vacuum suction pumping mewas provided by Russell Reid Waste Hauling Services, Keansby, NJ. For drying sludge at the Morrisville, PA, Wwater Treatment Plant, we thank Dawn Rivera, and Rich Dulay, Superintendent. We thank USGS colleagues NicSmith and Eric Best for assistance with sample collection, Elizabeth Keller and Kristin Romanok for databaseagement, William Ellis for assistance with graphics, and Taryn Correll (student intern, Pennsylvania State Univefor equipment cleaning. We lastly acknowledge helpful suggestions to improve this manuscript by USGS colleaRalph Seiler, Brian Katz, and Edward Landa, and by Joseph Drago of Kennedy Jenks Associates.
Appendix A. Supplementary data
vpol.
Supplementary data associated with this article can be found, in the online version, at doi:10.1016/j.en2007.11.009.
References
h-field
Radio-
rt NJ-
Water
s.gov/
logical
Water
ations
Use of
y. U.S.
ocess-
n-File
0. U.S.
etry to
logical
ludge:
-R-03-
ling to
ailable
ecom-
Tech-
rg/pdf/
tation,
97.
in the
-4117.
in the
Report
tection
oil-to-
7.
Radio-
mental
r. New
aterial
963Z. Szabo et al. / Journal of Environmental Radioactivity 99 (2008) 947e964
Barringer, J.L., Szabo, Z., Schneider, D., Atkinson, W.D., Gallagher, R.A., 2006. Mercury concentrations in ground water, septage, leac
effluent, and soils in residential areas, New Jersey Coastal Plain. Science of the Total Environment 361, 144e162.
Bettencourt, A.O., Teixeira, M.M.G.R., Elias, M.D.T., Faisca, M.C., 1988. Soil to plant transfer of radium-226. Journal of Environmental
activity 6, 49e60.
Bowie Jr., J.E., 1995. Setting your regeneration frequency. Water Technology 18, 96e99.
Deluca, M.J., Heckathorn, H.A., Lewis, J.M., Gray, B.J., Feinson, L.S., 2006. Water-Quality Data. U.S. Geological Survey Water Data Repo
05-3, pp. 493e522. Available from: http://pubs.usgs.gov/wdr/2005/wdr-nj-05-3.
Faires, L.M., 1993. Methods of Analysis by the U.S. Geological Survey National Water Quality Laboratory e Determination of Metals in
by Inductively Coupled Plasma-Mass Spectrometry. U.S. Geological Survey Open-File Report 92-634. Available from: http://pubs.er.usg
pubs/ofr/ofr92634.
Fishman, M.J., Friedman, L.C., 1989. Methods for Determination of Inorganic Substances in Water and Fluvial Sediments. U.S. Geo
Survey Techniques of Water-Resources Investigations. Available from: http://pubs.usgs.gov/twri/twri5-a1 (Book 5, Chapter A1).
Focazio, M.J., Szabo, Z., Kraemer, T.F., Mullin, A.H., Barringer, T.H., dePaul, V.T., 2001. Occurrence of Selected Radionuclides in Ground
Used for Drinking Water in the United States: A Reconnaissance Survey, 1998e99. U.S. Geological Survey Water Resources Investig
Report 00-4273. Available from: http://water.usgs.gov/pubs/wri/wri004273/pdf/wri004273.pdf.
Harris, C.M., Litteral, C.J., Damrau, D.L., 1997. Methods of Analysis by the U.S. Geological Survey National Water Quality Laboratory e
a Modified Ultrasonic Nebulizer for the Analysis of Low Ionic-strength Water by Inductively Coupled Optical Emission Spectrometr
Geological Survey Open-File Report 97-382.
Horowitz, A.J., Demas, C.R., Fitzgerald, K.K., Miller, T.L., Rickert, D.A., 1994. U.S. Geological Survey Protocol for the Collection and Pr
ing of Surface-water Samples for the Subsequent Determination of Inorganic Constituents in Filtered Water. U.S. Geological Survey Ope
Report 94-539. Available from: http://pubs.er.usgs.gov/usgspubs/ofr/ofr94539.
Hutson, S.S., Barber, N.L., Kenny, J.F., Linsey, K.S., Lumia, D.S., Maupin, M.A., 2004. Estimated Use of Water in the United States in 200
Geological Survey Circular 1268. Available from: http://pubs.usgs.gov/circ/2004/circ1268/.
Ivahnenko, T., Szabo, Z., Hall, G.S., 1996. Use of an Ultra-clean Sampling Technique with Inductively Coupled Plasma-Mass Spectrom
Determine Trace-element Concentrations in Water from the KirkwoodeCohansey Aquifer System, Coastal Plain, New Jersey. U.S. Geo
Survey Open-File Report 96-142. Available from: http://onlinepubs.er.usgs.gov/djvu/OFR/1996/ofr_96_142.djvu.
Interagency Steering Committee, Radiation Standards (ISCORS), 2003. Final Report. ISCORS Assessment of Radioactivity in Sewage S
Radiological Survey Results and Analysis. ISCORS Technical Report 2003-02. Available as U.S. Environmental Protection Agency 832
002. Available from: http://www.iscors.org/pdf/FinalSurvey.pdf.
Interagency Steering Committee, Radiation Standards (ISCORS), 2004a. ISCORS Assessment of Radioactivity in Sewage Sludge: Mode
Assess Radiation Dose. ISCORS Technical Report 2004e03. Available as U.S. Environmental Protection Agency 832-R-03-002A. Av
from: http://www.iscors.org/pdf/FinalDoseModeling.pdf.
Interagency Steering Committee, Radiation Standards (ISCORS), 2004b. ISCORS Assessment of Radioactivity in Sewage Sludge: R
mendations on Management of Radioactive Materials in Sewage Sludge and Ash at Publicly Owned Treatment Works. ISCORS
nical Report 2004-04. Available as U.S. Environmental Protection Agency 832-R-03-002B. Available from: http://www.iscors.o
FinalRecommendations.pdf.
Jacobsen, E., 2000. Ground-water Quality, Water Levels, and Precipitation at the Biosolids Study Site, Lakehurst Naval Air Engineering S
New Jersey, 1995e97. U.S. Geological Survey Open-File Report 00-197. Available from: http://pubs.er.usgs.gov/usgspubs/ofr/ofr001
Kauffman, L.J., Baehr, A.L., Ayers, M.A., Stackelberg, P.E., 2001. Effects of Land Use and Travel Time on the Distribution of Nitrate
KirkwoodeCohansey Aquifer System in Southern New Jersey. U.S. Geological Survey Water-Resources Investigations Report 01
Available from: http://nj.usgs.gov/nawqa/linj/pdf/wrir_01-4117.pdf.
Kozinski, J., Szabo, Z., Zapecza, O.S. Barringer, T.H., 1995. Natural Radioactivity in, and Inorganic Chemistry of, Ground Water
KirkwoodeCohansey Aquifer System, Southern New Jersey 1983e89: U.S. Geological Survey Water-Resources Investigations
92-4144. Available from: http://pubs.er.usgs.gov/pubs/wri/wri924144.
Krieger, H.L., Whittaker, E.L., 1980. Prescribed Procedures for Measurement of Radioactivity in Drinking Water. U.S. Environmental Pro
Agency Manual EPA-600/4-80-032.
Linsalata, P., Morse, R.S., Ford, H., Eisenbud, M., Franca, E.P., deCastro, M.B., Lobao, N., Sachett, I., Carlos, M., 1989. An assessment of s
plant concentration ratios for some natural analogues of the transuranic elements. Health Physics 56, 33e46.
Lucas, H.F., 1987. Radium removal by a home water softener. Journal of Environmental Radioactivity 5, 359e362.
Mays, C.W., Rowland, R.E., Stehney, A.F., 1985. Cancer risk from the lifetime intake of Ra and U isotopes. Health Physics 48, 635e64
Miller, W.H., 1996. The determination of radioisotope levels in municipal sewage sludge. Health Physics 71, 286.
Nemeth, W.K., Parsa, B., 1992. Density correction of gamma-ray detection efficiency in environmental samples. Radioactivity and
chemistry 3, 32e39.
New Jersey Administrative Code, 2002. Private Well Testing Act; Regulations governing the certification of laboratories and environ
measurements; N.J. Administrative Code, Amendment 7:18. New Jersey Register 34, 1e16.
New Jersey Department Environmental Protection, 2004. A Southern New Jersey Homeowner’s Guide to Radioactivity in Drinking Wate
Jersey Department Environmental Protection, Trenton, NJ. Available from: http://www.nj.gov/dep/rpp/download/radwater.pdf
New Jersey Department Environmental Protection, 2006a. A Study of Technologically Enhanced Naturally Occurring Radioactive M
(TENORM) in Municipal Sludge: Landis Sewarage Authority. New Jersey Department Environmental Protection, Trenton, NJ.

New Jersey Department Environmental Protection, 2006b. A Study of Technologically Enhanced Naturally Occurring Radioactive Material
(TENORM) in Municipal Sludge: Cumberland County Utilities Authority. New Jersey Department Environmental Protection, Trenton, NJ.
Biota.
e140.
inking
ardous
228 in
ations
tanks,
Works
hysics
ederal
, D.C.
41 and
bility;
acts of
from:
ailable
964 Z. Szabo et al. / Journal of Environmental Radioactivity 99 (2008) 947e964
Olson, M.L., DeWild, J.F., 1999. Techniques for the Collection and Specific Analysis of Low Levels of Mercury in Water, Sediment, and
U.S. Geological Survey Water Resources Investigations Report 99-4018B.
Parrotta, M.J., 1991. Radioactivity in water treatment wastes: a USEPA perspective. Journal American Water Works Association 83, 134
Parsa, B., 1998. Contribution of short-lived radionuclides to alpha-particle radioactivity in drinking water and their impact on the Safe Dr
Water Act regulations. Radioactivity and Radiochemistry 9, 41e50.
Parsa, B., Hoffman, A., 1992. Determination of Ra-228 in drinking water. Journal of Radioanalytical Nuclear Chemistry 158, 53e62.
Smith, K.P., Arnish, J.J., Williams, G.P., Blunt, D.L., 2003. Assessment of the disposal of radioactive petroleum industry waste in nonhaz
landfills using risk-based modeling. Environmental Science and Technology 37, 2060e2066.
Szabo, Z., dePaul, V.T., Kraemer, T.F., Parsa, B., 2005. Occurrence of Radium-224 and Comparison to that of Radium-226 and Radium-
Water from the Unconfined KirkwoodeCohansey Aquifer System, Southern New Jersey. U.S. Geological Survey Scientific Investig
Report 2004-5224. Available from: http://pubs.er.usgs.gov/usgspubs/sir/sir20045224.
Szabo, Z., Jacobsen, E., Kraemer, T.F., Parsa, B. Environmental fate of Ra in cation-exchange regeneration brine waste disposed to septic
New Jersey Coastal Plain, U.S.A.: migration to the water table. Journal of Environmental Radioactivity, submitted for publication.
Thomas, M.A., 2000. The effect of residential development on ground-water quality near Detroit, Michigan. Journal of American Water
Association 36, 1023e1038.
Tracy, B.L., Prantl, F.A., Quinn, J.M., 1983. Transfer of 226Ra, 210Pb, and uranium from soil to garden produce: assessment of risk. Health P
44, 469e477.
U.S. Environmental Protection Agency, 1997. National Primary Drinking Water Regulations: analytical methods for radionuclides. F
Register 62, 10168e10175.
U.S. Environmental Protection Agency, 1999. Environmental Radiation Guidance Document No. 13. Office of Water Supply, Washington
U.S. Environmental Protection Agency Report EPA-2501/10-99-013.
U.S. Environmental Protection Agency, 2000a. National Primary Drinking Water Regulations; Radionuclides; Final rule, 40CFR parts 1
142. Federal Register 65, no. 236.
U.S. Environmental Protection Agency, 2000b. National Primary Drinking Water Regulations; Radionuclides; Notice of Data Availa
Proposed Rule: Washington, D.C., Office of Water, U.S. Environmental Protection Agency Report EPA-815-2-00-003.
Welch, A.H., Szabo, Z., Parkhurst, D.L., Van Metre, P.C., Mullin, A.H., 1995. Gross-beta activity in ground water: natural sources and artif
sampling and laboratory analysis. Applied Geochemistry 10, 491e503.
Wilde, F.D., Radtke, D.B., 1999. Field Measurements. U.S. Geological Survey Techniques of Water-Resources Investigations. Available
http://water.usgs.gov/owq/FieldManual/Chapter6/final508ChapterA6.pdf (Book 9, Chapter A6).
Zapecza, O.S., 1989. Hydrogeologic Framework of the New Jersey Coastal Plain. U.S. Geological Survey Professional Paper 1404-B. Av
from: http://onlinepubs.er.usgs.gov/djvu/PP/pp_1404_b.djvu.