Concentration trends in Europe - Charles River … trends in Europe Disclaimer •The views...
27
Professor Tommaso Valletti Chief Competition Economist, DG COMP Disclaimer: The views expressed are those of the authors and cannot be regarded as stating an official position of the European Commission. Please do not quote or disseminate this presentation. Concentration trends in Europe
Transcript of Concentration trends in Europe - Charles River … trends in Europe Disclaimer •The views...
Professor Tommaso VallettiChief Competition Economist, DG COMP
Disclaimer: The views expressed are those of the authors and cannot be regarded as stating an official position of the European Commission.Please do not quote or disseminate this presentation.
Concentration trends in Europe

Disclaimer
• The views expressed in this presentation are the personal views of the speaker only and cannot be regarded as stating an official position of the European Commission.
2

Introduction
Recent debate based on US data observed that over the past decades
Many industries have become increasingly concentrated
Profit margins and firm market power steadily increasing
Profit inequality increased – a few firm rips most returns
Income inequality increased while labour income's GDP share decreased
Has merger policy gone too far in allowing mergers?
Council of Economic Advisers (US, 2016) expressing concerns
3

Perception: Quotes from mainstream media
"Markets work best when there is healthy competition among business. In too many industries, that competition just doesn't exist anymore."
"The rise of the corporate colossus threatens both competition and the legitimacy of business."
"From health insurance to internet search, fewer firms control more of their markets.”
“Very persistent and very high profit margins are a sign of weak competition. […] This is bad for consumers, innovation and capital allocation. It is time for antitrust regulators to start blocking deals.”
4

THE US EXPERIENCE
5

US: Concentration is increasing
-
6

US: Profit share of GDP has skyrocketed
See Barkai (2017): Increase in profit share from around 5% (1990) to 15% (today)
7

US: Economic markups have increased even more
See De Loecker & Eeckhout (2017): This increase in markups implies an increase in the economic profit margin from around 20% (1980s) to
30% (2000) to 40% (today)
8

US: Downward trend in business dynamism
9

…and US inequality has widened
See Piketty (2014)
10

Reactions to these trends
There have been many:
… not properly defined antitrust markets
… not suitable data (e.g., fixed costs not taken into account, reactions to Piketty, etc.)
… analysis takes market boundaries as given over time (e.g., U.S. census data), but markets have become wider with both globalization and digitization (leading to spurious increases in local concentration)
…higher concentration (to the extent it is there) must not necessarily be merger-induced, but can also stem from efficiencies of superstar firms (they benefit from these changes and their efficiency results in high market shares and high profit margins)
11

THE EU EXPERIENCEPOST CRISIS
12
What about Europe?
We undertook some analysis post-crisis in the largest EU economies, 170+ industries
Caveats
Less data, and less consistently available
Geographic and time coverage weaker
Less academic analysis with systematic results
13
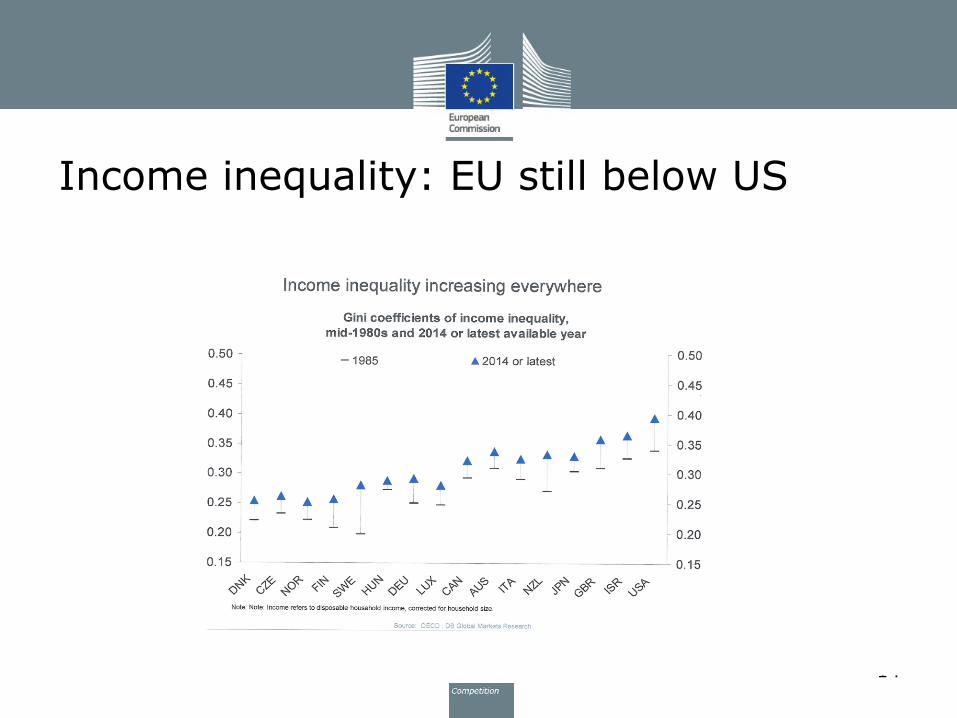
Income inequality: EU still below US
14

Inequality in Europe after the financial crisis
15
.3
.33
.36
.39
.42
.45
20042006
20082010
20122014
Household income - Gini
.3
.33
.36
.39
.42
.45
20042006
20082010
20122014
Personal labour income - Gini
1.5
1.7
1.9
2.1
2.3
2.5
20042006
20082010
20122014
Household income - P5020
1.5
1.7
1.9
2.1
2.3
2.5
20042006
20082010
20122014
Personal labour income - P5020
EU27 EU15 EU5
Gini and P5020 indices in 2005-2013 (gross income, PPP-adjusted)
Source: JRC calculations from EU-SILC microdata
.3
.33
.36
.39
.42
.45
20042006
20082010
20122014
Household income - Gini
.3
.33
.36
.39
.42
.45
20042006
20082010
20122014
Personal labour income - Gini
1.5
1.7
1.9
2.1
2.3
2.5
20042006
20082010
20122014
Household income - P5020
1.5
1.7
1.9
2.1
2.3
2.5
20042006
20082010
20122014
Personal labour income - P5020
EU27 EU15 EU5
• Income inequality didnot increase since thecrisis on average, but
• Lowest 20 percent became poorercompared to median

No increase in concentration after the crisis, EU5
16

17
020
40
60
80100
020
40
60
80100
Educa
tion
Oth
er s
ervice
s
Profe
ssional
ser
vice
s
Agricultu
re
Cons
truct
ion
Heal
th
HO
RECA
Trade IT
C
Finan
ce
Indu
stry
Trans
port
Educa
tion
Heal
th
HO
RECA
Trans
port
Oth
er s
ervice
s
Cons
truct
ion
Profe
ssional
ser
vice
s
Agricultu
reIT
C
Trade
Indu
stry
Finan
ce
Educa
tion
Trade
Profe
ssional
ser
vice
s
Agricultu
re
Heal
th
HO
RECA
Cons
truct
ion
ITC
Oth
er s
ervice
s
Trans
port
Indu
stry
Finan
ce
Profe
ssional
ser
vice
s
Educa
tion
Heal
th
Cons
truct
ion
HO
RECA
Trans
port
Oth
er s
ervice
s
Agricultu
re
Trade
Indu
stry
ITC
Finan
ce
Heal
th
Educa
tion
Cons
truct
ion
Agricultu
re
Trade
Profe
ssional
ser
vice
s
HO
RECA
Oth
er s
ervice
sIT
C
Trans
port
Indu
stry
Finan
ce
Educa
tion
Profe
ssional
ser
vice
s
Heal
th
Oth
er s
ervice
s
Cons
truct
ion
Agricultu
re
HO
RECA
Trade IT
C
Trans
port
Indu
stry
Finan
ce
DE ES FR
IT UK EU5
Sh
are
of 4 la
rge
st firm
s
Most concentrated sectors: ITC, Transport, Industry and Finance

18
-50
-40
-30
-20
-10
0
10
20
30
40
50
-50
-40
-30
-20
-10
0
10
20
30
40
50
0 20 40 60 80 100 0 20 40 60 80 100 0 20 40 60 80 100
DE ES FR
IT UK EU5
Share of 4 largest firms in 2010
Increase typically not in high concentration industries
Counter
examples:
increase in
industries with
60 to 80% C4
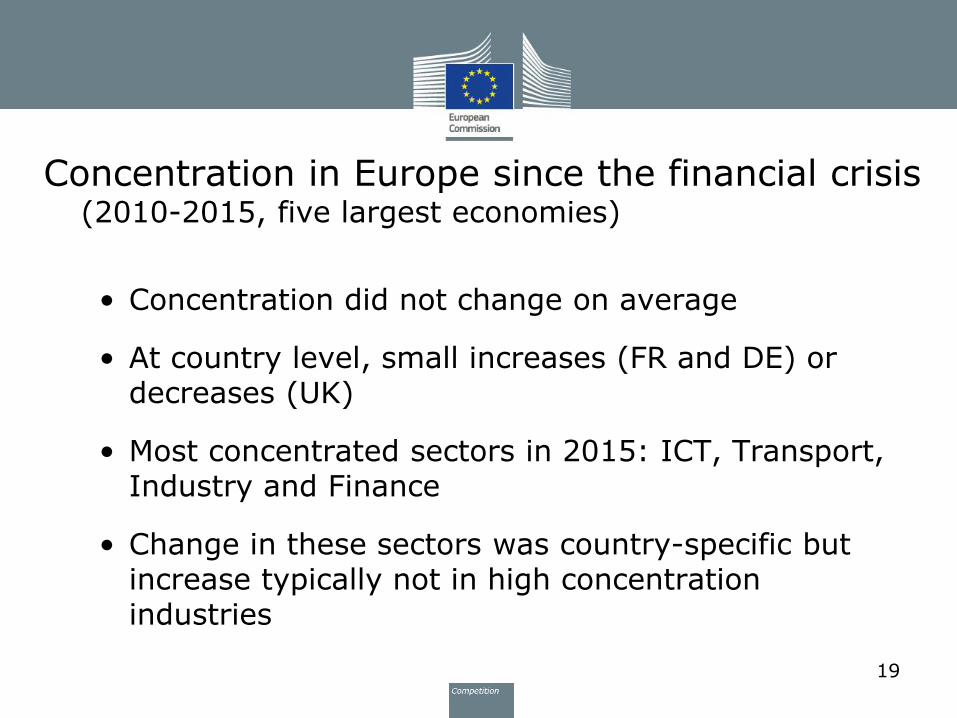
Concentration in Europe since the financial crisis(2010-2015, five largest economies)
• Concentration did not change on average
• At country level, small increases (FR and DE) or decreases (UK)
• Most concentrated sectors in 2015: ICT, Transport, Industry and Finance
• Change in these sectors was country-specific butincrease typically not in high concentrationindustries
19
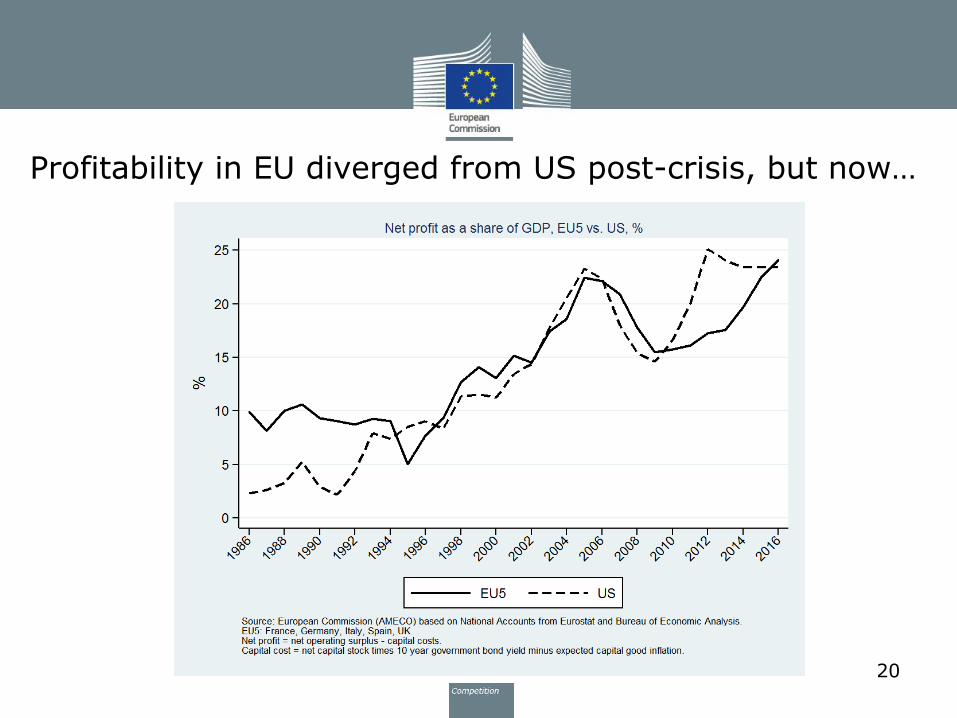
Profitability in EU diverged from US post-crisis, but now…
20

Profitabilty in Europe since the financial crisis(Five largest economies)
• EU-US profitablity diverged post-crisis…
• But they are on the same historical trend
• Profitability trend increase in: agriculture, finance and education
• Profitability trend decline in: ITC
21

Business dynamism: No trend post-crisis
22
Entry and exit rates, EU5, 2008-2015
Source: Eurostat. EU5: France, Germany, Italy, Spain, UK.
Summary of "stylized facts"
Europe vs US?
Less, and less consistent data available but exercise is doable
=> Engage with the public debate and support concerted data effort topermit evidence-based determination of policy
Post-crisis industry concentration rather stable (but high-ish)
Recent (post-crisis) profit margins increased less than in US (but high)
Income inequality – increased in past 30 years but still less and is below that of US
Income inequality post-crisis stayed stable (but for bottom 20%)23

Implications for merger policy• The implications can be viewed from two different vantage points:
• Ex-ante perspective: Was competition enforcement too lax and hascaused market power (e.g., by permitting excessive concentration)? Or are there are plausible alternative explanations (e.g., globalizationand digitization favoring "superstars")?
• Ex-post perspective: Given that large firms' margins haveconsiderably increased (and potentially also concentration), what doesit imply for competition policy going forward?
• Ex-post perspective is easier to determine, because it does not require agreeing on whether lax enforcement was causal for theincrease in market power (or secular shifts such as globalization).
24

Implications for merger policy
• Determinants of anticompetitive merger effects:
• … concentration (parties have high market shares)
• … closeness of competition (high diversion ratios)
• … market power (parties have high profit margins)
• In other words: The higher the merging parties' margins in a given case, the more likely traditional market share thresholds will underestimate competitive effects (all else equal).
25

Implications for competition policy
• With respect to antitrust, the upward trend in margins increasesthe potential for anticompetitive leverage.
• Merger control matters especially in preventing anticompetitiveeffects in a world of high margins.
• Potential competition: do we have the 'right' standard?
• => If we do not properly adapt to changing markets, the risk is politics will (in ways we might not approve of).
26

Thank you!
• …and special thanks to…
•Gabor Koltay
•Szabolcs Lorincz
•Hans Zenger
27