A New Design Approach for Solar Concentrating Parabolic Dish Based on Optimized Flexible Petals

New Rules Project www.newrules.org 1
Concentrating Solar andDecentralized Power
Government Incentives Hinder Local Ownership
JOHN FARRELL
New Rules Project1313 5th St. SE, Suite 303Minneapolis, MN 55414
612-379-3815www.newrules.org
A publication of
May 2008 - Revised edition

New Rules Project www.newrules.org 2
I’d like to thank Bridget Frederick from the city of Berkeley, Mark Bolinger from the Lawrence Berkeley National Laboratory, Jesse from Solar City, and Melicia Charles from the California Public Utilities Commission for their help in gathering data. Special thanks to my colleague David Morris for ushering my writing from acceptable to publishing quality.
Thank you as well to the Bush Foundation and the McKnight Foundation for their generous support of our work.
Cover photo credits: (left) Warren Gretz, (right) Pete Beverly, AstroPower, Inc., Rawlings, Lyle - First, Inc., Shell Solar, and Roger Taylor.
Other publications from the New Rules Project of the Institute for Local Self-Reliance:
Broadening Wind Energy Ownership by Changing Federal Incentives, by John Farrell, April 2008
Driving Our Way to Energy Independence, by David Morris, April 2008
Ethanol and Land Use Changes, by David Morris, February 2008
Carbon Caps With Universal Dividends: Equitable, Ethical & Politically Effective Climate Policy, by John Bailey, January 2008
Minnesota Feed-In Tariff Could Lower Cost, Boost Renewables and Expand Local Ownership, by John Farrell, January 2008
Municipal Broadband: Demystifying Wireless and Fiber-Optic Options, by Christopher Mitchell, January 2008
The Policy Gap: Minnesota Energy Policy vs. Minnesota Climate Policy, by John Farrell, John Bailey and David Morris, November 2007
Big-Box Swindle: The True Cost of Mega-Retailers and the Fight for America’s Independent Businesses, by Stacy Mitchell, November 2007, Beacon Press
Burlington Telecom Case Study, by Christopher Mitchell, August 2007
Wind and Ethanol: Economies and Diseconomies of Scale, by John Farrell, July 2007
Energizing Rural America: Local Ownership of Renewable Energy Production is Key, by David Morris, April 2007
Lessons from the Pioneers: Tackling Global Warming at the Local Level, by John Bailey, January 2007
Since 1974, the Institute for Local Self-Reliance (ILSR) has worked with citizen groups, governments and private businesses to extract the maximum value from local resources.
A program of ILSR, the New Rules Project helps policy makers to design rules as if community matters.
©2008 by the Institute for Local Self-Reliance. All Rights Reserved.
Acknowledgments:

Table of Contents
............................................................................................................Executive Summary! 4
......................................................................................................................Introduction! 5
..................................................................................The Solar Market: Present and Future! 5
.................................................................................................Solar Technology Overview! 6
......................................................................................................................Solar PV ! 6
......................................................................................................Solar Concentrators! 6
Solar “Trough”
Power Tower
Stirling Dish
Fresnel Reflector
....................................................................................................Solar Electric Economics! 8
............................................................................................................Solar Incentives! 9
Federal Incentives
State Incentives
Analysis
.........................................................................................................Off the Balance Sheet! 13
.........................................................................................................Local Ownership! 13
..........................................................Decentralization, Transmission and Grid Stability! 14
.............................................................................................Firm and Baseload Power! 14
.........................................................................................................................Summary! 15
.......................................................................................................................References! 16
New Rules Project www.newrules.org 3
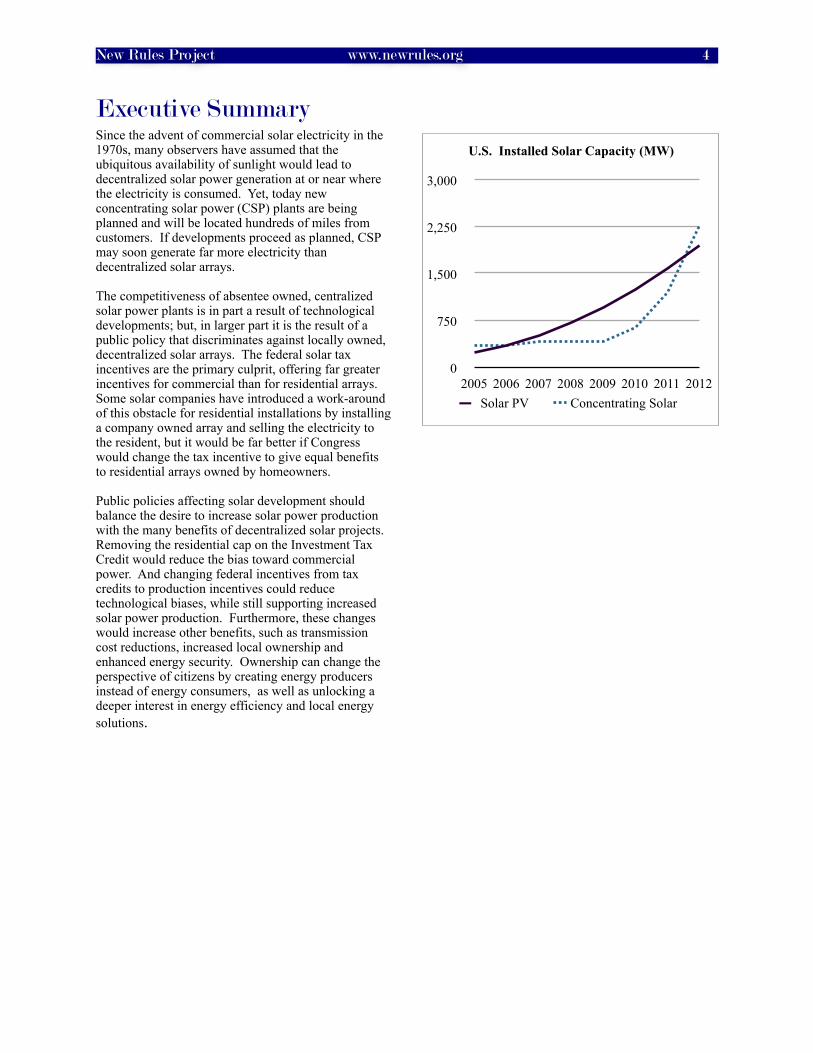
Executive SummarySince the advent of commercial solar electricity in the 1970s, many observers have assumed that the ubiquitous availability of sunlight would lead to decentralized solar power generation at or near where the electricity is consumed. Yet, today new concentrating solar power (CSP) plants are being planned and will be located hundreds of miles from customers. If developments proceed as planned, CSP may soon generate far more electricity than decentralized solar arrays.
The competitiveness of absentee owned, centralized solar power plants is in part a result of technological developments; but, in larger part it is the result of a public policy that discriminates against locally owned, decentralized solar arrays. The federal solar tax incentives are the primary culprit, offering far greater incentives for commercial than for residential arrays. Some solar companies have introduced a work-around of this obstacle for residential installations by installing a company owned array and selling the electricity to the resident, but it would be far better if Congress would change the tax incentive to give equal benefits to residential arrays owned by homeowners.
Public policies affecting solar development should balance the desire to increase solar power production with the many benefits of decentralized solar projects. Removing the residential cap on the Investment Tax Credit would reduce the bias toward commercial power. And changing federal incentives from tax credits to production incentives could reduce technological biases, while still supporting increased solar power production. Furthermore, these changes would increase other benefits, such as transmission cost reductions, increased local ownership and enhanced energy security. Ownership can change the perspective of citizens by creating energy producers instead of energy consumers, as well as unlocking a deeper interest in energy efficiency and local energy
solutions.
New Rules Project www.newrules.org 4
Solar PV Concentrating Solar
0
750
1,500
2,250
3,000
2005 2006 2007 2008 2009 2010 2011 2012
U.S. Installed Solar Capacity (MW)

Introduction In the next five years, expansion of concentrating solar capacity may outstrip expansion of on-grid solar photovoltaic (PV) in the United States. The expansion of concentrating solar is in some ways unsurprising. Combine a recently increased federal incentive (the 30% Investment Tax Credit) with a centralized power station model and you have the foundation for large-scale development.
The new concentrating solar thermal power plants contrast with the existing decentralized solar PV industry. With no need for a steam turbine, solar PV lends itself to residential or commercial rooftop installation. This easy scalability means it can serve off-grid residents as well as on-grid households or industry looking for on-site power. Decentralized solar reduces grid load and stress on transmission lines. Solar concentrators turn sunlight into just another central-station power source, albeit one based on a free, clean and renewable fuel.
The characteristics of the two technologies and federal solar power incentives tailor the style of ownership. Individual homeowners receive very little federal support when they install solar PV panels on their homes. Concentrating solar electric, on the other hand, can only be built at commercial and utility scales and thus enjoys significant federal incentives. In a few locations, state, local, and utility incentives reduce but rarely eliminate the disparity in public subsidies for the two solar technologies.
The argument over solar technology often centers on bang-for-the-buck. But the economics of solar power – like most energy sources – reflect government subsidies. Thus, the most appropriate question is “who benefits from public policy?” Good energy policy spreads the taxpayer-funded benefits widely, and better energy policy allows citizens to participate in crafting their energy future. With solar PV, individuals can own their source of renewable power, taking greater responsibility for their energy use. Local ownership also confers additional economic benefits to the community, reduces transmission costs, and enhances grid stability.
The solar market is changing rapidly, and better public policy can level the playing field between decentralized and centralized technologies, spreading the benefits of the solar boom more equitably.
The Solar Market: Present and FutureConcentrating solar electric plants were first built in the California desert during the late 1980s. After an almost 20 year gap, two new plants were installed in 2006 and 2007, adding 61 megawatts (MW) of new capacity. Concentrating solar plants are typically economical only at large-scale, so despite the intermittent construction of large plants, overall capacity has kept pace with the steady growth of solar PV.
Between 2008 and 2012, it is expected that nearly 300,000 decentralized solar PV power plants will be installed1 compared to 8 centralized CSP plants. Yet the new concentrating plants will produce 30% more electricity than the new PV plants. Figure 1 shows installed electricity capacity of solar PV and
concentrating solar in the United States.2 Data for
2007-2012 is estimated based on extrapolating the past decade of growth (solar PV)3 or from announcements of planned projects (concentrating solar).4
New Rules Project www.newrules.org 5
Solar PV Concentrating Solar
0
750
1,500
2,250
3,000
2005 2006 2007 2008 2009 2010 2011 2012
Figure 1 - U.S. Installed Solar Capacity (MW)
Solar Technology OverviewThere are two basic solar power technologies: photovoltaics (PV) and solar thermal electric concentrators. Solar PV is decentralized, small-scale power, with installations generally under one megawatt and close to demand, often on residential or commercial rooftops, over parking lots or in open areas next to buildings. Concentrating solar plants, on the other hand, are built in multi-megawatt arrays. Power from these plants is sent via transmission lines to sources of demand. The following sections explain the basic components of each power system.
Solar PVPhotovoltaics produce direct current electricity directly from sunlight, using modules typically constructed of silicon. Several modules can be combined into larger panels, and multiple panels can create large arrays. The scalability of solar PV allows it to serve local demand, such as an individual house or building, or a cluster of buildings.
Solar ConcentratorsSolar concentrators use lenses or mirrors to focus solar energy. There are four varieties: parabolic trough, power tower, Stirling dish, and Fresnel reflector concentrators. Only trough concentrators have been commercially deployed in the United States, though trough, Stirling, and Fresnel concentrator plants have been announced for construction in the next five years. All concentrator technologies are scalable, but the smallest unit is several times larger than a solar PV panel and is not roof-mountable.
The promise of solar concentrators is that collecting solar heat makes for less expensive storage, helping increase capacity factors and making solar power more consistent. For example, a 220 MW solar concentrator power plant could build 4 hours of thermal storage for $2.6 million ($15 per kilowatt-hour - kWh). For a 220 MW solar PV plant to have 4 hours of battery storage would cost $88-140 million ($500-800 per kWh).5 To speak more plainly, a thermos costs less than a battery. And it is more economical to build storage for a centralized power plant, than for many smaller plants.
Solar “Trough”
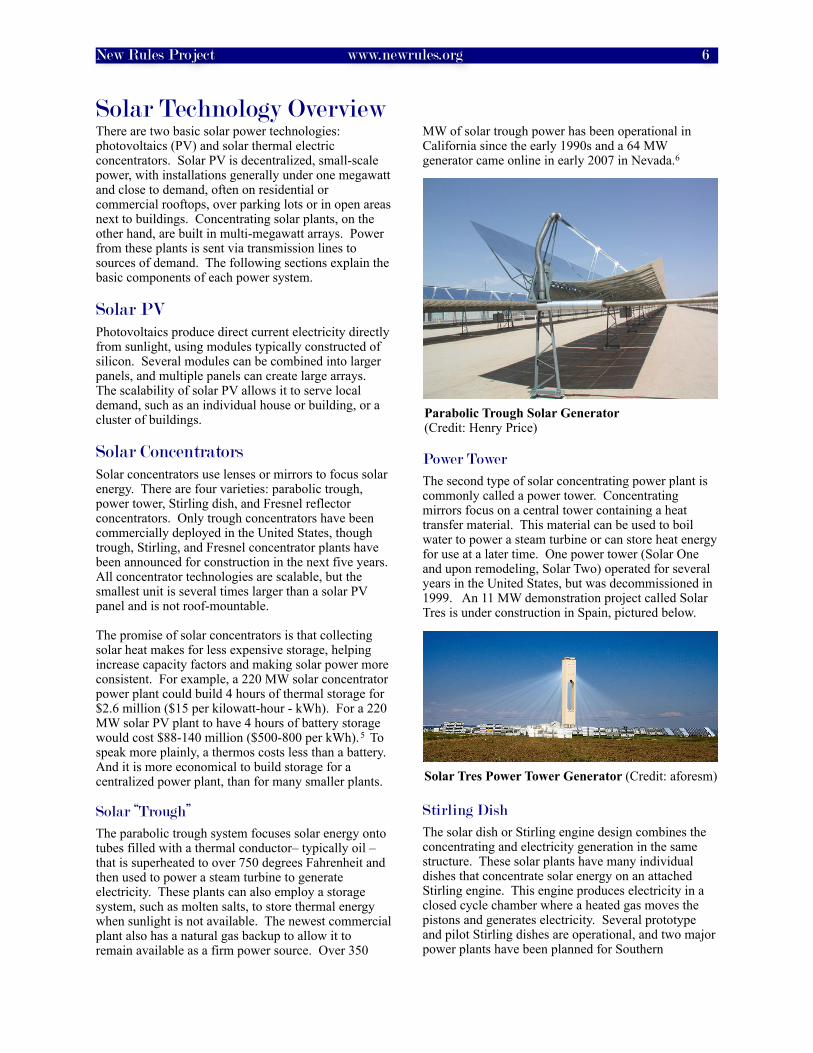
The parabolic trough system focuses solar energy onto tubes filled with a thermal conductor– typically oil – that is superheated to over 750 degrees Fahrenheit and then used to power a steam turbine to generate electricity. These plants can also employ a storage system, such as molten salts, to store thermal energy when sunlight is not available. The newest commercial plant also has a natural gas backup to allow it to remain available as a firm power source. Over 350
MW of solar trough power has been operational in California since the early 1990s and a 64 MW generator came online in early 2007 in Nevada.6
Power Tower
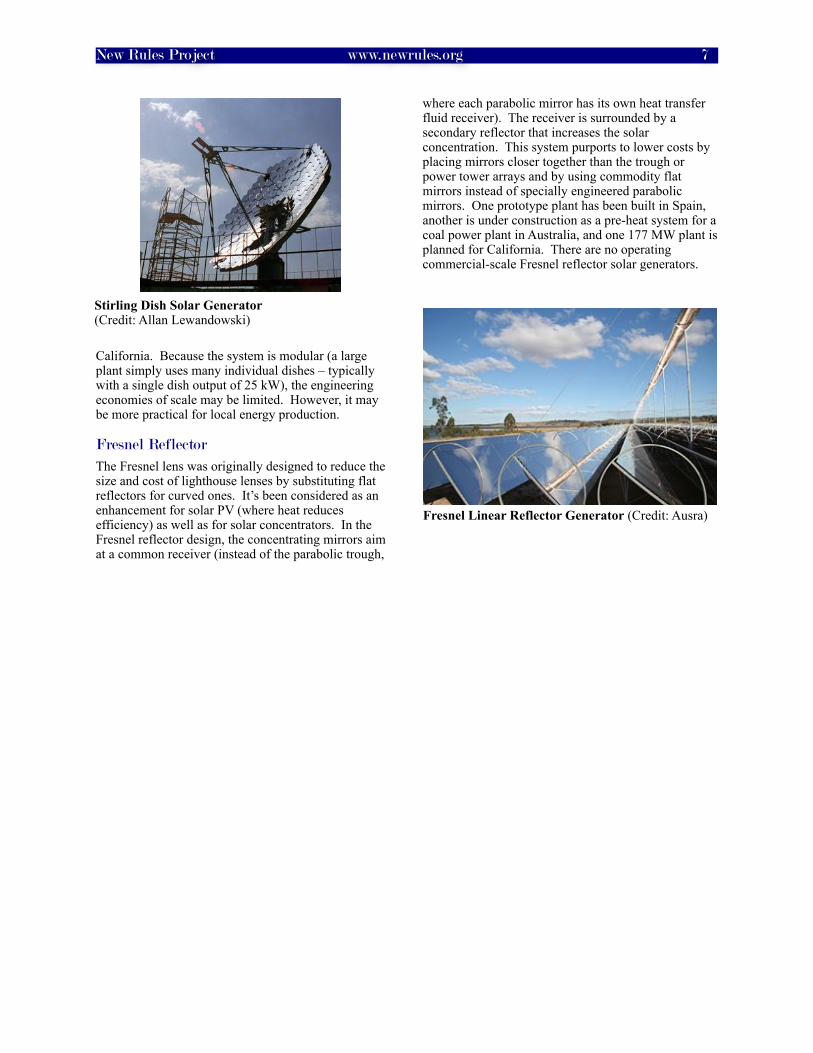
The second type of solar concentrating power plant is commonly called a power tower. Concentrating mirrors focus on a central tower containing a heat transfer material. This material can be used to boil water to power a steam turbine or can store heat energy for use at a later time. One power tower (Solar One and upon remodeling, Solar Two) operated for several years in the United States, but was decommissioned in 1999. An 11 MW demonstration project called Solar Tres is under construction in Spain, pictured below.
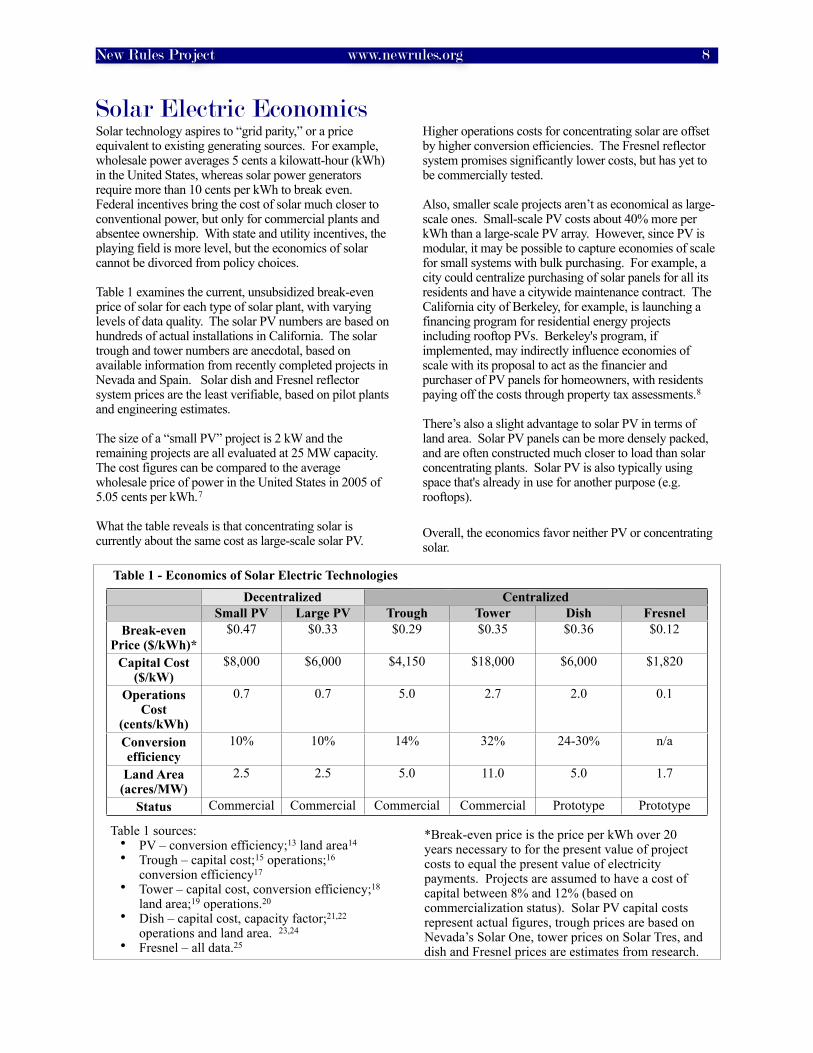
Stirling Dish
The solar dish or Stirling engine design combines the concentrating and electricity generation in the same structure. These solar plants have many individual dishes that concentrate solar energy on an attached Stirling engine. This engine produces electricity in a closed cycle chamber where a heated gas moves the pistons and generates electricity. Several prototype and pilot Stirling dishes are operational, and two major power plants have been planned for Southern
New Rules Project www.newrules.org 6
Parabolic Trough Solar Generator (Credit: Henry Price)
Solar Tres Power Tower Generator (Credit: aforesm)
California. Because the system is modular (a large plant simply uses many individual dishes – typically with a single dish output of 25 kW), the engineering economies of scale may be limited. However, it may be more practical for local energy production.
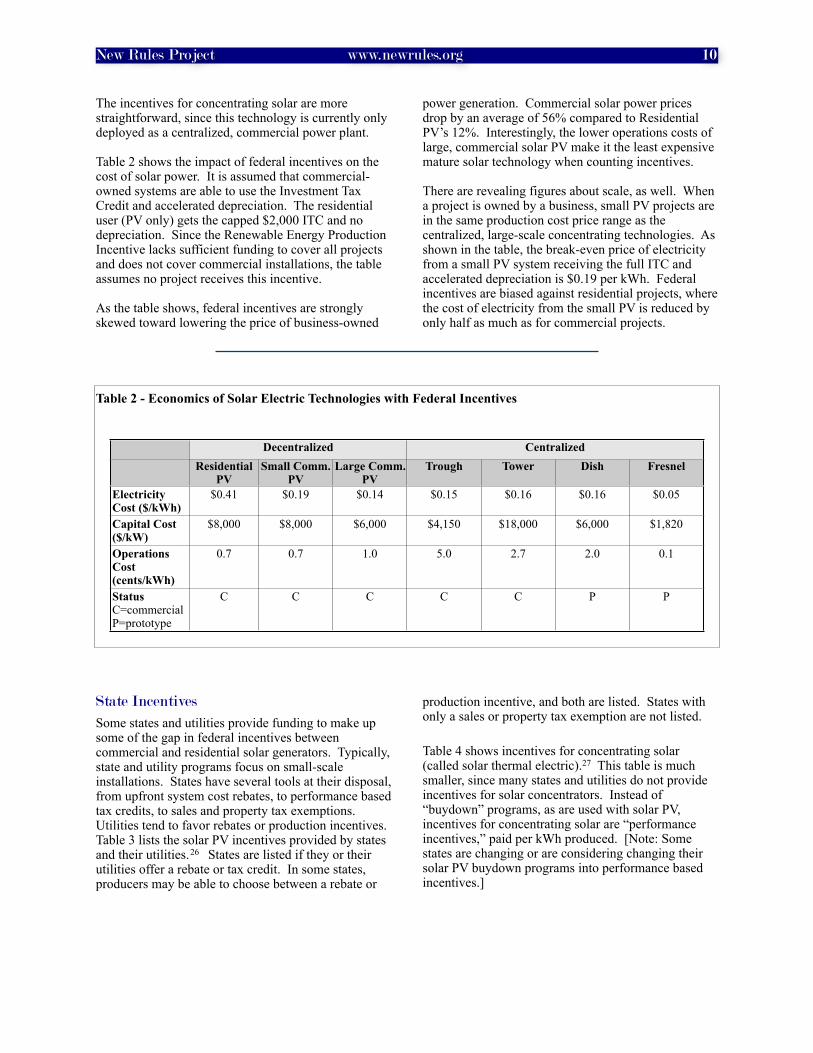
Fresnel Reflector
The Fresnel lens was originally designed to reduce the size and cost of lighthouse lenses by substituting flat reflectors for curved ones. It’s been considered as an enhancement for solar PV (where heat reduces efficiency) as well as for solar concentrators. In the Fresnel reflector design, the concentrating mirrors aim at a common receiver (instead of the parabolic trough,
where each parabolic mirror has its own heat transfer fluid receiver). The receiver is surrounded by a secondary reflector that increases the solar concentration. This system purports to lower costs by placing mirrors closer together than the trough or power tower arrays and by using commodity flat mirrors instead of specially engineered parabolic mirrors. One prototype plant has been built in Spain, another is under construction as a pre-heat system for a coal power plant in Australia, and one 177 MW plant is planned for California. There are no operating commercial-scale Fresnel reflector solar generators.
New Rules Project www.newrules.org 7
Fresnel Linear Reflector Generator (Credit: Ausra)
Stirling Dish Solar Generator (Credit: Allan Lewandowski)
Solar Electric EconomicsSolar technology aspires to “grid parity,” or a price equivalent to existing generating sources. For example, wholesale power averages 5 cents a kilowatt-hour (kWh) in the United States, whereas solar power generators require more than 10 cents per kWh to break even. Federal incentives bring the cost of solar much closer to conventional power, but only for commercial plants and absentee ownership. With state and utility incentives, the playing field is more level, but the economics of solar cannot be divorced from policy choices.
Table 1 examines the current, unsubsidized break-even price of solar for each type of solar plant, with varying levels of data quality. The solar PV numbers are based on hundreds of actual installations in California. The solar trough and tower numbers are anecdotal, based on available information from recently completed projects in Nevada and Spain. Solar dish and Fresnel reflector system prices are the least verifiable, based on pilot plants and engineering estimates.
The size of a “small PV” project is 2 kW and the remaining projects are all evaluated at 25 MW capacity. The cost figures can be compared to the average wholesale price of power in the United States in 2005 of 5.05 cents per kWh.7
What the table reveals is that concentrating solar is currently about the same cost as large-scale solar PV.
Higher operations costs for concentrating solar are offset by higher conversion efficiencies. The Fresnel reflector system promises significantly lower costs, but has yet to be commercially tested.
Also, smaller scale projects aren’t as economical as large-scale ones. Small-scale PV costs about 40% more per kWh than a large-scale PV array. However, since PV is modular, it may be possible to capture economies of scale for small systems with bulk purchasing. For example, a city could centralize purchasing of solar panels for all its residents and have a citywide maintenance contract. The California city of Berkeley, for example, is launching a financing program for residential energy projects including rooftop PVs. Berkeley's program, if implemented, may indirectly influence economies of scale with its proposal to act as the financier and purchaser of PV panels for homeowners, with residents paying off the costs through property tax assessments.8
There’s also a slight advantage to solar PV in terms of land area. Solar PV panels can be more densely packed, and are often constructed much closer to load than solar concentrating plants. Solar PV is also typically using space that's already in use for another purpose (e.g. rooftops). Table 1 endnotes 910 11 1213 14 1516 17 1819 20 21
Overall, the economics favor neither PV or concentrating solar.
New Rules Project www.newrules.org 8
Decentralized Centralized
Small PV Large PV Trough Tower Dish Fresnel
Break-even Price ($/kWh)*
$0.47 $0.33 $0.29 $0.35 $0.36 $0.12
Capital Cost ($/kW)
$8,000 $6,000 $4,150 $18,000 $6,000 $1,820
Operations Cost
(cents/kWh)
0.7 0.7 5.0 2.7 2.0 0.1
Conversion efficiency
10% 10% 14% 32% 24-30% n/a
Land Area (acres/MW)
2.5 2.5 5.0 11.0 5.0 1.7
Status Commercial Commercial Commercial Commercial Prototype Prototype
Table 1 - Economics of Solar Electric Technologies
Table 1 sources: • PV – conversion efficiency;13 land area14
• Trough – capital cost;15 operations;16 conversion efficiency17
• Tower – capital cost, conversion efficiency;18 land area;19 operations.20
• Dish – capital cost, capacity factor;21,22 operations and land area. 23,24
• Fresnel – all data.25
*Break-even price is the price per kWh over 20 years necessary to for the present value of project costs to equal the present value of electricity payments. Projects are assumed to have a cost of capital between 8% and 12% (based on commercialization status). Solar PV capital costs represent actual figures, trough prices are based on Nevada’s Solar One, tower prices on Solar Tres, and dish and Fresnel prices are estimates from research.

Solar IncentivesDespite diverse available technologies for solar energy production, solar producers – like most energy producers – still require various government and utility incentives to compete with existing methods of electricity production. The myriad incentives from the federal government, states, and utilities reduce the cost of solar electricity and, in most locations, these incentives favor centralized, commercial-scale solar installations.
Federal Incentives
Like most renewable technologies, solar-generated electricity receives generous federal government subsidies:22
• An Investment tax credit (ITC) of 30% of the project value. This credit expires at the end of 2008 and is capped at $2,000 for residential
systems.23
• Accelerated 5-year depreciation for commercial systems.
• The Renewable Energy Production Incentive (2.0 cents/kWh, but only for non-commercial
projects).24 With a total budget of about $5
million a year, this incentive could fully support only 142 MW of solar PV capacity.
The value of federal incentives is substantial. They are also skewed toward commercial rather than residential development because incentives are offered as tax credits and depreciation schedules. For example, the most lucrative solar incentive is the ITC because it’s simply 30% off the regular price. Tax credits are typically only valuable to wealthy individuals or
businesses with existing and ongoing tax liability. Unfortunately, most Americans do not have enough tax liability to fully use the tax credit and that limits the number of people that might consider an onsite solar power project.
Furthermore, a residential system also has a size cap of $2,000 under the ITC; no such cap exists for commercially-sited projects. The low ITC cap means that residential systems scaled to fully use the credit will provide about 1,500 kWh per year, little more than 20 percent of a typical household’s annual electricity use. In effect, the federal government is saying, “we don’t support residential self-sufficiency” when it comes to renewable electricity.
Figure 2 illustrates the disparity between residential and commercial systems receiving the ITC. Looking at systems of increasing size, by the time the two systems are around 0.8 kW, the residential system has hit the ITC cap, whereas the commercial system will continue to receive a tax credit worth 30% of the installed cost.
Commercial projects also have the advantage of utilizing accelerated depreciation, allowing businesses to write down the value of the solar project in a short timeframe and offset other tax liabilities. A homeowner can’t depreciate a rooftop solar panel. If a small business and a homeowner install a solar PV project of the same size – 2 kW, for example – the business owner stands to get an additional $2,500 benefit from accelerated depreciation compared to the
homeowner.25 Figure 3 compares the total federal
benefits for a 2 kW solar PV installation, one commercial and one residential.
New Rules Project www.newrules.org 9
$0
$2,000
$4,000
$6,000
$8,000
Residential Commercial
Investment Tax Credit Depreciation
Figure 3 - Federal Incentives for a 2 kW Solar PV Installation
Figure 2 - Investment Tax Credit for Residential and Commercial PV Systems
$0
$3,000
$6,000
$9,000
$12,000
0.5 1 2 5
ITC
Val
ue
System Size (kW peak)
Residential Commercial
The incentives for concentrating solar are more straightforward, since this technology is currently only deployed as a centralized, commercial power plant.
Table 2 shows the impact of federal incentives on the cost of solar power. It is assumed that commercial-owned systems are able to use the Investment Tax Credit and accelerated depreciation. The residential user (PV only) gets the capped $2,000 ITC and no depreciation. Since the Renewable Energy Production Incentive lacks sufficient funding to cover all projects and does not cover commercial installations, the table assumes no project receives this incentive.
As the table shows, federal incentives are strongly skewed toward lowering the price of business-owned
power generation. Commercial solar power prices drop by an average of 56% compared to Residential PV’s 12%. Interestingly, the lower operations costs of large, commercial solar PV make it the least expensive mature solar technology when counting incentives.
There are revealing figures about scale, as well. When a project is owned by a business, small PV projects are in the same production cost price range as the centralized, large-scale concentrating technologies. As shown in the table, the break-even price of electricity from a small PV system receiving the full ITC and accelerated depreciation is $0.19 per kWh. Federal incentives are biased against residential projects, where the cost of electricity from the small PV is reduced by only half as much as for commercial projects.
State Incentives
Some states and utilities provide funding to make up some of the gap in federal incentives between commercial and residential solar generators. Typically, state and utility programs focus on small-scale installations. States have several tools at their disposal, from upfront system cost rebates, to performance based tax credits, to sales and property tax exemptions. Utilities tend to favor rebates or production incentives. Table 3 lists the solar PV incentives provided by states and their utilities.26 States are listed if they or their utilities offer a rebate or tax credit. In some states, producers may be able to choose between a rebate or
production incentive, and both are listed. States with only a sales or property tax exemption are not listed.
Table 4 shows incentives for concentrating solar (called solar thermal electric).27 This table is much smaller, since many states and utilities do not provide incentives for solar concentrators. Instead of “buydown” programs, as are used with solar PV, incentives for concentrating solar are “performance incentives,” paid per kWh produced. [Note: Some states are changing or are considering changing their solar PV buydown programs into performance based incentives.]
New Rules Project www.newrules.org 10
Table 2 - Economics of Solar Electric Technologies with Federal Incentives
Decentralized Centralized
Residential PV
Small Comm. PV
Large Comm. PV
Trough Tower Dish Fresnel
Electricity Cost ($/kWh)
$0.41 $0.19 $0.14 $0.15 $0.16 $0.16 $0.05
Capital Cost ($/kW)
$8,000 $8,000 $6,000 $4,150 $18,000 $6,000 $1,820
Operations Cost (cents/kWh)
0.7 0.7 1.0 5.0 2.7 2.0 0.1
Status C=commercialP=prototype
C C C C C P P

New Rules Project www.newrules.org 11
State State RebateW=watt
Utility Rebate/Incentive(per Watt)
State Tax Credit P=personal
C=corporate
Tax exemption
Arizona $2.00-3.00 P=25% | C=10%
California $2.00-2.50/W or$0.06-0.31/kWh
$2.00-4.00 100% property
Colorado $4.00-5.00
Connecticut $5.00/W $0.03/kWh 100% property,sales
Delaware 50%
Florida $4.00/W $0.05/kWh
Illinois 30% 100% property
Louisiana P/C=50% P=100% property
Maine $7000 (total)
Maryland 20% $0.0085/kWh
Massachusetts $2.00-5.50/W $0.03/kWh P=15% 100% property,exciseR=100% sales
Minnesota $2.00/W $2.00 100% property,sales
Montana P=35%,$500C=35%
100% corporate (<1 MW)
100% property
Nebraska P/C=$0.00075/kWh
Nevada $3.00-5.00 100% property
New Jersey $3.80/W or $0.20-0.30/kWh
100% sales
New Mexico $0.13/kWh P=30% and$0.027/kWh
New York $4.00-4.50/W $3.50-4.50 P=25% 100% propertyR=100% sales
North Carolina $0.20/kWh P/C=35%
North Dakota P/C=15% 100% property
Ohio $3.50/W
Oklahoma C=~$0.005/kWh
Oregon $1.00-2.25/W +$0.10/kWh (>10kW)
P=$3/WC=50%
100% property
Rhode Island $0.03/kWh P/C=25% 100% property,sales
Tennessee 40% varies
Utah P=25% | C=10%
Vermont $1.75-3.50/W
Washington varies 100% sales
Wisconsin $1.00-2.00/kWh (1 year)
varies
Wyoming 50%
Table 3 - Solar PV Incentives by State

AnalysisState and utility incentives cannot erase the federal bias toward commercial systems, despite more attention to residential development. Only Connecticut reduces the break-even price of 2 kW residential solar to below that of a similar commercial installation. In some states, the incentive structure increases the disparity between commercial and residential systems.
However, state incentives do level the playing field between large and small. In at least 15 states, the price per kWh of small-scale commercial PV is less than large-scale (25 MW) PV, once state and utility incentives are factored in. This is largely due to project size caps on state or utility incentives.
New Rules Project www.newrules.org 12
State State IncentiveP=personal C=corporate
State Tax Credit P=personal C=corporate
Tax exemptions
Arizona P=25% ($1k)C=10% ($25k)
%increase property100% sales
California P/C=$0.06-0.31/kWh 100% property
Florida C=$0.01/kWh 100% sales
Iowa P/C=$0.015/kWh 100% property100% sales
Maryland P/C=$0.0085/kWh
Montana P/C=35% 100% corporate (<1 MW)
100% property
Nebraska P/C=$0.00075/kWh
Nevada P/C=$0.01/kWh 50% property
New Mexico P/C=$0.027/kWhC=6%
100% sales
North Carolina P/C=$0.18/kWh P/C=35%
North Dakota P/C=15% 100% property
Oklahoma C=~$0.005/kWh
Oregon C=50% 100% property
South Carolina P/C=25%
TVA* – TN, MS, KY, AL, NC, VA
P=$0.15/kWhC=$0.20/kWh
Utah P=25%C=10%
100% sales
Washington P/C=$0.12-0.54/kWh
Table 4 - Solar Thermal Electric Incentives by State
*The Tennessee Valley Authority (TVA) doesn’t provide an incentive, but a premium electricity price.

There’s no question that state incentives are a significant benefit for any solar PV installation. In several states, the cost of power from a residential, small-scale solar PV system drops from $0.41 per kWh with federal subsidies to less than $0.25 per kWh with the additional state incentive.
With incentives in six states, small-scale commercial PV projects can break even with a price of power of $0.10 per kWh, comparable to large-scale solar.
Concentrating solar also benefits from state incentives. In Nevada, property tax exemptions and other incentives shave off 20% of the capital cost over 10 years. These benefits are entirely for large-scale projects and commercial entities, since concentrating solar is currently only built at the megawatt scale.
In the end, state incentives aren’t sufficient to make up the difference between residential PV and commercial solar, whether PV or concentrating. However, in several cases, state incentives do provide small-scale, commercial PV with an edge over large-scale PV, and perhaps even concentrating solar.
We can expect that for both decentralized PV and centralized solar thermal electric power, as production expands and project sizes grow, unsubsidized costs will decline over time. To some extent, this is reflected in recent projects. Nevada Solar One, the most recently completed concentrating solar plant, came in at $4,000 per kW. And the proposed Southern California Edison 250 MW solar PV project promises an installed cost of $3,500 per kW.28 This compares to an installed cost of $8,000 per kW for typical small-scale solar PV projects in California.
Off the Balance SheetThe impact of government incentives for solar goes far beyond the financial balance sheet. The incentive structure skews toward commercially-owned solar, limits local ownership and lowers the potential economic benefits of solar. The bias also has implications for decentralized power generation, grid stability, and firm power production.
Local OwnershipWhen individuals or communities can produce their own power, it confers a sense of responsibility. Local ownership of solar power offers a number of benefits to the individual owner and the community.
Primarily, the solar panel owner reaps the financial benefits of ownership. They get low-cost power. Secondly, being an energy producer also increases the owner’s consciousness of their energy use leading them to save as much energy as possible. And getting power locally means that the solar project owner will be more aware of other opportunities to be self-sufficient, whether by tapping geothermal or other local energy sources.
The community also benefits when power generation is locally owned. People who own their rooftop solar panels are more likely to maintain them at peak efficiency, because they receive a tangible benefit and have ultimate responsibility. Revenues from the project also stay local. A commercial project is often absentee-owned, with the revenues flowing out of the local community. A locally-owned project retains a 25-200% greater economic impact for the community.29 With solar power, that’s in large part because local ownership keeps the federal solar
incentives in the community. Local ownership means paying ourselves to produce power.
The major roadblock to local ownership of solar is the high capital cost. A typical residential installation is between 3 and 5 kW, costing $24,000 to $40,000. Some businesses have tried to remove the roadblock with two non-ownership models.
In the first model, a solar lease, the panels are leased to the customer, who receives the benefits of local power generation without the upfront capital costs or maintenance requirements. After a number of years, customers may have the opportunity to buy their solar panels outright. Solar City, a residential solar leasing organization, typically offers a 15-year lease with an option to buy the panels for 10-20% of the original cost at the end of the term.
The solar lease is a novel way to confer ownership of solar projects that doesn’t require such significant upfront costs. However, the government incentives still accrue to the leasing company – not the owner –and that may dilute community wide economic benefits.
The second model is the solar power purchase agreement (PPA). Where the lease model has the customer pay for the panels and then get the power for free, the solar PPA model has the customer simply pay for the electricity that's being generated. A customer signs a 15 to 20-year agreement to buy the solar power at a fixed rate (but often with an inflation adjustment). In this model, the customer may never own the physical PV panels and all government incentives accrue to the solar provider.
New Rules Project www.newrules.org 13

These two financing models are becoming popular in the largest U.S. solar market, California. While only 3.6% of solar projects under the state’s Solar Initiative have third party ownership (indicative of a solar lease or PPA model), almost 44% of total installed capacity is not owned by the property owner.30
While these financing models do lower the upfront costs, they also reduce the lifetime economic benefits and sense of responsibility that comes with ownership.
Decentralization, Transmission and Grid StabilityThe smaller scale of solar PV allows it to be built closer to load, reducing transmission distances (e.g. line losses) and aids in electric grid stability (e.g. serving local loads). The shortening of transmission distances has two distinct advantages.
The shortening of transmission distances can help save power. Between 5 and 10 percent of power generated at the solar panel or concentrating solar station can be lost before it reaches the end user. With a rooftop solar panel, however, these transmission losses are avoided. However, solar PV generates power in direct current (DC) and must be converted to alternating current (AC). Around 5-10 percent of power can be lost in this conversion, so transmission savings may be negated.
A greater advantage of decentralized solar is saving the cost of constructing such transmission capacity. The experience with wind power provides a stark illustration. One recent study concluded that injecting 1,400 MW of wind power into the existing transmission and distribution system in West Central Minnesota would cost $80 million,31 or around $38,000 per MW while proposed capacity and reliability upgrades to Minnesota’s high power transmission lines will cost nearly $1.6 billion, or $900,000 per MW.32 Decentralized power saves big on transmission.
Solar concentrators could potentially be built in a more decentralized fashion. Smaller CSP plants – five megawatts, for example – could adapt to local load and grid capacity. In California, a company called eSolar has collected substantial venture capital on a proposal to build “modular” 33 MW solar tower plants, small enough to avoid licensing by the California Energy Commission.33 This shortens development time by 1-2 years. Building smaller CSP plants would be a significant development in the industry, where most proposed facilities are larger than 50 MW.
Dispersed, distributed power generation can also provide additional stability to the electric grid. By decentralizing generation, the risk of power station failure is reduced. Many generators make for a smaller chance of large power outages.
Firm and Baseload PowerGetting greater round-the-clock, firm power production may be one rationale of the federal incentives for solar concentrators. All types of solar power can be stored: solar PV in batteries and solar concentrators in oil or molten salt “thermoses.” However, unless battery costs decline, storage costs for solar thermal are currently a tenth that of solar PV.
With solar concentrators, thermal storage capacity allows the power plants to store solar energy for hours after the sun has set and to generate power “on demand.” Some of the newer plants have upwards of 12 hours of storage, which may allow them to be considered firm power sources, available to the grid at any time of day. This type of power source is more valuable to power companies than “intermittent” power sources.
Having solar operate 24 hours a day also means it can serve as baseload power and can make a run at displacing coal-fired power plants that can run round-the-clock.
New Rules Project www.newrules.org 14

SummarySolar concentrators promise a new level of development for clean electric power in the United States. Large size and central development allow them to provide hundreds of megawatts in just a few projects and substantially increase the penetration of renewable power in the U.S. electrical grid. Thermal storage may make solar power competitive as a firm, baseload source of electricity. These are great developments for the progress of renewable energy because it means renewables could supplant all kinds of fossil fuel electricity generation.
However, public renewable energy policy should not play favorites. Recent data suggests that solar PV and solar concentrators are close to price parity. But federal incentives heavily favor large-scale, commercial solar plants at the expense of decentralized and residential solar. This economic favoritism costs communities many of the off balance sheet benefits of decentralized, locally owned projects. We need the
benefits of both centralized and decentralized power to move the United States toward a clean energy future.
There are simple ways to level the playing field. If the Investment Tax Credit is renewed, it should remove the cap on benefits to residential producers. As states and utilities provide rebates or tax incentives, they shouldn’t constrain residential development with smaller caps. And most importantly, both state and federal governments should pursue production-based incentives for solar power, since they align incentives and allow those without large tax liability to participate in renewable energy production.
Solar’s ubiquitous presence provides a unique opportunity to develop renewable energy that can both supplant significant quantities of fossil fuel power and allow for significant local ownership. Reaping these benefits means establishing fair policies for encouraging solar power development.
New Rules Project www.newrules.org 15

References
New Rules Project www.newrules.org 16
1 At an average size of 5 kW, typical of California in 2005.
2 The data reflects only “on-grid” solar power. The United States had around 270 MW of “off grid” solar PV installed at the end of 2006. The vast majority of new installations will be on-grid.
3 “Trends in Photovoltaic Applications.” (International Energy Agency, August 2007), 4. Accessed 3/19/08 at http://tinyurl.com/296ws2.
4 Wikipedia contributors, "List of solar thermal power stations," (Wikipedia, The Free Encyclopedia). Accessed 3/19/08 at http://tinyurl.com/2n2578.
5 Jones, Scott. “Concentrating Solar Power: the ‘Other’ Solar.” (Sandia National Laboratories, 10/19/04). Accessed 4/18/08 at http://tinyurl.com/3kyxx8.
6 Stoddard, L., et al. “Economic, Energy, and Environmental Benefits of Concentrating Solar Power in California.” (NREL, April 2006), p. 2-3.
7 Energy Information Administration. Accessed 4/16/08 at http://tinyurl.com/6xbpz4.
8 Jones, Carolyn. “Berkeley going solar - city pays up front, recoups over 20 years.” (SF Gate, 10/26/07). Accessed 4/16/08 at http://tinyurl.com/3r63g9.
9 Simons, George and Josh McCabe. “California Solar Resources.” (California Energy Commission, April 2005), 7. Accessed 4/15/08 at http://tinyurl.com/yqqxo9.
10 “Solar Generations – FAQs.” (Solar Generations, undated). Accessed 3/27/08 at http://tinyurl.com/3b7t5o.
11 “Nevada Solar One gets $266M in financing.” (United Press International, 7/30/07). Accessed 3/27/08 at http://tinyurl.com/yvcdb2.
12 Calculated from reported cost of power (12-20 cents per kWh) and estimated financing costs of capital.
13 Sargent and Lundy LLC Consulting Group . “Assessment of Parabolic Trough and Power Tower Solar Technology Cost and Performance Forecasts.” (NREL, October 2003), p. 5-26. Accessed 4/1/08 at http://tinyurl.com/ywlo7a.
14 Sargent and Lundy LLC Consulting Group.
15 Martin, Jose C. “Solar Tres.” (SENER Ingeniería y Sistemas, S.A., Presentation to NREL CSP Technology Workshop, 3/7/07). Accessed 3/20/08 at http://tinyurl.com/2ywlnx.
16 Sargent and Lundy LLC Consulting Group.
17 “Sandia, Stirling to build solar dish engine power plant.” (Sandia National Labs News Center, 11/9/04). Accessed 3/20/08 at http://tinyurl.com/pyxgg.
18 Smith, Terry. “Concentrating Solar Power Technology Workshops.” (Presented at NREL 2007 Solar Power Tower, Dish Stirling and Linear Fresnel Technologies Workshop, March 2007). Accessed 3/21/08 at http://tinyurl.com/yolhd3.
19 “Markets for Concentrating Solar Power.” (April 1998). Accessed 6/4/07 at http://tinyurl.com/2hgc7c.
20 Stoddard, p. 3-1.
21 Haberle, Andreas, et al. “The Solarmundo line focusing Fresnel collector. Optical and thermal performance and cost calculations.” (Available through Solar Power Group, 2003?). Accessed 3/24/08 at http://tinyurl.com/2bt9q2.
22 “Federal Incentives for Renewable Energy.” (DSIRE, 2007). Accessed 6/5/07 at http://tinyurl.com/2xcbbe.
23 A Senate Bill, H.R. 3221, proposes to lift the $2,000 cap on residential systems. http://tinyurl.com/4zhxl4. S.2821 proposes an eight-year extension of the ITC.
24 “Renewable Energy Production Incentive (REPI).” (DSIRE, 3/18/08). Accessed 4/15/08 at http://tinyurl.com/5ce92m.
25 Given an installed cost of $24,000, 10% cost of capital, 20% tax rate, no depreciation for the homeowner and 5-year accelerated depreciation for the business owner.
26 Gouchoe, Susan. “State Solar Incentives – News from DSIRE.” (IREC 2006: Updates & Trends, IREC, October 2006). Accessed 3/26/08 at http://tinyurl.com/23up4v.
27 Database of State Incentives for Renewables and Efficiency, 2008. Accessed 3/26/08 at http://tinyurl.com/32dpqq.
28 Daily, Matt. “California Utility to Add 250 MW in Solar Cells.” (Reuters, 3/27/08). Accessed 4/4/08 at http://tinyurl.com/58cu54.
29 ILSR study of local economic impact, forthcoming.
30 “California Solar Initiative, Staff Progress Report.” (CPUC, April 2008), 41. Accessed 4/29/08 at http://tinyurl.com/4lry9z.
31 “Community Based Energy Development Transmission Study.” Performed by the CAPX2020 Utilities with the concurrence of the Minnesota Department of Commerce and the North American Water Office. (1/18/07). Accessed 12/11/07 at http://tinyurl.com/3xy89o.
32 “CAPX2020 Application to the Minnesota Public Utilities Commission for Certificates of Need.” (MPUC Docket No. ET02, E-002/CN-06-1115; 8/16/07), p. 1.17. Accessed 12/11/07 at http://tinyurl.com/2483j9.
33 Woody, Todd. “eSolar scores $130 million from Google, other investors.” (Fortune, 4/21/08). Accessed 4/29/08 at http://tinyurl.com/6gag8o.