Comstock Holding Companies, Inc. Investor...
33
Comstock Holding Companies, Inc. Investor Presentation JUNE 30, 2019 Market Leading, Mixed-Use & Transit-Oriented Portfolio in Washington, DC’s Dulles Corridor
-
Upload
doannguyet -
Category
Documents
-
view
213 -
download
0
Transcript of Comstock Holding Companies, Inc. Investor...

Comstock Holding Companies, Inc. Investor PresentationJUNE 30, 2019
Market Leading, Mixed-Use & Transit-Oriented Portfolio in Washington, DC’s Dulles Corridor

DISCLOSURES
This release includes “forward-looking” statements that are made pursuant to the safe harbor provisions of the Private Securities
Litigation Reform Act of 1995. These forward-looking statements can be identified by use of words such as “anticipate,” “believe,”
“estimate,” “may,” “intend,” “expect,” “will,” “should,” “seeks” or other similar expressions. Forward-looking statements are based
largely on our expectations and involve inherent risks and uncertainties, many of which are beyond our control. You should not
place undue reliance on any forward-looking statement, which speaks only as of the date made. Additional information concerning
important risks and uncertainties can be found under the heading “Risk Factors” in our most recent Annual Report on Form
10-K, as filed with the Securities and Exchange Commission. Our actual results could differ materially from these projected or
suggested by the forward-looking statements. Comstock claims the protection of the safe harbor for forward-looking statements
contained in the Private Securities Litigation Reform Act of 1995 for all forward-looking statements contained herein. Comstock
specifically disclaims any obligation to update or revise any forward-looking statements, whether as a result of new information,
future developments or otherwise.
While every attempt has been made to ensure the accuracy of included measurements, all future development measurements are
based on available information at the time of production of this Investor Presentation and therefore all square foot measurementsare
subject to change without notice.
2JUNE 30, 2019

A DIVERSIFIED REAL ESTATE OPERATOR
• Comstock is at the forefront of the urban transformation of one of the most dynamic real estate markets in the nations, Washington, DC’s Dulles Corridor, where it controls a stabilized portfolio and fully entitled development pipeline that includes ~7 million square feet of mixed-use and transit-oriented properties located adjacent to key Metro Stations on the Silver Line (“Anchor Portfolio”)
• Comstock’s market leading position in the Dulles Corridor, coupled with its multiple revenue sources and its profits interest in the Anchor Portfolio provide a platform for additional growth and an opportunity to enhance shareholder value
• Comstock Holding Companies, Inc. (NASDAQ: CHCI) is a diversified real estate developer and asset manager with a 30+ year track record of successfully investing in, developing, and operating residential, commercial, mixed-use, and transit-oriented real estate, delivering thousands of residential units and millions of square feet of mixed-use and transit-oriented assets while earning its reputation as a premier real estate developer and operator in the Washington, DC region
• Comstock acquires, develops, and manages real estate for its own account, as fund sponsor, asset manager, and as managing partner of multiple Public-Private Partnerships (“P3”), aligning its interests with stakeholders by investing alongside in the real estate acquisitions and developments that it sources
• Comstock creates value for all stakeholders through the thoughtful design, development and operation of high-quality real estate assets, with a focus on indenitfying unique opportunities that are well positioned to capitalize on emerging trends and to produce above average returns
• Comstock participates in the value created through its development and asset management services related to the Anchor Portfolio in the Dulles Corridor where Metro’s new Silver Line provides rail service connecting Reston to Tysons and Washington, DC and is currently being expanded to connect to Dulles International Airport and Eastern Loudoun County
A PLATFORM FOR GROWTH THAT CREATES VALUE FOR ALL STAKEHOLDERS
3JUNE 30, 2019
RECAPITALIZATION PROVIDES CLEAN AND INVESTIBLE BALANCE SHEETIN APRIL 2019, COMSTOCK ANNOUNCED COMPLETION OF A SERIES OF TRANSACTIONS THAT ACCOMPLISHED:
• Elimination of capital intensive, for-sale homebuilding unit, reducing exposure to highly volatile for-sale market
• Complete divestment of all liabilities associated with legacy homebuilding operation
• Transfer to Company of cashflow resulting from ~$18.5M of prior capital investments in homebuilding assets
• Entry into a new asset management agreement (“2019 AMA”) that increases revenue opportunities associated with anchor portfolio of assets under management
• The 2019 AMA replaces original asset management agreement (“2018 AMA”) and its cost-plus revenue feature with a modified market rate fee structure that preserves the stability of the cost-plus feature but removes the revenue cap element of the 2018 AMA
• The 2019 AMA covers a portfolio of nearly 7 million square feet of investment-grade, transit-oriented and mixed-use assets encompassing more than 2,800 multi-family units, Class A and Trophy office, destination retail, hotels, and commercial parking garages located at two Metro stops on the new Silver Line in the Dulles Corridor
• Assets under management (“AUM”) have an estimated value of $2.5 to $3.0 Billion at full build out
4JUNE 30, 2019
ENHANCED OPERATING PLATFORM
• Asset light, fee-based revenue model increases return on invested capital while generating multiple new revenue sources
• 2019 AMA covers significant portfolio of irreplaceable stabilized assets and development pipeline at key Metro stations in Washington, DC’s Dulles Corridor
• 10-year term of anchor asset management agreement provides reliable asset management fee-based revenue and upside participation while providing downside protection through cost-plus provision
• Asset management services provided to family offices, institutional investors, lenders, owners and municipalities with real estate interests provides reliable long-term revenue opportunities, with “promote” providing upside participation
• Providing real estate related services, including; development services, property management, loan originations, and financial consulting services enhance revenue opportunities
• Providing development supply chain services, including; entitlement management services, environmental consulting and environmental remediation services provides additional high-margin revenue opportunities
• Environmental remediation platform generates healthy gross margins and is designed for growth with minimal capital outlay while highly fractured nature of industry provides potential acquisition opportunities
NEW STRATEGY GENERATES NEW REVENUE SOURCES
5JUNE 30, 2019

ASSET MANAGEMENT REVENUE DETAILS
Wholly owned subsidiary, Comstock Asset Management, LC, manages the anchor portfolio including ~7M square feet of institutional quality mixed-use and transit-oriented assets (stabilized, under construction, and scheduled to begin construction during the next several years) in the Dulles Corridor of the Washington, DC region. The term of the Anchor Asset Management Agreement runs through 2027
Asset management fees are calculated as the greater of the annual operating costs of Comstock Holding Companies, Inc, plus $1,000,000 or the aggregate of the market rates fees, including:
• Asset management fee as a percentage of managed portfolio revenues
• Construction management fee as a percentage of development costs
• Property management fee as a percentage of revenue of managed properties
• Property management oversight fee as a percentage of managed portfolio revenues
• Acquisition fee as a percentage of the purchase price of any acquired asset
• Disposition fee as a percentage of the sales price of the disposition asset
In addition, a “Promote” incentive fee equal to a percentage of the free cashflow generated by each managed asset above the applicable prescribed preferred return on invested capital
ANCHOR PORTFOLIO PROVIDES GROWTH OPPORTUNITY
6JUNE 30, 2019

ASSET MANAGEMENT REVENUE DETAILS
Wholly owned subsidiary, Comstock Real Estate Services, LC generates fee-based revenue from its various business interests, which include:
• Equity Capital Investment origination fee equal to a percentage of equity capital raised from unrelated third parties to benefit capital stack of managed assets
• Debt Capital origination fee equal to a percentage of debt capital raised from unrelated third parties to benefit capital stack of managed assets
• Leasing fee based on the square feet of lease originations and lease renewals applicable to managed commercial assets
• Fees for provision of environmental consulting and remediation services in the Washington, DC metropolitan area and in New Jersey and Pennsylvania
• Fees related to title insurance services provided through a joint venture with Superior Title
• Fees for financial consulting services related to temporary employment services and recruiting services
• Additional growth will be generated through acquisitions, third party asset management, and real estate services
ANCHOR PORTFOLIO PROVIDES PLATFORM FOR GROWTH
7JUNE 30, 2019

GROWTH OF STABILIZED AND DEVELOPMENT ASSETS UNDER MANAGEMENT
Q1 2018 CURRENT
COMMERCIAL 958,000 SF 2,350,000 SF
MULTIFAMILY 2,000,000 SF 3,400,000 SF
HOTELS 0 500,000 SF
RETAIL 314,000 SF 450,000 SF
TOTAL SF 3,272,000 SF 6,700,000 SF
Number of commercial assets 7 13
Number of multifamily assets 6 (1,400 units) 10 (2,800 units)
Number of hotel assets 0 (0 Keys) 2 (400 Keys)
TOTAL number of assets 13 25
Figures are approximate and include future development assets.8JUNE 30, 2019

GROWTH OF STABILIZED AND DEVELOPMENT ASSETS UNDER MANAGEMENT
SQFT
(mill
ions
)
Under construction / Current development pipelineOperating
-
1.0
2.0
3.0
4.0
5.0
6.0
7.0
2019 2020 2021 2022 2023 2024 2025
Operating Under construction / Development pipeline Figures are approximate and include future development assets.
9JUNE 30, 2019
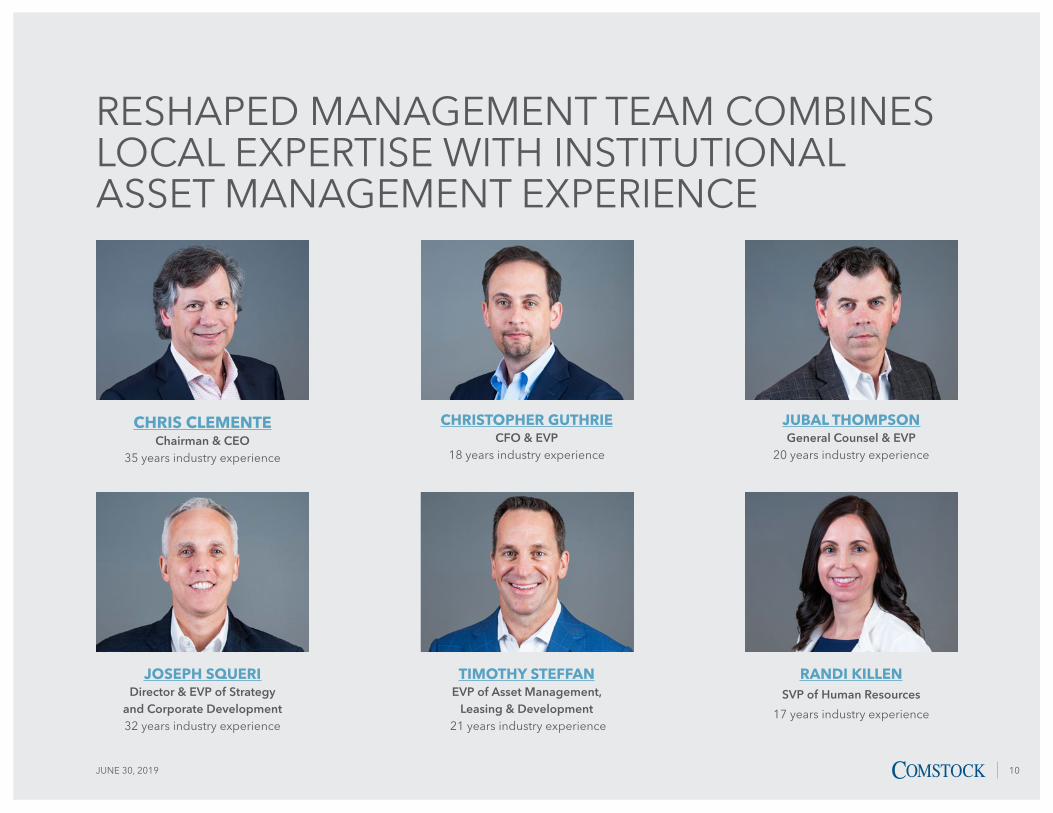
RESHAPED MANAGEMENT TEAM COMBINES LOCAL EXPERTISE WITH INSTITUTIONAL ASSET MANAGEMENT EXPERIENCE
CHRIS CLEMENTE Chairman & CEO
35 years industry experience
JOSEPH SQUERI Director & EVP of Strategy
and Corporate Development 32 years industry experience
CHRISTOPHER GUTHRIE CFO & EVP
18 years industry experience
TIMOTHY STEFFAN EVP of Asset Management,
Leasing & Development 21 years industry experience
JUBAL THOMPSON General Counsel & EVP
20 years industry experience
RANDI KILLEN SVP of Human Resources
17 years industry experience
10JUNE 30, 2019
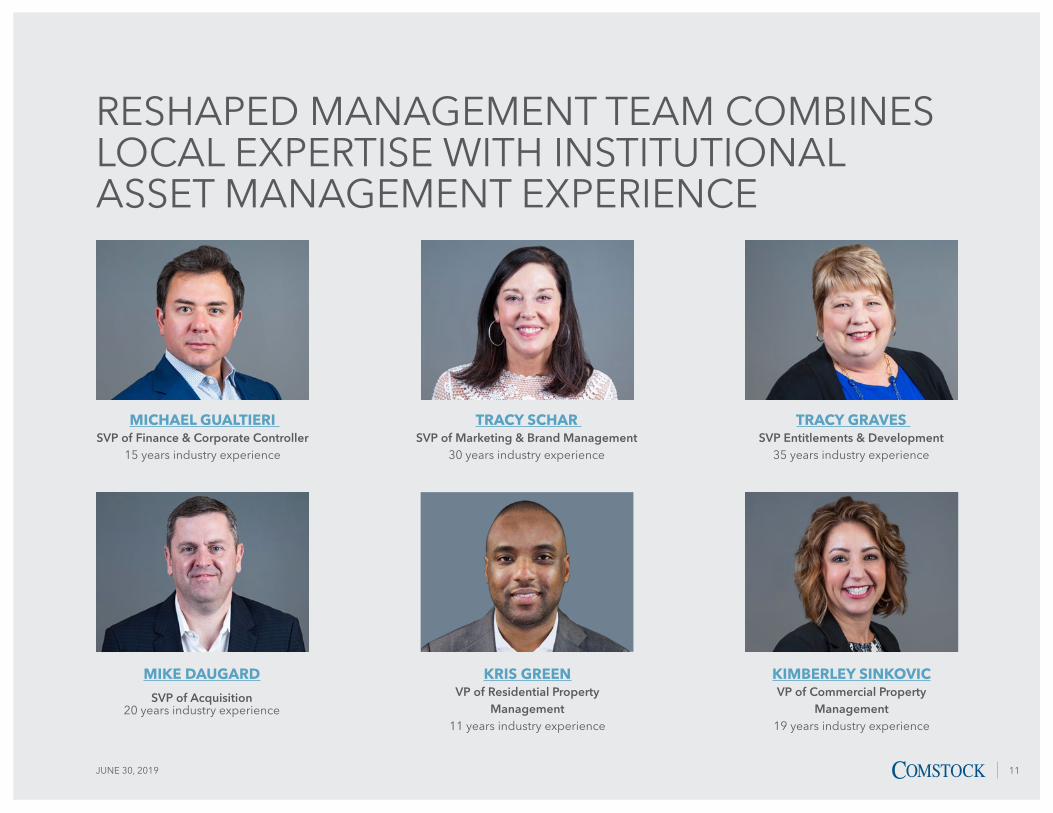
MIKE DAUGARD
SVP of Acquisition20 years industry experience
RESHAPED MANAGEMENT TEAM COMBINES LOCAL EXPERTISE WITH INSTITUTIONAL ASSET MANAGEMENT EXPERIENCE
MICHAEL GUALTIERI SVP of Finance & Corporate Controller
15 years industry experience
TRACY SCHAR SVP of Marketing & Brand Management
30 years industry experience
TRACY GRAVES SVP Entitlements & Development
35 years industry experience
KRIS GREEN VP of Residential Property
Management 11 years industry experience
KIMBERLEY SINKOVIC VP of Commercial Property
Management 19 years industry experience
11JUNE 30, 2019
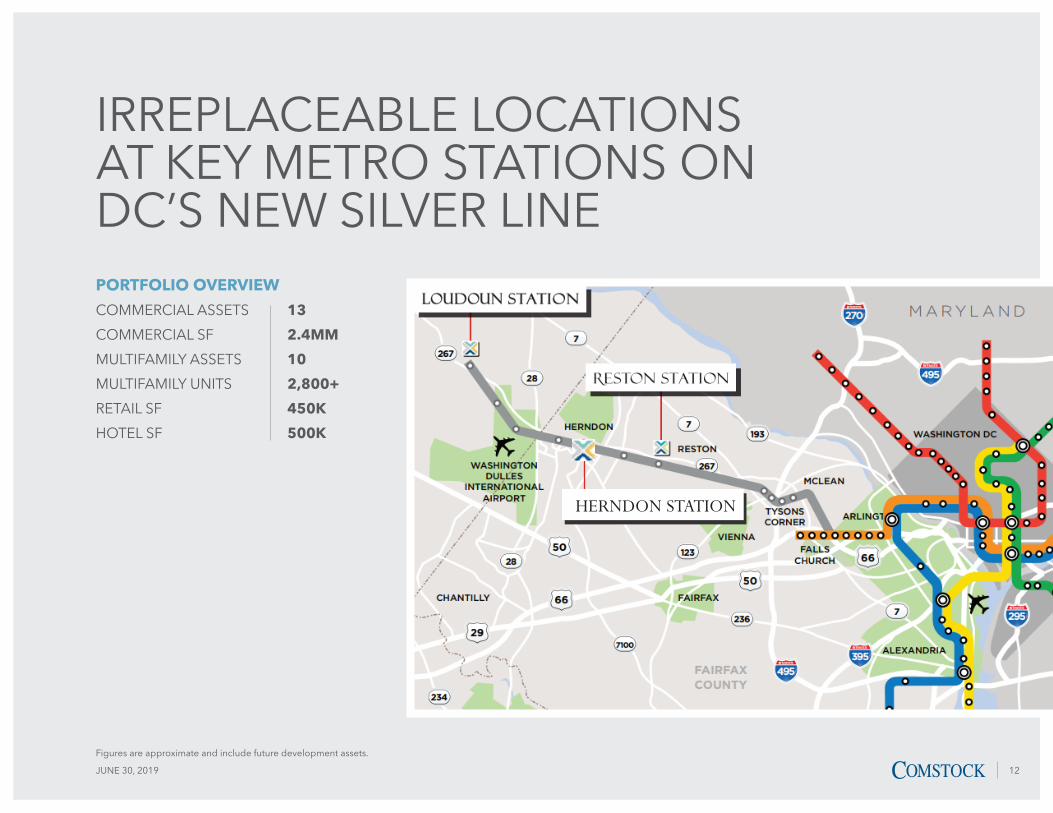
IRREPLACEABLE LOCATIONS AT KEY METRO STATIONS ON DC’S NEW SILVER LINEPORTFOLIO OVERVIEW
COMMERCIAL ASSETS 13
COMMERCIAL SF 2.4MM
MULTIFAMILY ASSETS 10
MULTIFAMILY UNITS 2,800+
RETAIL SF 450K
HOTEL SF 500K
HERNDON STATION
Figures are approximate and include future development assets.
12JUNE 30, 2019
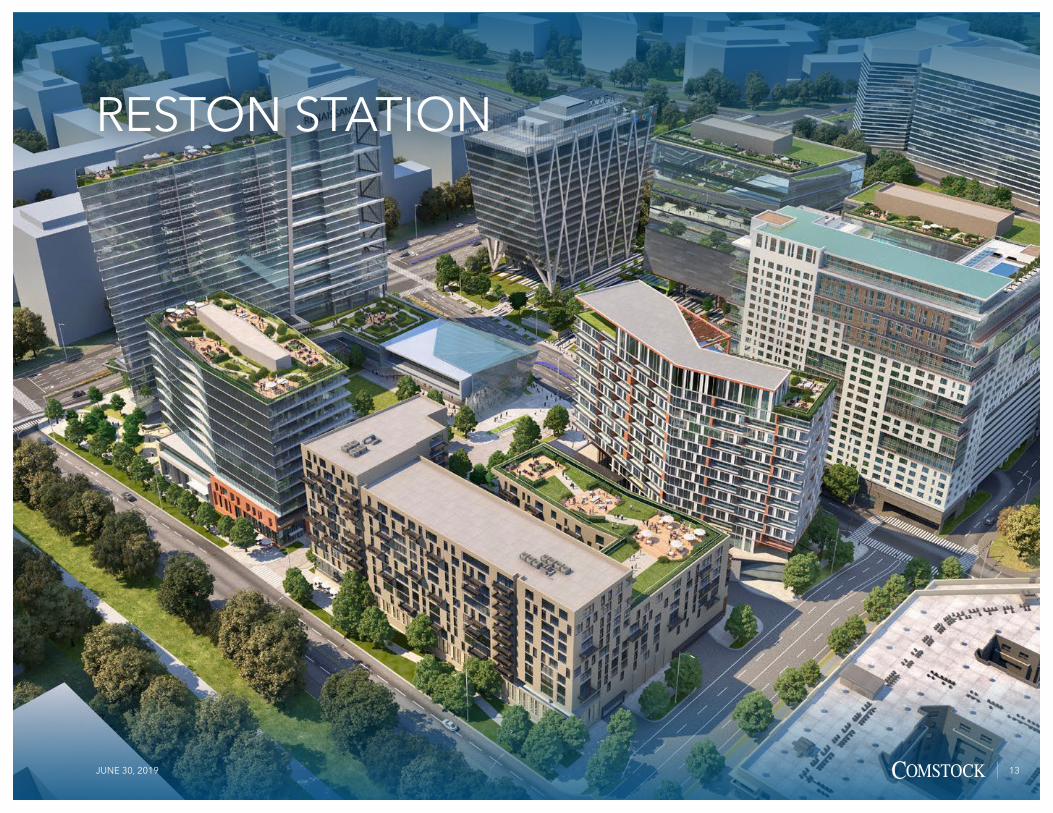
RESTON STATION
13JUNE 30, 2019
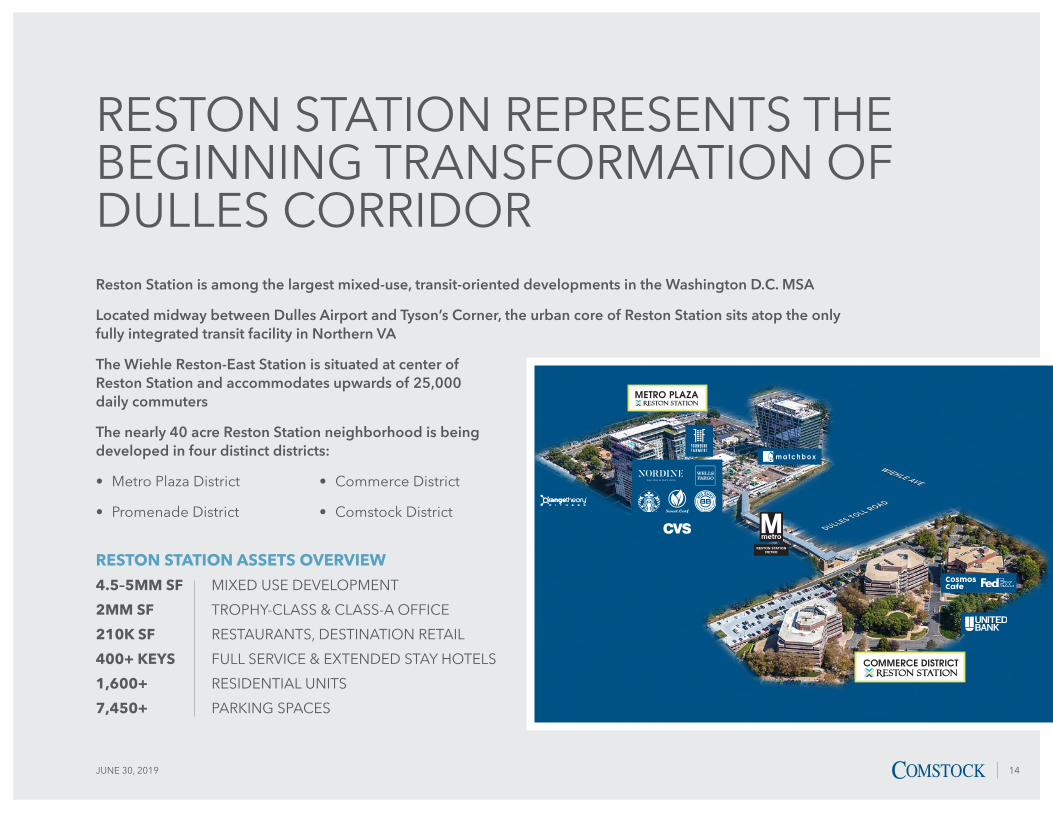
RESTON STATION METRO
COMMERCE DISTRICT
METRO PLAZA
WIEHLE AVE
DULLES TOLL ROAD
Reston Station is among the largest mixed-use, transit-oriented developments in the Washington D.C. MSA
Located midway between Dulles Airport and Tyson’s Corner, the urban core of Reston Station sits atop the only fully integrated transit facility in Northern VA
The Wiehle Reston-East Station is situated at center of Reston Station and accommodates upwards of 25,000 daily commuters
The nearly 40 acre Reston Station neighborhood is being developed in four distinct districts:
• Metro Plaza District
• Promenade District
• Commerce District
• Comstock District
RESTON STATION ASSETS OVERVIEW
4.5–5MM SF MIXED USE DEVELOPMENT
2MM SF TROPHY-CLASS & CLASS-A OFFICE
210K SF RESTAURANTS, DESTINATION RETAIL
400+ KEYS FULL SERVICE & EXTENDED STAY HOTELS
1,600+ RESIDENTIAL UNITS
7,450+ PARKING SPACES
RESTON STATION REPRESENTS THE BEGINNING TRANSFORMATION OF DULLES CORRIDOR
14JUNE 30, 2019
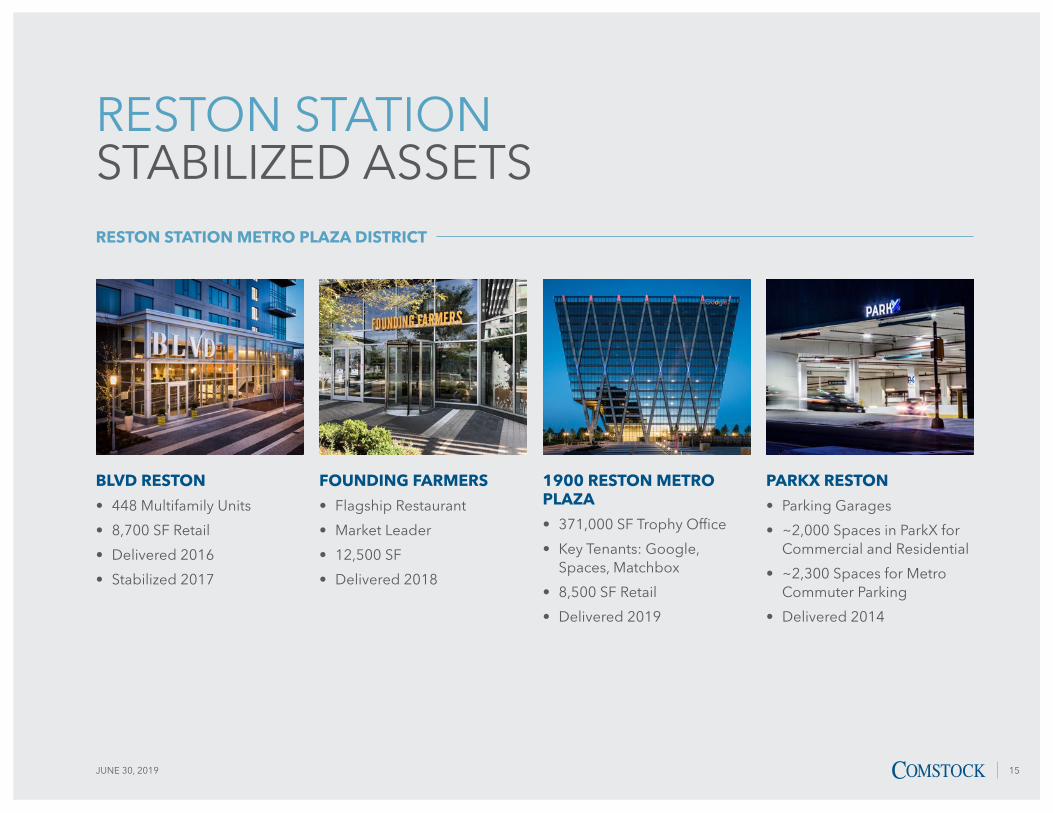
RESTON STATION STABILIZED ASSETS
BLVD RESTON
• 448 Multifamily Units
• 8,700 SF Retail
• Delivered 2016
• Stabilized 2017
1900 RESTON METRO PLAZA
• 371,000 SF Trophy Office
• Key Tenants: Google, Spaces, Matchbox
• 8,500 SF Retail
• Delivered 2019
FOUNDING FARMERS
• Flagship Restaurant
• Market Leader
• 12,500 SF
• Delivered 2018
PARKX RESTON
• Parking Garages
• ~2,000 Spaces in ParkX for Commercial and Residential
• ~2,300 Spaces for Metro Commuter Parking
• Delivered 2014
RESTON STATION METRO PLAZA DISTRICT
15JUNE 30, 2019
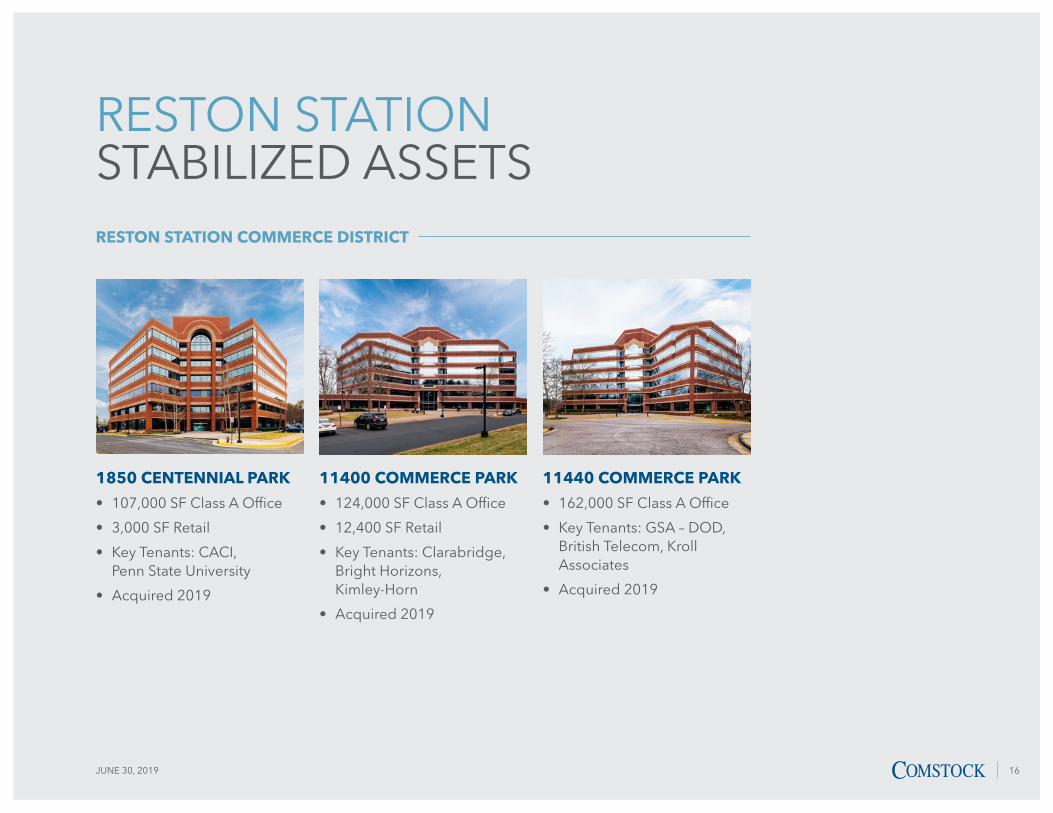
RESTON STATION STABILIZED ASSETS
11400 COMMERCE PARK
• 124,000 SF Class A Office
• 12,400 SF Retail
• Key Tenants: Clarabridge, Bright Horizons, Kimley-Horn
• Acquired 2019
1850 CENTENNIAL PARK
• 107,000 SF Class A Office
• 3,000 SF Retail
• Key Tenants: CACI, Penn State University
• Acquired 2019
11440 COMMERCE PARK
• 162,000 SF Class A Office
• Key Tenants: GSA – DOD, British Telecom, Kroll Associates
• Acquired 2019
RESTON STATION COMMERCE DISTRICT
16JUNE 30, 2019

RESTON STATION UNDER CONSTRUCTION AND DEVELOPMENT PIPELINE
ONE PROMENADE
• 250,000 SF Office
• 41,500 SF Health Club
• Construction Starts 2020
• Delivery 2022
RENAISSANCE HOTEL + DAKOTA CONDOS
• 243 Keys
• 90 Condos
• Construction Starts 2020
• Delivery 2022
BLVD PROMENADE + CINEMA
• 360 Multifamily Units
• 41,500 SF Cinema
• Construction Starts 2021
• Delivery 2023
TWO PROMENADE
• 180,000 SF Class A Office
• 15,000 SF Retail
• Construction Starts 2022
• Delivery 2024
RESTON STATION PROMENADE DISTRICT
All figures and dates are estimates and subject to change.
17JUNE 30, 2019
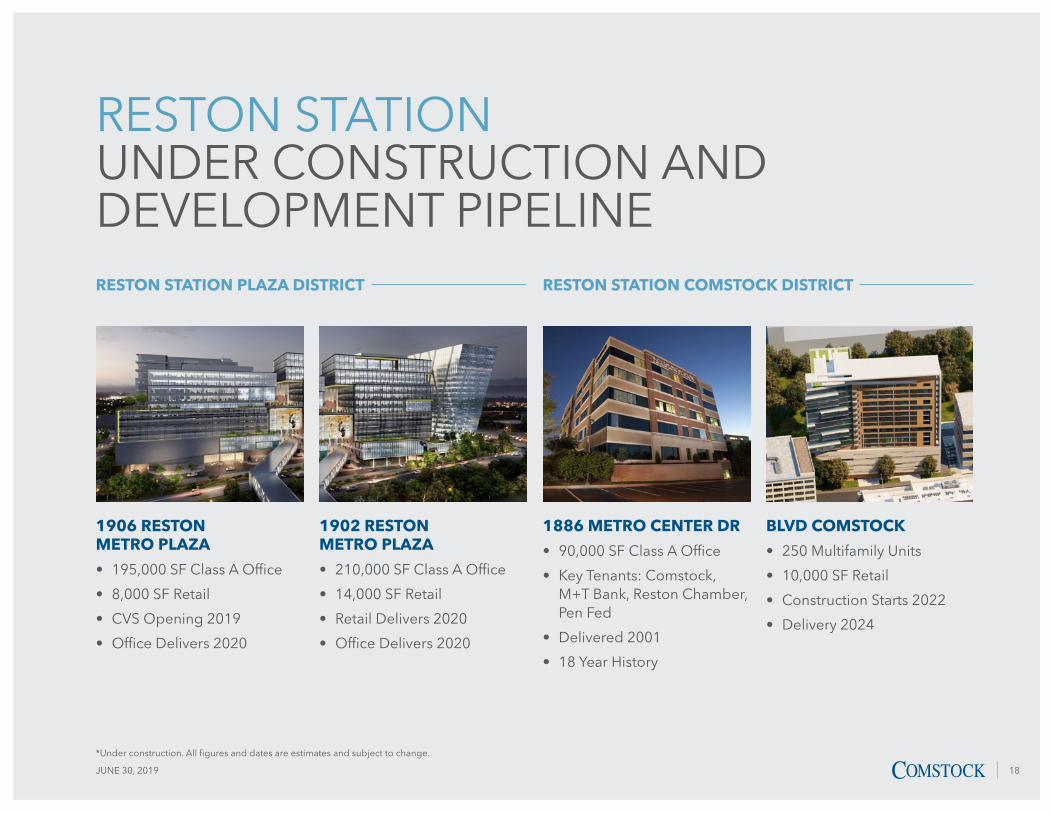
1906 RESTON METRO PLAZA
• 195,000 SF Class A Office
• 8,000 SF Retail
• CVS Opening 2019
• Office Delivers 2020
1902 RESTON METRO PLAZA
• 210,000 SF Class A Office
• 14,000 SF Retail
• Retail Delivers 2020
• Office Delivers 2020
RESTON STATION PLAZA DISTRICT
RESTON STATION UNDER CONSTRUCTION AND DEVELOPMENT PIPELINE
1886 METRO CENTER DR
• 90,000 SF Class A Office
• Key Tenants: Comstock, M+T Bank, Reston Chamber, Pen Fed
• Delivered 2001
• 18 Year History
*Under construction. All figures and dates are estimates and subject to change.
BLVD COMSTOCK
• 250 Multifamily Units
• 10,000 SF Retail
• Construction Starts 2022
• Delivery 2024
RESTON STATION COMSTOCK DISTRICT
18JUNE 30, 2019
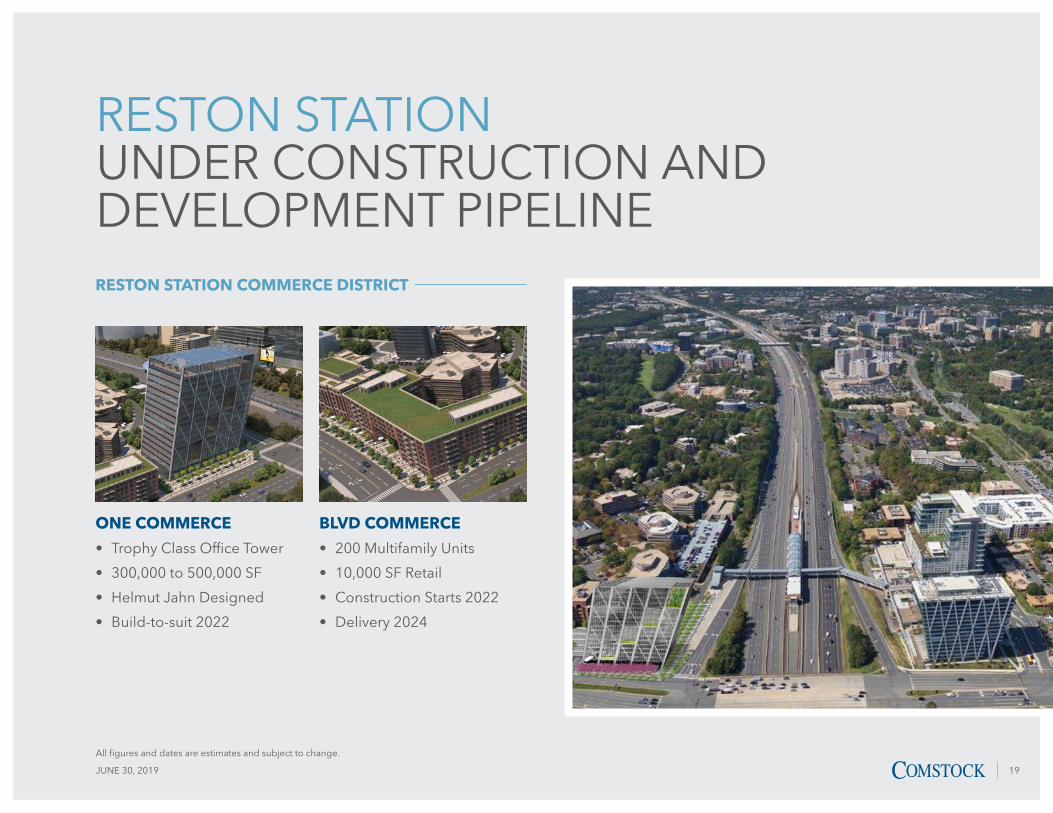
RESTON STATION UNDER CONSTRUCTION AND DEVELOPMENT PIPELINE
ONE COMMERCE
• Trophy Class Office Tower
• 300,000 to 500,000 SF
• Helmut Jahn Designed
• Build-to-suit 2022
BLVD COMMERCE
• 200 Multifamily Units
• 10,000 SF Retail
• Construction Starts 2022
• Delivery 2024
RESTON STATION COMMERCE DISTRICT
All figures and dates are estimates and subject to change.
19JUNE 30, 2019
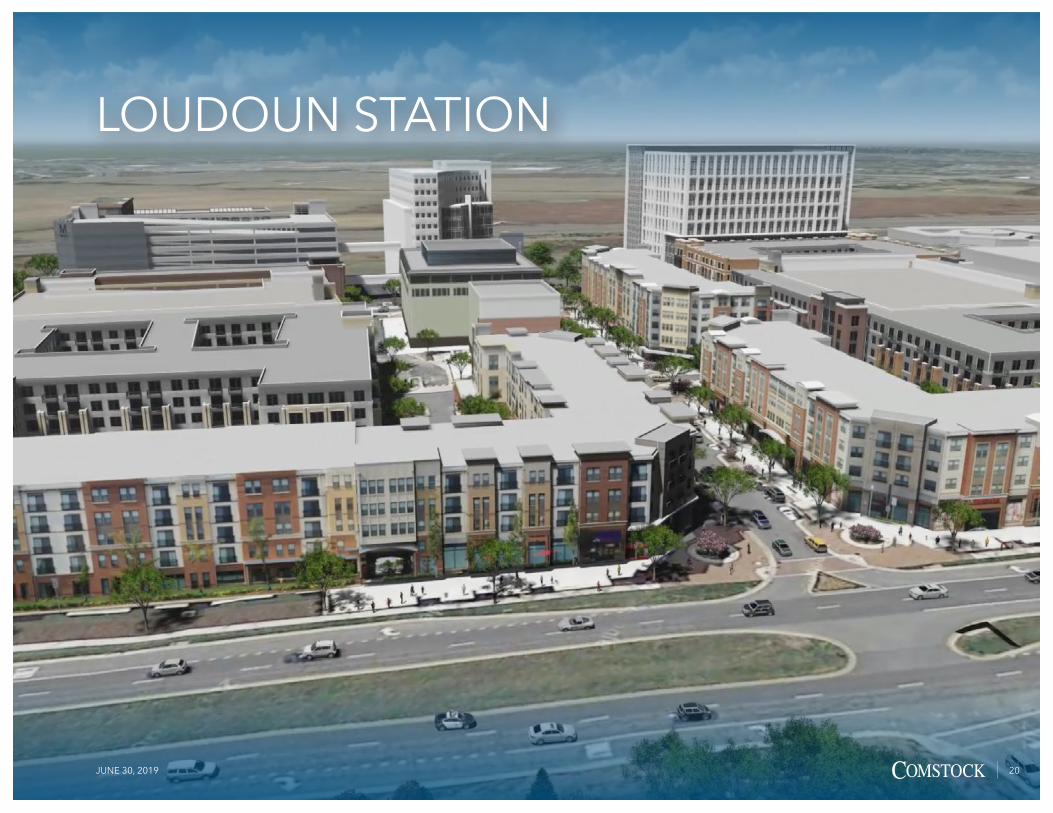
LOUDOUN STATION
20JUNE 30, 2019
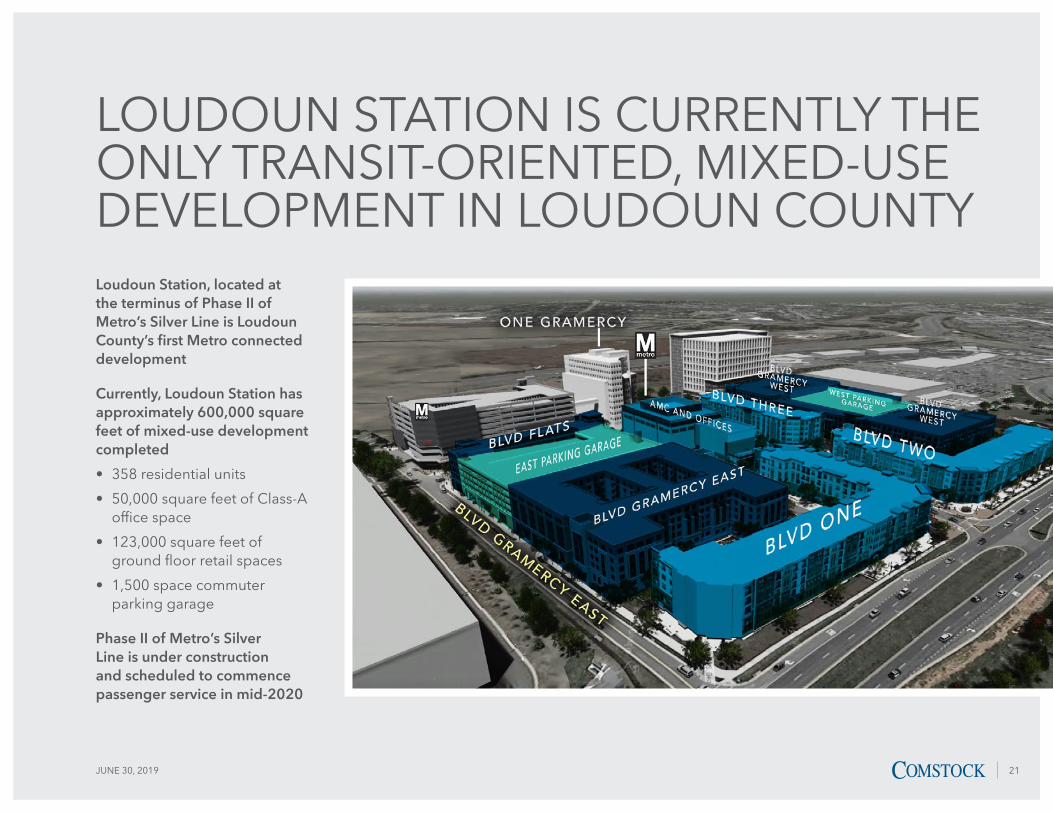
Loudoun Station, located at the terminus of Phase II of Metro’s Silver Line is Loudoun County’s first Metro connected development
Currently, Loudoun Station has approximately 600,000 square feet of mixed-use development completed
• 358 residential units
• 50,000 square feet of Class-A office space
• 123,000 square feet of ground floor retail spaces
• 1,500 space commuter parking garage
Phase II of Metro’s Silver Line is under construction and scheduled to commence passenger service in mid-2020
LOUDOUN STATION IS CURRENTLY THE ONLY TRANSIT-ORIENTED, MIXED-USE DEVELOPMENT IN LOUDOUN COUNTY
21JUNE 30, 2019
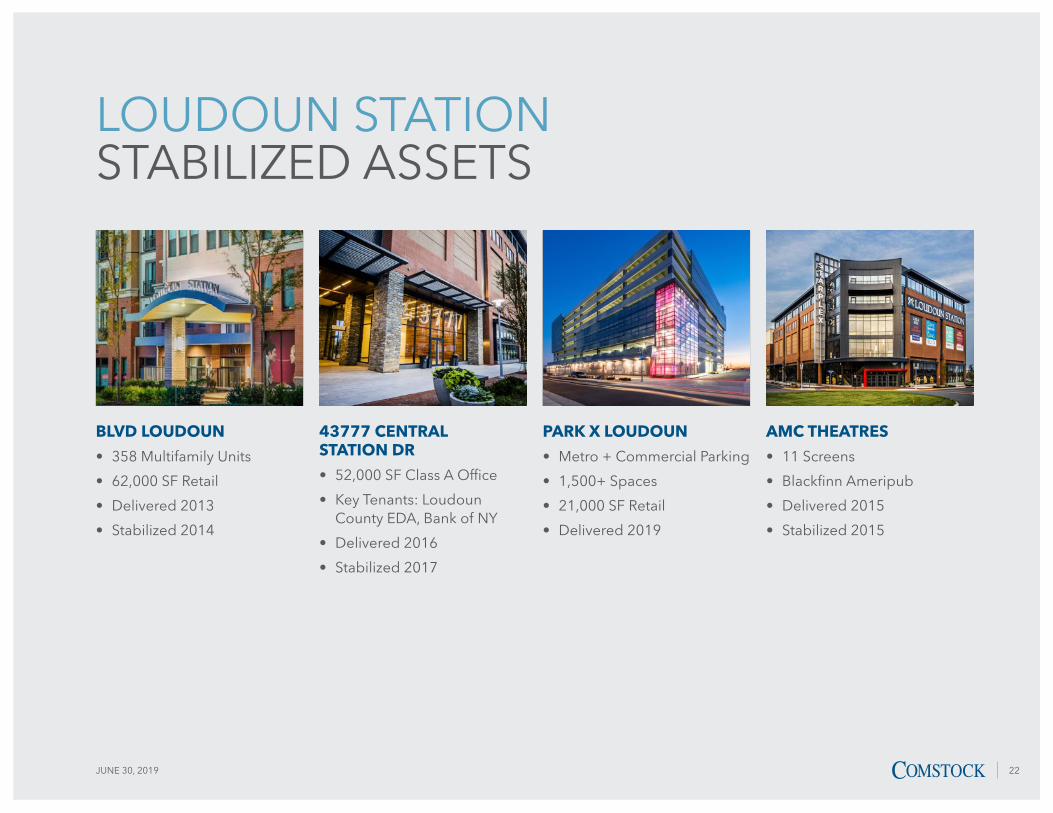
LOUDOUN STATION STABILIZED ASSETS
BLVD LOUDOUN
• 358 Multifamily Units
• 62,000 SF Retail
• Delivered 2013
• Stabilized 2014
PARK X LOUDOUN
• Metro + Commercial Parking
• 1,500+ Spaces
• 21,000 SF Retail
• Delivered 2019
43777 CENTRAL STATION DR
• 52,000 SF Class A Office
• Key Tenants: Loudoun County EDA, Bank of NY
• Delivered 2016
• Stabilized 2017
AMC THEATRES
• 11 Screens
• Blackfinn Ameripub
• Delivered 2015
• Stabilized 2015
22JUNE 30, 2019

LOUDOUN STATION DEVELOPMENT PIPELINE
BLVD GRAMERCY EAST
• 260 Multifamily Units
• 17,000 SF Retail
• Construction Started 2018
• Delivery 2020
BLVD FLATS
• 58 Multifamily Units
• 10,000 SF Retail
• Construction Started 2018
• Delivery 2020
ONE GRAMERCY PARK
• 163,000 SF Class A Office
• 11,000 SF Retail
• Construction Starts 2020
• Delivery 2022
BLVD GRAMERCY WEST
• 249 Multifamily Units
• Limited Retail
• Construction Starts 2020
• Delivery 2022
*Under construction. All figures and dates are estimates and subject to change.
23JUNE 30, 2019

The heart of Historic Downtown Herndon and the only Mixed-Use project adjacent to the W&OD Railroad Regional Park. Herndon’s Historic Downtown is home to numerous retail, service, and dining establishments, and Herndon Town Hall.
HERNDON STATION
• 273 Multifamily Units
• 17,000 SF Retail
• Construction Starts 2019
• Delivery 2021
HERNDON STATION DEVELOPMENT PIPELINE
All figures and dates are estimates and subject to change.
24JUNE 30, 2019

STRENGTHENED TENANT BASE OF MANAGED ASSETS
Google will occupy the top floors of trophy office building designed by world-renowned architect Helmut Jahn
“We’re confident that Reston Station will be a great new home for us and will provide room for future growth. We’re proud to call Reston home.”
— Liz Schwab, Head of External Affairs for Google in Virginia
Other recently signed tenants at Comstock’s Reston Station
25JUNE 30, 2019
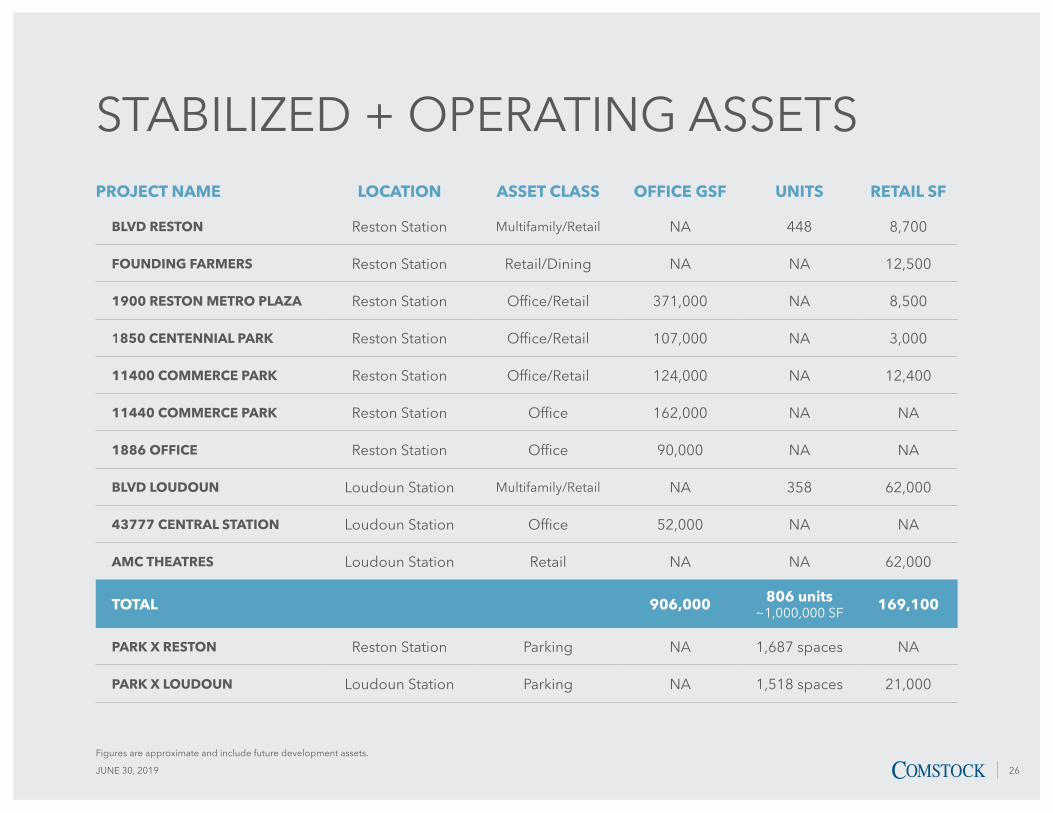
PROJECT NAME LOCATION ASSET CLASS OFFICE GSF UNITS RETAIL SF
BLVD RESTON Reston Station Multifamily/Retail NA 448 8,700
FOUNDING FARMERS Reston Station Retail/Dining NA NA 12,500
1900 RESTON METRO PLAZA Reston Station Office/Retail 371,000 NA 8,500
1850 CENTENNIAL PARK Reston Station Office/Retail 107,000 NA 3,000
11400 COMMERCE PARK Reston Station Office/Retail 124,000 NA 12,400
11440 COMMERCE PARK Reston Station Office 162,000 NA NA
1886 OFFICE Reston Station Office 90,000 NA NA
BLVD LOUDOUN Loudoun Station Multifamily/Retail NA 358 62,000
43777 CENTRAL STATION Loudoun Station Office 52,000 NA NA
AMC THEATRES Loudoun Station Retail NA NA 62,000
TOTAL 906,000 806 units ~1,000,000 SF
169,100
PARK X RESTON Reston Station Parking NA 1,687 spaces NA
PARK X LOUDOUN Loudoun Station Parking NA 1,518 spaces 21,000
STABILIZED + OPERATING ASSETS
Figures are approximate and include future development assets.
26JUNE 30, 2019

ACTIVE DEVELOPMENT PIPELINEPROJECT NAME LOCATION SQUARE FEET
ESTIMATED COMPETION
1906 RESTON METRO PLAZA Reston Station 203K 2020
BLVD GRAMERCY EAST AND BLVD FLATS Loudoun Station 419K 2020
1902 RESTON METRO PLAZA Reston Station 225K 2020
HERNDON STATION Herndon 339K 2021
ONE GRAMERCY Loudoun Station 175K 2022
ONE PROMENADE Reston Station 292K 2022
BLVD GRAMERCY WEST Loudoun Station 304K 2022
RENAISSANCE HOTEL AND DAKOTA CONDOS Reston Station 480K 2022
ONE COMMERCE Reston Station 385K Build-to-suit
BLVD PROMENADE AND CINEMA Reston Station 382K 2023
TWO PROMENADE Reston Station 195K 2024
BLVD COMSTOCK Reston Station 219K 2024
BLVD COMMERCE Reston Station 220K 2024
FUTURE PHASES 1.5M
TOTAL 5M
Figures are approximate and include future development assets.
27JUNE 30, 2019
WASHINGTON, DC MARKET
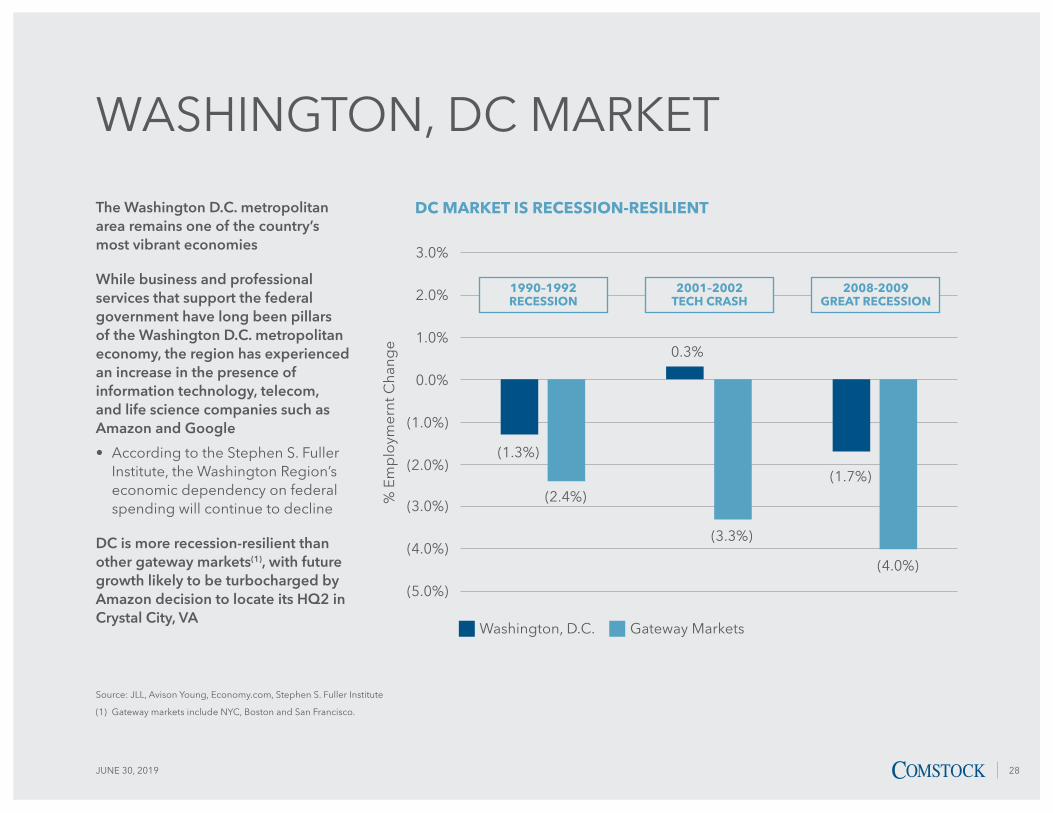
The Washington D.C. metropolitan area remains one of the country’s most vibrant economies
While business and professional services that support the federal government have long been pillars of the Washington D.C. metropolitan economy, the region has experienced an increase in the presence of information technology, telecom, and life science companies such as Amazon and Google
• According to the Stephen S. Fuller Institute, the Washington Region’s economic dependency on federal spending will continue to decline
DC is more recession-resilient than other gateway markets(1), with future growth likely to be turbocharged by Amazon decision to locate its HQ2 in Crystal City, VA
Source: JLL, Avison Young, Economy.com, Stephen S. Fuller Institute
(1) Gateway markets include NYC, Boston and San Francisco.
DC MARKET IS RECESSION-RESILIENT
(1.3%)
0.3%
(1.7%)(2.4%)
(3.3%)
(4.0%)
(5.0%)
(4.0%)
(3.0%)
(2.0%)
(1.0%)
0.0%
1.0%
2.0%
3.0%
Washington, D.C. Gateway Markets
% E
mp
loym
ernt
Cha
nge
1990–1992 RECESSION
2001–2002TECH CRASH
2008-2009GREAT RECESSION
28JUNE 30, 2019
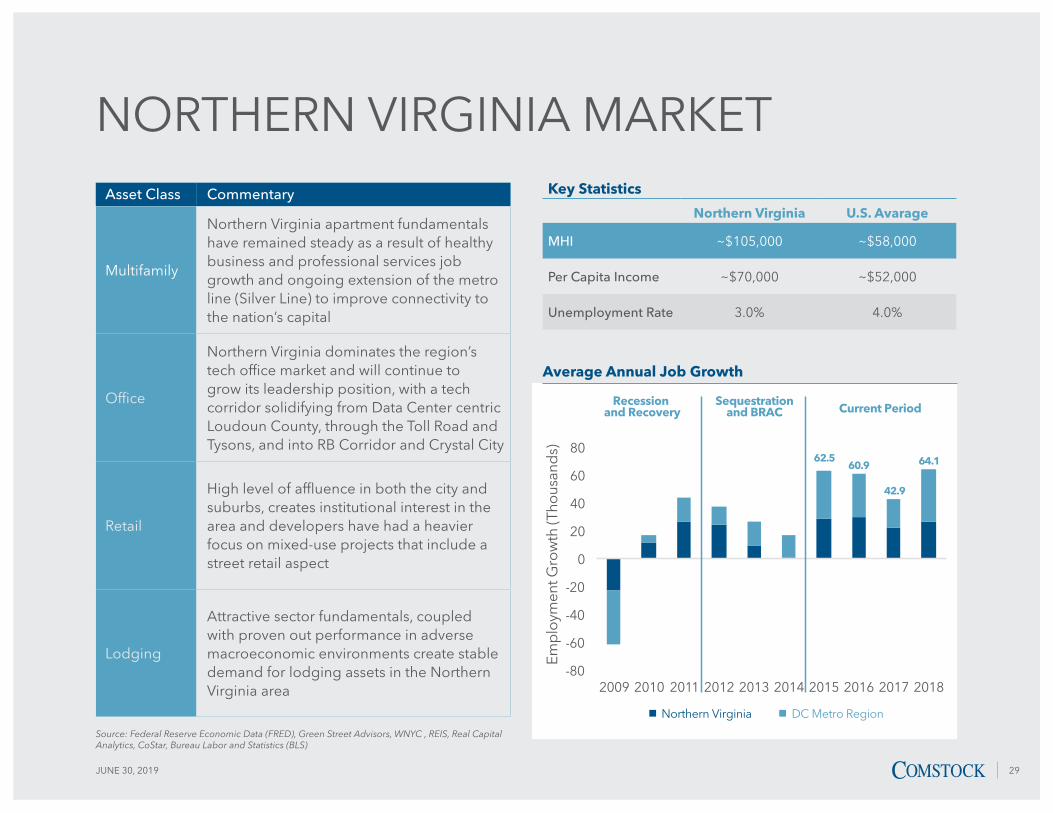
NORTHERN VIRGINIA MARKETAsset Class Commentary
Multifamily
Northern Virginia apartment fundamentals have remained steady as a result of healthy business and professional services job growth and ongoing extension of the metro line (Silver Line) to improve connectivity to the nation’s capital
Office
Northern Virginia dominates the region’s tech office market and will continue to grow its leadership position, with a tech corridor solidifying from Data Center centric Loudoun County, through the Toll Road and Tysons, and into RB Corridor and Crystal City
Retail
High level of affluence in both the city and suburbs, creates institutional interest in the area and developers have had a heavier focus on mixed-use projects that include a street retail aspect
Lodging
Attractive sector fundamentals, coupled with proven out performance in adverse macroeconomic environments create stable demand for lodging assets in the Northern Virginia area
Source: Federal Reserve Economic Data (FRED), Green Street Advisors, WNYC , REIS, Real Capital Analytics, CoStar, Bureau Labor and Statistics (BLS)
Key Statistics
Northern Virginia U.S. Avarage
MHI ~$105,000 ~$58,000
Per Capita Income ~$70,000 ~$52,000
Unemployment Rate 3.0% 4.0%
-80
-60
-40
-20
0
20
40
60
80
2009 2010 2011 2012 2013 2014 2015 2016 2017 2018
Emp
loym
ent G
row
th (T
hous
and
s)
Recession and Recovery
Sequestrationand BRAC Current Period
DC Metro Region Northern Virginia
62.560.9
42.9
64.1
Average Annual Job Growth
29JUNE 30, 2019

NORTHERN VIRGINIA OFFICE MARKETNEW SUPPLY TO OUTSTRIP DEMAND EXCEPT IN NORTHERN VIRGINIA OFFICE MARKET SUPPLY/DEMAND FORECAST (24 MONTHS ENDING 3Q 2020)
OPPORTUNITY: METRO-ADJACENT OUTPERFORMING OFFICE VACANCY RATE: NORTHERN VIRGINIA 3Q 2018
0
1
2
3
4
5
Northern Virginia
Mill
ions
of S
qua
re F
eet
Suburban Maryland D.C.
Demand Development Pipeline
Vac
ancy
rat
e
10.0%
12.0%
14.0%
16.0%
18.0%
20.0%
Within 1/4 mile radius of silver line station
Class A in Reston and Tysons All Northern Virginia
Source: Newmark Knight Frank.
30JUNE 30, 2019

RESTON MARKETReston is located in Fairfax County in Northern Virginia
• Fairfax County is a major business center and one of the most desirable communities in the Washington metropolitan area (#1 populous jurisdiction in the DC Metro region, #2 wealthiest county in the nation, 3.6% unemployment rate vs. 4.0% national average)
Reston Town Center commands a rent premium over older and less walkable micro-markets within Reston
• Boasts not only the lowest vacancy rate in Reston but one of the lowest rates of any micro-market across Metro DC
Reston Station achieving comparable rents to Reston Town Center
• New buildings and amenities attracting corporate relocations from Reston Town Center
1900 Reston Metro Plaza
Reston Town Center
Reston Class A overall
$60.00
Rent
PSF
$ -
$10.00
$20.00
$30.00
$40.00
$50.00
Reston Class B overall
Source: JLL Research.
31JUNE 30, 2019
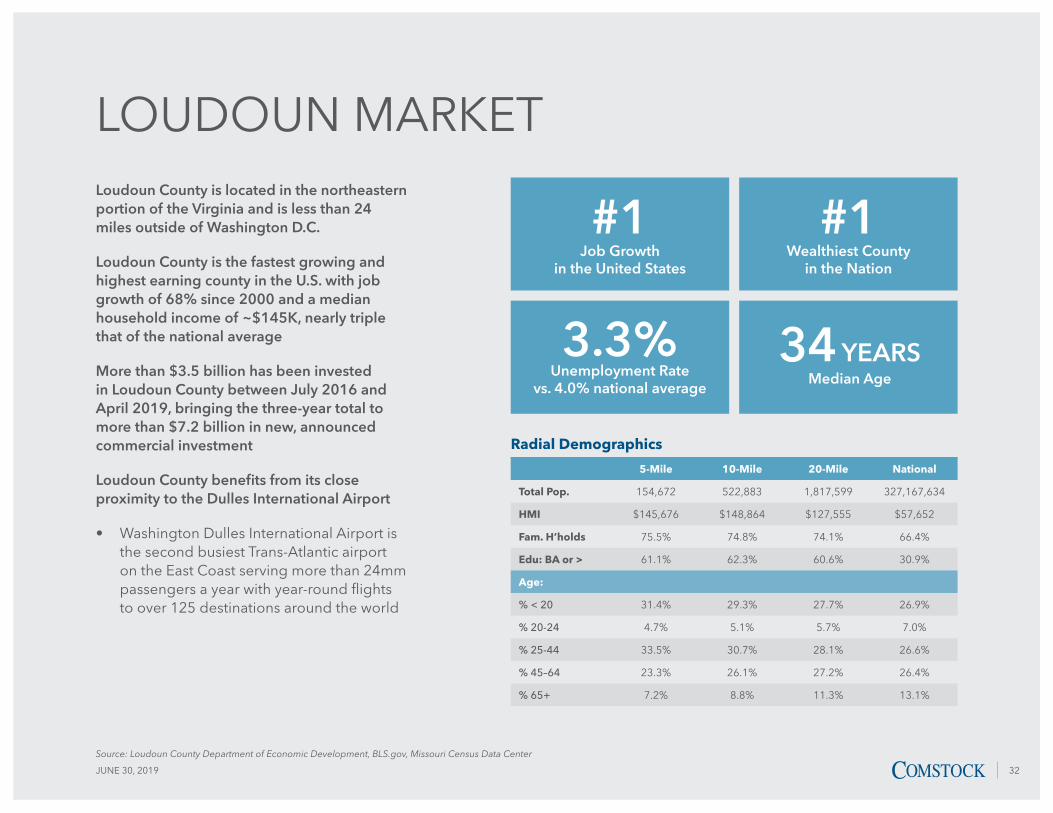
LOUDOUN MARKET
Source: Loudoun County Department of Economic Development, BLS.gov, Missouri Census Data Center
Loudoun County is located in the northeastern portion of the Virginia and is less than 24 miles outside of Washington D.C.
Loudoun County is the fastest growing and highest earning county in the U.S. with job growth of 68% since 2000 and a median household income of ~$145K, nearly triple that of the national average
More than $3.5 billion has been invested in Loudoun County between July 2016 and April 2019, bringing the three-year total to more than $7.2 billion in new, announced commercial investment
Loudoun County benefits from its close proximity to the Dulles International Airport
• Washington Dulles International Airport is the second busiest Trans-Atlantic airport on the East Coast serving more than 24mm passengers a year with year-round flights to over 125 destinations around the world
Radial Demographics
5-Mile 10-Mile 20-Mile National
Total Pop. 154,672 522,883 1,817,599 327,167,634
HMI $145,676 $148,864 $127,555 $57,652
Fam. H’holds 75.5% 74.8% 74.1% 66.4%
Edu: BA or > 61.1% 62.3% 60.6% 30.9%
Age:
% < 20 31.4% 29.3% 27.7% 26.9%
% 20-24 4.7% 5.1% 5.7% 7.0%
% 25-44 33.5% 30.7% 28.1% 26.6%
% 45–64 23.3% 26.1% 27.2% 26.4%
% 65+ 7.2% 8.8% 11.3% 13.1%
#1
3.3%
#1
34 YEARS
Job Growth in the United States
Unemployment Rate vs. 4.0% national average
Wealthiest County in the Nation
Median Age
32JUNE 30, 2019

THANK YOU
JUNE 30, 2019