Computing Solar PV Hosting Capacity of Distribution Feeders
18
Computing Solar PV Hosting Capacity of Distribution Feeders Matthew Rylander Electric Power Research Institute 1
Transcript of Computing Solar PV Hosting Capacity of Distribution Feeders

Computing Solar PV Hosting Capacity of Distribution Feeders
Matthew Rylander
Electric Power Research Institute
1
Overview
Objective of Presentation
• Discuss modeling methods necessary to compute distribution system hosting capacity for photovoltaics
Outline
• Potential PV deployments
• Advanced inverter functions
• Distributed energy resource management systems
• Resource intermittency
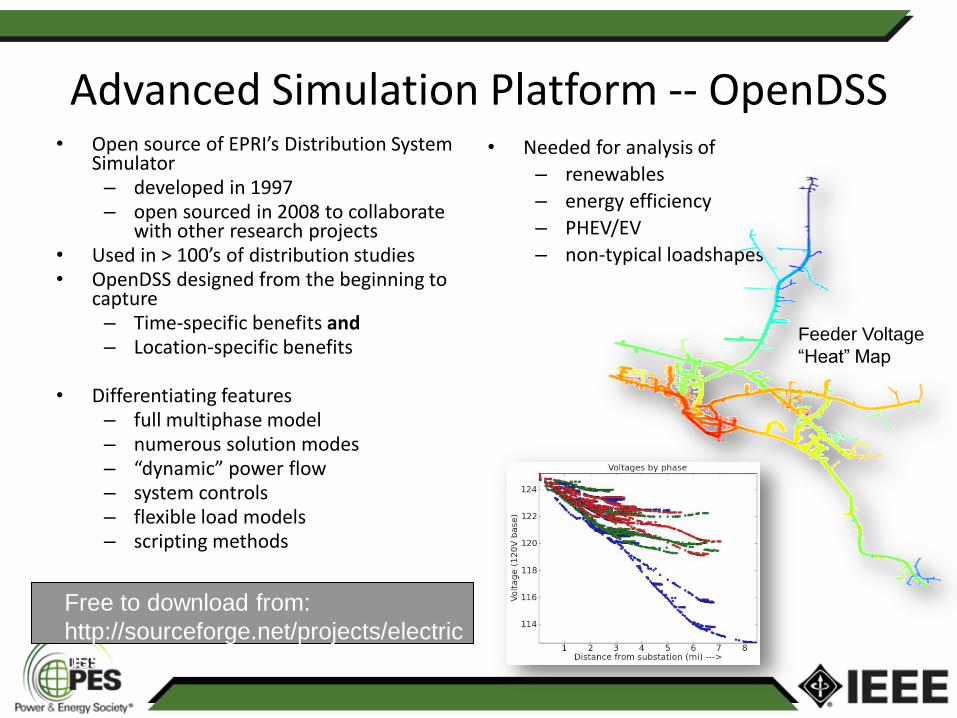
Advanced Simulation Platform -- OpenDSS • Open source of EPRI’s Distribution System
Simulator – developed in 1997 – open sourced in 2008 to collaborate
with other research projects • Used in > 100’s of distribution studies • OpenDSS designed from the beginning to
capture – Time-specific benefits and – Location-specific benefits
• Differentiating features
– full multiphase model – numerous solution modes – “dynamic” power flow – system controls – flexible load models – scripting methods
• Needed for analysis of
– renewables
– energy efficiency
– PHEV/EV
– non-typical loadshapes
Free to download from:
http://sourceforge.net/projects/electric
dss
Feeder Voltage
“Heat” Map

Script Based Analysis
PV
PV
PV PV PV PV PV PV PV PV PV
Large-Scale PV Near Sub
Large-Scale PV @ End Line
Small-Scale Distributed PV
PV characteristics
• Size
• Location
• Inverter control
• Intermittency
Loading
• Non-coincident with PV
• Coincident with PV
• Variability
Diffe
ring I
mpact
to G
rid
Substation
Substation
Substation

PV Location(s)
Customer Class
Deploy PV
Construct M x N
PV Deployments
Scenario 1 Penetration 1
Scenario 1 Penetration N
Scenario M Penetration 1
Scenario M Penetration N
Additional PV
Unique Deployment
Potential PV Deployment
PV
Siz
e (
kW
)

Hosting Capacity
1.035
1.04
1.045
1.05
1.055
1.06
1.065
1.07
0 0.5 1 1.5 2
Max
imu
m F
ee
de
r V
olt
age
(Vp
u)
Total PV Penetraion of Deployment (MW)
Minimum Hosting Capacity
Maximum Hosting Capacity
A B C
Wo
rst-
Ca
se R
esu
lt fo
r E
ach
Un
iqu
e P
V D
ep
loym
ent
Increasing penetration (MW)
Threshold of violation
A – All penetrations in
this region are
acceptable, regardless
of location
B – Some penetrations
in this region are
acceptable, site specific
C – No penetrations in
this region are
acceptable, regardless
of location

Feeder Impact and Thresholds Category Criteria Flag
Voltage
Overvoltage ≥ 1.05 Vpu
Voltage Deviation ≥ 3% at any primary node ≥ half bandwidth at regulators
Unbalance ≥ 3%
Loading Thermal ≥ 100% normal rating
Protection
Forward Flow Fault Contribution ≥ 10% increase
Sympathetic Breaker Tripping ≥ 150A
Breaker Reduction of Reach ≥ 10% decrease
Breaker/Fuse Coordination ≥ 100A increase
Anti-Islanding ≥ 50% minimum load
Power Quality Individual Harmonics ≥ 3%
THDv ≥ 5%
Control Regulator duty > Basecase +1
Capacitor duty > Basecase +1
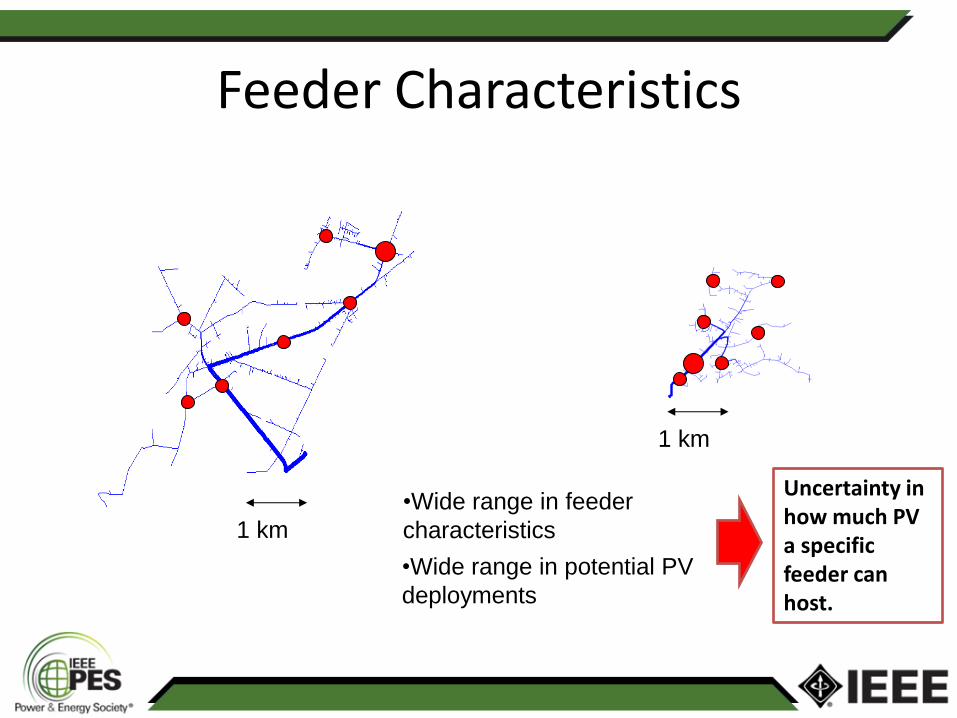
Feeder Characteristics
1 km
1 km
•Wide range in feeder
characteristics
•Wide range in potential PV
deployments
Uncertainty in how much PV a specific feeder can host.

Hosting Capacity by Feeder
• Each feeder is found to have a unique minimum hosting capacity for PV
• There is a range in hosting capacity for any given feeder
0 5 10 15
J1
R1
R2
R3
R4
T1
T2
G1
G2
G3
P1
P2
P3
P4
P5
D1
D2
D3
Large Scale (MW)
Fee
de
r
All penetrations in this region are
acceptable, regardless of location
Some penetrations in this region
are acceptable, site specific
No penetrations in this region are
acceptable, regardless of location
Research Details found here:
Distributed Photovoltaic Feeder Analysis: Preliminary Findings
from Hosting Capacity Analysis of 18 Distribution Feeders. EPRI,
Palo Alto, CA: 2013. 3002001245.
All penetrations in this region are
acceptable, regardless of location
Some penetrations in this region
are acceptable, site specific
No penetrations in this region are
acceptable, regardless of location
All penetrations in this region are
acceptable, regardless of location
Some penetrations in this region
are acceptable, site specific
No penetrations in this region are
acceptable, regardless of location
0
1
2
3
4
5
6
J1 R1 R2 R3 R4 T1 T2 G1 G2 G3 P1 P2 P3 P4 P5 D1 D2 D3
MW
Feeder
Minimum Hosting Capacity100% of Daytime Minimum Load
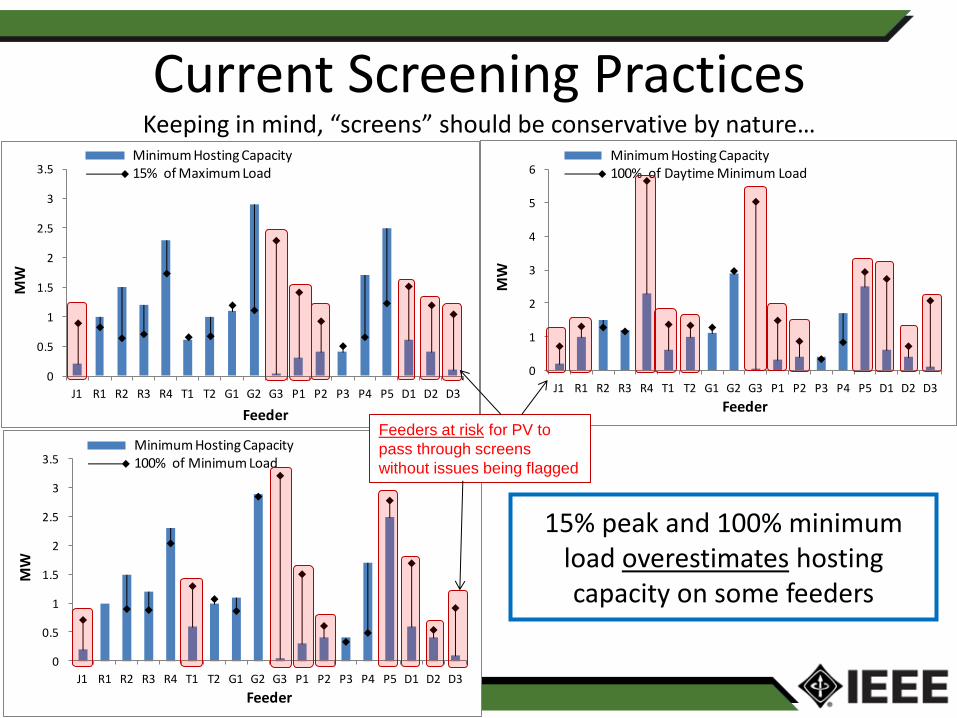
Current Screening Practices Keeping in mind, “screens” should be conservative by nature…
0
0.5
1
1.5
2
2.5
3
3.5
J1 R1 R2 R3 R4 T1 T2 G1 G2 G3 P1 P2 P3 P4 P5 D1 D2 D3
MW
Feeder
Minimum Hosting Capacity15% of Maximum Load
0
0.5
1
1.5
2
2.5
3
3.5
J1 R1 R2 R3 R4 T1 T2 G1 G2 G3 P1 P2 P3 P4 P5 D1 D2 D3
MW
Feeder
Minimum Hosting Capacity100% of Minimum Load
15% peak and 100% minimum load overestimates hosting capacity on some feeders
Feeders at risk for PV to
pass through screens
without issues being flagged

Advanced Inverter Functions Power Factor Control
– Absorbing reactive power at constant power factor
Volt/Var Control – Inverter voltage determines reactive power output
Volt-Var 1 Volt-Var 2
Inverter function details found here:
Modeling High-Penetration PV for Distribution Interconnection Studies: Smart Inverter
Function Modeling in OpenDSS, Rev 2. EPRI, Palo Alto, CA: 2013. 3002002271.

Advanced Inverter – Autonomous Control
• Feeder sees an increase in hosting capacity ranging from 133% all the way up to 566%
0 2000 4000 6000 8000 10000
Baseline
Volt-Var 1
Volt-Var 2
98% pf
95% pf
Volt-Watt 1
Volt-Watt 2
Increasing PV Penetration --->
All penetrations in this
region are acceptable,
regardless of location
Some penetrations in
this region are
acceptable, site specific
No penetrations in this
region are acceptable,
regardless of location
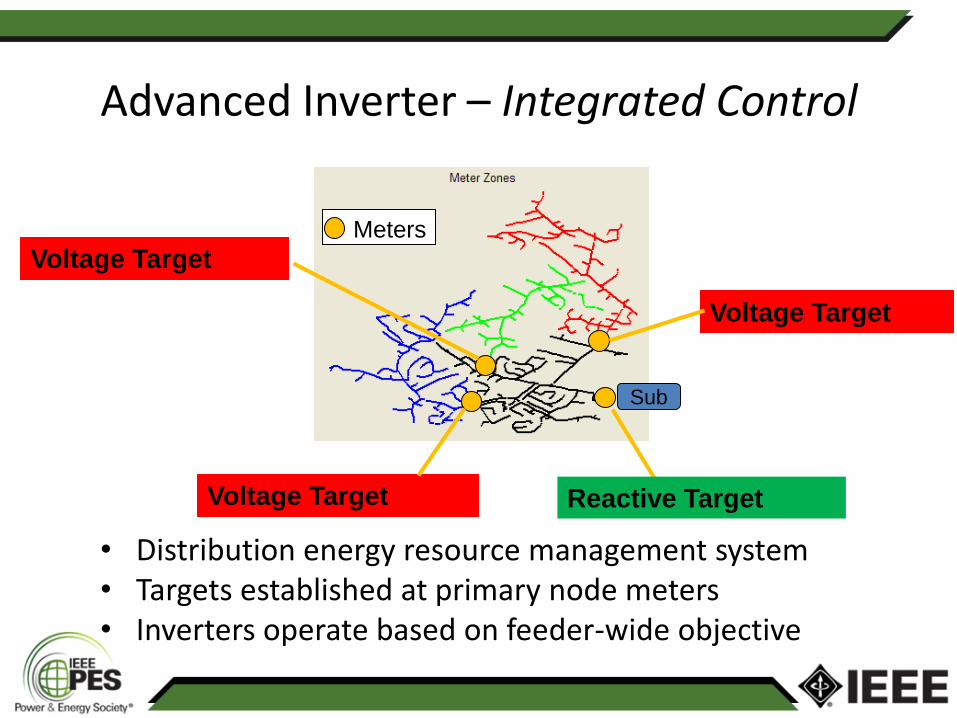
Advanced Inverter – Integrated Control
• Distribution energy resource management system • Targets established at primary node meters • Inverters operate based on feeder-wide objective
Meters
Voltage Target
Voltage Target
Voltage Target
Sub
Reactive Target

Advanced Inverter – Integrated Control
Minimize change in feeder
head reactive demand
Inverters well
within their
capability range
Reduced
feeder voltages
No PV
With PV
With PV/DERMS

Intermittency
Feeder impact depends on
– Load variability
– Solar variability
• Load variability decreases with diversification
• Solar resource variability more coincident than load
0
0.2
0.4
0.6
0.8
1
1 3 5 7 9 11 13 15 17 19 21 23 25
No
rmal
ize
d D
em
and
Local Time (Hour)
Offpeak Measured Peak Measured
Daily Solar Variability
0
0.2
0.4
0.6
0.8
1
1 3 5 7 9 11 13 15 17 19 21 23 25N
orm
aliz
ed
De
man
d
Local Time (Hour)
Offpeak Measured Peak Measured
Daily Load Variability

Impact from Intermittency
• Voltage
• Control operations
• Consumption/Losses
Summary & Conclusions
• Hosting capacity can be calculated with detailed analysis
• Scripting tools are beneficial to analyze the significant number of possibilities
• Models need to evolve to include advanced features