COMPUTERSHARE ANNUAL REPORT
136
ANNUAL REPORT | 2021
Transcript of COMPUTERSHARE ANNUAL REPORT

ANNUAL REPORT | 2021
COMPUTERSHARE ANNUAL REPORT | 20
21

This financial report covers the consolidated entity consisting of Computershare Limited and its controlled entities.
The financial report is presented in United States dollars (USD), unless otherwise stated.
Computershare Limited is a company limited by shares, incorporated and domiciled in Australia. Its registered office and principal place of business is:
Computershare Limited Yarra Falls 452 Johnston Street, Abbotsford Victoria 3067 Australia
The financial report was authorised for issue by the directors on 20 September 2021. The company has the power to amend and reissue the financial report.

CONTENTSOVERVIEWFinancial Highlights ................................................................3
Financial Calendar ..................................................................3
Chairman’s Report ..................................................................4
CEO’s Report ............................................................................6
Computershare at a glance ..................................................9
Key Financial Metrics ...........................................................11
Issuer Services .......................................................................13
Employee Share Plans .........................................................14
Mortgage Services ................................................................15
Business Services ..................................................................16
Sustainability ..........................................................................17
Community ...............................................................................19
People ......................................................................................21
Group operating overview ...................................................23
Business strategies and prospects ....................................25
GOVERNANCECorporate Governance Statement ....................................28
Directors’ Report ....................................................................41
Auditor’s Independence Declaration ................................64
FINANCIALSConsolidated Statement of Comprehensive Income ....65
Consolidated Statement of Financial Position ...............66
Consolidated Statement of Changes in Equity...............67
Consolidated Cash Flow Statement ..................................68
Notes to the Consolidated Financial Statements .........69
REPORTSDirectors’ Declaration .......................................................124
Declaration to the Board of Directors ..........................125
Independent Auditor’s Report ........................................126
FURTHER INFORMATIONShareholder information ..................................................132
Corporate directory ...........................................................133
The Chairman’s Report, CEO’s Report, Group Operating Overview and Business Strategies and Prospects comprise our Operating and Financial Review (OFR) and form part of the Directors’ Report. The information included in the Overview section of the report contains various measures which are non-IFRS in nature and not aligned to the Financial section of the Annual Report (Page 65 – 123).

3 | COMPUTERSHARE | ANNUAL REPORT | 2021
June 2021 June 2020 % Change
Statutory results
Total revenue 2,283.2 million 2,277.3 million 0.3%
Net profit after non-controlling interests (NCI) 189.0 million 232.7 million -18.8%
Statutory earnings per share# 33.77 cents 42.55 cents -20.6%
Management adjusted results
Management EBITDA 628.2 million 646.4 million -2.8%
Management EBIT 446.1 million 498.0 million -10.4%
Management net profit after NCI 283.7 million 303.8 million -6.6%
Management earnings per share# 50.71 cents 55.57 cents -8.7%
Management earnings per share (in constant currency) 52.03 cents 56.12 cents -7.3%
Balance sheet
Total assets 5,251.9 million 4,989.8 million 5.3%
Total shareholders’ equity 2,279.6 million 1,590.3 million 43.3%
Performance indicators
Free cash flow (excluding SLS advances) 260.1 million 505.9 million -48.6%
Net debt to management EBITDA (excluding non-recourse debt)* 1.07 times 1.93 times Down 0.86 times
Return on equity* 16.00% 19.50% Down 350bps
Staff numbers 12,009 12,647
The sum of totals and percentages may not add up to 100% owing to rounding.
For a reconciliation between statutory and management adjusted results, refer to note 4 in the notes to the financial statements.
* These financial indicators are based on management adjusted results. Management adjusted results are used, along with other measures, to assess operating business performance. The Group believes that the exclusion of certain items permits better analysis of the Group’s performance on a comparative basis and provides a better measure of underlying operating performance. Net debt excludes capitalised leases. Return on equity assumes the rolling average of the twelve months equity ending 30 June 2021 and reflects the impact of the 2021 rights issue in respect of the last three months of the year.
Where constant currency (CC) references are used in this report, constant currency equals FY21 results translated to USD at FY20 average exchange rates. FY21 Management earnings per share of 52.03cps assumes weighted average number of shares (WANOS) of 540,879,593. FY20 Management earnings per share of 56.12cps assumes WANOS of 541,420,844.
# FY20 Management and Statutory EPS has been restated by adjusting the weighted average number of ordinary shares in order to incorporate the bonus element in the 2021 rights issue, as per AASB 133.
FINANCIAL HIGHLIGHTS
FINANCIAL CALENDAR
2021
18 August Record date for final dividend
13 September Final dividend paid
11 November The Annual General Meeting of Computershare Limited ABN 71 005 485 825
9.00am virtual meeting
2022
9 February Announcement of financial results for the half year ending 31 December 2021
Overview

4
YEAR IN REVIEW*
This time last year, most forecasters expected the narrative for FY21 to be one of fully fledged recovery and economic rebound; a welcome return to normality as communities moved past the peak risks posed by the pandemic. However, despite some progress with vaccines and some easing of lockdowns, many of the same concerns have persisted, and some of our businesses have continued to be impacted by reduced activity.
With this in perspective, Computershare’s overall progress throughout FY21 has been very pleasing.
Yes, headwinds have continued to constrain our bottom line. Central banks have maintained historically low cash rates despite emerging inflation indicators. In the US, the expected upturn in our Mortgage Servicing, Bankruptcy and Class Action opportunities has been delayed further by government policy settings and slowdowns in the courts.
Computershare’s underlying businesses remain strong. Our Issuer Services business is a great example of the progress we continue to make, with revenues in Corporate Actions, Stakeholder Relations and Governance Services all increasing significantly. Earnings and operating margin in Employee Share Plans have also expanded.
Across the entire Group, we have seen our work to respond to changing circumstances bearing fruit – second half earnings were up 39% compared to the first half. As challenging as the current operating environment may be, when the economic cycle moves back in our favour, we are well-positioned to take full advantage.
As in FY20, we have continued to be transparent, issuing regular updates to guidance and hitting those revised numbers. We continue to use our strong liquidity to support our shareholders, maintaining our dividend at 23 cents, 60% franked, over an increased number of shares on issue following the rights issue.
As we moved into FY22, we expected to be able to move the majority of our employees safely back into our offices and operations centres. Those plans, by and large, have been tempered by the need for a more cautious approach. In some locations, like the UK and Hong Kong for example, we are implementing a careful and gradual return to offices. Those who have returned are following a range of protocols to protect their health and wellbeing. We expect this program to continue across more locations in the next few months.
1 Management EPS of 52.03 cps is calculated on a pre-rights issue basis. Weighted average number of shares (WANOS) was 540,879,593, down 7.3% vs FY20 Management EPS of 56.12. FY21 Management EPS including rights issue is 50.30 cps. FY20 Management EPS adjusting for the bonus element in the 2021 rights issue is 55.57 cps.
2 FY21 Management EPS revised guidance assumed EPS would be down around 8.0% vs FY20 Management EPS of 56.12. This is a 70 basis point improvement (7.3% v 8.0%).
* All references to Management Results in the Chairman’s Report are in constant currency unless otherwise stated.
Management Revenue
$2.3bnDOWN 0.8%
Management Revenue ex MI
$2.2bnUP 3.6%
Management EBIT ex MI
$336.4mUP 12.6%
Margin Income (MI)
$104.3mDOWN 47.7%
Management EPS1
52.03 cpsDOWN 7.3%
VS. GUIDANCE -8%
UP 0.7%2
Final Dividend Per Share (AUD)
23.0 cpsMAINTAINED
CHAIRMAN’S REPORT
Simon Jones Chairman

5 | COMPUTERSHARE | ANNUAL REPORT | 2021
Looking back, the strain on our people has been prolonged further than anyone envisaged – the majority have spent at least 18 months remote working, while those on site have been following strict hygiene controls. The Board and our executive team are immensely grateful to our employees for their determination and ingenuity. The word ‘resilience’ is often used, but it has never been so pertinent as now. Despite substantial peaks in demand, our teams found new ways to collaborate and keep delivering for our clients and customers, week in and week out.
One of the many corporate actions we carried out in FY21 was, of course, our own rights issue, helping to fund the largest acquisition in our Company’s history. We look forward to welcoming more than 2,000 new employees from Wells Fargo to our Computershare Corporate Trust (CCT) business and thank our shareholders for their vote of confidence in this new venture. Integrating this acquisition is one of our main priorities for the year ahead.
The recent Intergovernmental Panel on Climate Change (IPCC) report made for sobering reading. While we have already taken significant steps to reduce our carbon footprint, we have engaged a specialist external advisor, Climate Partner, to help us drive our climate action strategy. We intend to set an ambitious date for becoming carbon neutral and are already working to fulfil that future commitment. This is explained further in our Sustainability report on pages 17 to 18.
We also continue to deliver on our commitment to making Computershare a better place to work for all our employees and providing equal opportunities for everyone, regardless of gender, ethnicity, sexual orientation or age. We continued to expand our employee resource groups, for instance, extending our Women4Women network into Europe, and establishing the Black Leadership Group. You can find more details about our ongoing work in this area on pages 35 to 37.
OUTLOOKWe enter FY22 with renewed energy and confidence. We will maintain our focus on disciplined execution, exercising careful cost controls, and investing our strong free cash flow into growth assets and new technology, balanced with a responsible capital structure and dependable returns for shareholders.
We expect our current businesses (without the contribution of the new Corporate Trust business, CCT) to contribute an extra 4.2% in Management EPS. This is due to a combination of organic growth and cost-out programs, tempered by some wage inflation.
The expected impact of CCT in FY22 will be slightly negative – FY21’s rights issue will impact our management earnings per share by about 6 cents. On the plus side, we expect the Wells Fargo acquisition to be completed midway through 2Q22 and contribute about 4 cents to Management EPS through the remaining eight months of the year.
We are using today’s rate curve as the basis of our margin income guidance, and while it remains flat during FY22 it forecasts higher rates in years to come. Due to a range of factors, including the addition of the considerable cash balances in CCT and the extension of our Deposit Protection Services contract in the UK, we expect FY22 margin income to increase from our initial guidance in February 2021 of $80 million to $145 million. Any increases in rates will only see this number improve further.
ACKNOWLEDGEMENTSOur Board is itself a great example of the benefits of diversity. I’d like to acknowledge my fellow directors for their invaluable support and the experience, insight and expertise they bring to the Group.
Finally, I would like to especially thank Stuart Irving, our CEO and President, for the exemplary leadership he has provided throughout one of our most difficult years. I know that his commitment to protecting our Company – our people, our businesses and our shareholders – has meant many long hours for him. His dedication is appreciated, as is the great contribution he continues to make to Computershare’s performance and our distinctive culture.
Simon Jones Chairman
CHAIRMAN’S REPORT

6
RETURNING TO EARNINGS GROWTH, WELL POSITIONED FOR AN UPTURN*
We continue to make good progress executing our plans to build stronger, more efficient businesses with greater scale and capabilities to leverage positive growth trends.
We delivered a particularly strong operating performance in the second half of the year – our earnings were up 39% compared to the first half. Our second half was effectively the equal best operating result, excluding margin income, (MI) in the Company’s history. This strength enabled us to deliver on the upgraded guidance we provided in February.
Certainly, several significant headwinds we faced in 2H20 persisted through FY21 – as a result, Management EPS was down 7.3% overall.
Continued record low interest rates kept margin income down – year on year, down by almost half. Indeed, MI has been the main driver of the decline in our earnings and, frustratingly, still obscures the underlying story of our continued growth. The repeated extensions of the government moratorium on foreclosures also impacted the servicing opportunities for our US Mortgage Services business; another material hit to our earnings.
Despite this, total management revenue excluding MI increased by 3.6% in constant currency terms. Disciplined execution and careful cost controls saw our operating margins expand too, leaving aside the effect of interest rates.
Issuer Services and Employee Share Plans, two of our flagship operating businesses, both performed exceptionally well. Both saw an uplift in fee revenues and higher transaction levels coming off the back of stronger equity markets.
Issuer Services grew revenues across all the major divisions. Register Maintenance enjoyed a recovery in shareholder paid fees and new major client wins as well as an increase in market share. The number of shareholder accounts we manage around the world increased slightly year on year. Net client wins were 277: an increase on 82 net wins during FY20. Continued growth in market share validates our offer, along with our work to add and extend digital channels for the end customer.
In addition, we are successfully building scale in the new Governance Services adjacencies, Registered Agent and Entity Management. Both of these new complementary revenue pools benefit from our ability to leverage our core registry competencies. The key metric of ‘Entities Under Management’ grew 14% during the year, with new client wins buttressed by the underlying resilience of our book.
Our ability to provide a comprehensive suite of solutions and well-managed services in combination is a clear competitive strength. These are high-quality businesses with room for sustained growth in large, addressable markets. They provide steady, recurring annuity type revenues without exposure to margin income.
Corporate Actions activity increased in all our major regions as clients raised capital to strengthen their balance sheets (most markedly in the UK), IPO markets recovered (especially in Hong Kong), and M&A deals continued to flourish. In total, Corporate Actions revenues excluding MI increased by 35%.
Stakeholder Relationship Management, another event-based business, also performed well. Revenues increased 45%, with a very strong first half where we completed several proxy campaigns for Mutual Fund clients. These projects tend to be irregular and non-recurring, so we don’t expect the same level of contribution from Corporate Actions and this business in FY22.
Employee Share Plans delivered a robust result. Earnings (excluding MI) were up 68% and more than doubled in the second half of the year compared to the same period last year. Recurring fee revenues increased by 4%, excluding MI. Operating margin expanded by 790 basis points, excluding the costs of the Equatex integration.
* All References to Management Results in the CEO’s Report are in constant currency unless otherwise stated.
CEO’S REPORT
Stuart Irving CEO

7 | COMPUTERSHARE | ANNUAL REPORT | 2021
Transactional revenues recovered as equity markets rallied. These fees were down 7.4% at the halfway stage and finished the year up 16%. They are now above pre-pandemic levels, elevating our second-half performance.
The structural rise of equity-based remuneration is clearly reflected in these results. Units under administration are up 13% to 27 billion, as more companies issued equity deeper into their organisations to attract, retain and reward employees. We are well placed to benefit from this ongoing growth trend.
We are continuing to roll out our market-leading platform, EquatePlus, across Europe and Australia. Over three million participants are now live on the platform.
Business Services delivered a disappointing result. Revenue was down 15%, and EBIT excluding MI fell by 34%. Within this, Canadian Corporate Trust performed consistently; Bankruptcy reported strong revenue growth, up 37%, although this was first half driven; Class Actions declined by 31%.
Economic stimulus packages effectively delayed the bankruptcies we expected to see during the year; activity was very much reduced in the second half. We expect volumes to recover over time but will likely remain subdued in FY22.
Our Class Actions business is in a similar position, with very few cases progressing through the courts. While long-term growth trends remain (6% growth p.a. in the number of actions), once again, the outlook for FY22 is subdued.
Our US Mortgage Services business saw the biggest adverse impact from the pandemic during FY21. The CARES Act moratorium on mortgage foreclosure impacted a number of revenue lines within Mortgage Servicing and negatively impacted our ability to secure new special servicing mandates.
The prolonged period of record low rates also drove elevated levels of loan run-off due to increased levels of refinancing and in July last year, we took the decision to shorten the amortisation period from nine years down to eight for the performing MSRs we own in the US.
Moreover, our fulfilment business endured a challenging year, incurring delays to the implementation of both a new operating platform and newly secured client contracts.
Despite all of these significant headwinds, the US business generated positive EBIT excluding MI supported by gains related to certain MSR transactions, including capital light transactions converting owned MSR to sub-servicing.
The unpaid principal balance (UPB) of the loans we service was down 6% to $112 billion. Within this, the value of the loans we sub-serviced increased by 16%. The mix is improving. Performing sub-servicing UPB grew by 28%. We now sub-service over 290,000 loans.
We also expanded our recapture capability, which is our defence against losing loan servicing from refinancing. Consequently, we retained the servicing for $215 million of loans that would otherwise have moved to our competitors.
Having said all of that, we still view the return on capital in this business to be too low. We are very focused on seeing this improve.
Whilst the moratorium on foreclosures has come to an end, the federal regulatory body has kept a range of relief measures in place until the end of the calendar year. When these measures come to an end, we expect to add high margin, non-performing servicing work, together with its associated ancillary fees. We have a clear recovery plan, but there is a lot of work to do.
I’d like to move on to our new business now. As I mentioned earlier, our goal is to build stronger businesses with greater leverage to long-term growth trends. A highlight of the year was our announcement in March of the agreement to acquire the assets of Wells Fargo Corporate Trust Services, a leading US provider of trust and agency services to government and corporate clients. We are on track to complete this purchase in the next few months. The business will be renamed Computershare Corporate Trust (CCT).
This acquisition accelerates our scale in the attractive US corporate trust market. It also provides Computershare with greater exposure to long-term growth trends in trust and securitisation products as well as leveraging the interest rate environment.
I would like to thank the shareholders who supported the rights issue that funded the greater part of this acquisition. We have a clear plan to integrate and grow this business and enhance earnings for shareholders into the future.
With high levels of recurring revenue and capital-light businesses, Computershare continues to generate strong free cash flow. The year-end leverage measure of 1.07 times net debt to EBITDA reflects the beneficial impact of our completed capital raise. We expect this ratio to increase towards the top of our neutral target zone once the CCT acquisition completes and then reduce over time.
We will continue to balance growth investments with providing dependable returns for shareholders. The Board has maintained the final dividend at AU 23 cents per share, 60% franked, over an increased number of shares on issue following the rights issue.
CEO’S REPORT

8
FY22 OUTLOOK – PROFITABLE GROWTH*
We said in February that we expected the 1H FY21 results to mark the bottom of the earnings cycle for Computershare and that positive earnings growth was underway. I am encouraged to say we are progressing in line with this guidance.
In FY22, Management EPS is expected to increase by around 2% in constant currency after accounting for the dilutive impact of the rights issue.
We are making good progress in executing our growth strategies despite challenges in some of our business lines.
Issuer Services and Employee Share Plans should continue to perform well, although we do expect a more subdued performance in the more cyclical, event-based businesses. The CCT acquisition should complete in November and should be earnings accretive on a full-year basis.
This acquisition also substantially increases client balances under management. Following the extension of our UK Deposit Protection Service contract through to 2026, we have additional flexibility to add duration to term funds in the UK. Given these factors, margin income for the Group in FY22 is expected to increase to $145 million.
We will continue to manage our costs very carefully at Computershare. Our cost-out programs should deliver a further $80 million of gross savings over the next three years. We will use these savings to mitigate rising wage inflation across the Group, particularly in the US.
Our guidance is based on more than 4% EPS growth in our existing business lines with a second-half weighting. We have high-quality businesses with scale and strong recurring revenues in the Group. Event activity may fluctuate, and we have no influence over global interest rate settings but, regardless, we have returned to positive earnings growth. And we have significantly increased our optionality for higher MI when rates do start to rise.
I am truly appreciative of the great efforts made by all of my colleagues across Computershare in delivering these results. FY21 was a challenging year for everybody, irrespective of location. Your determination to overcome adversity and deliver exceptional client outcomes time and time again exemplifies the values that define Computershare.
We also lost a number of colleagues to Covid during the year and we extend our condolences to their loved ones.
US: Candyo Knowles, Loan Services (5 years’ service), Carolyn Bisbal, Loan Services (seven months), Larry Stark, Technology (20 years), Rini Westfall-Early, Loan Services (5 years).
EMEA: Jackie Arthurs, Loan Services UK (34 years), Jolanda Cloete, Issuer Services ZA (21 years), Hermina Nel, Issuer Services ZA (6 years).
To Simon Jones and the other directors, thank you for your support and counsel. I appreciate your thoughtful and consistent contributions made during many virtual Board meetings across several time zones.
Finally, I would like to acknowledge our shareholders for their commitment as we continue to build a strong platform for Computershare’s long-term growth and profitability.
Stuart Irving Chief Executive Officer and President
* All References to Management Results in the CEO’s Report are in constant currency unless otherwise stated.

BarcelonaParis
Rotterdam
London
Doxford
Copenhagen
SkiptonDublin
Bristol
Jersey
Madrid
Turin
Edinburgh Stockholm
Monaghan
MunichRomeZurich
Oslo
Warsaw
New JerseyNew York
Boston
Montreal
Toronto
Manila
Johannesburg
Hong Kong
MaroochydoreBrisbane
Auckland
CalgaryVancouver
San FranciscoLos Angeles
Sydney
MelbourneAdelaide
Perth
PhoenixLouisville
ChicagoDenver
College Station
Beijing
9 | COMPUTERSHARE | ANNUAL REPORT | 2020
Issuer Services
4,019
Mortgage Services
3,000
Corporate and Technology
2,684
COMPUTERSHARE AT A GLANCE
STAFF NUMBERS IN EACH BUSINESS LINE

BarcelonaParis
Rotterdam
London
Doxford
Copenhagen
SkiptonDublin
Bristol
Jersey
Madrid
Turin
Edinburgh Stockholm
Monaghan
MunichRomeZurich
Oslo
Warsaw
New JerseyNew York
Boston
Montreal
Toronto
Manila
Johannesburg
Hong Kong
MaroochydoreBrisbane
Auckland
CalgaryVancouver
San FranciscoLos Angeles
Sydney
MelbourneAdelaide
Perth
PhoenixLouisville
ChicagoDenver
College Station
Beijing
10
Employee Share Plans
996
Communication Services
844
Business Services
466
COMPUTERSHARE AT A GLANCE

11 | COMPUTERSHARE | ANNUAL REPORT | 2021
KEY FINANCIAL METRICS
2114.0
2300.92356.5
2281.22322.8
US
D m
illio
n
17 18 19 20 21
Management revenue
540.8
622.6
674.9646.4
628.2
US
D m
illio
n
17 18 19 20 21
Management EBITDA
54.4163.38
70.24
55.57 50.71
US
D c
ents
17 18 19 20 21
Management EPS
48.7655.17
76.57
42.55 33.77
US
D c
en
ts
17 18 19 20 21
Statutory EPS
608.8
306.6
457.7514.1
286.8
US
D m
illio
n
17 18 19 20 21
Cash flow from operations
36
4044 46 46
AU
D c
ents
17 18 19 20 21
Dividend per share
594.4
375.4420.3
453.0411.5
US
D m
illio
n
17 18 19 20 21
Net Operating Cash Flow excluding SLS advances
1.601.33
1.84 1.93
1.07
Tim
es
17 18 19 20 21
Net Debt to EBITDA ratio excluding non-recourse SLS Advance debt

12
REVENUE BY PRODUCT
Issuer Services 43%Mortgage Services & Property Rental Services 26%Corporate & Technology <1%Communication Services & Utilities 7%Business Services 9%Employee Share Plans & Voucher Services 14%
EBITDA BY PRODUCT
Issuer Services 44%Mortgage Services & Property Rental Services 18%
Corporate & Technology 10%Communication Services & Utilities 5%Business Services 8%Employee Share Plans & Voucher Services 14%
REVENUE BY REGION
United States 52%Canada 8%Australia and New Zealand 9%Asia 7%United Kingdom, Channel Islands and Africa 20%Continental Europe 4%
EBITDA BY REGION
United States 55%Canada 13%Australia and New Zealand 4%Asia 11%United Kingdom, Channel Islands and Africa 14%Continental Europe 3%

13 | COMPUTERSHARE | ANNUAL REPORT | 2021
Issuer Services is our largest business, contributing 43% of total revenues, with a leading presence in every region. At its core are our Register Maintenance and Corporate Actions businesses, which offer clients deep expertise in international markets to guide them through regulatory requirements and highly complex transactions. In FY21, Issuer Services grew revenues across all major business lines. Register Maintenance enjoyed a recovery in shareholder paid fees, new client wins and increased market share. Corporate Actions volumes increased in all our major regions as a result of clients raising capital, improved IPO markets, especially in Hong Kong, and strong M&A activity. In addition, we are successfully building scale in the new Governance Services adjacencies, Registered Agent and Entity Management. Our ability to provide a full suite of solutions and managed services in a combined offer is a clear competitive strength.
FINANCIAL RESULTS
Revenue breakdown FY21 CC FY20 Actual CC Variance
Register Maintenance* $645.3 $625.1^ +3.2%
Corporate Actions* $126.4 $93.4 +35.3%
Stakeholder Relationship Management $85.5 $58.7 +45.7%
Governance Services1 $74.2 $38.9^ +90.7%
Margin Income $43.8 $78.7 -44.3%
Total revenue $975.1 $894.7 +9.0%
Mgmt EBITDA $273.9 $260.5 +5.1%
Mgmt EBITDA margin 28.1% 29.1% -100bps
Mgmt EBIT ex. Margin Income $227.1 $179.8 +26.3%
Mgmt EBIT ex. Margin Income Margin 24.4% 22.0% +240bps
Naz Sarkar, Global Head
Issuer Services
ISSUER SERVICES SUCCESSFULLY GROWING INTO NEW ISSUER SERVICES MARKETS
Constant currency (CC) equals FY21 results translated to USD at FY20 average exchange rates.* Revenue excluding Margin Income1 Previously referred to as “Issuer Services – Other” and includes Registered Agent and Company Secretarial services.^ Reclassification of $0.7m from Register Maintenance to Governance Services in FY20.
KEY ACHIEVEMENTS
277 registry global net client wins
Managed
38.1 MILLION shareholder accounts
Units Under Management has grown 14% during the year, from 112,000 to 127,000 units
1,500 new entities under management from FY21 new wins (in total 3,000 including Verbatim portfolio), now operating in 8 different countries
FY22 OUTLOOK FY22 PRIORITIES FY22 OUTLOOK FY22 PRIORITIES
Ongoing momentum in Governance Services revenues
Ongoing investment in front office capabilities to leverage over 10,000 sticky and long-standing client relationships across a range of products and services
Recent client wins showing positive market momentum and driving improvement in fees excluding margin income
Complete the roll out of EquatePlus platform in Europe and Australia and commence upgrades in Asia and North America
Corporate Actions and Stakeholder Relationship Management event-based revenues not expected to repeat at same levels
Invest in product innovation to create market leading client and end-user experience
Upgraded synergies forecast from the Equatex acquisition, although increased cost to deliver and slight delay in achievement as the program expands outside of Europe
Invest in product innovation and service excellence to create market leading customer and user experience
Inflationary cost pressures in operational centres in key markets
Drive organic growth in our adjacent market segments to broaden product offering and expand share of wallet:
> Registered Agent
> Private Markets
> Managed Company Secretarial services
Growth in units under administration underpins expected growth in trading revenues
Continue to drive organic growth and penetration at the client level, increasing participant numbers and units under administration

14
EMPLOYEE SHARE PLANS
Francis Catterall, Global Head
Employee Share Plans
STRONG REVENUE GROWTH AND MARGIN EXPANSION
Computershare leverages local and global expertise to provide full-service employee share plan solutions that support the complex requirements of our clients and their share plan participants. Employee Share Plans more than doubled earnings (excluding margin income) in the second half of the year compared to the same period last year. We are making good progress implementing our market-leading platform EquatePlus across Europe and Australia, with over three million participants now live. Transactional revenues recovered and exceeded pre-pandemic levels in the second half as equity markets rallied and units under administration continued to grow as more companies issued equity deeper into their organisations.
FINANCIAL RESULTS
Revenue breakdown FY21 CC FY20 Actual CC Variance
Fee revenue $138.5 $133.2* +4.0%
Transactional revenue $154.2 $133.2* +15.8%
Other revenue $4.0 $11.2 -64.3%
Margin income $11.9 $12.5 -4.8%
Total revenue $308.5 $290.1 +6.3%
Mgmt EBITDA $78.1 $55.8 +40.0%
Mgmt EBITDA margin 25.3% 19.2% +610bps
Mgmt EBIT ex. Margin Income# $69.0 $41.0 +68.3%
Mgmt EBIT ex. Margin Income Margin# 22.6% 14.7% +790bps
Constant currency (CC) equals FY21 results translated to USD at FY20 average exchange rates.* Reclassification of $4.3m from fee revenue to transactional revenue in FY20. # FY21 impacted by $5.9m of one-off regulatory costs associated with Brexit transition. Adjusted EBIT ex MI $74.9m +82.7%, margin 24.6%, +990bps.
KEY ACHIEVEMENTS
7% net growth in new clients
Upgrades to EquatePlus largely complete in Europe and now commenced in Australia, with over three million participants on the platform
Outstanding shares/options/units under administration increased 13% YoY to $27 billion
FY22 OUTLOOK FY22 PRIORITIES FY22 OUTLOOK FY22 PRIORITIES
Ongoing momentum in Governance Services revenues
Ongoing investment in front office capabilities to leverage over 10,000 sticky and long-standing client relationships across a range of products and services
Recent client wins showing positive market momentum and driving improvement in fees excluding margin income
Complete the roll out of EquatePlus platform in Europe and Australia and commence upgrades in Asia and North America
Corporate Actions and Stakeholder Relationship Management event-based revenues not expected to repeat at same levels
Invest in product innovation to create market leading client and end-user experience
Upgraded synergies forecast from the Equatex acquisition, although increased cost to deliver and slight delay in achievement as the program expands outside of Europe
Invest in product innovation and service excellence to create market leading customer and user experience
Inflationary cost pressures in operational centres in key markets
Drive organic growth in our adjacent market segments to broaden product offering and expand share of wallet:
> Registered Agent
> Private Markets
> Managed Company Secretarial services
Growth in units under administration underpins expected growth in trading revenues
Continue to drive organic growth and penetration at the client level, increasing participant numbers and units under administration

15 | COMPUTERSHARE | ANNUAL REPORT | 2021
Computershare offers a comprehensive range of services across the mortgage services value chain in the US and UK. FY21 presented a range of challenges for us to manage. In the US, a prolonged period of record low rates drove elevated levels of run-off, whilst pandemic related restrictions impacted revenues and our ability to board new special servicing loans to replace the run-off. As a result, total Unpaid Principal Balances (UPB) were down 6% to $112 billion in the US. Within this, the value of the loans we sub-serviced increased by 16% and performing sub-servicing UPB grew by 28%. EBIT excluding MI margin was positive at $2.4m after including the gains related to certain MSR transactions and the increased amortisation. In the UK, revenues were impacted by the ending of the UKAR fixed fee arrangement, however these were largely offset by cost savings delivered as part of our three-year restructure program.
FINANCIAL RESULTS
Revenue breakdown FY21 CC FY20 Actual CC Variance
US Mortgage Services* $446.4 $414.5 +7.7%
US Mortgage Services Margin Income $3.7 $24.2 -84.7%
UK Mortgage Services $124.6 $196.6 -36.6%
Total revenue $574.8 $635.4 -9.5%
Mgmt EBITDA1 $103.3 $127.3 -18.9%
Mgmt EBITDA margin 18.0% 20.0% -200bps
Mgmt EBIT ex. Margin Income2 -$4.2 $33.6 -112.5%
Mgmt EBIT ex. Margin Income Margin2 -0.7% 5.5% -620bps
Constant currency (CC) equals FY21 results translated to USD at FY20 average exchange rates.* Revenue excluding Margin Income1 UK Mortgage Services EBITDA loss making ($5.7m) in FY21 and ($6.4m) in FY20. 2 FY21 UK Mortgages EBIT ex MI loss of ($6.7m), US Mortgages EBIT ex Margin Income of $2.4m, margin 0.5%.
Nick Oldfield, Chief Financial Officer and
Global Head of Mortgage Services
MORTGAGE SERVICES US IMPACTED BY PANDEMIC DRIVEN HEADWINDS; UK COST OUT ON TRACK
KEY ACHIEVEMENTS
+16.8% increase in sub-servicing UPB
$215M recaptured UPB through 2H
$37.4M cost savings delivered in FY21 in the UK
FY22 OUTLOOK FY22 PRIORITIES FY22 OUTLOOK FY22 PRIORITIES
Pipeline of fulfilment clients to be fully implemented in the year driving revenue growth
Complete implementation of new Loan Origination System together with current pipeline of new fulfilment clients
Ongoing growth in Canadian Corporate TrustContinue to add Canadian Corporate Trust mandates
Execution of capital-light partnership strategy to support growth in servicing portfolio
Execute and implement capital-light partnership model to establish permanent capital support and help drive future growth in servicing portfolio
In Class Actions, one-off expenses related to litigation and claims settlement will not repeat, improving FY22 operating margins
Implement system enhancements and process automation related efficiency initiatives, to drive down cost to serve
Government restrictions continue to impact 1H; 2H recovery as government restrictions and limitations on foreclosure activity are lifted
Ongoing investment in automation and efficiency initiatives across Servicing and Origination functions to lower cost to serve
Bankruptcy revenues start to recover 2H22, not anticipated at same level given 1H21 cyclical peak
Invest in our front office skills and capabilities to ensure we are properly positioned to execute on the market opportunities as they arise

16
Business Services is focused primarily on corporate services, where we typically act in a fiduciary capacity or as a court appointed agent. It’s also a great example of the benefits of incorporating counter-cyclical revenue drivers into our business. In FY21 revenue was down by 15% and EBIT excluding MI fell by 34%, largely driven by Class Actions, so this was a disappointing result for Business Services. The economic stimulus packages have effectively delayed the bankruptcies we expected to see when the year began, and there was very little activity in the second half. We expect volumes to recover over time, but the outlook for FY22 is subdued. There has also been very little large-sized Class Actions activity through the courts.
FINANCIAL RESULTS
Revenue breakdown FY21 CC FY20 Actual CC Variance
Corporate Trust* $54.5 $54.8 -0.5%
Bankruptcy* $64.6 $47.3 +36.6%
Class Actions* $59.2 $85.3 -30.6%
Margin Income $28.8 $56.2 -48.8%
Total revenue $207.1 $243.6 -15.0%
Mgmt EBITDA $51.0 $88.2 -42.2%
Mgmt EBITDA margin 24.6% 36.2% -1,160bps
Mgmt EBIT ex. Margin Income $20.4 $31.1 -34.4%
Mgmt EBIT ex. Margin Income Margin 11.5% 16.6% -510bps
Constant currency (CC) equals FY21 results translated to USD at FY20 average exchange rates.* Revenue excluding Margin Income.
BUSINESS SERVICES
Stuart Swartz, Global Head
Business Services
CONSISTENT DELIVERY IN CORPORATE TRUST, BANKRUPTCY AND CLASS ACTIONS SUBDUED IN 2H
KEY ACHIEVEMENTS
Bankruptcy revenues up almost
37% predominantly in the first half
Global Class Action case wins in South Africa, Canada and US
Corporate Trust Debt Under Administration steady at $2 trillion
FY22 OUTLOOK FY22 PRIORITIES FY22 OUTLOOK FY22 PRIORITIES
Pipeline of fulfilment clients to be fully implemented in the year driving revenue growth
Complete implementation of new Loan Origination System together with current pipeline of new fulfilment clients
Ongoing growth in Canadian Corporate TrustContinue to add Canadian Corporate Trust mandates
Execution of capital-light partnership strategy to support growth in servicing portfolio
Execute and implement capital-light partnership model to establish permanent capital support and help drive future growth in servicing portfolio
In Class Actions, one-off expenses related to litigation and claims settlement will not repeat, improving FY22 operating margins
Implement system enhancements and process automation related efficiency initiatives, to drive down cost to serve
Government restrictions continue to impact 1H; 2H recovery as government restrictions and limitations on foreclosure activity are lifted
Ongoing investment in automation and efficiency initiatives across Servicing and Origination functions to lower cost to serve
Bankruptcy revenues start to recover 2H22, not anticipated at same level given 1H21 cyclical peak
Invest in our front office skills and capabilities to ensure we are properly positioned to execute on the market opportunities as they arise

17 | COMPUTERSHARE | ANNUAL REPORT | 2021
Computershare has made considerable efforts to reduce our carbon footprint over the years, particularly by minimising the energy used to operate our data centres and buildings, and focusing on paper consumption, travel, and recycling IT equipment. We’ve always taken the view that effecting immediate change was more important than talking about potential future plans.
Aligned with this approach, historically, we’ve measured our carbon footprint on an office-by-office basis (where primary data has been available from landlords) and set targets for individual offices to help drive down energy use, water use and waste consumption.
In FY20 we decided to engage a third party, Climate Partner, to help us calculate our total carbon footprint, using secondary data where primary data isn’t available or where landlords simply don’t provide it. This allows us to set one, consolidated target to reduce our carbon footprint, globally. This target replaces all previous targets.
SUSTAINABILITY CORPORATE RESPONSIBILITY
North America 19,958.5UK and Ireland 8,343.8Oceania 7,796.5Continental Europe and Africa 3,281.5Asia 713.4
EMISSIONS BY REGION (TC02E)
THE RESULTSBetween January and December 2020 our business activities generated a total of 48,951.21* tonnes of CO2, 3.7% of which were Scope 1 emissions, 43.2% Scope 2 emissions and 53.1% Scope 3 emissions. Figures are provided in line with the Greenhouse Gas (GHG) Protocol and accounting standards. Electricity procurement, employee commuting (or home-working) and paper use were the most emission-intensive activities and represent the largest share of our carbon footprint.
* includes a 10% error margin
PROGRESS IN FY21The past year provided further opportunities to reduce the environmental footprint of our business activities on behalf of clients. Our teams around the world accelerated the digitalisation of some of our most significant products and services by promoting process improvement and efficiency initiatives geared at increasing automation, promoting self-service channels and minimising paper waste.
Reducing paper production in Communication Services
In Communication Services, we have seen overall communication volumes remain at high levels and demand for delivery via digital channels steadily increase. There has been a year-on-year decrease of 6.3% in physical mailpacks and a related increase of 5% in digital communications.
Much of the reduction in demand for physical mailpacks resulted from regulatory authorities around the world permitting companies to issue a physical notice of AGMs via mail and deliver the other meeting materials information online. Many clients moved to take up these Notice and Access solutions to ensure they could fulfil shareholder needs to receive materials and vote despite postal service disruptions and other challenges experienced during the pandemic. On average, a notice-only mailing is 90% lighter than a full meeting mailpack while also being much faster to produce. As clients begin to move across to this option, some regions have already reduced paper use by as much as 26% compared to the previous year’s mailings.
Enhancing digital products in Issuer Services
The launch of our new Virtual AGM product has expanded our capacity and features for holding virtual and hybrid shareholder meetings for our clients. This format enables significant carbon savings compared to the in-person events they replace, due to eliminating most or all of the travel involved.
During FY21, we coordinated 2,457 virtual and 21 hybrid meetings – that’s one-third of our total client meetings and more than double than what was held during FY20. We expect that number to increase in FY22.
For our own AGM we saved more than 110,000 sheets from being mailed out by adopting Notice and Access rather than mailing the full Notice of Meeting – Computershare’s shareholders were issued two pieces of paper rather than eight.
In Australia we offered electronic new shareholder packs to clients as an option to replace printed ‘Welcome’ packs. In FY21, this meant approximately 585,000 fewer pages and 292,000 fewer envelopes were printed and posted.
Offering online and self-service options in Mortgage Services
We have continued to manage a significant proportion of mortgage payment holidays or forbearances through online tools, avoiding the need for paper-based processes. In the US, borrowers were able to use an enhanced self-service platform to establish forbearance and extensions. This platform supports two-way SMS, web and IVR options as alternatives to traditional paper-based applications.
In the UK, the main reason borrowers call us is to check or modify their payment schedules – 48% of these enquiries are now completed via self-service. 1,400 other customer actions per month are now undertaken via online and digital methods.
Reducing our energy consumption through technology
We have continued to invest in more efficient data centres, which has allowed us to substantially reduce our physical infrastructure and achieve considerable savings in energy consumption. We estimate that we have saved 10% in power use for our Storage and Compute appliances as a result of our data centre platform refresh in the UK and Australia. We are also continuing to recycle devices that have reached the end of their service life.
With the majority of our employees working from home as a result of the pandemic, they remain well connected, being able to collaborate virtually over Microsoft Teams. We expect to be able to continue this, with flexible working remaining an option for our employees in the future.
A new digital platform for Employee Share Plans
As we roll out our upgraded Employee Share Plans platform, EquatePlus, to new regions, we are also deploying a digital-first strategy. By directing participants to our mobile and web platforms to access their plan holdings, transact and view communications, we can also eliminate the need for many paper forms and statements.
Since May 2019, we’ve upgraded 226 clients to EquatePlus, encompassing three million participants across the UK, Europe and Australia.
Each day,
12,000active users
participate in:
1,500 CALLS
2,200 MEETINGS
125,000 CHATSFor more information visit www.computershare.com/cr
Emissions by region were as follows:

18
While no formal benchmarks exist, Computershare’s footprint is broadly in line with available data from similar financial services firms. Along with Climate Partner, we are performing detailed analysis to ensure our footprint remains in line or is better than firms with similar activities. In future years, we will be able to share a trend analysis based from this initial footprint.
We recognise that while we are in a low impact sector, we do use significant amounts of paper and electricity. In the next year, we expect to significantly increase our procurement of renewable energy and will be reviewing the types of paper we use. These two items represent the biggest opportunities for carbon reduction at Computershare.
It should be noted that 2020 was not a normal year from a business activity perspective, particularly with regard to business travel and commuting, so we expect to see some fluctuation in emissions numbers as these activities resume.
OUR CARBON REDUCTION TARGETWe will unveil our plans for carbon neutrality in the near future.
We’re also continuing our work with Climate Partner to create a carbon footprint view of our products and services. This will help our clients to make greener choices when commissioning our services.
Finally, we have increased the data available in our CDP submission and look forward to sharing our rating from that once available later this year.
GREEN INITIATIVES IN FY21During the past year, we’ve taken the following actions to reduce our carbon footprint.
MOVING TO FLEXIBLE WORKING
Our long-term move to flexible working reduces the number of employees commuting to an office each day, representing a further reduction in transport carbon emissions.
In the UK, we closed two of our Mortgage Services office sites, primarily because more than 70% of those employees now work from home, either full or part-time. This has also allowed us to rationalise our application server infrastructure, achieving a 60% reduction in server numbers, bringing with it a similar decrease in energy consumption for power and heating as well as cooling systems.
GLOBAL TREE PLANTING PROGRAM
In FY21, we planted 1,365 trees as part of our existing commitment to offset 10% of the carbon emitted from our global business travel. This number was less than half of what was planted in FY20, due to suspending non-essential business travel during the pandemic, so in FY21 we planted less than half the trees planted in FY20. Since 2016, we’ve planted a total of 9,225 trees.
GREEN OFFICE CHALLENGE
During FY21, we introduced a new format for our annual Green Challenge in response to the number of people now working from home. The Green Home Challenge encouraged employees to make a concrete pledge to improve their environment, at home or in their local community, in one or more of the four categories below. During the competition period, we received 302 pledges from employees across the globe and we’re now in the process of selecting the winners.
Conserving resources
Travel and transport
Natural wildlife
Food and drink
PROGRESS IN FY21The past year provided further opportunities to reduce the environmental footprint of our business activities on behalf of clients. Our teams around the world accelerated the digitalisation of some of our most significant products and services by promoting process improvement and efficiency initiatives geared at increasing automation, promoting self-service channels and minimising paper waste.
Reducing paper production in Communication Services
In Communication Services, we have seen overall communication volumes remain at high levels and demand for delivery via digital channels steadily increase. There has been a year-on-year decrease of 6.3% in physical mailpacks and a related increase of 5% in digital communications.
Much of the reduction in demand for physical mailpacks resulted from regulatory authorities around the world permitting companies to issue a physical notice of AGMs via mail and deliver the other meeting materials information online. Many clients moved to take up these Notice and Access solutions to ensure they could fulfil shareholder needs to receive materials and vote despite postal service disruptions and other challenges experienced during the pandemic. On average, a notice-only mailing is 90% lighter than a full meeting mailpack while also being much faster to produce. As clients begin to move across to this option, some regions have already reduced paper use by as much as 26% compared to the previous year’s mailings.
Enhancing digital products in Issuer Services
The launch of our new Virtual AGM product has expanded our capacity and features for holding virtual and hybrid shareholder meetings for our clients. This format enables significant carbon savings compared to the in-person events they replace, due to eliminating most or all of the travel involved.
During FY21, we coordinated 2,457 virtual and 21 hybrid meetings – that’s one-third of our total client meetings and more than double than what was held during FY20. We expect that number to increase in FY22.
For our own AGM we saved more than 110,000 sheets from being mailed out by adopting Notice and Access rather than mailing the full Notice of Meeting – Computershare’s shareholders were issued two pieces of paper rather than eight.
In Australia we offered electronic new shareholder packs to clients as an option to replace printed ‘Welcome’ packs. In FY21, this meant approximately 585,000 fewer pages and 292,000 fewer envelopes were printed and posted.
Offering online and self-service options in Mortgage Services
We have continued to manage a significant proportion of mortgage payment holidays or forbearances through online tools, avoiding the need for paper-based processes. In the US, borrowers were able to use an enhanced self-service platform to establish forbearance and extensions. This platform supports two-way SMS, web and IVR options as alternatives to traditional paper-based applications.
In the UK, the main reason borrowers call us is to check or modify their payment schedules – 48% of these enquiries are now completed via self-service. 1,400 other customer actions per month are now undertaken via online and digital methods.
Reducing our energy consumption through technology
We have continued to invest in more efficient data centres, which has allowed us to substantially reduce our physical infrastructure and achieve considerable savings in energy consumption. We estimate that we have saved 10% in power use for our Storage and Compute appliances as a result of our data centre platform refresh in the UK and Australia. We are also continuing to recycle devices that have reached the end of their service life.
With the majority of our employees working from home as a result of the pandemic, they remain well connected, being able to collaborate virtually over Microsoft Teams. We expect to be able to continue this, with flexible working remaining an option for our employees in the future.
A new digital platform for Employee Share Plans
As we roll out our upgraded Employee Share Plans platform, EquatePlus, to new regions, we are also deploying a digital-first strategy. By directing participants to our mobile and web platforms to access their plan holdings, transact and view communications, we can also eliminate the need for many paper forms and statements.
Since May 2019, we’ve upgraded 226 clients to EquatePlus, encompassing three million participants across the UK, Europe and Australia.
Each day,
12,000active users
participate in:
1,500 CALLS
2,200 MEETINGS
125,000 CHATSFor more information visit www.computershare.com/cr

19 | COMPUTERSHARE | ANNUAL REPORT | 2021
COMMUNITY
WORLD YOUTH INTERNATIONALIn 2018, we entered into a five-year agreement with the WYI School in Gokarna, Nepal, after our employees selected it as our primary global project. Since then, Change A Life has funded a range of improvements to the school, including upgrades to classrooms and other facilities, extending the school program into Year 11 and 12 and supporting improvements to the quality of education provided. World Youth International is an Australian-based charity committed to enhancing quality of life, strengthening communities and reducing poverty through sustainable development projects.
Our close partnership with WYI was recognised with the Gold Award for Most Innovative Charity and Employer Relationship in the 2020 Workplace Giving Excellence Awards (convened by Workplace Giving Australia). The judging panel described our relationship with WYI as “an authentic and growing partnership with great engagement.”
In the past 18 months, the school’s work has unfortunately been interrupted by lengthy lockdowns triggered by Covid outbreaks in Nepal. Despite the challenges, the school increased student numbers from 508 to 598 during the last school intake. Computershare has provided extra emergency funding, helping to pay salaries and retain the majority of their skilled teachers. Staff members have developed a range of online and at-home study resources to enable students to continue their education.
Computershare’s charitable foundation, Change A Life, was founded in 2005 with the aim of making a real difference to the lives of disadvantaged and impoverished communities around the world. Since then, over AUD 11 million has been raised to support 16 projects in 13 countries, supporting sustainable agriculture and reforestation, food security, mobile eye care clinics, disaster relief and a range of programs to advance the education and welfare of at-risk children.
This work would not be possible without the generosity of our employees, many of whom have been regular contributors to Change A Life since its inception. Every month, more than a thousand of our staff donate via automatic payroll deductions, each of which is matched by Computershare. Staff supporters choose which major global projects we sponsor, as well as a number of other charitable partners that are local to our offices around the world. All staff are allocated a day of paid volunteer leave each year to support the charity of their choice.
We would also like to thank our shareholders who have contributed dividends to Change A Life and other client and corporate donors.
From FY22 forward, Change A Life will have a broadened scope: to also work with charitable partners that work to promote Diversity and Inclusion. Our first D&I partner is Black Girls Code, an organisation that teaches technology and computer programming skills to girls from underrepresented communities. They will receive 25% of annual Change A Life donations for a period of time. We also hope to support their mission, not only with funding, but also with direct support in the form of mentoring, training and internships. More information on this can be found in our Diversity and Inclusion report on page 35.
AUD
518,733Total donated to our projects in FY21
AUD
11 MILLION Total donated since launch
THE NEW WYI BOARDING HOME
Our Trek Nepal teams in 2018 and 2019 raised an additional AU$500,000 to build the Change A Life boarding home on the WYI School campus. We are very pleased to report that the construction of this boarding home has now been completed. The new multi-storey building has been engineered to high standards designed to mitigate the risk of earthquake damage.
The new facility will be home to 25 male and 25 female students undertaking Years 11 and 12; a great benefit for students who find it difficult to make the daily trip to and from school, especially during the monsoon season. These boarding students will be supported by on-site staff members and have extended access to the computer room and other study resources – as well as benefiting from a safe and engaging co-ed community. An official opening date will be confirmed once furnishings have been purchased and operational arrangements have been finalised. Boarding fees and scholarships will help to make the WYI school self-sustainable in the future.
While we are disappointed that our 2020 Trek Nepal (for our US and Canada staff members) had to be cancelled, we plan to offer a virtual trek for our global employees in the coming year, to raise awareness and further funding for Change A Life’s projects.
In 2022, our five-year agreement with World Youth International will conclude, and we will once again ask our employees to select a global charitable project to support.

20
LOCAL CHARITIESSince 2017, Change A Life has partnered with a range of charitable organisations local to our offices. These were chosen by our employees and provide practical support to people in need, often with a focus on caring for vulnerable children. Going forward, our financial support for local charities will increase from 20% to 25% of donations made and matched.
In past years, as well as providing financial support, we have seen our employees provide practical assistance through volunteering. Owing to the pandemic, in-person help has not been possible, but we hope to see this become an important part of our community activities once again in the year ahead.
This year, the following charitable partners were selected:
ASIA PACIFIC CANADA
Melbourne, AU Kids Under Cover
Sydney, AU The Starlight Children’s Foundation
Brisbane, AU Jade North’s Kickin’ with a Cuz*
Auckland, NZ Auckland City Mission*
China and Hong Kong Changing Young Lives Foundation
Food Banks Canada
USA UCIA AND EUROPE
Together We Rise* Bristol, UK Young Bristol
Other UK FareShare UK
Ireland Make a Wish Foundation
Continental Europe Save the Children*
Jersey MIND Jersey*
* Charities selected in 2017 that have been continued.
THE NEW WYI BOARDING HOME
Our Trek Nepal teams in 2018 and 2019 raised an additional AU$500,000 to build the Change A Life boarding home on the WYI School campus. We are very pleased to report that the construction of this boarding home has now been completed. The new multi-storey building has been engineered to high standards designed to mitigate the risk of earthquake damage.
The new facility will be home to 25 male and 25 female students undertaking Years 11 and 12; a great benefit for students who find it difficult to make the daily trip to and from school, especially during the monsoon season. These boarding students will be supported by on-site staff members and have extended access to the computer room and other study resources – as well as benefiting from a safe and engaging co-ed community. An official opening date will be confirmed once furnishings have been purchased and operational arrangements have been finalised. Boarding fees and scholarships will help to make the WYI school self-sustainable in the future.
While we are disappointed that our 2020 Trek Nepal (for our US and Canada staff members) had to be cancelled, we plan to offer a virtual trek for our global employees in the coming year, to raise awareness and further funding for Change A Life’s projects.
In 2022, our five-year agreement with World Youth International will conclude, and we will once again ask our employees to select a global charitable project to support.

21 | COMPUTERSHARE | ANNUAL REPORT | 2021
PEOPLE
CERTAINTYWorking well together means working collaboratively, valuing differences and building partnerships to support business outcomes. We expect our people to show respect to people regardless of their background, show support through both tough times and good – and communicate openly, honestly, clearly and regularly.
We also expect our people to ‘do the right thing’. Each employee is personally responsible and needs to act with integrity. Our staff members need to follow through on commitments and promises, take responsibility and ownership of their actions – and ensure risks are managed while complying with our policies.
INGENUITYTaking pride in delivering high-quality outcomes and outstanding results is how we strive for excellence. We expect our employees to meet deadlines and targets, use resources effectively and maintain a high standard in their work, even when workloads come under pressure.
We also ask our staff to challenge the status quo in order to do things differently and better. This enables us to be pioneers – curious and keen to learn new things. Our staff members are encouraged to think creatively, seek feedback and ask questions.
ADVANTAGEOur employees build long-lasting relationships and deliver products and services that meet customers’ needs as part of keeping customers at our heart. Following this way of working seeks to build on relationships through proactive communication.
We also ask our staff to help keep us ahead in our industry by continually moving the business forward and maintaining high performance in the face of change. This means staying up to date with our global priorities, adapting and responding quickly to changing circumstances and staying calm under pressure.
INGENUITY
CERTAINTY
AD
VAN
TAG
EWorld leaders
in financial administration
Move the business forward
Work well together
Do the right thing
Strive for excellence
Be a pioneer
Keep customers
at our heart
VALUESOur long-standing brand values of Certainty, Ingenuity and Advantage represent what we as a Company bring to our clients each and every day. Our ‘Being Purple’ ways of working support our brand values and are a set of positive behavioural signposts for our people. ‘Being Purple’ also helps us to define the people we want to bring into Computershare and the conduct, behaviours and professional attributes we want to promote and reward.
Detailed guidelines are provided to each member of staff, including our board of directors, so that our people know what is expected of them. They reflect what actions can be taken to deliver on these ways of working at every level from employee to senior leader. We also provide guidance on ‘what it’s not’ so that our people understand the behaviours we won’t accept.
Our Being Purple ways of working also reflect the requirements of our well-established policies on diversity and inclusion, human rights, harassment, anti-bribery, corruption and whistleblowing.

22
COMPUTERSHARE DAYOn 29 May we celebrated our fifth annual Computershare Day, marking 27 years since Computershare was listed on the Australian Securities Exchange. This year employees around the world took part in the festivities from home in lots of different ways, despite the range of social contact restrictions in place around the world. Our people shared pictures, videos, messages and ecards with their workmates. We also held a virtual Computershare TV competition, where employees sent in videos and we awarded prizes for the most popular entries from around the globe.
We presented our Purple Person awards digitally this year, recognising 28 employees for making outstanding contributions to Computershare, and for exemplifying our values. They consistently ‘do the right thing’, and demonstrate our Being Purple ways of working, week in and week out. Their actions empower the people around them and enhance our Company’s reputation for excellent service quality and integrity.
For these award winners, Being Purple is intrinsic to their professional life, no matter where they work or at what level of seniority. They strive to innovate, seek continuous improvement for themselves and their business, encourage and support others, and routinely go ‘above and beyond’ to provide exceptional levels of customer service. During the past year, given the challenges posed by the global pandemic, these qualities have never been more important.
Our Purple People for 2021 are:
Name Business line Location
Alan Scott Technology Bristol UK
Belinda McGovern Issuer Services Sydney AU
Bill Atkinson Issuer Services New York US
Calley Webb Utility Services Maroochydore AU
Celia Li Plans Beijing CN
Denish Modi Issuer Services Toronto CA
Elizabeth Cooper Global Operations Louisville US
Eric Foronda Business Services Toronto CA
Jennifer Zhang Issuer Services Shanghai CN
Jenny Messer Issuer Services Canton US
Jenny Paterson Corporate Communications Crossflatts UK
John Britton Issuer Services Bristol UK
Kelly Little Audit Bristol UK
Kylee Lauderdale Mortgage Services Ponte Vedra US
Laura Ferrario Global Operations Bristol UK
Lisa Sumpter Mortgage Services Crossflatts UK
Marc-Éric Prénovost Plans Barcelona ES
Melinda Salazar Mortgage Services Denver US
Monica Papasidero Issuer Services Islandia NY, US
Robert Bingham Technology Melbourne AU
Ronald Panozzo Plans Chicago US
Stacey Christian Mortgage Services Denver US
Stefan Schmetzdorf Communication Services Munich DE
Stuart Mar Global Operations Toronto CA
Susan Lehoullier Technology Canton US
Sydney Reitzel Business Services El Segundo US
Tony King Legal Melbourne AU
Victoria Goddard Mortgage Services Doxford UK
23 | COMPUTERSHARE | ANNUAL REPORT | 2021
GROUP OPERATING OVERVIEW
PRINCIPAL ACTIVITIESThe principal activities of the consolidated entity during the financial year were the operation of the following areas:
> Issuer Services comprise register maintenance, corporate actions, stakeholder relationship management, corporate governance and related services
> Mortgage Services and Property Rental Services comprise mortgage servicing and related activities together with tenancy bond protection services in the UK
> Employee Share Plans and Voucher Services comprise the provision of administration and related services for employee share and option plans together with Childcare Voucher administration in the UK
> Business Services comprise the provision of bankruptcy, class actions and corporate trust administration services
> Communication Services and Utilities operations comprise document composition and printing, intelligent mailing, inbound process automation, scanning and electronic delivery
> Technology Services comprise the provision of software specialising in share registry and financial services
REVIEW OF OPERATIONS
OverviewRevenue for the Group fell 0.8% to $2,262.0m in constant currency terms. Underlying organic revenue growth, after adjusting for margin income (-$95.1m), acquisitions and disposals, including Corporate Creations (+$30.5m) and the UKAR fixed fee (-$46.8m), was 4.6%.
Margin Income declined $95.1m, reflecting the annualised impact of the global interest rate cuts in early 2020 as central banks around the world responded to the global pandemic.
Issuer Services revenue excluding margin income was up 14.1% in constant currency terms. Issuer Services EBITDA excluding margin income was up 26.5% to $230m and EBIT excluding margin income was up 26.3% to $227.1m. This was driven by greater Corporate Actions activity, particularly in Hong Kong, and some large stakeholder relationship management events. FY21 includes annualised contribution from our governance services acquisitions.
Employee Share Plans and Voucher Services revenue excluding margin income was up 7.7%. EBITDA excluding margin income was up 51.3% to $82.3m, and EBIT excluding margin income was up 51.8% to $77.1m. This was driven by higher transactional volumes in EMEA and Hong Kong as well as cost savings in personnel, part offset by one off regulatory costs associated with Brexit transition. Voucher Services revenues also declined due to reduced parent numbers, reflecting the ongoing run-off of this business area.
Business Services revenue excluding margin income was down 4.9%. EBITDA excluding MI was down 30.1% to $22.3m, and EBIT excluding MI was down 34.4% to $20.4m. Class Actions revenues were down, driven by a decline in the number of case wins, in addition to a significant doubtful receivable. There was increased contribution from Bankruptcy as a result of a strong first-half performance in the year.
Mortgage Services and Property Rental Services revenue excluding margin income was down 6.6% in constant currency terms. EBITDA excluding MI was down 1.6% to $86.7m, and EBIT excluding margin income was down 204% to ($18.0m). US Mortgage Services revenues were negatively impacted by the nationwide foreclosure moratorium and accelerated levels of run-off due to lower mortgage rates, while costs increased following a change in the amortisation period for interest rate-sensitive Mortgage Servicing Rights (MSRs) from nine to eight years. In UK Mortgage Services the expected reduction in the UKAR fixed fee (-$46.8m) has been offset by reduced operating costs following the end of the asset migration program and ongoing benefits from the wider cost-out program. Property Rental Services revenues are predominantly MI and were down 16.7% over the year to $24.8m.
Revenue for the Communication Services and Utilities business was down 5.9%. EBITDA was down 3.9% at $29.6m, and EBIT was down 8.4% at $25.1m.

24
Revenue
Comparison in constant currency
Business streamFY21 @ CC
$ millionFY20 Actual
$ millionCC
VarianceFY21 Actual
$ million
Issuer Services 975.1 894.7 +9.0% 999.3
Mortgage Services & Property Rental Services 599.5 665.1 -9.9% 609.0
Employee Share Plans & Voucher Services 319.8 304.6 +5.0% 333.0
Business Services 207.1 243.6 -15.0% 210.2
Communication Services & Utilities 158.8 168.8 -5.9% 169.7
Corporate & Technology 1.7 4.2 -59.5% 1.7
Total management revenue 2,262.0 2,281.2 -0.8% 2,322.8
Total management revenue excludes management adjustment items further described in note 4 of the financial statements.
RegionsFY21 @ CC
$ millionFY20 Actual
$ millionCC
VarianceFY21 Actual
$ million
Australia and New Zealand 193.2 196.4 -1.6% 213.4
Asia 160.4 112.5 +42.6% 161.3
UK, Channel Islands, Ireland and Africa 443.7 527.0 -15.8% 470.0
Continental Europe 93.8 87.5 +7.2% 100.9
USA 1,197.0 1,172.0 +2.1% 1,197.0
Canada 173.9 185.8 -6.4% 180.2
Total management revenue 2,262.0 2,281.2 -0.8% 2,322.8
Operating costsOperating expenses were up 0.5% on FY20 to $1,642.6m in constant currency terms. Adjusting the cost base down by $82.0m to account for the benefit realised from the cost out programs and some underlying inflation, BAU operating expenses were down 6.5%. This has been offset by the $8.0m net impact of acquisitions, investment in growth to meet both the demand in Corporate Actions and the building out our Corporate Secretarial capability by $33.3m as well as $9.6m in net one-off costs predominantly made up of a significant doubtful receivable and regulatory costs associated with the Brexit transition in the UK. Cost of Sales increased, from $371.8 million to $410.4 million, largely driven by the sales mix underpinning the higher revenue. The Group’s cost-out program continues to deliver benefits, with $64.4m achieved in FY21 and $194.7m cumulative gross benefits achieved to date.
Earnings per share
2021Cents
2020Cents*
Statutory basic earnings per share 33.77 42.55
Statutory diluted earnings per share 33.76 42.55
Management basic earnings per share 50.71 55.57
Management diluted earnings per share 50.69 55.57
The management basic and diluted earnings per share amounts have been calculated excluding the impact of management adjustment items (refer to note 4 in this financial report). All EPS numbers above have been translated at actual FX rates (not constant currency).
* Earnings per share is restated by adjusting the weighted average number of ordinary shares in order to incorporate the bonus element in the 2021 rights issue, as per AASB 133 Earnings per Share.

25 | COMPUTERSHARE | ANNUAL REPORT | 2021
OUTLOOKIn August 2021, we provided earnings guidance for FY22. In constant currency, we expect Management EPS to be up around 2% after accounting for the impact of the rights issue and the Corporate Trust (CCT) acquisition. We anticipate EBIT excluding margin income across our operating businesses to improve around 3.7% and margin income to be up 35.5% at $145m.
Guidance assumes over 4% Management EPS growth in our existing business lines and Management EBIT excluding MI to be up around 3%. This reflects the ongoing delivery of cost-out initiatives and operational earnings growth, which we expect will more than offset expected wage inflation pressures. We are assuming margin income for our existing business lines to come in at around $107m – which is flat when compared to the prior corresponding period – with average balances of $17 billion.
The CCT acquisition is anticipated to close in November, with an additional contribution of $38m in margin income, $1.8m in Management EBIT ex MI and Management EPS of around 4 cents.
Turning to the individual business lines, in Issuer Services we are expecting to benefit from organic growth in our new Governance Services businesses as well as ongoing investment in Front Office programs and new client wins. Against that, we are anticipating some softness in Corporate Actions and Stakeholder Relationship Management revenues, which are not expected to repeat at the same levels as FY21.
In Employee Share Plans we will continue to benefit from increased trading revenue from expected growth in units under administration as well as higher fees from recent client wins. We will benefit from increased scale and synergies as we continue to roll out our industry-leading EquatePlus platform into new regions whilst the one-off regulatory related expenses associated with Brexit will not repeat.
In US Mortgages, we expect to drive growth through a pipeline of new fulfillment clients being fully implemented in the year, whilst the establishment of a capital light partnership will enable us to drive growth in sub-servicing. While the moratorium on foreclosures has now come to an end, there are still a range of relief measures in place that will remain to the end of the calendar year. Once these finish, we expect special servicing opportunities to start opening up in the second half.
In UK Mortgages we expect to return to a modest profit in FY22 due to our ongoing efforts to right-size the business after the loss of UKAR fixed fee in FY21. The cost out program is progressing well and the overall target for the project has been upgraded to $75m.
In Business Services, we expect continued growth in the legacy Corporate Trust business and margins to improve after some one-off expenses in FY21 in Class Actions, however, this will be offset by lower bankruptcy revenues which are not expected to be at the same level as the 1H21 cyclical peak.
Our cost-out programs continue to progress well. We have extended the delivery period out to FY24. Total gross benefits are now estimated at $276 million, with $80m to come over the next three years.
The net debt to EBITDA ratio will peak after the completion of the CCT acquisition before starting to organically repair. We anticipate it being around the top of our target range at the end of FY22.
This outlook assessment and other references to our FY22 outlook in this document are subject to the forward-looking statements disclaimer and a number of other assumptions provided in our FY21 results announcement disclosed to the Australian Securities Exchange (Slide 77).
RISKSThe Board is ultimately responsible for setting the risk appetite for the Group and otherwise reviewing and approving Computershare’s risk management framework and policies as well as assessing their effectiveness in mitigating the risks present in our business. The Board delegates some of this responsibility to the Risk and Audit Committee. The Risk and Audit Committee is highly qualified with deep expertise in strategic, operational and financial risk management. It receives quarterly reports on the key and emerging risks in the Group and meets with management to discuss and challenge its views on Group or relevant business line risk positions as well as any actions they are taking to mitigate those risks.
Computershare has a clear approach to the oversight and management of risk, based on the ‘three lines of defence’ model. This model provides a simple framework for the implementation and oversight of risk management in which management, as the first line of defence, has responsibility for its own risk management and control activities.
The risk function, as part of the second line of defence, is responsible for setting and implementing the risk framework. This includes supporting tools and methodologies as well as providing oversight of risk management activities and advisory support to management.
The internal audit function, as the third line of defence, provides an independent and objective assurance function with the responsibility of confirming that the framework, policies and controls designed to manage key risks are being executed effectively by management. Internal audit carries out regular, systematic monitoring of control activities and reports its findings to the senior managers of each business unit as well as to the Risk and Audit Committee.
BUSINESS STRATEGIES AND PROSPECTS

26
RISK SUMMARYThe following outlines areas of material risk that could impact our ability to achieve our strategic objectives and future financial prospects including, where applicable, our exposure to economic, environmental or social sustainability risks as well as how we seek to mitigate or manage them.
Strategic and regulatory riskOur businesses operate in highly regulated markets around the world, and our success can be impacted by changes to the regulatory environment and the structure of these markets. As an organisation we closely monitor regulatory developments globally and play an active role in consulting with regulators on changes that could impact our business.
Many of our key businesses are subject to direct regulatory oversight. We are required to maintain the appropriate regulatory approvals and licenses to operate and, in some cases, adhere to certain financial covenants, such as capital adequacy. Computershare has robust compliance management and monitoring programs in place to support these regulatory obligations and we aim to engage proactively with regulators in all relevant jurisdictions.
Our business is also at risk of disruption from new technologies and alternative service providers. This means we must constantly be looking for ways to improve our services by investing in new technologies and processes. We have a dedicated innovation team that is responsible for rapidly assessing the viability of new business ideas and initiatives in an agile yet systematic manner using proven innovation techniques.
Our prospects also depend on finding and executing on opportunities to grow and diversify our business. There is inherent risk in any acquisition, including risk of financial loss or missed earnings potential from inappropriate acquisition decisions as well as integration risk in its implementation. Computershare has a strong track record of acquiring and integrating businesses successfully, particularly with registry and employee share plan administration businesses. We have a deliberately focused acquisition strategy with rigorous approval processes, and we also undertake subsequent reviews of our acquisitions and their performance.
Computershare also operates across a diverse set of countries and tax jurisdictions. The tax environments in these jurisdictions can be complex and subject to change, and these changes cannot be accurately predicted. Computershare operates a global finance function to manage tax risk within the Group’s risk appetite and engages external tax advice as appropriate.
Financial riskOur financial performance each year is underpinned by significant annuity revenue. However, there is also a material proportion of revenue that is derived from transactional activity that is dependent on factors outside our control, which can be challenging to predict. Changes to market activity generally, foreign exchange and interest rates can impact adversely on our financial performance.
Computershare generates significant revenues from the transaction processing fees we earn from our services (including the interest income earned by investing client funds). These revenue sources are substantially dependent on customer trading volumes, market prices and liquidity of securities markets. Sudden, sharp or gradual but sustained declines in market values of securities can result in reduced investor communication activity, including reduced mutual funds communication volumes; reduced mergers and acquisitions activity; reduced proxy activity; reduced trading activity; and illiquid markets.
Margin income is a key contributor to earnings. Changes in investment restrictions, interest rates and the level of balances that we hold on behalf of clients can have a material impact on the Group’s earnings. For example, the swift and forceful response of central banks in early March 2020 to the then-emerging Covid pandemic, with interest rates being reduced to historic lows, resulted in an immediate and significant impact on the margin income that Computershare generates from holding client balances.
We have strong relationships with the global financial institutions that hold our client balances. We have robust policies and other protections to manage interest rate risk and other risks associated with placing those funds (including counterparty risk) and we also make significant investments in processes and technology to identify, allocate, reconcile and oversee client monies.
In addition, in the course of its business Computershare’s mortgage servicing business purchases MSRs in order to service a group or portfolio of mortgages. Interest rate volatility creates risk related to the ability to generate revenue over the expected useful life of the MSR assets.
The market for Computershare’s products and services is rapidly evolving and highly competitive. We compete with a number of firms that provide similar products and services to our own. In addition, we compete with our clients’ in-house capabilities to perform functions that they might otherwise outsource to us. We continually strive to remain the leading provider of services in all our business lines globally and invest significantly in new technology and services to maintain our market-leading position.

27 | COMPUTERSHARE | ANNUAL REPORT | 2021
BUSINESS STRATEGIES AND PROSPECTS
Operational riskComputershare maintains the capability to provide critical services to our clients during times of business disruption through strict business continuity and operational resiliency planning, crisis management and disaster recovery processes. This capability covers the various risks Computershare may face that could disrupt our critical services, from cyber threats to natural disasters.
When the rapid spread of Covid became apparent, we invoked our business continuity plans, which resulted in around 90% of our staff working remotely. Computershare’s response was managed through a dedicated crisis management taskforce with board oversight and reporting.
Computershare deals with a high volume of daily transactions that can be exposed to data loss and security breaches. The nature of cyber-crime is constantly evolving, and information systems are vulnerable to cyber-attacks. Security breaches may involve unauthorised access to Computershare systems and databases, damage to Computershare’s systems and either the exposure or theft of confidential client data (or both). This presents a range of challenges, from ensuring the security and integrity of that data as well as the continuity of our service in the face of internal and external factors. We manage these risks through extensive business resiliency planning and testing as well as rigorous internal controls around the ability to access and modify client data. We also make significant investments in technology and services to protect data at rest, in motion and at endpoint, including a specialist Information Security team whose responsibilities include ensuring we have appropriate and effective systems in place to protect our and our clients’ data from unauthorised access. Our dedicated Financial Crime team is also responsible for analysing information and transactions to mitigate the risk of fraud (both internal and external), and these resources are focused on areas of highest potential exposure.
Computershare also undertakes high volumes of transactional processes, some of which are complex. There is a risk that failure to process these transactions correctly could result in liabilities being incurred to third parties, so we invest significantly in technology to automate processes where possible. We also have policies, processes and corresponding controls to assist in mitigating this risk, which are routinely tested. The Group also maintains appropriate insurance.
Environmental, Social and Governance (ESG) riskThe regulatory environment our businesses operate in increasingly poses requirements with regards to ESG. Computershare incorporates ESG risk within its risk management framework and has policies to ensure clear ownership of risk.
During the Covid pandemic we took unprecedented action to keep our people safe and healthy, ensure our business operated smoothly and continue to serve our clients well. As mentioned above around 90% of our staff moved to working from home, and Computershare will continue to support flexible working arrangements, modified work patterns and schedules to support remote working.
We continue to monitor the risks to our businesses through climate change, environmental management practices and the duty of care which is placed on us as a result, including health and safety at work.
Our compliance program closely monitors our risks related to bribery and corruption and ensures we remain in compliance with applicable laws and regulations. Computershare publishes its Anti-Bribery and Corruption Policy on our website.
Computershare also monitors its network of suppliers to ensure both the Company and its supply chain remain in compliance with applicable Modern Slavery laws. Computershare remains committed to ensuring that slavery and human trafficking form no part of the services we provide or the supply chains we rely upon to provide those services. Computershare publishes an annual Modern Slavery Statement on our website .
We monitor and assess risk management and ethical behaviour in Computershare on an annual basis and take action when we identify areas of improvement or receive feedback during the assessment. We also examine employee perceptions of our ethical behaviours and risk management as well as the effectiveness of our training and policies through our annual employee survey.
Computershare views diversity as a source of strength, and inclusion is at the core of what we do. As every company is trying to create a more diverse employee base, there is a risk that we will be competing for the same talent, and we need to undertake initiatives to mitigate this risk. Computershare has worked with an external Diversity & Inclusion consultancy firm to develop our D&I strategy. We provide regular reporting to our Board, obtain feedback from employees via our annual Employee Opinion Survey and have established Employee Resource Groups (ERGs). We are now focusing our recruitment efforts on minority communities, including by using testimonials of current employees in recruiting efforts, and our ERGs are helping to promote roles using their expertise and networks. We continue to build equitable and inclusive practices into our People Policies and Practices and decision-making protocols. You can read more about our D&I initiatives on page 35.
Computershare has put in considerable effort to reduce its carbon footprint over the years, particularly in terms of the energy used in our data centres and buildings, along with a focus on paper consumption, travel and the recycling of IT kit. In FY20 we took the decision to engage a third party, Climate Partner, to help us calculate our total carbon footprint. This allows us to set one, consolidated target to achieve carbon neutrality globally. This target replaces all previous targets. Between January 2020 and December 2020 CPU’s business activities generated a total of 48,951.21 tonnes of CO
2, 3.7% of which were Scope 1 emissions,
43.2% Scope 2 emissions and 53.1% Scope 3 emissions. You can read more about our sustainability initiatives on page 17.

28
CORPORATE GOVERNANCE STATEMENT
COMPUTERSHARE’S APPROACH TO CORPORATE GOVERNANCEThe Board is committed to maintaining high standards of corporate governance by overseeing a sound and effective governance framework for the management and conduct of Computershare’s business. This corporate governance statement sets out a description of Computershare’s main corporate governance practices. Computershare’s governance arrangements complied with each of the recommendations set by the ASX Corporate Governance Council throughout the reporting period.
In this statement ‘Group’ is used to refer to Computershare Limited and its controlled entities, and references to ‘Group management’ refer to the Group’s Chief Executive Officer and the executives reporting directly to the Chief Executive Officer.
This Corporate Governance Statement has been approved by the Board and is current as at 20 September 2021.
1. BOARD RESPONSIBILITIESThe Board is responsible for the corporate governance of the Group and is governed by the principles set out in the Board Charter. A copy of the charter is available from www.computershare.com/governance.
The principal role of the Board is to ensure the long-term prosperity of the Group and, in doing so, to determine the Group’s strategic direction. The Board also sets broad corporate governance principles, which govern the Group’s business operations and accountability, and ensures that those principles are effectively implemented by Group management.
The Board’s other reserved powers and duties can be divided into five distinct areas of responsibility, an overview of which is provided below:
> Strategic planning for the Group – involves commenting on and providing final approval of the Group’s corporate strategy and related performance objectives as developed by Group management; and monitoring Group management’s implementation of and performance with respect to that agreed corporate strategy.
> Financial and risk management – includes approving the Group’s budgets and other performance indicators and monitoring progress against them; approving and monitoring financial and other reporting, internal and external audit plans; setting the Group’s financial and non-financial risk appetite and approving enterprise risk management plans; and monitoring the progress of major capital expenditure, acquisitions and divestitures within the scope of Board approved delegations.
> Corporate governance – incorporates overseeing Computershare’s corporate governance framework, including approving Computershare’s statement of values and code of conduct as well as changes made to key supporting Group policies; and overseeing Computershare’s reporting to shareholders and its compliance with its continuous disclosure obligations.
> Overseeing Group management – involves the appointment and (if required) removal of the Chief Executive Officer as well as the monitoring of his or her ongoing performance; and (if applicable) the appointment and if required, removal of Group management personnel, including the Chief Financial Officer and Company Secretary.
> Remuneration – comprises the approval of Computershare’s overall remuneration framework and determining the remuneration of non-executive directors within the limits approved by shareholders.
The Board has delegated the responsibility for day-to-day management and administration of Computershare to the Chief Executive Officer. Ultimately, Group management is responsible for managing the Group in accordance with the corporate strategy, plans and policies approved by the Board. It is also required to provide appropriate information to the Board to ensure it can effectively discharge its duties.
2. BOARD COMPOSITION Computershare’s Constitution states that the Board must have a minimum of three and a maximum of ten directors. Re-appointment is not automatic; if retiring directors would like to continue to hold office, they must submit themselves for re-election by Computershare’s shareholders at the Annual General Meeting. No director (other than the Chief Executive Officer) may be in office for longer than three years without facing re-election.
In addition to ensuring that the Board has the mix of skills, knowledge and experience commonly required across boards of major ASX-listed companies, the Board also regularly reassesses its composition to ensure that it:
> Aligns with the Group’s strategic objectives
> Has the necessary skills and expertise to provide oversight of those areas of the Group’s business where there is the greatest scope to increase shareholder value in the future
> Has an appropriate balance of directors who are based in Australia and those who are based in (or who have experience of) regions where there are significant group operations
> Is of a size that is conducive to effective discussion and efficient decision making
Governance

29 | COMPUTERSHARE | ANNUAL REPORT | 2021
CORPORATE GOVERNANCE STATEMENT
To assist in this process, the Board has developed a skills matrix that sets out the skills and experiences that it has or is looking to achieve. The current skills and experience of the Board, assessed against the matrix, are as follows:
Leadership and governance Total out of eight Directors
Strategy 7
Innovation and entrepreneurship 5
CEO-level experience 5
Other non-executive director experience 7
Corporate governance 8
Business experience
M&A and capital markets experience 8
International business experience 7
Working in regulated industries 7
Outsourced business services 6
Business development/access to networks 6
Financial and risk
Accounting and finance 5
Banking and treasury 4
Audit, risk management and compliance 7
Other
Technology 5
HR/remuneration 6
Geographic experience
North America 5
UK and Europe 7
Asia 4
Australia 7
There were no changes to the composition of the Board during the reporting period.
3. DIRECTOR AND SENIOR EXECUTIVE APPOINTMENTSComputershare’s non-executive directors have signed formal letters of appointment setting out the key terms and conditions relating to their appointment as a director. Senior executives at Computershare also sign employment agreements, except in certain overseas jurisdictions as a result of local employment practices.
Proposed appointees to the Board and senior executive appointments are subject to appropriate background checks. The format of these checks is dependent on the residence of the proposed appointee but would typically include police and bankruptcy checks and searches of relevant public records and filings. This is in addition to confirmation of the proposed appointee’s experience and character as appropriate.
Any director appointed by the Board will be required to stand for election at the next AGM, at which time the Company will provide in the notice of meeting all material information known to the Company that is relevant for shareholders to decide on whether to appoint the director.
On appointment, all new directors undertake an induction process. They receive copies of all key governance documents as well as briefings from senior management on material matters relating to the Computershare Group, including strategic considerations, financial performance, major markets and business lines as well as operational and technological capability. The Board has typically held meetings in all the major markets in which the Group operates, which provides new directors, along with the rest of the Board, the opportunity to meet with management and visit operational facilities during those meetings. The Board looks forward to resuming these activities when current travel restrictions are lifted.
Directors receive briefings on material macro developments that might impact the Group’s operations, such as market structure changes and changes to business models. Members of the Risk and Audit Committee also receive updates on financial reporting and accounting matters as part of continuing professional education. Directors otherwise keep themselves informed of relevant matters by self-education and attendance at various courses and presentations and may also request that the Company provide them with specific development opportunities which they may consider necessary to improve their skills and knowledge.

30
SIMON JONESM.A. (Oxon), A.C.A.
STUART IRVING CHRISTOPHER MORRIS
Position: Chairman Age: 65Independent: YesYears of service: 16
Term of officeSimon Jones was appointed to the Board in November 2005 as a non-executive director. Simon was appointed as Computershare’s Chairman in November 2015 and was last re-elected by shareholders in 2019.
Skills and experienceSimon is a chartered accountant with extensive experience in investment advisory, valuations, mergers and acquisitions, public offerings, audit and venture capital. Simon was previously a Managing Director of N.M. Rothschild and Sons (Australia) and Head of Audit and Business Advisory (Australia & New Zealand) and Corporate Finance (Melbourne) at Arthur Andersen.
Other directorships and officesDirector of Canterbury Partners Chairman of the Advisory Board of MAB Corporation Pty Ltd
Board Committee membershipChair of the Nomination Committee Member of the Risk and Audit Committee Member of the People and Culture Committee
Position: Chief Executive OfficerAge: 50 Independent: No Years of service: 7
Term of officeStuart Irving was appointed Chief Executive Officer and President of Computershare on 1 July 2014. He joined Computershare in 1998.
Skills and experienceStuart held a number of roles at The Royal Bank of Scotland before joining Computershare as IT Development Manager in the UK.
Stuart subsequently worked in South Africa, Canada and the US before becoming Chief Information Officer for North America in 2005 and then the Computershare Group’s Chief Information Officer in 2008.
Board Committee membershipMember of the Nomination Committee
Position: Non-Executive DirectorAge: 73 Independent: No Years of service: 43
Term of officeChris Morris and an associate established Computershare in 1978. Chris was appointed Chief Executive Officer in 1990 and oversaw the listing of Computershare on the ASX in 1994.
He became the Group’s Executive Chairman in November 2006 and relinquished his executive responsibilities in September 2010, and subsequently stood down as Chairman in November 2015.
Chris was last re-elected in 2018.
Skills and experienceChris has worked across the global securities industry for more than 30 years. His knowledge, long-term strategic vision and passion for the industry have been instrumental in transforming Computershare from an Australian business into a successful global public Company.
Other directorships and officesNon-Executive Chairman of Smart Parking Limited (appointed in 2009)
Board Committee membershipMember of the Nomination Committee
THE DIRECTORSAs at the date of this Annual Report, the Board composition (with details of the professional background of each director) is as follows:

31 | COMPUTERSHARE | ANNUAL REPORT | 2021
CORPORATE GOVERNANCE STATEMENT
TIFFANY FULLERB.Com, GAICD, ACA
JOSEPH VELLIBA, MBA
ABI CLELANDB.Com, BA, MBA.
Position: Non-Executive DirectorAge: 51 Independent: Yes Years of service: 7
Term of officeTiffany Fuller was appointed to the Board on 1 October 2014 as a non-executive director. Tiffany was last re-elected in 2019.
Skills and experienceTiffany is an experienced public company non-executive director with broad experience in chartered accounting, corporate finance, investment banking, funds management and management consulting in Australia and globally.
Tiffany’s skills include finance and accounting, strategy, M&A, risk and governance. Her career includes roles at Arthur Andersen and Rothschild and spans multiple industry sectors including financial services, technology, retail, resources and telecommunications.
Other directorships and officesNon-Executive Director of Washington H. Soul Pattinson & Company Limited (appointed in 2017)Non-Executive Director of Smart Parking Limited (resigned December 2020)
Board Committee membershipChair of the Risk and Audit Committee Member of the Nomination Committee
Position: Non-Executive DirectorAge: 62 Independent: Yes Years of service: 7
Term of officeJoseph Velli was appointed to the Board on 1 October 2014 as a non-executive director. Joseph was last re-elected in November 2020.
Skills and experienceJoseph is a retired financial services and technology executive with extensive securities servicing, M&A and public board experience. For most of his career, Joseph served as Senior Executive Vice President of The Bank of New York and as a member of the Bank’s Senior Policy Committee.
During his 22-year tenure with the Bank, Joseph’s responsibilities included heading Global Issuer Services, Global Custody and related Investor Services, Global Liquidity Services, Pension and 401k Services, Consumer and Retail Banking, Correspondent Clearing and Securities Services. Most recently Joseph served as the Chairman and Chief Executive Officer of Convergex Group.
Other directorships and officesNon-Executive Director of Paychex, Inc. Non-Executive Director of Cognizant Technology Solutions Corporation
Board Committee membershipMember of the People and Culture CommitteeMember of the Nomination Committee
Position: Non-Executive DirectorAge: 48 Independent: Yes Years of service: 3
Term of officeAbi Cleland was appointed to the Board as a non-executive director on 14 February 2018 and was re-elected by shareholders in November 2020.
Skills and experienceAbi Cleland has extensive global experience in strategy, M&A, digital and business growth. She has held senior executive roles in the industrial, retail, agriculture and financial services sectors at companies including ANZ, Amcor, Incitec Pivot, Caltex after starting her career at BHP. Over the last five years Abi set up and ran an advisory and management business, Absolute Partners which focused on strategy, M&A and building businesses leveraging disruptive changes.
Other directorships and officesNon-Executive Director of Orora Limited (appointed in 2014)Non-Executive Director of Sydney Airport Limited (appointed in 2018)Non-Executive Director of Coles Group Limited (appointed in 2018)
Board committee membershipMember of the People and Culture CommitteeMember of the Nomination Committee

32
LISA GAYBA, LLB
PAUL REYNOLDSBA, PhD
Position: Non-Executive DirectorAge: 59 Independent: Yes Years of service: 3
Term of officeLisa Gay was appointed to the Board as a non-executive director on 14 February 2018 and was re-elected by shareholders in November 2018.
Skills and experienceLisa Gay is a highly regarded business leader with extensive financial services experience in funds management, investment banking, and stockbroking. She was formerly Chair of the Australian Securities and Investment Commission’s Markets Disciplinary Panel and Deputy Chair of the Indigenous Land Corporation. From 1990-2010 Lisa was general counsel and managing director of Goldman Sachs Group Australia.
Other directorships and officesActing Chair of Victoria Funds Management CorporationNon-executive Director of Koda Capital Member of the Council of Trustees of the National Gallery of Victoria
Board committee membershipChair of the People and Culture CommitteeMember of the Nomination Committee
Position: Non-Executive DirectorAge: 64 Independent: Yes Years of service: 3
Term of officePaul Reynolds was appointed to the Board as a non-executive director on 5 October 2018 and was re-elected by shareholders in November 2018.
Skills and experiencePaul Reynolds has gained extensive leadership skills from his previous experience in CEO and Chairman positions with complex, large-scale infrastructure enterprises. He was a member of the board at British Telecom from 2001-2007 and CEO of one of its largest businesses, BT Wholesale, where he led the global technology divisions and many of its biggest transformation programs. From 2007-2012, Paul was CEO of Telecom New Zealand, during the world’s first structural separation into independent retail and network companies. Paul is based in the UK.
Other directorships and officesNon-Executive Chairman of 9 Spokes Limited (appointed in 2014)Non-Executive Chairman of STV Group plcNon-Executive Director of Talk Talk Telecom Group Limited
Board committee membershipMember of the Risk and Audit Committee Member of the Nomination Committee

33 | COMPUTERSHARE | ANNUAL REPORT | 2021
CORPORATE GOVERNANCE STATEMENT
4. BOARD INDEPENDENCEThe Board has considered each of the eight directors in office as at the date of this Annual Report and has determined that a majority (six out of eight) are independent (and were so throughout the reporting period). The two directors who are not considered to be independent are Chris Morris, due to his substantial shareholding in the Company, and Stuart Irving, as the current Group Chief Executive Officer.
To determine the independence of a director, the Board must consider several different factors, including those set out below:
> Whether the director acts (or has recently acted) in an executive capacity for the Company
> The materiality of the director’s shareholding in the Company (if any)
> The existence of any other material relationship between the director and a member of the Group (for example, where the director is or has been an officer of a significant adviser, supplier or customer)
> The ability of the director to exercise their judgement independently
In relation to the Chairman, Simon Jones, the Board notes that he was first appointed as a non-executive director in November 2005 and subsequently as Chairman in November 2015. The Board has considered and is satisfied that Mr Jones’s tenure as a director does not have any impact on his capacity to bring an independent judgement to bear on issues before the Board or to act in the best interests of the Company and its shareholders generally. The Board also notes that Joseph Velli is a director of Cognizant Technology Solutions Corporation, a company which supplies IT and business outsource services to the Group. The Board has considered this relationship and is satisfied that Mr Velli’s position as a director of Cognizant Technology Solutions Corporation does not have any impact on his capacity to bring an independent judgement to bear on issues before the Board. The Board has appropriate procedures in place to manage circumstances where a matter relating to Cognizant Technology Solutions Corporation might be under consideration by the Board.
5. BOARD MEETINGS AND REPORTSThe Board’s pre-pandemic meeting schedule included four in-person meetings each year as well as a series of scheduled update meetings. The Board would also meet as required to discuss and, if appropriate, approve specific strategic initiatives contemplated by the group. When the Board met in person, those meetings would generally take place over three days and provide the Board with the opportunity to meet senior management relevant to the agenda for the meeting. At its meetings the Board discusses the Group’s results, prospects, strategy (both short and long-term), operational performance and other matters, including legal, governance and compliance issues.
The Committees of the Board also meet regularly to fulfil their duties (as discussed further below).
Computershare’s directors and group management are located across multiple locations in Australia, North America and the UK. Given pandemic-related travel restrictions, the Board currently conducts its meetings ‘virtually’. The Board continued to meet more frequently in FY21 than is typical, with the standard Board calendar being supplemented by additional update meetings. The Board also established a sub-committee to specifically consider the acquisition of the Corporate Trust business of Wells Fargo that was announced on 24 March 2021. The Board held additional meetings to approve that acquisition and the renounceable accelerated rights issue that took place to partly fund it and directors were also members of the Due Diligence Committee that was established to oversee the rights issue documentation.
Group management provides monthly reports to the Board detailing current financial information concerning the Group. Management also provides additional information on matters of interest to the Board, including operational performance, major initiatives and the Group’s risk profile (as appropriate). The Board received additional reporting during the initial stages of the Covid pandemic, which provided the Board with strong oversight of business continuity and remote working arrangements, trading updates across business lines, enhanced cash and liquidity reporting as well as how key risks within the group were being managed.
6. BOARD COMMITTEESTo assist in discharging its responsibilities, the Board has established three committees.
Risk and Audit CommitteeThe principal function of the Risk and Audit Committee is to provide assistance to the Board in fulfilling its corporate governance and oversight responsibilities in relation to the Company’s financial reporting, internal control structure, risk management systems, internal audit function and external audit requirements. The Committee also reviews material legal matters and receives updates on reports made under the Group’s Whistleblower program and Financial Crime Unit.
The Risk and Audit Committee is chaired by Non-Executive Director, Tiffany Fuller. The Committee currently has two other members, Simon Jones and Paul Reynolds. Lisa Gay was also a member of the Committee during FY21 and recently stood down from that Committee to assume the Chair of the People and Culture Committee. Each member of this Committee is considered by the Board to be independent.
The Board regards these members as having the required financial expertise and an appropriate understanding of the markets in which the Group operates. The Chief Executive Officer, the Chief Financial Officer, the Group Head of Internal Audit, the Group Risk Officer and the Company’s external auditors are invited to meetings of the Risk and Audit Committee at the Committee’s discretion.
The Risk and Audit Committee is governed by a Board-approved charter. A copy of this Risk and Audit Committee Charter is available from www.computershare.com/governance.

34
Nomination CommitteeThe main functions of the Nomination Committee are to review the competence, expertise, performance, constitution and succession of the Board as well as the performance of individual directors.
The Nomination Committee generally meets on each occasion that the Board meets in person. All current directors are members of the Nomination Committee, and it is chaired by Simon Jones in his capacity as Chairman of the Board.
The Nomination Committee’s policy for the appointment of directors is to select candidates whose skills, expertise, qualifications, networks and knowledge of the markets in which Computershare operates (and other markets into which it may expand) complement those of existing Board members so that the Board as a whole has the requisite skills, diversity and experience to fulfil its duties.
The Nomination Committee is governed by a Board-approved charter. A copy of this Nomination Committee Charter is available from www.computershare.com/governance.
People and Culture CommitteeIn FY2021, the Human Resources and Remuneration Committee was renamed the People and Culture Committee and its remit was further expanded across the employee life cycle at Computershare. The People and Culture Committee’s principal functions are to advise the Board on matters relating to performance, talent and succession, culture and inclusion and diversity, as well as the remuneration of the Group’s key management personnel and more broadly across the Group.
In relation to remuneration-related matters, the Committee considers, reviews and makes recommendations to the Board about the following matters:
> The Chief Executive Officer’s remuneration policy recommendations
> Remuneration and contract terms for the Chief Executive Officer and the Group’s key executives
> Terms and conditions of long-term incentive plans, short-term incentive plans, share rights plans, performance targets and bonus payments for the Chief Executive Officer and the Group’s key executives
> Terms and conditions of any employee incentive plans
> The recommendations of the Chief Executive Officer on offers to executives under any long-term incentive plan established by the Company from time to time
> Remuneration of non-executive directors within the limits approved by shareholders
> Content of the remuneration report to be included in the Company’s Annual Report
In relation to people and culture matters, the Committee considers, reviews and makes recommendations to the Board about the following matters:
> Succession planning for senior management and development frameworks for key talent
> The effectiveness of the Group’s diversity policies and initiatives
> Monitoring surveys conducted by the Company in relation to the culture of the organisation; assessing performance against measurable objectives for achieving diversity on an annual basis, including the relative proportion of women at all levels; and Computershare’s compliance with external reporting requirements
The Committee is currently chaired by Lisa Gay, who assumed that role from Joseph Velli at the start of FY22. Joseph Velli remains on the Committee as a member, together with Simon Jones and Abi Cleland. Pursuant to its Charter, the Committee must always be comprised of a majority of independent directors.
The Committee has access to Group management and, where necessary, may consult independent experts to discharge its responsibilities effectively.
The People and Culture Committee is governed by a Board-approved charter. A copy of this People and Culture Committee Charter is available from www.computershare.com/governance.
For details of directors’ attendance at Committee meetings, see the Directors’ Report, which starts on page 41 of this Annual Report.
7. EQUITY PARTICIPATION BY NON-EXECUTIVE DIRECTORSThe Board encourages non-executive directors to own shares in the Company. However, the Company has not awarded shares to non-executive directors and does not mandate that directors must hold a minimum shareholding in the Company. As at the date of this report, all non executive directors hold a relevant interest in shares in the Company.
8. REMUNERATIONFor information relating to the Group’s remuneration practices and details relating to the directors’ remuneration and that of the Group’s key management personnel during the year ended 30 June 2021, see the Remuneration Report, which starts on page 44 of this Annual Report and is incorporated into this corporate governance statement by reference.
In addition to the disclosures contained in the Remuneration Report, it should be noted that the Board is keen to encourage equity holdings in the Company by employees with a view to aligning staff and shareholder interests. Many employees have participated (and continue to participate) in the various equity plans offered by the Company, and the directors believe that, historically, this has contributed significantly to the Group’s success.

35 | COMPUTERSHARE | ANNUAL REPORT | 2021
CORPORATE GOVERNANCE STATEMENT
9. ANNUAL REVIEW OF BOARD AND GROUP MANAGEMENT PERFORMANCEThe Board’s performance is regularly reviewed by the directors of the Company as a whole. There is a standing agenda item at Board meetings for directors to be given an opportunity to discuss any concerns they may have with the Board’s and its Committees’ performance as well as any steps that can be taken to maintain their effectiveness.
Directors also completed questionnaires relating to Board and Committee performance during the reporting period, and the Board and relevant Committee then reviewed and discussed the responses. The directors believe that this process works well for its size and composition.
The process for evaluating the performance of individual directors is an informal one. The Chairman is responsible for engaging directly with directors on any individual performance concerns. Directors can raise concerns they might have with an individual director’s performance directly with the Chairman.
The Board annually reviews the Chief Executive Officer’s performance while the Chief Executive Officer annually reviews the performance of the other members of Group management against their KPIs for the year. This review process results in each member of Group management receiving a proposed numerical rating which determines their short-term incentive outcomes for the year. The proposed rating given to each member of Group management is then reviewed by the People and Culture Committee.
10. IDENTIFYING AND MANAGING BUSINESS RISKSThe Business Strategies and Prospects section of this Annual Report contains a summary of Computershare’s approach to managing risk within the organisation, including its exposure to environmental and social risks.
In respect of the reporting period, the Board received a report from the Chief Executive Officer and the Chief Financial Officer that confirms, among other things, the following:
> The ‘Declaration to the Board of Directors of Computershare Limited’, a copy of which is included in this Annual Report (see page 125) as required by section 295A of the Corporations Act 2001, is founded on a sound risk management and internal control system that is operating effectively in all material respects in relation to financial reporting risks
> The Group’s material business risks have been managed effectively
The Risk and Audit Committee reviewed and assessed the Group’s risk management practices throughout the year and also undertook a formal review of the Group’s risk management framework during the reporting period and was satisfied that it remained sound.
11. DIVERSITY AND INCLUSIONThis summary outlines our progress during FY21 and covers our focus areas for FY22.
Progress during FY21During the past year, we have focused on the creation and engagement of our Employee Resource Groups (ERG), realigned our D&I champions and further embedded D&I in our corporate culture through regular communications and events. We now have D&I champions across all business lines and geographies through our Women4Women (W4W), Black Leadership Group (BLG), Purple Pride ERGs and D&I Working Groups.
ERGs can help make specific aspects of D&I more tangible to everyone and help contribute to a culture of inclusivity and equality. ERGs support the employee experience and drive engagement in three main ways:
Peer-to-peer support Raising awareness Providing insight
Providing a space for employees to support each other, to express concerns they may have and spend time with people who better understand their experiences. This can improve their day to day experience at work by helping them to feel less isolated, receive support and to grow in confidence.
Promoting a better understanding of minority groups, making their experiences more visible across the organisation through company-wide communication, D&I focus weeks, training, webinars, small group discussions and spotlight articles. This supports inclusion more widely and empowers others to step up as allies and improve the workplace culture for everyone.
Feeding back concerns, opportunities and suggested improvements to the D&I steering committee, creating opportunities for dialogue in a structured way and providing employees with a greater voice to help inclusion be embedded more securely within Computershare.
The widespread move to remote working has made it easier to organise global events and reach a broader audience. Both external and internal guest speakers have led webinars and small discussion groups on topics that have been requested by our employees and by ERGs.
Computershare’s Change A Life charitable foundation selected a D&I charitable partner to support, Black Girls CODE. Their mission is to build pathways for young women of colour to enter the tech marketplace, by introducing them to skills in computer programming and cutting-edge technologies.
This year, we saw an increase in the scores for every D&I related question in our Global Employee Survey, reflecting the impact of our communication, awareness raising and engagement efforts.

36
Over the past year we also:
> Developed more targeted recruitment advertising focused on attracting talent from minority groups
> Incorporated testimonials from armed service veteran employees in our recruitment activities as well as from members of our Employee Resource Groups
> Raised awareness of D&I objectives, highlighting the case for change and the connection between D&I and business goals
> Enhanced training content with D&I principles
> Ran a paid internship program in South Africa, enabling people with disabilities to gain work experience and exposure to career opportunities in their field
Feedback on Measurable Objectives
Objective Measurement
D&I Champion realignment Complete. Through Employee Resource Groups we have D&I representation across all regions and business lines.
Strategy: Drive the execution of our three-year D&I strategy through our global business lines, with the realigned champions group and a dedicated D&I Manager
D&I Manager appointed in 2020 and D&I representation embedded as a key measure across all regions and business lines. As we come to the completion of our three-year strategic plan, we are refreshing our strategy with action plans for the next three years.
Training: Further extend the D&I training available via our Learning Management System and Performance Management toolkit with the aim of continuing to raise awareness and improve key outcomes in line with our D&I strategy
Building upon last year’s rollout of a new digital learning platform globally, we’ve increased personalisation and added D&I training through our mandatory module (Computershare and Me), where we embedded content on inclusion and unconscious bias. As part of our Employee Resource Groups and D&I focus weeks, we created online resources accessible to all employees.
Communication: Continue to deliver regular, high-quality D&I-related communications across our staff
Through our Employee Resource Group events and other regularly scheduled diversity, inclusion and wellness events, we ran communications campaigns about inclusion, bringing one’s whole self to work, global diversity, LGBTQ+ and unconscious bias awareness. We also created an online library specific to D&I-related topics.
Reporting: Continue to develop the D&I reporting available across all data categories in line with the global People data strategy
Defined, developed and implemented legal/regulatory and Board diversity reporting requirements and identified opportunities to enhance reporting and insight with our current data capabilities.
Gender diversity statistics for FY21The table below includes data on global gender statistics at a global level as of 30 June 2021.
Observations include:
> Representation on the Computershare Board is currently 38% female and 63% male (three out of eight are female)
> The percentage of our overall staff that are women (54%) has not changed year-on-year
> The percentage of females in executive positions (28%) has not changed year-on-year
> When considering the two most senior management categories combined (CEO direct reports and company executives), female representation has increased slightly (from 27.4% to 27.6%) because of the greater numbers of people classified as company executives in FY21
> While the numbers of senior female managers increased in FY21, the overall proportion of women in this role decreased slightly (from 38.7% to 37.4%) because the number of male senior managers increased at a greater rate
F M F% M% TotalChange to
Female
Board (inc. CEO) 3 5 38% 63% 8 =
Direct reports of CEO 3 13 19% 81% 16 =
Company Executive* 42 105 29% 71% 147 =
Senior Manager* 208 348 37% 63% 556 -
Manager 751 831 47% 53% 1582 =
Other 5,456 4,220 56% 44% 9,676 =
Total 6,463 5,522 54% 46% 11,985 =
Data valid as of 30 June 2021.
* Company Executive means a person reporting to a direct report of the CEO. * Senior Manager means a person reporting to a Company Executive.

37 | COMPUTERSHARE | ANNUAL REPORT | 2021
CORPORATE GOVERNANCE STATEMENT
FY22 focus areas and objectives
Objective Measurement
Strategy: Our D&I Manager will drive the execution of a refreshed, three-year D&I strategy through our global business lines with D&I champions aligned to regions and business lines.
To be measured using statistics from diversity related programs, our People Management system, surveys, performance reviews, exit interviews, employee referrals and open discussion forums.
Communication: Continue to deliver regular, high-quality D&I-related communications to our staff.
To be measured using reporting from our internal communications reporting system and feedback from our Global Employee Survey.
Engagement: Generate more employee involvement in D&I related activities and participation in the creation of people-related policies and processes.
To be measured by the number of people participating in D&I and ERG events; the increase or decrease in the number of participants; and ratings from responses in the Global Employee Survey that relate to D&I.
Engagement: Provide training that is relevant and timely to reflect the needs of our global organisation and to support the growth of minority groups.
To be measured using statistics from our Learning Management System.
Reporting: Continue to enhance the D&I reporting available across all data categories in line with the global People data strategy.
Required reporting on gender and other demographics delivered accurately and on time. Enhancements will be measured through project management tracking.
Board: The Computershare board should have at least 30% male and 30% female directors.
To be measured using gender diversity statistics compiled for the Annual Report.
Our D&I Policy is available at www.computershare.com/governance.
12. WORKPLACE GENDER EQUALITY REPORTIn each country in which Computershare operates, the Company complies with legislated diversity reporting requirements. In Australia, Computershare met its reporting requirements under the Federal Government’s Workplace Gender Equality Act 2012, including submitting an annual public report on 17 August 2021.
A copy of this report is available from www.computershare.com/governance. Any comments regarding this report can be submitted via email to the following address: [email protected].
13. SECURITIES TRADING POLICYThe Company has a Securities Trading Policy in place that sets out the restrictions that apply to the Group’s directors, officers and employees trading in Computershare securities.
The policy explains the insider trading laws as they relate to trading in Computershare securities and the securities of Computershare’s clients. It also sets out the penalties that apply to insider trading offences under the Corporations Act 2001 and makes clear that Computershare adopts a zero-tolerance approach to breaches of insider trading laws.
The policy imposes additional restrictions on dealings in Computershare securities by Computershare directors and certain specified executives (designated persons). These designated persons may deal in Computershare securities during the four-week period after the Company releases its half-year and full-year financial results and after the date on which its Annual General Meeting is held (subject always to the laws on insider trading).
In addition, these designated persons may only deal in Computershare securities outside those specified, four-week trading windows with an express prior clearance by a nominated director. During certain prohibited periods, being the period between 15 December and the Company’s release of its half-year results, the period between 15 June and the Company’s release of its full-year results and other such periods as may be determined by the Board from time to time, clearance to deal can only be given in exceptional circumstances.
Under the policy, designated persons are also prohibited from entering into an arrangement pursuant to which they seek to hedge the economic risk associated with an unvested incentive award made to them by Computershare.
The list of designated persons is set out in the Schedule to the Securities Trading Policy. It is reviewed and updated as appropriate, having regard to any changes in the structure of Group management or the creation of new roles within it. An up-to-date copy of the Board-approved Securities Trading Policy is available from www.computershare.com/governance

38
14. CORPORATE REPORTINGThe Chief Executive Officer and the Chief Financial Officer have made a Declaration to the Board of Directors in respect of the year ended 30 June 2021 as detailed on page 125 of this Annual Report. The Board also receives a declaration from the Chief Executive Officer and the Chief Financial Officer that the Declaration from them set out in the Annual Report has been founded on a sound system of risk management and internal control; and that the system is operating effectively in all material respects in relation to financial reporting risks. The Chief Executive Officer and the Chief Financial Officer also provided an equivalent statement to the Directors in respect of the Company’s half-year report for the period ended 31 December 2020.
Where any periodic corporate report is released by Computershare to the market that is not otherwise audited or subject to review by its external auditor PWC, Computershare ensures that the content of the report is subject to extensive review and sign off by senior members of staff, which includes the allocation of material disclosures to designated persons to verify the disclosures by reference to appropriate source documents or, if no source documents are available, by persons with the knowledge and expertise to confirm the accuracy and completeness of the disclosure. All corporate financial reporting is also reviewed by the Risk and Audit Committee or, if applicable, a designated sub-committee of the Board.
15. CONFLICT OF INTEREST AND INDEPENDENT ADVICEIf a director has an actual or potential conflict of interest in a matter under consideration by the Board or a Committee of the Board, that director must promptly disclose that conflict of interest and abstain from deliberations on the matter. In that circumstance, the director is not permitted to exercise any influence over other Board members or Committee members on that issue nor receive relevant Board or Committee papers.
The Company permits any director or Committee of the Board to obtain external advice about transactions or matters of concern at the Company’s cost. Directors seeking independent advice must obtain the approval of the Chairman, who is required to act reasonably in deciding whether the request is appropriate.
16. OUR VALUES AND ETHICAL STANDARDSComputershare recognises the need for directors and employees to perform to the highest standards of behaviour and business ethics. The Company has adopted the “Being Purple” ways of working, which outline our values as an organisation and the conduct, behaviours and professional attributes we want to promote and reward. A detailed overview of these values is set out on page 21 of this Annual Report.
The Board has also adopted a Code of Conduct that sets out the principles and standards with which all officers and employees are expected to comply as they perform their respective functions. The Code recognises the legal and other obligations that the Company has to legitimate stakeholders and requires that directors, officers and employees maintain the highest standards of propriety and also act in accordance with the law. The Risk and Audit Committee also receives a quarterly report that includes information on employee misconduct matters.
A copy of the Group’s Board-approved Code of Conduct is available from the corporate governance section of our website.
17. SHAREHOLDER COMMUNICATIONS AND INVESTOR RELATIONSComputershare has an investor relations program in place with the aim of facilitating effective communication between Computershare and its investors. A key feature of this program is to ensure that shareholders are appropriately notified of information necessary to assess Computershare’s performance and are able to access it. Information is communicated to shareholders through the following means:
> The Annual Report, which is distributed to all shareholders who elect to receive it. An overview of the previous financial year is also included in the Notice of AGM that all shareholders receive.
> The AGM and any other shareholder meetings called from time to time to obtain shareholder approval as required. Since 2017, the Company has conducted its AGM as a hybrid meeting, which provides an opportunity for shareholders to attend the meeting via an online platform. Attending the meeting online enabled shareholders to view the AGM live, ask questions and cast direct votes at the appropriate times whilst the meeting was in progress. As a result of pandemic-related restrictions, the 2020 AGM was held as a fully virtual meeting.
> The Company’s website, which contains information regarding the Company, the Group and its corporate governance framework. The Investor Relations section of the website also includes information released to the ASX, a copy of investor and analyst briefing documentation, press releases and webcasts. The Company also releases new and substantive investor presentations on the ASX announcements platform.
> By email to those shareholders who have supplied their email address for the purpose of receiving communications from the Company electronically. Computershare actively encourages shareholders to provide an email address to facilitate more timely and effective communication with them and runs campaigns from time to time to encourage greater email adoption.
Computershare also encourages shareholders to participate in the Company’s AGM. Shareholders who are unable to attend and vote during the meeting are encouraged to vote electronically in advance via Computershare’s service known as InvestorVote, where they can view an electronic version of the voting form and accompanying materials as well as submit their votes. Computershare also encourages shareholders who are unable to attend the AGM to communicate any issues or questions by writing to the Company. All resolutions are decided by way of a poll.

39 | COMPUTERSHARE | ANNUAL REPORT | 2021
CORPORATE GOVERNANCE STATEMENT
18. COMMITMENT TO AN INFORMED MARKET RELATING TO COMPUTERSHARE SECURITIESThe Board has a Market Disclosure Policy to ensure the fair and timely disclosure of price-sensitive information to the investment community as required by applicable law. Under the policy the Board must approve the text of any announcement relating to the annual and half year financial reports as well as any other information for disclosure to the market that contains or relates to financial projections, statements as to future financial performance or changes to the policy or strategy of Computershare (taken as a whole). Announcements that do not require the approval of the Board can be approved for release by the Chief Executive Officer, and routine administrative announcements may be made by the Company Secretary. Directors are also provided with copies of material announcements once made.
In order to effectively manage its continuous disclosure obligations, the Chief Executive Officer has also established a Disclosure Committee to provide guidance on the following matters:
> Considering what information needs to be released to the market by Computershare.
> Referring announcements to the Board for approval where required.
> Ensuring there are adequate systems for ensuring timely disclosure of material information to the market, including where such information needs to be released urgently.
The Disclosure Committee consists of the Chief Executive Officer, the Chief Financial Officer, the Head of Investor Relations, and the Group General Counsel and Company Secretary. When an issue that should be referred to the board under company policy has an urgency that prevents its consideration by the full Board, all available directors in conjunction with the Disclosure Committee may approve an announcement relating to that issue to the market.
Further, in circumstances where it is considered appropriate to request a trading halt (for example, where Computershare is required to disclose information to the market but, for whatever reason is unable to do so promptly), the Chief Executive Officer (or, if the Chief Executive Officer is unavailable, the Chairman, Chair of the Risk and Audit Committee or Chief Financial Officer) is authorised to request a trading halt on behalf of the Company. The full Board is to be consulted as far as is practicable on any request for a trading halt.
A copy of the Board-approved Market Disclosure Policy is available from the corporate governance section at www.computershare.com/governance
19. EXTERNAL AUDITORSThe Company’s policy is to appoint external auditors who demonstrate professional ability and independence. The auditor’s performance is reviewed annually.
PricewaterhouseCoopers were appointed as the external auditors in May 2002. Audit services have been put out to tender since their initial appointment.
PricewaterhouseCoopers normally rotates audit engagement partners on listed companies every five years. It is also PricewaterhouseCoopers’ policy to provide an annual declaration of independence, a copy of which can be found on page 64 of this Annual Report. The external auditor is required to attend the Company’s Annual General Meeting and be available to answer shareholder questions about the conduct of the audit and the preparation of the content of the audit report, the accounting policies adopted by the Company in relation to the preparation of the financial statements and the independence of the auditor in relation to the conduct of the audit.
An analysis of fees paid to the external auditors, including a breakdown of fees for non-audit services, is provided in the Directors’ Report (see page 63 of this Annual Report). The Board has a formal policy for reviewing all non-audit services provided by PricewaterhouseCoopers that is administered by the Risk and Audit Committee.
20. INTERNAL AUDITORSComputershare has a dedicated Group Internal Audit function. The function is led by the Group Head of Internal Audit who has a reporting line to the Chair of the Risk and Audit Committee. Group Internal Audit is authorised to audit all areas of the Computershare Group without the need for prior approval. In carrying out its responsibilities, it has full and unrestricted access to all records, property, functions, IT systems and staff members in the Group.
Each financial year the function develops an annual audit plan, which is approved by the Risk and Audit Committee. The function’s key responsibilities are to:
> Review and appraise the adequacy, design and effectiveness of the Group’s system of internal controls
> Evaluate and improve the effectiveness of risk management, control and governance processes as well as to identify control gaps.
On completion of audit assignments, Internal Audit will issue written reports, which are distributed to management and communicated to the Risk and Audit Committee. Where the report identifies specific findings and recommendations, the report will include an action plan from management to implement appropriate corrective action within specific timeframes, which are actively monitored. All internal audits are conducted in accordance with the Institute of Internal Auditors (IIA) Standards for the Professional Practice of Internal Auditing.

40
21. ANTI-BRIBERY AND CORRUPTIONThe Board has approved an Anti-Bribery and Corruption policy, which sets out Computershare’s clear statement of zero tolerance for acts of bribery and corruption and confirmation that Computershare will not tolerate its employees or contractors being involved in acts of bribery and corruption in any form. This is reinforced in the Group Code of Conduct.
The Anti-Bribery and Corruption policy is part of the framework for the Computershare Group-wide Anti-Bribery and Anti-Corruption (ABC) Program, which is under the responsibility of the Group Risk and Compliance function. All breaches of the policy must be reported to the compliance function and ultimately to the Rick and Audit Committee.
A copy of the Board-approved Anti-Bribery and Corruption policy is available from the corporate governance section of www.computershare.com/governance
22. WHISTLEBLOWINGThe Board has approved a Whistleblower Policy that outlines procedures for dealing with allegations of improper conduct made by directors, officers or employees of the Company or parties external to Computershare. Concerns can be raised anonymously in a number of ways, including through an externally managed hotline and web portal, or by directly contacting designated regional Whistleblower officers. Any reported concerns are assessed and handled by these regional Whistleblower officers. The Group Whistleblower Officer also provides quarterly reports to the Group Risk and Audit Committee on any concerns reported over the period and more serious matters may be escalated to the Committee within a reporting period where appropriate.
All Computershare employees receive annual training about the Company’s Whistleblower Policy, including how to detect and report improper conduct. A copy of the Whistleblower Policy is available from www.computershare.com/whistleblowing.
23. CORPORATE RESPONSIBILITYFor details relating to the Company’s corporate responsibility initiatives, see pages 17 to 20 of this Annual Report.
A copy of the Board-approved Corporate Responsibility Policy is also available from the corporate governance section at www.computershare.com/governance.
24. HEALTH AND SAFETYComputershare aims to provide and maintain a safe and healthy work environment. Computershare acts to meet this commitment by implementing work practices and procedures throughout the Group that comply with the relevant regulations governing workplaces in each country in which the Group operates. Employees are expected to take all practical measures to ensure a safe and healthy working environment in keeping with their defined responsibilities and applicable laws.
The maintenance of a safe and healthy working environment for our staff globally was identified as the key priority for the group at the outset of the Covid pandemic. Remote working measures were deployed for more than 90% of our staff and, where roles could not be performed remotely, strict Covid safety protocols were implemented across all work sites in accordance with local requirements.
25. COMPANY SECRETARYThe Company Secretary during the reporting period was Dominic Horsley. Under Computershare’s Constitution, the appointment and removal of the Company Secretary is a matter for the Board.
Among other matters, the Company Secretary advises the Board on governance procedures and supports their effectiveness by monitoring Board policy and procedures, by coordinating the completion and dispatch of Board meeting agendas and papers as well as by assisting with the induction of new Directors. The Company Secretary is accountable to the Board, through the Chairman, for these responsibilities.
Dominic Horsley joined the Company in June 2006, having previously practised law at one of Asia Pacific’s leading law firms, and worked as a Corporate Counsel with a major, listed Australian software and services supplier. Dominic completed a Bachelor of Arts (Hons) in Economics at the University of Cambridge and completed his legal studies at the College of Law in London. Dominic is also the Group General Counsel of Computershare and is a Fellow of the Governance Institute of Australia.
All directors have access to the advice and services of the Company Secretary.

41 | COMPUTERSHARE | ANNUAL REPORT | 2021
The Board of Directors of Computershare Limited has pleasure in submitting its report for the financial year ended 30 June 2021.
DIRECTORSThe names of the directors of the Company in office during the whole year and up to the date of this report, unless otherwise indicated, are:
Non-executiveSimon David Jones (Chairman)Abigail Pip ClelandTiffany Lee FullerLisa Mary GayChristopher John MorrisPaul Joseph ReynoldsJoseph Mark Velli
ExecutiveStuart James Irving (President and Chief Executive Officer)
PRINCIPAL ACTIVITIES The principal activities of the Group are outlined in the Group Operating Review set out on pages 23 to 24 and form part of this report.
CONSOLIDATED PROFITThe profit of the consolidated entity for the financial year was $189.2 million after income tax. Net profit attributable to members of the parent entity was $189.0 million, which represents a decrease of 18.8% on the previous year’s result of $232.7 million. Profit of the consolidated entity for the financial year after management adjustment items was $283.7 million after income tax and non-controlling interests. This represents a decrease of 6.6% on the 2020 result of $303.8 million.
Net profit after management adjustment items is determined as follows:
2021$000
2020$000
Net profit attributable to members of the parent entity 188,974 232,657
Management adjustment items (net of tax):
Amortisation
Amortisation of acquisition related intangible assets 42,721 42,597
Acquisitions and disposals
Acquisition related expenses 33,618 15,656
Gain on disposal (9,105) -
Benefits of tax losses not previously recognised on Equatex acquisition - (7,666)
One-off tax expense on Equatex IP restructure - (1,054)
Acquisition accounting adjustments - (1,039)
Other
Major restructuring costs 29,155 19,939
Reversal of provisions (3,240) -
Marked to market adjustments - derivatives 1,613 2,752
Net profit after management adjustment items 283,736 303,842
DIRECTORS’ REPORT

42
Management adjustment itemsManagement results are used, along with other measures, to assess operating business performance. The Group believes that exclusion of certain items permits better analysis of the Group’s performance on a comparative basis and provides a better measure of underlying operating performance. Description of management adjustment items can be found in note 4 of the financial statements.
The non-IFRS financial information contained within this Directors’ Report has not been audited in accordance with the Australian Auditing Standards.
DIVIDENDSThe following dividends of the consolidated entity have been paid or declared since the end of the preceding financial year:
Ordinary sharesA final dividend in respect of the year ended 30 June 2020 was declared on 11 August 2020 and paid on 14 September 2020. This was an ordinary dividend of AU 23 cents per share, franked to 30%, amounting to AUD 124,378,861 ($92,378,204).
An interim dividend was declared on 9 February 2021 and paid on 18 March 2021. This was a fully franked ordinary dividend of AU 23 cents per share, amounting to AUD 124,370,429 ($92,371,942).
A final dividend in respect of the year ended 30 June 2021 was declared by the directors of the Company on 10 August 2021 and paid on 13 September 2021. This was an ordinary dividend of AU 23 cents per share, franked to 60%. As the dividend was not declared until 10 August 2021, a provision was not recognised as at 30 June 2021.
REVIEW OF OPERATIONS The review of operations is outlined in the Group Operating Review set out on pages 23 to 24 and forms part of this report.
SIGNIFICANT EVENTS AND SIGNIFICANT CHANGES IN ACTIVITIESA discussion of significant events and significant changes in activities, if applicable, is included in the Group Operating Review set out on pages 23 to 24 and forms part of this report.
In the opinion of the directors, there were no other significant changes in the affairs of the consolidated entity during the financial year under review that are not otherwise disclosed in this report or the consolidated accounts.
SIGNIFICANT EVENTS AFTER YEAR-ENDNo other matters or circumstances have arisen since the end of the financial year which is not otherwise dealt with in this report or in the consolidated financial statements that have significantly affected or may significantly affect the operations of the consolidated entity, the results of those operations, or the state of affairs of the consolidated entity in subsequent financial years.
LIKELY DEVELOPMENTS AND FUTURE RESULTSA discussion of business strategies and prospects is set out on pages 25 to 27 and forms part of this report.
ENVIRONMENTAL REGULATIONSThe Group is not subject to significant environmental regulation.
INFORMATION ON DIRECTORSThe qualifications, experience and responsibilities of directors together with details of all directorships of other listed companies held by a director in the three years to 30 June 2021 and any contracts to which the director is a party to under which they are entitled to a benefit are outlined in the Corporate Governance Statement and form part of this report.

43 | COMPUTERSHARE | ANNUAL REPORT | 2021
DIRECTORS’ REPORT
Directors’ interestsAt the date of this report, the direct and indirect interests of the directors in the securities of the Company are:
Name
Number of ordinary
shares
Number of performance
rights
Number of share
appreciation rights
SJ Irving 220,025 294,252 367,406
AP Cleland 14,164 - -
TL Fuller 16,148 - -
LM Gay 21,939 - -
SD Jones 51,917 - -
CJ Morris 32,091,083 - -
PJ Reynolds 8,000 - -
JM Velli 17,000 - -
Meetings of directorsThe number of meetings of the Board of Directors (and of Board Committees) and the number of meetings attended by each of the directors during the financial year were:
Directors’Meetings
Risk and Audit Committee Meetings
Nomination CommitteeMeetings
People and Culture Committee
Meetings
A B A B A B A B
SJ Irving 18 18 - - 4 4 - -
AP Cleland 18 18 - - 4 4 12 12
TL Fuller 18 18 8 8 4 4 - -
LM Gay 18 18 8 8 4 4 11 11
SD Jones 18 18 8 8 4 4 12 12
CJ Morris 18 18 - - 4 4 - -
PJ Reynolds 16 18 7 8 4 4 - -
JM Velli 17 18 - - 4 4 9 12
A - Number of meetings attended.
B - Number of meetings held during the time the director held office during the financial year.
The Board forms sub-committees to consider specific transaction opportunities as appropriate.
INFORMATION ON COMPANY SECRETARYThe qualifications, experience and responsibilities of the Company Secretary are outlined in the Corporate Governance Statement and form part of this report.
INDEMNIFICATION OF OFFICERSComputershare’s constitution allows the Company to indemnify, where permitted by law, officers of the Company for liability and legal costs they incur when acting in that capacity. There are similar indemnities in favour of officers of controlled entities. Computershare purchases insurance for amounts that the Company or its controlled entities are liable to pay under these indemnities. The insurance policy also insures Directors, Officers, Company Secretaries and employees (including former Directors and Officers) against certain liabilities (including legal costs) they may incur in carrying out their duties. For this Directors and Officers insurance, we paid premiums of $2,367,960 excluding taxes during FY2021.

44
REMUNERATION REPORTCHAIRS’ LETTER
Dear Shareholders
On behalf of the Board, we are pleased to present Computershare’s Remuneration Report for the year ended 30 June 2021. This report contains detailed information regarding the remuneration arrangements for the directors and senior executives who were Key Management Personnel (KMP) during FY2021 and aims to demonstrate the Company’s link between strategy, performance and reward outcomes.
OVERVIEW OF THE YEARIn FY2021, we have had a full year of impact from Covid-19 on our employees, our customers and our business. Management focused on supporting the physical and mental well-being of our workforce as a top priority, thereby enabling our people to do what was needed of them, both for themselves and their families as well as for our clients and their customers. The Board and our executive team are immensely grateful to our employees for their determination, resilience and ingenuity. Our teams had to find new ways to collaborate, were able to respond to the work from home environment and rapidly deliver digital solutions for customers. There were of course challenges at times with productivity and staff availability, but the strength of the group allowed us to keep delivering for our clients and customers, week in and week out.
Many of the same challenges faced in FY2020 continued to impact through FY2021. Global interest rates remained at historically low levels, resulting in margin income almost halving in the year, whilst pandemic related support measures and restrictions impacted revenues in Mortgage Services and Business Services. Notwithstanding these headwinds, our financial results and returns to shareholders in FY2021 reflect the diversity and strength of our businesses and our ability to support our clients and adapt to a rapidly changing external environment. In FY2021, management revenue excluding margin income was up 3.6% and management EBIT ex MI was up 12.6% compared to FY2020 which meant that our second half was effectively the best operating result (excluding margin income) in the company’s history. This strength enabled us to deliver on the upgraded guidance we provided in February.
We are proud of the investment we’ve made in digital learning, meaning that all our staff, regardless of their location, can access thousands of online courses on demand, in a variety of languages. To further enable usage of this, we’ve equipped staff in South Africa with rechargeable inverters to help them stay online despite local power outages. Globally, we’ve maintained a keen focus on mental health, holding several webinars with expert speakers, running regular meditation sessions and offering a variety of support to staff who need it. We’ve also increased our Diversity & Inclusion footprint with several new employee resource groups, including a Black Leadership Group and Purple Pride, a group focused on LGBTQ+ issues. We also continue to deliver on our commitment to making Computershare a better place to work for all our employees and providing equal opportunities for everyone, regardless of gender, ethnicity, sexual orientation or age.
We look forward to welcoming more than 2,000 new employees from Wells Fargo to our new business, Computershare Corporate Trust (CCT). Integrating this new division is one of our main priorities for the year ahead.
OUTCOMES FOR FY2021 In FY2021, Stuart Irving and his team successfully led the organisation through the challenging market and business operating conditions associated with the pandemic. They managed to maintain employee engagement through a predominantly remote working environment, and client satisfaction levels remained strong.
As an ASX listed truly global business, with senior management located around the world, maintaining a remuneration framework that meets the expectations of all our stakeholders in all regions, is a challenge. The Board is mindful of the external focus on overall remuneration levels and actively seeks feedback from external stakeholders on the design of the reward structure for the CEO and Executive KMP.
The Board set robust and challenging performance metrics for our FY2021 Short-Term Incentive (STI) plan that were focused on the things that management could control to maximise shareholder value as we faced a year of Covid-19 uncertainty and consequently set robust challenging targets.
While headwinds have continued to constrain our bottom line, our underlying businesses’ performance was strong and we are pleased to report that the majority of our performance measures were achieved above target, including our budgeted EBITDA on a constant currency basis and our EBIT (excluding margin income). This resulted in STI payments for KMP being awarded at between 65% and 75% of maximum. These outcomes are reflective of the resilience in the underlying business and the solid achievements delivered by the management team.

45 | COMPUTERSHARE | ANNUAL REPORT | 2021
DIRECTORS’ REPORT
The FY2019 Long-Term Incentive (LTI) grant that was tested as at 30 June 2021 did not vest. As foreshadowed last year, this grant was materially impacted by global interest rates cuts at the start of the pandemic and the corresponding reduction in margin income that has occurred since then.
In FY2021, the Human Resources and Remuneration Committee was renamed the People and Culture Committee (PACC) in keeping with its evolution and a broadened remit, reflecting its breadth of focus across the entire employee life-cycle at Computershare. The Committee takes an active view of remuneration, performance, talent and succession, culture and inclusion and diversity.
Reflecting on FY2021, the Board feels immense pride in the commitment and hard work demonstrated by our team members in serving our customers during extremely challenging times. As a Board, we aim to live up to the high standards expected of our team and have attempted to strike the right balance in the design and outcomes of KMP reward in what has been a complex and challenging year.
We look forward to continuing conversations with our stakeholders; we welcome your feedback to ensure this report continues to meet the standards and expectations you have of our unique organisation.
With regards
SD Jones Chair – Board
LM Gay Chair – PACC

46
CONTENTS
1. Remuneration Snapshot 1.1 Key Management Personnel 1.2 CPU performance and KMP outcomes in FY2021 1.3 KMP realised pay in FY20212. Remuneration strategy 2.1 Remuneration and governance framework 2.2 Remuneration structure 2.3 KMP remuneration mix 2.4 FY2021 changes to incentive plans 2.5 Short-term incentive plan 2.6 Long-term incentive plan 2.7 Other remuneration
3. KMP remuneration outcomes 3.1 Relationship between remuneration and Group’s performance 3.2 FY2021 STI outcomes 3.3 FY2021 LTI outcomes4. Non-executive directors5. KMP contractual arrangements6. Proposed changes to FY2022 LTI plan design7. Statutory remuneration disclosures 7.1 Remuneration of directors and other KMP 7.2 Short-term salary and fees, cash profit share and bonuses,
long-term other, post-employment benefits 7.3 Other
This report is prepared in accordance with section 300A of the Corporations Act 2001 (Cth) (Corporations Act) for Computershare for the year ended 30 June 2021. The information provided in this Remuneration Report has been audited as required by section 308(3C) of the Corporations Act, apart from where it is indicated that the information is unaudited.
1. REMUNERATION SNAPSHOT
1.1 KEY MANAGEMENT PERSONNEL (KMP) Computershare’s KMP comprise the Directors of the company and select senior executives who have the authority and responsibility for planning, directing and controlling the activities of the company directly or indirectly. All KMP are assessed each year. Each KMP listed below held their position for all of FY2021.
Non-executive director Executive KMP
Abigail P Cleland Stuart J Irving President and Chief Executive Officer
Tiffany L Fuller Nick Oldfield Chief Financial Officer
Lisa M Gay Mark L McDougall Global Chief Information Officer
Simon D Jones Naz Sarkar Global Head of Issuer Services
Chris J Morris
Paul J Reynolds
Joseph M Velli
1.2 CPU PERFORMANCE AND KMP OUTCOMES IN FY2021 Over the FY2021 period, shareholders have enjoyed an approximately 25% share price increase between 1 July 2020 and 30 June 2021. Whilst the financial performance was hindered by reduction in margin income, pleasingly the group delivered 12.6% EBIT excluding margin income (ex MI) growth demonstrating the underlying resilience and growth of the operating businesses. We continued to use our strong operating cashflows to continue to invest in our business and to support our shareholders, maintaining our interim and final dividends at 23 cents. The performance of the Group is reflected in the KMP outcomes for FY2021.

47 | COMPUTERSHARE | ANNUAL REPORT | 2021
DIRECTORS’ REPORT
Fixed Remuneration Short-Term Incentive Long-Term Incentive
There were no general Fixed Remuneration increases to KMP in FY2021. The increases given below were in relation to change in role or end in assignment.
Naz Sarkar’s expat arrangement ended on 17 November 2020. Separately, his remuneration was benchmarked against the relevant local market in the UK. To remain competitive with the external market as the head of our largest business unit, he received an increase of 33% to his base salary effective 1 July 2020.
Nick Oldfield was appointed to the role of Chief Financial Officer (CFO) effective 1 January 2020. At the time of his appointment, no changes were made to his salary. In FY2021, a review was conducted to benchmark his overall remuneration against CFO roles based in the USA. On that basis, his target STI opportunity was changed from being 19% of his total remuneration to 25% of his total remuneration, which represents a 7.6% increase to his total remuneration. No changes were made to his base salary or LTI quantum. Mr Oldfield also retained his duties as Global Head of Mortgage Services during the financial year.
FY2021 STI outcomes of between 65% and 75% of maximum entitlement for executive KMP.
Strong underlying business performance exceeded expectations set at the start of the year. Executive KMP FY2021 STI objectives included EBITDA relative to budget on constant currency basis and growth in EBIT ex MI, which exceeded expectations.
EBIT ex MI simply removes the impact of the interest rate environment and shows the underlying operating growth of the business. It is the most appropriate measure of executive performance as it reflects the earnings generated by and directly controlled by management, after accounting for all relevant expenditure including depreciation of capital items and amortisation of Mortgage Servicing Rights.
FY2019 LTI vested to nil outcome.
The FY2019 LTI plan was tested on 30 June 2021. 50% of the plan was measured against relative Total Shareholder Return (rTSR), and 50% was measured against an EPS growth measure.
The threshold TSR hurdle is a relative TSR (rTSR) percentile ranking of 50% as against the ASX100. A TSR ranking of 31st percentile meant there was no vesting associated with this measure.
An average annual management EPS growth of 5% is needed over the three-year performance period as a threshold. With an average management EPS growth of -5.7%, there was no vesting associated with this measure.
The 3-year EPS performance was significantly impacted by the reduction in global interest rates in response to Covid-19. This reduction in margin income also flowed through to the three-year TSR results.
1.3 KMP REALISED PAY IN FY2021 (UNAUDITED)The table below details actual pay and benefits for KMPs who were employed as at 30 June 2021. This table aims to assist shareholders in understanding the cash and other benefits actually received by KMPs from the various components of their remuneration during FY2021.
As a general principle, Australian Accounting Standards require the value of share-based payments to be calculated at the time of grant and accrued over the performance period and restriction period. The Corporations Act 2001 and Australian Accounting Standards also require that pay and benefits be disclosed for the period that a person is a KMP. This may not reflect what executive KMPs actually received or became entitled to during FY2021. The figures in this table have not been prepared in accordance with Australian Accounting Standards. They provide additional voluntary disclosures.
The treatment of the remuneration elements in this disclosure are as follows:
> Fixed remuneration earned between 1 July 2020 and 30 June 2021. This includes superannuation.
> STI payable as cash and equity under the FY2021 STI plan (which is paid in FY2022 after audited results), and no LTI vested this year as a result of performance across the performance period that ended 30 June 2021.
> Benefits received between 1 July 2020 and 30 June 2021.
The table below also does not include expatriate costs and associated tax equalisation payments. Whilst these are clearly disclosed in the statutory remuneration table, the Board does not believe that they represent actual remuneration to the relevant executive and have therefore been excluded in this table. The difference in the STI outcomes in FY2020 and FY2021 is due to a combination of the initial impact of Covid-19 on management EPS in FY2020, and the business recovery during FY2021 through the strong growth in EBIT ex MI.
FY2021 actual package details FY2021 actual vs max FY2021 vs FY2020 actual
EmployeeFY2021 fixed
(base + benefits)
FY2021 actual
total STI FY2019 LTI
vesting in FY21
FY2021 actual total
remuneration (base + STI+ LTI)
FY2021 actual vs max STI
FY2021 actual vs max total
remuneration (base + max
STI + LTI)
FY2021 vs FY2020 actual
STI received
FY2021 vs FY2020 actual total
remuneration (base + STI +
FY18 LTI)
Stuart Irving 1,400,284 1,316,820 - 2,717,104 75% 52% 138% 116%
Nick Oldfield 827,777 489,001 - 1,316,778 67% 58% 203% 124%
Naz Sarkar 1,005,229 477,034 - 1,482,263 71% 59% 261% 161%
Mark McDougall 514,426 244,013 - 758,439 66% 57% 166% 115%
1 For SJ Irving and N Oldfield, the maximum STI award is set at 150% of target whereas the maximum award for other KMPs is 175% of target.
2 The non-IFRS information included in the table above has not been subject to audit.

48
2. REMUNERATION STRATEGY
2.1 REMUNERATION AND GOVERNANCE FRAMEWORKComputershare is a global company with more than 90% of revenue generated and workforce located outside Australia. We hire talent in 20 highly competitive markets, and we compete for this talent across various industry sectors, including financial services and technology. Therefore, our remuneration practices need to be competitive and flexible to attract, motivate and retain a talented workforce across all of our markets.
The main aim of our executive incentive strategy and structure is to ensure that executives are rewarded appropriately when they deliver positive outcomes to our shareholders. In considering remuneration changes, the PACC ensures all executive pay decisions are based on the following four principles:
> Fairness – ongoing remuneration plan design must motivate and stretch our executives to focus on the right outcomes for our business and to reward what those executives can influence.
> Alignment – incentive plan design and outcome should align to shareholder experience and company recovery in a meaningful way while also being mindful of the general employee experience. Plan measures should drive sustained, long-term organisational growth and success.
> Simplicity – where possible, plan design should be simple to explain and execute. It should strike the right balance between fixed and at-risk pay.
> Risk management – Board discretion or plan amendments must be applied on a robust basis, ensuring no windfall gains occur to participants. Due consideration should be given to business and operational risk and the Group’s values and culture through plan design such as clawback and malus.
The Board (through the PACC) reviews our remuneration framework regularly to ensure it remains aligned to business objectives. The Committee uses a range of inputs when assessing the performance of outcomes for Executive KMP, taking into account results and also how those results were achieved. Detailed individual performance assessments, measurement against targeted financial results, external remuneration benchmarking and an overarching view to the organisation’s values and risk profile are all taken into account.
BOARD
Sets and oversees the People and Culture Committee mandate. The Board is responsible for setting remuneration policy and determining non-executive director and executive KMP remuneration. In addition, the Board is responsible for approving all targets and performance conditions set under the KMP incentive plans. The Board delegates responsibility to the People and Culture Committee for reviewing and making recommendations to the Board on these matters.
PEOPLE AND CULTURE COMMITTEE
The Committee uses a range of inputs when assessing performance and outcomes of KMP, taking into account results and also how those results were achieved. Detailed performance assessments, financial results, external remuneration benchmarking, and an overarching view to our organisation’s values and risk profile are all taken into account.
MANAGEMENT
Provide management information on financial, customer and risk matters which may impact remuneration. Where appropriate, the CEO attends Committee meetings; however, he does not participate in formal decision making or in discussions involving his own remuneration.
EXTERNAL ADVISORS
The Committee may seek and consider advice from independent remuneration consultants where appropriate. Any advice from consultants is used to guide the Committee and the Board but does not serve as a substitute for thorough consideration by non-executive directors. Protocols are in place for the independent engagement of remuneration consultants. During FY2021, consultants provided benchmark data only to the Committee. No remuneration recommendations relating to KMP were provided.

49 | COMPUTERSHARE | ANNUAL REPORT | 2021
DIRECTORS’ REPORT
2.2 REMUNERATION STRUCTUREThe remuneration structure for the executive KMP comprises fixed remuneration (FR) and variable at-risk remuneration consisting of a Short-Term Incentive (STI) and Long-Term Incentive (LTI). Total remuneration is set at a competitive level to attract, retain and motivate key talent required to successfully operate a complex global organisation.
Attract, motivate and retain highly skilled employees
Designed to be competitive in the market where the executive is located
Reviewed annually and reflects technical and functional expertise, role scope, market practice.
Reflects performance across the year and is designed to reward management for achieving financial targets, delivering on strategic objectives and managing the business in a sustainable manner while demonstrating our values.
Align executive reward outcomes to long-term sustainable shareholder value creation.
FRFixed
remuneration
STIShort-term incentive
(at risk)
LTILong-term incentive
(at risk)
Performance based
Cash Equity
FR comprises salary and other benefits (including statutory superannuation). It is benchmarked to our external peers and is based on: role and responsibility; business and individual performance; internal and external relativities; and contribution, competencies and capabilities. As a unique, diversified and truly international business, it is important for CPU to benchmark KMP salaries against both ASX but also international peers to ensure we remain competitive in the global talent pool within which we operate.
50% of the STI assessment is paid out in cash.
50% of the STI assessment is paid in restricted shares deferred for two years.
The LTI aligns executives to overall company performance through two equally weighted measures focused on strategic business drivers and long-term shareholder return. For FY2021, on a transitional basis, this comprises of:
Relative Total Shareholder Return (rTSR).
Share Appreciation Rights.
STI outcome based on business performance (measured via financial and strategic non-financial objectives) and individual performance (measured via financial, strategic and values-based objectives).
Subject to malus, clawback and forfeiture in circumstances outlined in section 2.5.

50
2.3 KMP REMUNERATION MIXA significant component of executive remuneration is linked to short and long-term Company performance to assist in aligning executive interests with those of shareholders. Executive remuneration is set with reference to the market median, using the ASX 25 – ASX 75 and comparable international peers from global markets. With three of our four KMPs based outside Australia, the People and Culture Committee (PACC) are cognisant of significant differences in the remuneration structure for key executives across geographies. In particular, for the US market, incentives are more leveraged, LTI hurdles tend to have lower vesting thresholds, and up to half of the LTI plan tends to be offered in the form of restricted equity. As such, the PACC continue to review the appropriateness of our remuneration structure to ensure it balances ASX market practices with those of large multinational organisations based in the US and UK.
CEO & CFO PAY MIX
CEO (TARGET)
30% 12.5% 12.5% 45%
CEO (MAXIMUM)
27% 16.5% 16.5% 40%
CFO (TARGET)
41% 12% 12% 35%
CFO (MAXIMUM)
36% 16.5% 16.5% 31%
OTHER KMPS PAY MIX
OTHER KMPS (TARGET)
44% 9% 9% 38%
OTHER KMPS (MAXIMUM)
38% 12.5% 16.5% 33%
Base pay STI cash STI shares LTI (FY21 LTI grant value)
2.4 FY2021 CHANGES TO INCENTIVE PLANSIn keeping with the reward principles noted in the Chair’s letter, the Board is committed to an incentive plan design that operates so that targets set at the start of the year remain achievable yet challenging throughout. This is an important consideration to ensure that the incentive plans motivate and reward our KMPs to deliver sustainable and positive outcomes for the business.
A substantial part of Computershare’s earnings is derived from margin income (income generated by Computershare from holding money on behalf of clients). The response of central banks to the emerging pandemic in early March 2020, setting interest rates to historic lows, resulted in an immediate and material impact on our margin income. This historically low interest rate environment remained in place throughout FY2021.
Up to FY2020, growth in EPS was part of both the STI and LTI plans. For the Board, it was important to ensure that the incentive plans in FY2021 continued to motivate our KMPs and remain aligned with the shareholder experience.
Therefore, the incentive plans in FY2021 were amended as follows:
FY2021 STI plan – For the CEO and the CFO, the EPS component of the STI plan was replaced with strategic financial measures. These measures are strongly tied to company performance – their successful delivery underpins the achievement of Computershare’s business strategy. Section 3.2 of this report details these measures, their assessment and associated outcomes for the CEO. For the remaining two executive KMPs, the EPS component was replaced with growth in management EBIT ex MI. Through this measure, management are expected to demonstrate growth in the underlying business to the benefit of shareholders. Further details of this plan, including hurdles, are in section 2.5. These plan changes will continue in FY2022 and beyond.
FY2021 LTI plan – A transitional LTI plan was established to allow the Board to conduct a comprehensive review of the LTI plan for FY2022 and beyond. For FY2021, one half of the plan continued to be in the form of rTSR rights, and the other half was in the form of Share Appreciation Rights (SARs). SARs were included in the plan to align KMP performance to a meaningful recovery in Computershare’s share price, which, during the pandemic, should occur through strong financial and business management. Further details of this plan are in section 2.6. As previously stated, this plan design will not continue beyond FY2021.

51 | COMPUTERSHARE | ANNUAL REPORT | 2021
DIRECTORS’ REPORT
As it was intended that the FY2021 LTI plan would be an interim plan, the Board undertook a comprehensive review of the LTI plan for FY2022 and beyond. The FY2022 LTI plan design is underpinned by the reward principles noted in the Chair’s letter and is built upon challenging hurdles that together align the shareholder objectives with effective management performance. Details are set out in section 6 of this report and also in the Notice of Meeting for Computershare’s 2021 AGM.
It is important to note that margin income continues to remain an important source of Computershare’s revenue. It remains an important driver of remuneration outcomes across both the LTI plan and the STI plan and the new measures chosen across the two incentive plans highlight management’s responsibility in setting and executing strategy for the underlying business that drives both growth and profitability.
2.5 SHORT-TERM INCENTIVE PLAN
CEO & CFO Other Executive KMP
What is the opportunity?
For ‘at target’ performance, the CEO has the opportunity to receive 25% of Total Remuneration and the CFO has the opportunity to receive 24.5%. The minimum STI outcome is 0% (if targets are not met) and maximum is capped at 150% of target opportunity.
For ‘at target’ performance, Executive KMPs have the opportunity to receive 18.75% of Total Remuneration.
The minimum STI outcome is 0% (if targets are not met), and maximum is capped at 175% of target opportunity.
What are the performance hurdles?
Budgeted EBITDA (25%)
Strategic Financial Objectives (50%)
Non-Financial Objectives (25%)
Budgeted EBITDA (35%)
Growth in EBIT ex MI (25%)
Strategic Objectives (15%)
Non-Financial Objectives (25%)
How is the STI paid? 50% in cash, and 50% is deferred into restricted shares held in deferral for two years following the performance year.
50% of the STI assessment is paid in cash and the remaining 50% delivered in deferred shares (assuming ‘on target’ performance), with measures aligned to each component.
Treatment of deferred shares
The deferred shares are subject to service conditions, qualifying leaver provisions and participate in dividends and/or distributions paid during the restricted period. The number of deferred shares allocated is determined by dividing the amount to be deferred by the closing share price on the first trading day following the release of annual results.
What is the performance period?
The performance period for the FY2021 STI plan was 1 July 2020 to 30 June 2021.
How are STI payments determined?
STI is assessed at the end of the financial year on the following basis:
Budgeted EBITDA – At threshold achievement (90% of budget), 75% of STI associated with the measure is paid out. Budget achievement results in 100% payout and stretch achievement (120% of budget) pays out 150%. Straight-line vesting occurs between threshold, target and stretch.
Growth in EBIT ex MI – For FY2021, the Board set a scale whereby growth of 0% to 10% paid out linearly between 0% to 100% STI associated with that measure. Above this level of growth, there is stretch in the STI plan such that for the CEO and CFO, there is a maximum payout of 150% associated with this measure and, for the remaining KMPs, a maximum payout of 200%.
Strategic Financial Objectives – A set of goals at the outset of the year that underpin the strategic agenda for the year are selected by the Board for the CEO. The CEO does the same for the remaining KMPs. Assessment at the end of the financial year against set criteria results in payout between 0% and 150%. The FY2021 criteria and its assessment is listed in detail for the CEO in section 3.2.
Non-Financial Objectives – A set of non-financial objectives relating to customer, culture, risk management and other metrics relevant for the year (such as management of Covid-19, Mergers & Acquisitions (M&A) and capital management) are established by the Board for the CEO at the start of the financial year. The CEO does the same for the remaining KMPs. The FY2021 objectives and their assessment is listed in detail for the CEO in section 3.2. There is stretch in the STI plan such that for the CEO and CFO, there is a maximum payout of 150% associated with these objectives and, for the remaining KMPs, a maximum payout of 200%.
When do the deferred shares vest?
Vesting occurs on the second anniversary of the grant date of the deferred equity and prior to vesting is held subject to ongoing employment or qualifying leaver provisions.
Other key features The Board has the discretion to determine award outcomes for executives in certain circumstances such as cessation of employment or a change of control, and also to cash settle awards on vesting if local regulations or practices make it appropriate to do so.

52
2.6 LONG-TERM INCENTIVE PLANA transitional LTI plan was established in FY2021 as a specific response to the uncertain environment in the early stages of the pandemic comprising 50% SARs and 50% performance rights. This plan design will not continue for FY2022 and beyond.
SARs are a right to be allocated a number of shares upon vesting. The number of shares to be allocated is determined by the difference in share price between the start and end price. If SARs vest, shares are allocated to the participant to the requisite value with nothing payable by the participant. For FY2021, SARs were determined by the Board to be the most shareholder-aligned instrument to drive management’s focus over the performance period on recovery and growth.
Who participates? The CEO, CFO and other senior executives who are identified as being particularly important to the longer-term future of Computershare.
What type of awards are granted?
The FY2021 LTI award comprised a grant of two equally weighted instruments: performance rights and SARs that vest subject to testing against applicable performance hurdles.
A Performance Right is a right to receive a share, subject to meeting conditions noted below.
A SAR is a right to a payment (in shares) calculated based on the increase in share price across the performance period.
How is the size of any award calculated?
In FY2021, the CEO received an LTI award equal to 45% of his total remuneration package. For other KMPs, the value of their LTI award was in a range of 35% to 38% of their total remuneration package.
How is the number of rights to be awarded calculated?
Performance Rights – the number of performance rights awarded was calculated by dividing one half of the FY2021 LTI opportunity by the volume-weighted average price of Computershare shares over the five trading days following the release of the Company’s FY2020 results on 12 August 2020.
SARs – the number of SARs awarded was calculated by dividing one half of the FY2021 LTI opportunity by the fair value of SARs (as determined by the Black Scholes pricing model based on the share price at close on 30 June 2020). Due to the nature of SARs, a face value methodology cannot be used in determining their value. Therefore, it was necessary to deploy a fair value calculation in determining their quantum.
What is the performance period?
The FY2021 LTI plan will be tested over the period 1 July 2020 to 30 June 2023. There is no further exercise period for SARs, as any SARs that vest will automatically be exercised once tested.
What are the performance hurdles?
Performance rights The percentage of performance rights that vest, if any, will be determined by the Board with reference to the percentile ranking achieved by the Company over the period, compared to the other entities in the comparator group, as follows:
Relative TSR ranking against peer groupPerformance Rights that vest (% of opportunity tied to Performance Rights)
Below the 50th percentile 0%
Equal to the 50th percentile 50%
Between the 50th to 75th percentile Progressive pro-rata vesting between 50% to 100% (ie on a straight-line basis)
At or above the 75th percentile 100%
SARsThe vesting of SARs, if any, will be determined by the Board with reference to the difference between $13.25, being the share price at close on 30 June 2020 (strike price) and the share price at the end of the Period, being the 90-day volume weighted average price (VWAP) up to and including 30 June 2023. Management only receive the difference between the Strike Price and the 90-day VWAP as at 30 June 2023, in the form of equity.
Other key features The Board has the discretion to determine award outcomes for executives in certain circumstances such as cessation of employment or a change of control, and also to cash settle awards on vesting if local regulations or practices make it appropriate to do so.
The LTI plan also includes both malus and clawback mechanisms that may be triggered in certain circumstances, which include fraud, dishonesty or material misstatement of financial statements.
As at the date of this report, there are 1.1 million performance rights and 1.5 million SARs outstanding under the LTI plan. These include 0.4 million performance rights and 1.5 million SARs that were granted to eligible executives in the financial year 2021 and which remain on issue. These rights are due to vest in September 2023 (subject to performance against hurdles).

53 | COMPUTERSHARE | ANNUAL REPORT | 2021
DIRECTORS’ REPORT
2.7 OTHER REMUNERATIONLike all our employees, KMP can participate in the Group’s general employee share plans. An overview of these plans is disclosed in note 40a of the financial statements.
3. KMP REMUNERATION OUTCOMES
3.1 RELATIONSHIP BETWEEN REMUNERATION AND GROUP’S PERFORMANCEOne of the key principles of Computershare’s remuneration strategy is to ensure that there is a clear and transparent link between the remuneration outcomes for executives and Group performance and its consequent impact on shareholder interests. The following table highlights some of the key financial results for Computershare over the period from the financial year 2017 to the financial year 2021, with the corresponding average STI outcomes for executive KMP over the same period.
2017 2018 2019 2020 2021
Management adjusted EBITDA (USD million) 540.8 622.6 674.9 646.4 628.2
Management adjusted EBIT ex MI (USD million) 345.4 375.1 343.6 298.7 339.1
Statutory EPS (US cents)1 48.76 55.17 76.57 42.55 33.77
Management EPS (US cents)1 54.41 63.38 70.24 55.57 50.71
Management EPS (US cents) – constant currency2 55.58 62.55 71.08 56.20 50.71
Total dividend (AU cents per share) 36 40 44 46 46
Share price as at 30 June (AUD) 14.14 18.43 16.21 13.25 16.90
Average STI received as % of maximum opportunity for executive KMP (%) 56.8 77.4 71.1 47.3 69.5
1 Earnings per share is restated by adjusting the weighted average number of ordinary shares to incorporate the bonus element in the 2021 rights issue.
2 Translated at FY2021 average exchange rates. Excluding the adjustment for the bonus element of the rights issue, management EPS in constant currency was 52.46 cents (2020: 56.76 cents).

54
Computershare’s incentive plans measure performance against a range of financial and non-financial performance. As demonstrated below, there is a strong overall alignment between Computershare’s incentive plan outcomes to financial performance. It is evident from the graphs that the shareholder experience to date correlates strongly with the EBIT ex MI outcomes that speak to the Group’s underlying operating performance. This correlation strongly supports the inclusion of EBIT ex MI as an STI measure, thereby, strengthening the link between KMP reward outcomes and shareholder value delivered.
CEO STI PAYOUT CORRELATION TO COMPUTERSHARE PERFORMANCE
Earnings per Share Share price
0%
10%
20%
30%
40%
50%
60%
70%
80%
90%
100%
0
10
20
30
40
50
60
70
80
FY17 FY18 FY19 FY20 FY21
Management EPS (cps)
% maximum CEO STI paid
0%
10%
20%
30%
40%
50%
60%
70%
80%
90%
100%
0
2
4
6
8
10
12
14
16
18
20
FY17 FY18 FY19 FY20 FY21
Closing Share Price ($)
% maximum CEO STI paid
EBITDA EBIT ex MI
0%
10%
20%
30%
40%
50%
60%
70%
80%
90%
100%
0
100
200
300
400
500
600
700
800
FY17 FY18 FY19 FY20 FY21
EBITDA achievement ($m)
% maximum CEO STI paid
0%
10%
20%
30%
40%
50%
60%
70%
80%
90%
100%
0
50
100
150
200
250
300
350
400
FY17 FY18 FY19 FY20 FY21
EBIT ex MI achievement ($m)
% maximum CEO STI paid

55 | COMPUTERSHARE | ANNUAL REPORT | 2021
DIRECTORS’ REPORT
3.2 FY2021 STI OUTCOMES The table below shows the STI paid or payable to each Computershare executive who is identified as KMP for entitlements referable to performance in the financial year ended 30 June 2021. The table sets out the actual amounts awarded as STI and how they relate to the maximum entitlement for each executive.
ExecutiveSTI awarded
(USD)
STI as percentage
of maximumBudgeted EBITDA*
Growth in group EBIT
ex MIStrategic
Objectives
Non-Financial
Objectives
SJ Irving 1,316,820 75%
ML McDougall 244,013 66%
N Oldfield** 489,001 67%
N Sarkar* 477,034 71%
At or above target Between threshold and target Below threshold
* N Sarkar is measured on global Issuer Services budgeted EBITDA, remaining executives on Group EBITDA.
** The outcome for Nick Oldfield’s strategic objectives reflect the results of the Mortgage Servicing Business, which he heads, in addition to being the CFO.
For the CEO and CFO, the maximum STI award is set at 150% of target, whereas the maximum award for other executives is in aggregate 175% of target.
In FY2021, the Board’s assessment of the CEO’s performance against his STI objectives was as follows:
Financial objectives Weighting
Group management EBITDA performance against budget in constant currency
Actual EBITDA exceeded budget by 3.7%.
25% Above target
Strategic objectives 50%
Issuer Services - Drive revenue growth across the 5 key service areas through the delivery of the 3 key priorities, namely,
a. Continue momentum with client registry wins
b. Expand and cross sell registered agent services
c. Extend entity management capability
Increase in revenue by 16% and in earnings by 6%. Margin income was 4% down from budget expectations, mainly driven by rate reductions. Registered Agent key metric of ‘Units (entities registered in a state) Under Management’ has grown 12% during the year through underlying resilience of the book and new client wins.
10% Above target
Plans - Drive revenue improvement through the delivery of three targeted strategies
a. New client wins
b. EquatePlus platform upgrade
c. Trading volume recovery
Increase in revenues by 11% and in earnings by 24%.
96% of active EMEA clients have been upgraded with remaining clients scheduled for November 21 Upgrade. Australia upgrades have commenced. Over 3million participants now active on the platform.
Transactional Revenue continued to recover through FY21. It was up over 15% on pcp. At 1H21 trading revenues were down 7.4% on pcp. Strong second half performance resulted in Trading volumes exceeding pre pandemic levels
10% Above target

56
Strategic objectives
US and UK Mortgage Services – Drive revenue growth across the business through two key strategies:
a. Growth in US Capital Light revenues
b. Expansion of recapture capabilities
US CLS – Profitability materially impacted by challenging operating environment. Increased amortisation expense and the headwinds created by the ongoing foreclosure moratorium offset partially by MSR sale transaction gains.
UK CLS – In FY2020, the Cost Out Program was set a target of removing £85.4m of costs from CLS UK over a period of three years. After two years, the program has delivered 94% of its target with £80.1m captured (exceeding the target by £2.3m for FY2020 and FY2021 combined).
10% Below target
Achievement of targeted cost out programs including:
a. CLS UK cost out program
b. Equatex synergies
c. Stage 1, 2 and 3 budgeted cost out
10% Above target
Growth in EBIT ex MI (target 10%)
12.6% growth achieved
10% Above target
Non-financial objectives 25%
Customer Satisfaction as measured by surveys and NPS scores
While industry customer surveys in key markets still show CPU as the highest performer, and NPS surveys show that scores are at extremely high levels, the level of SLA breaches has increased in a work from home environment. This has been caused by staff attrition in various areas but particularly call centres, due in large part to competitive labour markets. Steps have been taken to remedy this, and the early signs are promising.
4% Below target
People and Culture
Progress towards Diversity objectives and Diversity Programs approved by the Board. Communication around Covid-19 with staff and the initiatives to deal with mental health and other issues were well based. Reactions from town hall meetings were positive. Staff engagement scores reflected the positive sentiment over the broad-based support given at the peak of the pandemic.
6% Above target
Risk Management
Continuous improvement in the risk and internal audit functions was noted, and there was a meaningful reduction in the number of recommendations outstanding.
5% At target
Capital and M&A Management
Wells Fargo acquisition signed at good valuation and with solid returns. Process supervised very effectively. This acquisition is fundamental to the long-term success of the business.
5% Above target
Innovation as measured by evidence of new product innovation
A meaningful pipeline of new products has been delivered, highlighted by the replacement of Lumi software.
5% At target
Percentage of maximum achieved 75.2% of maximum
3.3 FY2021 LTI OUTCOMES LTI awards that were granted in FY2019 were tested against the performance hurdles over the period 1 July 2018 to 30 June 2021.
For performance rights subject to the TSR performance hurdle, Computershare achieved negative TSR of -4.02% across the period and a relative TSR ranking against the peer group of 31st percentile, which is below the threshold of 50th percentile of ASX100. Accordingly, the LTI awards subject to the TSR performance test did not vest.
For performance rights subject to the EPS performance hurdle, average annual growth in management EPS on a constant currency basis over the performance period was -5.7% and, accordingly, the LTI awards subject to the EPS performance test did not vest.

57 | COMPUTERSHARE | ANNUAL REPORT | 2021
DIRECTORS’ REPORT
4. NON-EXECUTIVE DIRECTORSComputershare’s total non-executive directors’ fee pool has a limit of AU $2.0 million. This limit was approved by shareholders in November 2014.
Fees payable to non-executive directors in FY2021 are set out in the table below (in AUD).
Chairman’s Fee NED
Chair Risk and Audit
Committee
Chair PACC and Remuneration
Committee
Member Risk and Audit
Committee
Member PACC and
Remuneration Committee
FY2021 335,000 160,000 75,000 25,000 25,000 10,000
These fees are inclusive of statutory superannuation where applicable. JM Velli and PJ Reynolds receive their director fees in their local currency. The exchange rate is set by reference to when they were first appointed as a director of Computershare. No bonuses, either short or long-term, are paid to non-executive directors. They are not provided with retirement benefits.
5. KMP CONTRACTUAL ARRANGEMENTSOn appointment to the Board, all non-executive directors sign a formal appointment letter which includes details of their director fees. Non-executive directors do not have notice periods and are not entitled to receive termination payments.
Except for the Group CEO, no director may be in office for longer than three years without facing re-election. Please refer to Section 2 of the Corporate Governance Statement for further information on the Company’s re-election process.
Neither the Group CEO nor other executive KMP are employed under fixed-term arrangements with Computershare. Their notice periods are based on contractual provisions and local laws (e.g., for the Group CEO and CFO and for those executives based in Australia, this is 30 days’ notice).
On termination of employment, KMP are entitled to statutory entitlements in their respective jurisdictions of employment. The Deferred Short-Term Incentive (DSTI) plan provides for full vesting on redundancy or termination by the Group other than for cause. Under the LTI plan, subject to Board discretion otherwise, performance rights for ‘good leavers’ will not vest on cessation of employment, but instead, a pro-rata proportion will be eligible to be retained by the executive and will be subject to vesting at the end of the original performance period based on satisfaction of the applicable performance measures. Otherwise, subject in some instances to local requirements in the jurisdictions where the Group operates, none of these executives would receive special termination payments should they cease employment for any reason.
6. PROPOSED CHANGES TO FY2022 LTI PLAN DESIGN As previously noted, the structure of the FY2021 LTI was a “one off” structure adopted as we faced the uncertainties of Covid-19. The Board has spent some time considering the best performance measures and weightings for those measures for the FY2022 LTI grant over the next 3 years.
While further details will be provided in the Notice of Meeting, the design of the FY2022 LTI plan focuses on the importance of measuring ‘whole of company performance’. Each of the metrics proposed complement each other in driving long-term value creation while collectively reflecting the reward principles noted in the Chair’s letter to this report.
The FY2022 LTI plan will continue to be measured over three years and will be granted in the form of performance rights. The plan will consist of three measures:
Relative Total Shareholder Return (40%) will continue to remain an important metric within Computershare’s LTI plan as an indicator of the relative experience of our shareholders against those of our chosen peer group – the ASX100.
Average management EPS ex MI (30%) growth over three years – this measure requires management to deliver growth in the underlying business to the benefit of shareholders without relying on interest rate increases over the next 3 years. EPS ex MI highlights the results directly driven from management’s actions in setting and executing strategy for the underlying business. Vesting of 50% of this part of the LTI commences at 5% per annum average growth over the 3 years of the LTI and will increase on a straight line basis to full vesting of this part of the LTI at 10% per annum average growth over the performance period.
This vesting scale is slightly lower than the FY2019 LTI EPS measure inclusive of margin income, which had a vesting scale of 5%-12%. This scale was set at a time when interest rates were anticipated to rise. Given interest rates are currently at historic lows, it is likely that markets are currently at the bottom of the interest rate cycle and, when setting an EPS ex MI target, the Board had regard to the fact that it represented a challenging growth target for the underlying business that is more directly under control of management and without the benefit of increases in margin income that may arise from any interest rate increases that eventuate over the performance period.
While management EPS will exclude margin income, margin income will be captured in our third metric – Return on Invested Capital (ROIC).

58
Average Return on Invested Capital (30%) over three years – this measure was chosen as it focuses on management improving and growing our underlying business, making earnings accretive investments and at the same time ensures both are done with capital discipline. The proposed methodology to calculate ROIC ensures that the expenses of M&A integrations and other business restructures, at a time when the business is heavily investing in both, are included in the calculation.
ROIC will be measured based upon management earnings (inclusive of tax but excluding interest expenses) and invested capital inclusive of cash costs associated with restructuring and M&A integration. This adjustment is important to ensure that the integration-related expenses from the acquisition of the Wells Fargo US Corporate Trust business (being the largest acquisition in Computershare’s history) will be captured in the calculation. However, ROIC will not include gains or losses on sales of business or marked to market adjustments on derivatives.
This is a different measure from that Computershare has historically disclosed (as we adapt it to be an appropriate LTI measure). The key difference being management adjustments for restructures and M&A and the materially changing interest rate environment. Consequently, comparisons between the historically disclosed ROIC and the proposed adjusted ROIC are not valid.
The proposed ROIC targets for the FY2022 LTI plan are based on the medium-term strategic plan across the performance period such that the achievement of the threshold target ROIC (being 11% and well above the weighted average cost of capital) will result in 50% of the rights associated with the measure vesting, increasing on a straight line basis to full vesting at a ROIC of 12.1%.
The LTI plan evolution over the three plan periods is shown below.
UP TO FY20 50% EPS 50% rTSR
FY21 TRANSITIONAL
50% SARs 50% rTSR
FY22 ONWARDS
30% EPS ex MI 30% ROIC 40% rTSR

59 | COMPUTERSHARE | ANNUAL REPORT | 2021
DIRECTORS’ REPORT
7. STATUTORY REMUNERATION DISCLOSURESDetails of the nature and amount of each element of the total remuneration for each director and member of KMP for the year ended 30 June 2021 are set out in the table below. Where remuneration was paid in anything other than USD, it has been translated at the average exchange rate for the financial year (for example, the FY2021 USD/AUD average rate was 0.74272, the FY2020 USD/AUD average rate was 0.67164).
7.1 REMUNERATION OF DIRECTORS AND OTHER KMP
Short-term Long-term
Post employ-
ment benefits
Share-based payments expense Other Total
Financial Year
Salaries and fees
Cash profit share and
bonuses Other1
Super-annuation/
pension Shares
Perfor-mance
rights/SARs2
Expatriatecosts3
Tax equal-isation on expatriate
benefits4 Other5
$ $ $ $ $ $ $ $ $ $
Directors
SJ Irving3,4,6 2021 1,386,881 658,410 23,161 13,403 804,253 441,767 30,146 - - 3,358,021
2020 1,266,921 431,787 20,911 10,580 595,058 346,275 614,090 684,427 - 3,970,049
AP Cleland6 2021 123,502 - - 3,229 - - - - - 126,731
2020 110,409 - - 4,648 - - - - - 115,057
TL Fuller6 2021 160,106 - - 14,997 - - - - - 175,103
2020 145,251 - - 13,639 - - - - - 158,890
LM Gay6 2021 132,773 - - 12,614 - - - - - 145,387
2020 114,346 - - 10,863 - - - - - 125,209
SD Jones6 2021 259,786 - - 16,113 - - - - - 275,899
2020 236,204 - - 14,106 - - - - - 250,310
CJ Morris6 2021 118,835 - - - - - - - - 118,835
2020 107,463 - - - - - - - - 107,463
P Reynolds6 2021 136,376 - - - - - - - - 136,376
2020 128,291 - - - - - - - - 128,291
JM Velli 2021 169,143 - - - - - - - - 169,143
2020 169,143 - - - - - - - - 169,143
Other KMP
ML McDougall62021 498,313 113,178 8,261 16,113 106,929 88,359 - - 2,190 833,343
2020 434,979 84,752 19,409 14,106 119,389 55,509 - - 1,965 730,109
N Oldfield7 2021 796,677 244,501 - 31,100 206,869 163,140 - - 2,736 1,445,023
2020 452,694 153,506 - 30,900 155,618 2,242 - - 1,596 796,556
N Sarkar3,4,6 2021 1,005,229 229,989 - - 163,740 169,092 191,095 (62,026) 2,413 1,699,532
2020 635,464 103,771 - - 187,519 74,405 353,035 64,322 2,270 1,420,786
1 Other long-term remuneration comprises long service leave.
2 Performance rights expense has been included in the total remuneration on the basis that it is considered probable at the date of this financial report that the performance condition and service condition will be met. In future reporting periods, if the probability requirement regarding the EPS performance condition or the service condition is not met, a credit to remuneration will be included consistent with the accounting treatment. As part of the 2022 financial year budget process, it was no longer considered probable that the performance condition applicable to the performance rights granted on 2 December 2019 would be fully met. On this basis, the accounting expense (excluding the TSR component) related to prior years has been reversed.
3 Expatriate costs include payments made to KMP engaged on overseas assignments in accordance with Computershare’s expatriate policy. For SJ Irving, the amount includes benefits which were payable under his expatriate assignment which ended March 2020. The benefits mainly related to travel which was delayed as a result of Covid-19. The restrictions on travel during the first half of 2020 meant that travel was delayed until the borders opened up later in the year. For N Sarkar, the amount reflects benefits related to his and his family’s relocation to the United States on an assignment that ended on 17 November 2020.
4 Tax equalisation arrangements operate so Computershare employees on an expatriate assignment pay the equivalent tax to what would have been paid had they not been on an assignment. This includes tax that the Company is required to pay in order to provide expatriate benefits.
5 Other includes other benefits provided to KMP and benefits related to Computershare’s general employee share plan as detailed in note 40 of the financial statements.
6 KMP are paid in their local currency. Foreign exchange rate movements can impact the comparison between years in US dollar terms.
7 N Oldfield was appointed as CFO on 3 December 2019.

60
7.2 SHORT-TERM SALARY AND FEES, CASH PROFIT SHARE AND BONUSES, LONG-TERM OTHER, POST EMPLOYMENT BENEFITS
DirectorsAP Cleland, TL Fuller, LM Gay, SD Jones and CJ Morris are paid in Australian dollars. Director fees for JM Velli and PJ Reynolds are paid in local currency.
Group CEO and other executive KMPAll executive KMP receive their salary and other cash payments in their local currency.
Shares granted as remuneration under DSTI PlanSet out below is a summary of shares granted under the DSTI plan and the maximum value of shares that are expected to vest in the future if the vesting conditions are met:
Date granted
Number granted
Number vested
during the year
Number outstanding
end of the year
Financial year in
which grant may vest
Value at grant date (if granted this year)
Maximum total value of
grant yet to be expensed
$ $
SJ Irving 4/12/2018 39,382 39,382 - FY2021 - -
2/12/2019 78,797 - 78,797 FY2022 - 100,989
7/12/2020 48,629 - 48,629 FY2023 519,731 350,860
ML McDougall 1/10/2018 9,171 9,171 - FY2021 - -
1/10/2019 11,052 - 11,052 FY2022 - 12,575
1/10/2020 5,416 - 5,416 FY2023 55,833 34,089
N Oldfield 1/10/2018 19,930 19,930 - FY2021 - -
1/10/2019 21,606 - 21,606 FY2022 - 24,583
1/10/2020 9,377 - 9,377 FY2023 96,667 59,020
N Sarkar 1/10/2018 14,533 14,533 - FY2021 - -
1/10/2019 17,384 - 17,384 FY2022 - 19,779
1/10/2020 7,374 - 7,374 FY2023 76,018 46,413
Fair values of shares at grant date are determined using the closing share price on grant date.
Performance rights Performance rights granted under the LTI plan are for no consideration and carry no dividend or voting rights. Each performance right carries an entitlement to one fully paid ordinary share in Computershare Limited.
Set out below is a summary of performance rights granted under the LTI plans.
Date grantedNumber granted
Number vested during
the year
Number lapsed during
the year
Number outstanding
end of the year
Financial year in
which grant may vest
Value at grant date (if granted this year)
Maximum total value of
grant yet to be expensed
$ $
SJ Irving 5/12/2017 90,627 - (90,627) - FY2021 - -
4/12/2018 129,707 - - 129,707 FY2022 - -
2/12/2019 190,443 - - 190,443 FY2023 - 186,260
7/12/2020 103,809 - - 103,809 FY2024 639,164 426,109
ML McDougall 5/12/2017 33,916 - (33,916) - FY2021 - -
4/12/2018 25,395 - - 25,395 FY2022 - -
2/12/2019 39,103 - - 39,103 FY2023 - 38,244
7/12/2020 21,186 - - 21,186 FY2024 130,445 86,963
N Oldfield 5/12/2017 31,250 - (31,250) - FY2021 - -
4/12/2018 49,612 - - 49,612 FY2022 - -
2/12/2019 69,420 - - 69,420 FY2023 - 67,895
7/12/2020 37,553 - - 37,553 FY2024 231,218 154,145
N Sarkar 5/12/2017 44,853 - (44,853) - FY2021 - -
4/12/2018 40,423 - - 40,423 FY2022 - -
2/12/2019 53,504 - - 53,504 FY2023 - 52,329
7/12/2020 38,134 - - 38,134 FY2024 234,795 156,530

61 | COMPUTERSHARE | ANNUAL REPORT | 2021
DIRECTORS’ REPORT
SARsSARs granted under the LTI plan are for no consideration and carry no dividend or voting rights. Each SAR carries an entitlement to fully paid ordinary shares in Computershare Limited equivalent to the amount by which the underlying share price has increased since the right was granted.
Set out below is a summary of SARs granted under the LTI plans.
Date grantedNumber granted
Number vested during
the year
Number lapsed during
the year
Number outstanding
end of the year
Financial year in
which grant may vest
Value at grant date (if granted this year)
Maximum total value of
grant yet to be expensed
$ $
SJ Irving 7/12/2020 367,406 - - 367,406 FY2024 723,127 482,085
ML McDougall 7/12/2020 74,983 - - 74,983 FY2024 147,581 98,388
N Oldfield 7/12/2020 132,912 - - 132,912 FY2024 261,597 174,398
N Sarkar 7/12/2020 134,967 - - 134,967 FY2024 265,642 177,094
Shareholdings of KMPThe number of ordinary shares in Computershare Limited held during the financial year by each director and the other named KMP, including details of shares granted as remuneration during the current financial year and ordinary shares provided as the result of the exercise of remuneration options during the current financial year, are included in the table below.
Balance at beginning of
the yearVested under
DSTI plan
On exercise of options/
performance rights
On market purchases/
(sales)Vested Other
share plans1 Other
Balance at end of the year
Value of options/
performance rights
exercised
$
Directors SJ Irving 132,014 39,382 - - - - 171,396 -
AP Cleland 12,125 - - 1,843 - - 13,968 -
TL Fuller 10,500 - - 5,648 - - 16,148 -
LM Gay 19,700 - - 2,239 - - 21,939 -
SD Jones 26,619 - - 25,298 - - 51,917 -
CJ Morris 31,095,300 - - 995,783 - - 32,091,083 -
PJ Reynolds 8,000 - - - - - 8,000 -
JM Velli 17,000 - - - - - 17,000 -
Other KMP
ML McDougall 7,240 9,171 - - 1,291 - 17,702 -
N Oldfield 45,603 19,930 - (3,857) 405 - 62,081 -
N Sarkar 54,805 14,533 - (14,533) 626 - 55,431 -
1 Vested Other share plans include shares vested related to Computershare’s general employee share plan as detailed in note 40.

62
Proportions of fixed and performance-related remuneration
The percentage value of total remuneration relating to the current financial year received by KMP that consists of fixed and performance-related remuneration is as follows:
% of fixed/non-performance
related remuneration
% of total remuneration
received as cash bonus
(CSTI)
% of remuneration
received as equity bonus
(DSTI)
% of total remuneration
received as performance
related rights/options*
SJ Irving1 38.83% 17.59% 21.48% 22.10%
AP Cleland 100.00% - - -
TL Fuller 100.00% - - -
LM Gay 100.00% - - -
SD Jones 100.00% - - -
CJ Morris 100.00% - - -
PJ Reynolds 100.00% - - -
JM Velli 100.00% - - -
ML McDougall 57.52% 12.40% 11.72% 18.36%
N Oldfield 52.37% 15.42% 13.05% 19.16%
N Sarkar2 62.87% 12.72% 9.06% 15.35%
* Excludes the performance rights reversal in the year ended 30 June 2021.
1 The percentage of fixed/non-performance related remuneration disclosed is inclusive of expatriate benefits and associated tax equalisation. Excluding these amounts, the proportions of total remuneration are: Fixed/non-performance related – 38.33%; CSTI – 17.73%; DSTI – 21.66%; performance rights – 22.28%.
2 The percentage of fixed/non-performance related remuneration disclosed is inclusive of expatriate benefits and associated tax equalisation. Excluding these amounts, the proportions of total remuneration are: Fixed/non-performance related – 60.02%; CSTI – 13.70%; DSTI – 9.75%; performance rights – 16.53%.
7.3 OTHERLoans and other transactions with directors and executivesComputershare made no loans to directors and executive directors or other KMP during the current financial year.
CJ Morris has an interest in Colonial Leisure Group Jersey Limited. Computershare provided secretarial services to the entity on ordinary commercial terms and conditions. Total value of services provided in the reporting period was $7,251 (2020: $13,125).
As a matter of Board approved policy, the Group maintains a register of all transactions between directors and the consolidated entity. It is established practice for any director to excuse himself or herself from discussion and voting upon any transaction in which that director has an interest. The consolidated entity has a Board approved ethics policy governing many aspects of workplace conduct, including management and disclosure of conflicts of interest.
Derivative instrumentsAs per Corporations Act 2001, Section 206J, Computershare’s policy forbids KMP to deal in derivatives designed as a hedge against exposure to unvested shares and vested shares that are still subject to a disposal restriction in Computershare Limited.
Shares under optionUnissued ordinary shares in Computershare Limited under performance rights and Share Appreciation Rights at the date of this report are as follows:
Date granted Financial year of expiry Number of rights
Performance rights
02/12/2019 2023 725,928
07/12/2020 2024 417,412
Share Appreciation Rights
07/12/2020 2024 1,477,334

63 | COMPUTERSHARE | ANNUAL REPORT | 2021
DIRECTORS’ REPORT
AUDITORPricewaterhouseCoopers continues in office in accordance with section 327 of the Corporations Act 2001.
Auditor’s independence declarationA copy of the auditor’s signed independence declaration as required under section 307C of the Corporations Act 2001 is provided immediately after this report.
Non-audit servicesThe Group may decide to employ its auditor, PricewaterhouseCoopers, on assignments in addition to their statutory audit duties where the auditor’s expertise and experience with the Group are important.
The Board is satisfied that the provision of non-audit services is compatible with the general standard of independence for auditors imposed by the Corporations Act 2001 and internal guidelines. Further details regarding the Board’s internal policy for engaging PricewaterhouseCoopers for non-audit services are set out in the Corporate Governance Statement.
The directors are satisfied that the provision of non-audit services by PricewaterhouseCoopers, as set out below, did not compromise the auditor independence requirements of the Corporations Act 2001 for the following reasons:
> No services were provided by PricewaterhouseCoopers that are prohibited by policy (the policy lists services that cannot be undertaken).
> None of the services provided undermine the general principles relating to auditor’s independence, including reviewing or auditing the auditor’s own work, acting in a management capacity or a decision-making capacity for the Group, acting as an advocate for the Group or jointly sharing economic risks and rewards.
During the year, the following amounts were incurred in relation to services provided by PricewaterhouseCoopers and its network firms.
2021$000
2020$000
1. Audit services
Audit and review of the financial statements and other audit work by PricewaterhouseCoopers Australia 989 1,021
Audit and review of the financial statements and other audit work by network firms of PricewaterhouseCoopers Australia
3,328 2,757
4,317 3,778
2. Other services
Other assurance services performed by PricewaterhouseCoopers Australia 461 321
Other assurance services performed by network firms of PricewaterhouseCoopers Australia 2,146 2,013
Taxation services provided by network firms of PricewaterhouseCoopers Australia 463 329
3,069 2,663
Total Auditor’s Remuneration 7,386 6,441
ROUNDING OF AMOUNTSThe Group is of a kind referred to in ASIC Corporations (Rounding in Financial/Directors’ Reports) Instrument 2016/191, issued by the Australian Securities and Investments Commission, relating to the “rounding off” of amounts in the Directors’ Report. Amounts in the Directors’ Report have been rounded off in accordance with that Class order to the nearest thousand dollars unless specifically stated to be otherwise.
Signed in accordance with a resolution of the directors.
SD Jones Chairman
SJ Irving Chief Executive Officer
20 September 2021

64
AUDITOR’S INDEPENDENCE DECLARATION
PricewaterhouseCoopers, ABN 52 780 433 757 2 Riverside Quay, SOUTHBANK VIC 3006, GPO Box 1331, MELBOURNE VIC 3001 T: 61 3 8603 1000, F: 61 3 8603 1999, www.pwc.com.auLiability limited by a scheme approved under Professional Standards Legislation.
Auditor’s Independence Declaration
As lead auditor for the audit of Computershare Limited for the year ended 30 June 2021, I declare that
to the best of my knowledge and belief, there have been:
(a) no contraventions of the auditor independence requirements of the Corporations Act 2001 in
relation to the audit; and
(b) no contraventions of any applicable code of professional conduct in relation to the audit.
This declaration is in respect of Computershare Limited and the entities it controlled during the
period.
Marcus Laithwaite Melbourne
Partner
PricewaterhouseCoopers
20 September 2021
PricewaterhouseCoopers, ABN 52 780 433 757
2 Riverside Quay, SOUTHBANK VIC 3006, GPO Box 1331, MELBOURNE VIC 3001
T: 61 3 8603 1000, F: 61 3 8603 1999, www.pwc.com.au
Liability limited by a scheme approved under Professional Standards Legislation.

65 | COMPUTERSHARE | ANNUAL REPORT | 2021
The above consolidated statement of comprehensive income is presented in United States dollars and should be read in conjunction with the accompanying notes.
Note2021
$0002020$000
Revenue from continuing operations
Sales revenue 2,281,131 2,271,512
Dividends received 1,249 2,142
Interest received 781 3,627
Total revenue from continuing operations 2 2,283,161 2,277,281
Other income 2 50,893 3,905
Expenses
Direct services 1,675,327 1,540,471
Technology costs 295,462 313,731
Corporate services 38,655 36,535
Finance costs 3 54,867 66,325
Total expenses 2,064,311 1,957,062
Share of net profit/(loss) of associates and joint ventures accounted for using the equity method 31 389 239
Profit before related income tax expense 270,132 324,363
Income tax expense/(credit) 6 80,933 91,632
Profit for the year 189,199 232,731
Other comprehensive income that may be reclassified to profit or loss
Cash flow hedges (7,651) 12,023
Exchange differences on translation of foreign operations 68,114 (21,185)
Income tax relating to components of other comprehensive income 6 (512) 116
Total other comprehensive income for the year, net of tax 59,951 (9,046)
Total comprehensive income for the year 249,150 223,685
Profit for the year attributable to:
Members of Computershare Limited 188,974 232,657
Non-controlling interests 225 74
189,199 232,731
Total comprehensive income for the year attributable to:
Members of Computershare Limited 248,366 224,246
Non-controlling interests 784 (561)
249,150 223,685
Basic earnings per share (cents per share) 4 33.77 cents 42.55 cents
Diluted earnings per share (cents per share) 4 33.76 cents 42.55 cents
CONSOLIDATED STATEMENT OF COMPREHENSIVE INCOMEfor the year ended 30 June 2021
FINANCIALS

66
The above consolidated statement of financial position is presented in United States dollars and should be read in conjunction with the accompanying notes.
Note2021
$0002020$000
CURRENT ASSETS
Cash and cash equivalents 7 816,810 597,313
Other financial assets 17 76,187 59,943
Receivables 15 419,890 426,465
Loan servicing advances 16 335,697 267,016
Financial assets at fair value through profit or loss 13 8,540 17,979
Inventories 18 5,452 5,113
Current tax assets 10,588 17,979
Prepayments 37,625 36,757
Assets classified as held for sale 31 2,888 -
Other current assets 19 5,033 3,426
Total current assets 1,718,710 1,431,991
NON-CURRENT ASSETS
Receivables 15 194 2,184
Investments accounted for using the equity method 31 9,097 10,670
Financial assets at fair value through profit or loss 13 34,210 39,713
Property, plant and equipment 20 102,671 110,094
Right-of-use assets 21 206,601 180,032
Deferred tax assets 6 149,129 161,153
Intangibles 9 3,029,051 3,052,826
Other non-current assets 19 2,222 1,088
Total non-current assets 3,533,175 3,557,760
Total assets 5,251,885 4,989,751
CURRENT LIABILITIES
Payables 22 491,760 494,737
Borrowings 14 322,376 287,410
Lease liabilities 21 50,605 43,159
Current tax liabilities 28,153 73,170
Financial liabilities at fair value through profit or loss 13 218 3,456
Provisions 23 58,645 70,863
Deferred consideration 24 9,452 8,045
Mortgage servicing related liabilities 25 34,459 43,766
Total current liabilities 995,668 1,024,606
NON-CURRENT LIABILITIES
Payables 22 3,061 1,052
Borrowings 14 1,387,610 1,742,410
Lease liabilities 21 193,488 158,910
Financial liabilities at fair value through profit or loss 13 1,314 -
Deferred tax liabilities 6 234,219 227,342
Provisions 23 24,529 25,188
Deferred consideration 24 1,264 9,536
Mortgage servicing related liabilities 25 131,135 210,388
Total non-current liabilities 1,976,620 2,374,826
Total liabilities 2,972,288 3,399,432
Net assets 2,279,597 1,590,319
EQUITY
Contributed equity 27 519,299 -
Reserves 28 (7,052) (172,496)
Retained earnings 29 1,765,412 1,761,188
Total parent entity interest 26 2,277,659 1,588,692
Non-controlling interests 26 1,938 1,627
Total equity 2,279,597 1,590,319
CONSOLIDATED STATEMENT OF FINANCIAL POSITIONas at 30 June 2021

67 | COMPUTERSHARE | ANNUAL REPORT | 2021
Attributable to members of Computershare Limited
Note
Contributed Equity $000
Reserves$000
Retained Earnings
$000Total
$000
Non-controlling
Interests$000
Total Equity
$000
Total equity at 1 July 2020 - (172,496) 1,761,188 1,588,692 1,627 1,590,319
Profit for the year - - 188,974 188,974 225 189,199
Cash flow hedges - (7,651) - (7,651) - (7,651)
Exchange differences on translation of foreign operations
- 67,555 - 67,555 559 68,114
Income tax (expense)/credits - (512) - (512) - (512)
Total comprehensive income for the year - 59,392 188,974 248,366 784 249,150
Transactions with owners in their capacity as owners:
Dividends provided for or paid - - (184,750) (184,750) (473) (185,223)
Dividend reinvestment plan issues 27 12,411 - - 12,411 - 12,411
Rights issue, net of transaction costs and tax 27 608,446 - - 608,446 - 608,446
Transfer from share buy-back 27 (101,558) 101,558 - - - -
Cash purchase of shares on market - (16,271) - (16,271) - (16,271)
Share based remuneration - 20,765 - 20,765 - 20,765
Balance at 30 June 2021 519,299 (7,052) 1,765,412 2,277,659 1,938 2,279,597
Total equity at 1 July 2019 - (134,551) 1,706,427 1,571,876 2,195 1,574,071
Change in accounting policy - - (10,493) (10,493) - (10,493)
Restated total equity at the beginning of the financial year
- (134,551) 1,695,934 1,561,383 2,195 1,563,578
Profit for the year - - 232,657 232,657 74 232,731
Cash flow hedges - 12,023 - 12,023 - 12,023
Exchange differences on translation of foreign operations
- (20,550) - (20,550) (635) (21,185)
Income tax (expense)/credits - 116 - 116 - 116
Total comprehensive income for the year - (8,411) 232,657 224,246 (561) 223,685
Transactions with owners in their capacity as owners:
Dividends provided for or paid - - (167,403) (167,403) (7) (167,410)
Share buy-back - (22,098) - (22,098) - (22,098)
Cash purchase of shares on market - (25,797) - (25,797) - (25,797)
Share based remuneration - 18,361 - 18,361 - 18,361
Balance at 30 June 2020 - (172,496) 1,761,188 1,588,692 1,627 1,590,319
CONSOLIDATED STATEMENT OF CHANGES IN EQUITYfor the year ended 30 June 2021
The above consolidated statement of changes in equity is presented in United States dollars and should be read in conjunction with the accompanying notes.

68
CONSOLIDATED CASH FLOW STATEMENTfor the year ended 30 June 2021
Note2021
$0002020$000
CASH FLOWS FROM OPERATING ACTIVITIES
Receipts from customers 2,424,285 2,449,925
Payments to suppliers and employees (1,880,709) (1,761,805)
Loan servicing advances (net) (68,681) 14,442
Dividends received from associates, joint ventures and equity securities 1,550 2,496
Interest paid and other finance costs (77,664) (56,577)
Interest received 781 3,627
Income taxes paid (92,926) (43,303)
Net operating cash flows 7(b) 306,636 608,805
CASH FLOWS FROM INVESTING ACTIVITIES
Payments for purchase of controlled entities and businesses (net of cash acquired) (21,829) (159,075)
Proceeds from/(payments for) intangible assets including MSRs (124,987) (187,540)
Proceeds from/(payments for) investments 15,875 6,795
Payments for property, plant and equipment (16,294) (24,043)
Net investing cash flows (147,235) (363,863)
CASH FLOWS FROM FINANCING ACTIVITIES
Proceeds from issue of shares – net of transaction costs 607,820 -
Payments for purchase of ordinary shares – share-based awards (16,271) (25,797)
Proceeds from borrowings 286,772 786,985
Repayment of borrowings (672,395) (680,747)
Loan servicing borrowings (net) 41,202 (43,736)
Dividends paid – ordinary shares (net of dividend reinvestment plan) (170,929) (159,210)
Purchase of ordinary shares – dividend reinvestment plan (1,410) (8,193)
Dividends paid to non-controlling interests in controlled entities (473) (7)
Payments for on-market share buy-back - (22,098)
Lease principal payments (48,476) (44,094)
Net financing cash flows 25,840 (196,897)
Net increase/(decrease) in cash and cash equivalents held 185,241 48,045
Cash and cash equivalents at the beginning of the financial year 597,313 561,346
Exchange rate variations on foreign cash balances 34,256 (12,078)
Cash and cash equivalents at the end of the year 816,810 597,313
The above consolidated cash flow statement is presented in United States dollars and should be read in conjunction with the accompanying notes.

69 | COMPUTERSHARE | ANNUAL REPORT | 2021
1. Basis of preparation
Results and key balances2. Revenue and other income
3. Expenses
4. Earnings per share
5. Segment information
6. Income tax expense and balances
7. Notes to the consolidated cash flow statement
8. Business combinations
9. Intangible assets
10. Impairment
Financial risk management11. Hedge accounting
12. Financial risk management
13. Financial assets and liabilities at fair value through profit or loss
14. Borrowings
Other balance sheet items15. Receivables
16. Loan servicing advances
17. Other financial assets
18. Inventories
19. Other assets
20. Property, plant and equipment
21. Leases
22. Payables
23. Provisions
24. Deferred consideration
25. Mortgage servicing related liabilities
Equity26. Interests in equity
27. Contributed equity
28. Reserves
29. Retained earnings and dividends
Group structure30. Details of controlled entities
31. Investments in associates and joint ventures
32. Deed of cross guarantee
33. Parent entity financial information
Unrecognised items34. Contingent liabilities
35. Commitments
36. Capital expenditure commitments
37. Significant events after year end
Other disclosures38. Related party disclosures
39. Key management personnel disclosures
40. Employee and executive benefits
41. Remuneration of auditors
NOTES TO THE CONSOLIDATED FINANCIAL STATEMENTS

70
1. BASIS OF PREPARATION The principal accounting policies adopted in the preparation of the financial report are set out below. These policies have been consistently applied to all the periods presented, unless otherwise stated. The financial report is for the consolidated entity consisting of Computershare Limited and its controlled entities, referred to collectively throughout these financial statements as the “consolidated entity”, “the Group” or “Computershare”.
Basis of preparation of full year financial reportThis general purpose financial report for the reporting period ended 30 June 2021 has been prepared in accordance with Australian Accounting Standards, other authoritative pronouncements of the Australian Accounting Standards Board and the Corporations Act 2001. Computershare Limited is a for-profit entity for the purpose of preparing financial statements.
This report is to be read in conjunction with any public announcements made by Computershare Limited during the reporting period in accordance with the continuous disclosure requirements of the Corporations Act 2001 and Australian Securities Exchange Listing Rules.
Where necessary, comparative figures have been adjusted to conform with changes in presentation in the current period.
Compliance with IFRS
The financial statements of Computershare Limited and its controlled entities also comply with International Financial Reporting Standards (IFRS) as issued by the International Accounting Standards Board (IASB).
Historical cost convention
The financial statements have been prepared under the historical cost convention except for certain financial assets and liabilities (including derivative instruments) measured at fair value through profit or loss.
Principles of consolidationThe consolidated financial statements include the assets and liabilities of the parent entity, Computershare Limited, and its controlled entities.
All intercompany balances and transactions have been eliminated. Where an entity either began or ceased to be controlled during the year, the results are consolidated only from the date control commenced or up to the date control ceased.
Financial statements of foreign controlled entities, associates and joint ventures presented in accordance with overseas accounting principles are, for consolidation purposes, adjusted to comply with Group policy and Australian Accounting Standards.
Controlled entities
Controlled entities are all those entities over which the Group has control. The Group controls an entity when the Group is exposed to, or has rights to, variable returns from its involvement with the entity and has the ability to affect those returns through its power over the entity. Controlled entities are fully consolidated from the date on which control is transferred to the Group. They are de-consolidated from the date that control ceases.
The acquisition method of accounting is used to account for the acquisition of controlled entities by the Group.
Investments in associated entities
Associates are all entities over which the Group has significant influence but not control or joint control. This generally accompanies a shareholding of between 20% and 50% of the voting rights. Interests in associates are accounted for using the equity method.
Investments in joint ventures
Joint ventures are arrangements where Computershare has joint control with another party over that arrangement and each party has rights to the net assets of that arrangement. Joint control is the agreed sharing of control, which exists when decisions about relevant activities require unanimous consent of parties sharing control. Interests in joint ventures are accounted for using the equity method.
Changes in ownership interests
The Group treats transactions with non-controlling interests that do not result in a loss of control as transactions with equity owners of the Group. A change in ownership interest results in an adjustment between the carrying amounts of the controlling and non-controlling interests to reflect their relative interests in the controlled entity. Any difference between the amount of the adjustment to non-controlling interests and any consideration paid or received is recognised in a separate reserve within equity attributable to owners of the parent entity.
Foreign currency
Functional and presentation currency
Items included in the financial statements of each of the Group’s entities are measured using the currency of the primary economic environment in which the entity operates (the ‘functional currency’). The consolidated financial statements are presented in US dollars as a significant portion of the Group’s activity is denominated in US dollars.

71 | COMPUTERSHARE | ANNUAL REPORT | 2021
NOTES TO THE CONSOLIDATED FINANCIAL STATEMENTS
Transactions and balances
Foreign currency transactions are converted to US dollars at exchange rates approximating those in effect at the date of each transaction. Amounts payable and receivable in foreign currencies at balance date are converted to US dollars at the average of the buy and sell rates available on the close of business at balance date. Revaluation gains and losses are brought to account as they occur.
Exchange differences relating to monetary items are included in profit or loss, as exchange gains or losses, in the period when the exchange rates change, except when deferred in equity as qualifying cash flow hedges and qualifying net investment hedges.
Group companies
The results and financial position of all the Group entities that have a functional currency different from the presentation currency are translated into the presentation currency as follows:
> Assets and liabilities for each presented statement of financial position are translated at the closing rate at the date of that statement
> Income and expenses for each statement of comprehensive income are translated at average exchange rates
> All resulting exchange differences are recognised in other comprehensive income
On consolidation, exchange differences arising from the translation of any net investment in foreign entities, and of borrowings and other currency instruments designated as hedges of such investments, are recognised in other comprehensive income and reflected in equity.
Goodwill and fair value adjustments arising on acquisition of a foreign entity are treated as assets and liabilities of the foreign entity and are translated at the closing rate.
Key estimates and judgementsEstimates and judgements are continually evaluated and are based on historical experience and other factors, including expectations of future events that may have a financial impact on the entity and that are believed to be reasonable under the circumstances.
The Group makes estimates and assumptions concerning the future. The resulting accounting estimates will, by definition, seldom equal the related actual results. The significant estimates and assumptions made in the current financial year are set out in the relevant notes:
Note Key accounting estimates and judgements
6 Provision for income tax
6 Deferred tax assets relating to carry forward tax losses
8 Accounting for business combinations
9 Intangibles – mortgage servicing rights
10 Impairment
Covid-19 impactThe Covid-19 pandemic has resulted in significant disruptions to the global economy during the year ended 30 June 2021 and there remains substantial uncertainty over the extent and duration of the pandemic as well as the corresponding economic impacts. These uncertainties have been incorporated into the judgements and estimates used in the preparation of this report, including the carrying values of the assets and liabilities. Where the judgements and estimates are considered significant they have been disclosed in the notes to this report.
Rounding of amountsThe consolidated entity is of a kind referred to in ASIC Corporations (Rounding in Financial/Directors’ Reports) Instrument 2016/191, issued by the Australian Securities and Investments Commission, relating to the ‘rounding off’ of amounts in the financial report. In accordance with this instrument, amounts in the financial report have been rounded off to the nearest thousand dollars, or in certain cases, the nearest dollar.
New and amended accounting standards and interpretations adopted from 1 July 2020The Group has adopted all standards and amendments to accounting standards which became applicable to the Group from 1 July 2020, including:
> AASB 2018-7 Amendments to Australian Accounting Standards – Definition of Material
> AASB 2018-6 Amendments to Australian Accounting Standards – Definition of a Business
> AASB 2019-3 Amendments to Australian Accounting Standards – Interest Rate Benchmark Reform
> AASB 2019-5 Amendments to Australian Accounting Standards – Disclosure of the Effect of New IFRS Standards Not Yet issued in Australia
> Conceptual Framework for Financial Reporting and AASB 2019-1 Amendments to Australian Accounting Standards – References to the Conceptual Framework
> AASB 2020-4 Amendments to Australian Accounting Standards – Covid-19-Related Rent Concessions
> IFRIC update Configuration or Customisation Costs in a Cloud Computing Arrangement (AASB 138)

72
AASB 2019-3 Amendments to Australian Accounting Standards – Interest Rate Benchmark Reform
AASB 2019-3 amends some specific hedge accounting requirements within AASB 7, 9 and 139 to provide relief from potential effects of the uncertainty caused by the transition associated with interest rate benchmark reform (IBOR) and is effective from 1 July 2020. IBOR reform primarily impacts the consolidated entity’s hedge relationships. Refer to note 11 for details of the effect of IBOR reform on the Group’s hedging arrangements.
The other amendments listed above did not have any impact on the amounts recognised in current or prior periods and are not expected to significantly affect future periods.
New and amended standards and interpretations issued but not yet effective
AASB 2020-8 Interest Rate Benchmark Reform – Phase 2
IBOR are interest rate benchmarks that are used in a wide variety of financial instruments such as derivatives, borrowing facilities and deposit contracts. Examples of IBOR include ‘LIBOR’ (the London Inter-bank Offered Rate), ‘EURIBOR’ (the Euro Inter-bank Offered Rate) and ‘BBSW’ (the Australian Bank Bill Swap Rate). Historically, each IBOR has been calculated and published daily based on submissions by a panel of banks. Over time, changes in inter-bank funding markets have meant that IBOR panel bank submissions have become based less on observable transactions and more on expert judgement. Financial markets’ authorities reviewed what these changes meant for financial stability, culminating in recommendations to reform major interest rate benchmarks.
As a result of these recommendations, many IBOR around the world are undergoing reforms. LIBOR and other benchmark interest rates are being replaced with alternative reference rates (ARRs). The cessation date for all tenors of GBP, CHF, EUR LIBOR and the one week and two-month tenors for USD LIBOR is 31 December 2021. The cessation date for the remaining USD LIBOR tenors is 30 June 2023.
AASB 2020-8 Amendments to Australian Accounting Standards – Interest Rate Benchmark Reform Phase 2 makes further amendments to AASB 9, AASB 139, AASB 7, AASB 4 and AASB 16 to address issues that arise during the IBOR reform. The amendments:
> provide practical expedients to account for changes in the basis for determining contractual cash flows as a result of IBOR reform
> provide additional temporary reliefs from applying specific hedge accounting requirements to hedging relationships that are directly affected by IBOR reform, and
> require additional disclosures, including information about new risks arising from the IBOR reform, how the entity manages transition to the alternative benchmark rate(s) and quantitative information about derivatives and non-derivatives that have yet to transition.
The Group has a number of arrangements which reference IBOR benchmarks including derivatives, borrowing facilities and deposit contracts. The Group has commenced its transition plan in order to manage changes required to contracts impacted by IBOR reform within the specified frame. The Group continues to follow the status of the IASB’s IBOR reform project, and it will assess the impact for the Group as further information becomes available.
2. REVENUE AND OTHER INCOME
2021$000
2020$000
Sales revenue
Revenue from contracts with customers 2,281,131 2,271,512
Dividends received 1,249 2,142
Interest received 781 3,627
Total revenue from continuing operations 2,283,161 2,277,281
Other income
Gains on MSR related transactions 31,450 -
Gain on disposal of Euroclear Holding SA/NV 11,241 -
Rent received 993 779
Other 7,209 3,126
Total other income 50,893 3,905
73 | COMPUTERSHARE | ANNUAL REPORT | 2021
NOTES TO THE CONSOLIDATED FINANCIAL STATEMENTS
Sales revenueRevenue is recognised in a manner that depicts the transfer of promised goods or services to customers in an amount that reflects the consideration to which the provider of the goods or services expects to be entitled. This involves following a five-step model of revenue recognition:
> Identifying the contract with a customer
> Identifying performance obligations under the contract
> Determining the transaction price
> Allocating the transaction price to performance obligations under the contract
> Recognising revenue when Computershare satisfies its performance obligations
Integrated services
Integrated services customer contracts for registry maintenance, employee plans management, trust management, loan services and some recurring contracts in communication services include an obligation to perform an unspecified number of tasks to provide an integrated service over the contract period, where Computershare is compensated over the contract term whether or not any specific activities are required to be performed. In these situations, the Group has a stand-ready obligation to perform any of the tasks constituting the integrated service whenever needed, which is considered one performance obligation.
Typically, the consideration that Computershare is entitled to for satisfying performance obligations can vary in line with underlying measures, such as the number of shareholders or participants in an employee share plan. For the purposes of recording revenue, the Group estimates the amount of variable consideration it is entitled to, only to the extent that it is highly probable that a significant reversal in the cumulative amount of revenue recognised will not occur.
In some instances, particularly for smaller clients, consideration may be fixed. This fixed consideration is recognised as revenue over the contract term by measuring progress towards complete satisfaction of the underlying performance obligation, which is generally on a straight-line basis. Revenue for provision of shareholder meetings (considered a separate performance obligation) is recognised at a point in time when the meeting service has been provided.
The Group sometimes provides services on an ad-hoc basis over the contract period, where those services do not form a part of a stand-ready obligation (eg, property valuations). Each of these individual tasks is classified as a separate performance obligation and the allocated fee is recognised once that performance obligation has been completed.
Corporate actions, stakeholder relationship management, class actions
For corporate actions, stakeholder relationship management, class actions, bankruptcy administration and some communication services contracts, each customer contract is a separate performance obligation and revenue related to these contracts is typically variable. For contracts that qualify for over time revenue recognition, revenue is recognised in line with contractual charging arrangements for variable fees as they reflect the transfer of benefit to the customer.
Margin income
Margin income is part of variable consideration related to customer contracts and is recognised when it becomes receivable.
Upfront fees
Where work reflected by the upfront fees charged to clients is classified as a fulfilment activity, the associated revenue is recognised straight line over the relevant contract term. In those instances where the upfront fees represent a separate performance obligation, the associated revenue is recognised at a point in time when that performance obligation is satisfied.
Discounts and rebates
Where a contract includes a variable amount, the consolidated entity determines the transaction price with regard to any variable consideration it is entitled to. The estimated consideration can sometimes vary due to discounts and rebates. Accumulated experience is used to estimate the highly probable amount of variable consideration to be recognised.
Interest and dividend incomeInterest income on deposits is recognised using the effective interest method. Dividends are recognised as revenue when the right to receive payment is established.

74
3. EXPENSESProfit before tax includes the following specific expenses:
2021$000
2020 $000
Depreciation and amortisation
Depreciation of property, plant and equipment 31,885 34,251
Depreciation of right-of-use assets 43,146 43,221
Total depreciation 75,031 77,472
Amortisation of intangible assets 204,687 166,706
Amortisation of mortgage servicing related liabilities (40,428) (38,010)
Total amortisation (net) 164,259 128,696
Total depreciation and amortisation 239,290 206,168
Finance costs
Interest expense
Borrowings and derivatives 38,047 52,232
Lease liabilities 8,343 7,366
Other 4,084 3,200
Loan facility fees and other borrowing expenses 4,393 3,527
Total finance costs 54,867 66,325
Other operating expense items
Technology spending – research and development 100,741 99,181
Employee entitlements (excluding superannuation and other pension) expense 953,359 920,403
Superannuation and other pension expenses 48,841 45,125
Profit before tax includes the following individually significant expenses. Further information is included in note 4.
Individually significant items
Acquisition and disposal related expenses 41,196 21,011
Depreciation and amortisationRefer to notes 9, 20, 21 and 25 for further details on depreciation and amortisation.
Finance costsFinance costs are recognised as an expense when they are incurred.
Technology spending – research and developmentThese are operating expenses incurred on research and development activities.
Employee entitlementsEmployee entitlements include salaries and wages, leave entitlements, incentives and share-based payment awards. The Group’s accounting policy for liabilities associated with employee benefits is set out in notes 22 and 23. The policy relating to share-based payments is set out in note 40.
Superannuation and other pension expensesThe Group makes contributions to various defined contribution superannuation and pension plans. The Group has no further payment obligations once the contributions have been paid. The contributions are recognised as expenses when they become payable.

75 | COMPUTERSHARE | ANNUAL REPORT | 2021
NOTES TO THE CONSOLIDATED FINANCIAL STATEMENTS
4. EARNINGS PER SHARE
Year ended 30 June 2021 Basic EPS Diluted EPSManagement
Basic EPSManagement Diluted EPS
Earnings per share (cents per share) 33.77 cents 33.76 cents 50.71 cents 50.69 cents
Reconciliation of earnings $000 $000 $000 $000
Profit for the year 189,199 189,199 189,199 189,199
Non-controlling interest (profit)/loss (225) (225) (225) (225)
Add back management adjustment items (see below) - - 94,762 94,762
Net profit attributable to the members of Computershare Limited 188,974 188,974 283,736 283,736
Weighted average number of ordinary shares used as denominator in calculating earnings per share
559,519,258 559,747,063 559,519,258 559,747,063
Year ended 30 June 2020 Basic EPS1 Diluted EPS1
Management Basic EPS
Management Diluted EPS
Earnings per share (cents per share)1 42.55 cents 42.55 cents 55.57 cents 55.57 cents
Reconciliation of earnings $000 $000 $000 $000
Profit for the year 232,731 232,731 232,731 232,731
Non-controlling interest (profit)/loss (74) (74) (74) (74)
Add back management adjustment items (see below) - - 71,185 71,185
Net profit attributable to the members of Computershare Limited 232,657 232,657 303,842 303,842
Weighted average number of ordinary shares used as denominator in calculating earnings per share
546,780,636 546,780,636 546,780,636 546,780,636
1 Earnings per share is restated by adjusting the weighted average number of ordinary shares in order to incorporate the bonus element in the 2021 rights issue, as per AASB 133.
Reconciliation of weighted average number of shares used as the denominator:
2021Number
2020Number
Weighted average number of ordinary shares used as the denominator in calculating basic earnings per share 559,519,258 546,780,636
Adjustments for calculation of diluted earnings per share:
Share appreciation rights 91,168
Performance rights 136,637 -
Weighted average number of ordinary shares and potential ordinary shares used as the denominator in calculating diluted earnings per share
559,747,063 546,780,636
Calculation of earnings per share
Basic earnings per share
Basic earnings per share is calculated by dividing profit attributable to members of Computershare Limited by the weighted average number of ordinary shares outstanding during the financial year.
Diluted earnings per share
Diluted earnings per share is calculated by dividing the profit attributable to members of Computershare Limited by the weighted average number of ordinary shares outstanding during the financial year, adjusted for the effects of dilutive potential ordinary shares in the employee Long-Term Incentive Plan (see note 40b).
No employee performance rights or share appreciation rights have been issued since year end.
Management basic earnings per shareManagement basic earnings per share exclude certain items. Management adjusted results are used, along with other measures, to assess operating business performance. The Group believes that exclusion of certain items permits better analysis of the Group’s performance on a comparative basis and provides a better measure of underlying operating performance. The net profit used in the management earnings per share calculation is adjusted for management adjustment items net of tax.

76
For the year ended 30 June 2021 management adjustment items include the following:
Gross$000
Tax effect$000
Net of tax$000
Amortisation
Amortisation of acquisition related intangible assets (57,119) 14,398 (42,721)
Acquisitions and disposals
Acquisition related expenses (41,196) 7,578 (33,618)
Gain on disposal 11,241 (2,136) 9,105
Other
Major restructuring costs (36,113) 6,958 (29,155)
Reversal of provision 4,428 (1,188) 3,240
Marked to market adjustments – derivatives (2,304) 691 (1,613)
Total management adjustment items (121,063) 26,301 (94,762)
Management adjustment itemsManagement adjustment items net of tax for the year ended 30 June 2021 were as follows:
Amortisation
> Customer relationships and most of other intangible assets that are recognised on business combinations or major asset acquisitions are amortised over their useful life in the statutory results but excluded from management earnings. The amortisation of these intangibles in the year ended 30 June 2021 was $42.7 million. Amortisation of mortgage servicing rights, certain acquired software as well as intangibles purchased outside of business combinations is included as a charge against management earnings.
Acquisitions and disposals
> $22.9 million of expenses were incurred for the ongoing integration of Equatex including rollout of the acquired software. Acquisition related expenses were incurred for the acquisition of Wells Fargo of $9.0 million, including a $5.6 million foreign exchange loss on derivatives used to fix the amount of USD needed to fund the acquisition from the AUD equity issue. Additionally, costs in the sum of $1.7 million were incurred for redundancies associated with delivering synergies from other recent acquisitions, Corporate Creations and Verbatim.
> Disposal of the Group’s shareholding in Euroclear Holding SA/NV resulted in a gain of $9.1 million.
Other
> Costs of $29.2 million were incurred in the current reporting period in respect of major restructuring programmes spanning several years. $22.1 million of these costs related to UK mortgage services including the costs associated with workforce reductions and a property rationalisation programme. $2.5 million was related to the Global Operations transformation and $2.8 million was incurred on other property rationalisation across the Group.
> A $3.2 million gain arose from a reversal of a provisional tax liability associated with a previously identified business issue that has now been resolved.
> Revaluation of derivatives that have not received hedge designation or the ineffective portion of derivatives in hedge relationships is taken to profit or loss in the statutory results. The impact in the current reporting period was a loss of $1.6 million.

77 | COMPUTERSHARE | ANNUAL REPORT | 2021
NOTES TO THE CONSOLIDATED FINANCIAL STATEMENTS
For the year ended 30 June 2020 management adjustment items were as follows:
Gross$000
Tax effect$000
Net of tax$000
Amortisation
Amortisation of intangible assets (57,856) 15,259 (42,597)
Acquisitions and disposals
Acquisition related expenses (21,011) 5,355 (15,656)
Benefit of tax losses not previously recognised on Equatex acquisition - 7,666 7,666
One-off tax expense on Equatex IP restructure - 1,054 1,054
Acquisition accounting adjustments 1,410 (371) 1,039
Other
Major restructuring costs (25,972) 6,033 (19,939)
Marked to market adjustments – derivatives (3,932) 1,180 (2,752)
Total management adjustment items (107,361) 36,176 (71,185)
5. SEGMENT INFORMATIONIn accordance with AASB 8 Operating Segments, the Group has identified its operating segments to be the following six global business lines:
a. Issuer Services
b. Mortgage Services & Property Rental Services
c. Employee Share Plans & Voucher Services
d. Business Services
e. Communication Services & Utilities
f. Technology Services
Issuer Services comprise register maintenance, corporate actions, stakeholder relationship management, corporate governance and related services. Mortgage Services & Property Rental Services comprise mortgage servicing and related activities, together with tenancy bond protection services in the UK. Employee Share Plans & Voucher Services comprise the provision of administration and related services for employee share and option plans, together with Childcare Voucher administration in the UK. Business Services comprise the provision of bankruptcy, class actions and corporate trust administration services. Communication Services and Utilities operations comprise document composition and printing, intelligent mailing, inbound process automation, scanning and electronic delivery. Technology Services comprise the provision of software specialising in share registry and financial services.
There is a corporate function which includes entities whose main purpose is to hold intercompany investments and conduct financing activities. It is not considered an operating segment and includes activities that are not allocated to other operating segments.
The operating segments presented reflect the manner in which the Group is internally managed and the financial information reported to the chief operating decision maker (CEO). The Group has determined the operating segments based on the reports reviewed by the CEO that are used to make strategic decisions and assess performance. The key segment performance measure is based on earnings before interest and tax (management adjusted EBIT).
The Group’s key segment performance measure has changed during the reporting period from earnings before interest, tax, amortisation and depreciation (management adjusted EBITDA) to management adjusted EBIT. The Group has determined that management adjusted EBIT provides a better measure of performance, as there are significant levels of depreciation and amortisation in certain business lines included in management earnings.
Comparative segment information has been restated to reflect the new key segment performance measure. Consequently, the segment information disclosed is not entirely comparable to the information disclosed in the prior reporting period.

78
OPERATING SEGMENTS
Issuer Services
$000
Employee Share
Plans & Voucher Services
$000
Communi-cation
Services & Utilities
$000
Mortgage Services &
Property Rental
Services$000
Business Services
$000
Technology Services
$000Total
$000
June 2021
Total segment revenue and other income
1,026,870 335,428 341,289 608,965 211,480 225,337 2,749,369
Intersegment revenue (27,566) (2,410) (171,597) - (1,313) (225,301) (428,187)
External revenue and other income
999,304 333,018 169,692 608,965 210,167 36 2,321,182
Revenue by geography:
Asia 116,527 44,806 - - - - 161,333
Australia & New Zealand 117,155 13,260 82,951 - - 26 213,392
Canada 80,465 19,430 8,714 - 71,568 10 180,187
Continental Europe 58,767 10,688 31,405 - - - 100,860
UK, Channel Islands, Ireland & Africa 104,612 188,047 7,742 158,835 9,272 - 468,508
United States 521,778 56,787 38,880 450,130 129,327 - 1,196,902
999,304 333,018 169,692 608,965 210,167 36 2,321,182
Management adjusted EBIT 276,159 82,051 26,035 10,001 51,078 1,465 446,789
June 2020
Total segment revenue and other income
918,562 306,346 331,286 665,149 244,863 236,890 2,703,096
Intersegment revenue (23,813) (1,742) (162,465) - (1,246) (236,054) (425,320)
External revenue and other income 894,749 304,604 168,821 665,149 243,617 836 2,277,776
Revenue by geography:
Asia 79,928 32,612 - - - - 112,540
Australia & New Zealand 99,657 12,321 81,838 - - 858 194,674
Canada 74,557 18,752 7,776 - 84,623 33 185,741
Continental Europe 44,745 8,830 33,843 - - - 87,418
UK, Channel Islands, Ireland & Africa 102,625 175,619 6,669 226,413 14,209 (55) 525,480
United States 493,237 56,470 38,695 438,736 144,785 - 1,171,923
894,749 304,604 168,821 665,149 243,617 836 2,277,776
Management adjusted EBIT 258,506 62,095 27,411 70,425 87,296 1,721 507,454
Segment revenue The revenue reported to the CEO is measured in a manner consistent with that of the statement of comprehensive income. Sales between segments are included in the total segment revenue, whereas sales within a segment have been eliminated from segment revenue. Sales between segments are at normal commercial rates and are eliminated on consolidation.
Segment revenue reconciles to total revenue from continuing operations as follows:
2021$000
2020$000
Total operating segment revenue and other income 2,749,369 2,703,096
Intersegment eliminations (428,187) (425,320)
Other income (39,652) (3,905)
Corporate revenue 1,631 3,410
Total revenue from continuing operations 2,283,161 2,277,281

79 | COMPUTERSHARE | ANNUAL REPORT | 2021
NOTES TO THE CONSOLIDATED FINANCIAL STATEMENTS
Management adjusted EBITManagement adjusted results are used, along with other measures, to assess operating business performance. The Group believes that exclusion of certain items permits a better analysis of the Group’s performance on a comparative basis and provides a better measure of underlying operating performance.
A reconciliation of management adjusted EBIT to operating profit before income tax is provided as follows:
2021$000
2020$000
Management adjusted EBIT – operating segments 446,789 507,454
Management adjusted EBIT – corporate (727) (9,405)
Management adjusted EBIT 446,062 498,049
Management adjustment items (before related income tax effect):
Amortisation of intangible assets (57,119) (57,856)
Acquisition related expenses (41,196) (21,011)
Major restructuring costs (36,113) (25,972)
Gain on disposal 11,241 -
Reversal of provision 4,428 -
Marked to market adjustments – derivatives (2,304) (3,932)
Acquisition accounting adjustments - 1,410
Total management adjustment items (note 4) (121,063) (107,361)
Finance costs (54,867) (66,325)
Profit before income tax from continuing operations 270,132 324,363
Geographical Information
Geographical allocation of external revenue
Geographical allocation of non-current assets
2021$000
2020$000
2021$000
2020$000
Australia 203,404 185,889 198,693 174,998
United Kingdom 324,983 388,408 217,312 225,199
United States 1,185,405 1,201,873 2,200,938 2,238,014
Canada 180,245 185,577 173,453 164,381
Hong Kong 160,752 108,804 69,851 69,703
Switzerland 73,039 60,158 402,806 400,269
Other countries 153,333 146,572 86,785 84,330
Total 2,283,161 2,277,281 3,349,838 3,356,894
Revenues are allocated based on the countries in which the entities are located. The parent entity is domiciled in Australia. Revenue from external customers in countries other than Australia amounts to $2,079.8 million (2020: $2,091.4 million).
Non-current assets exclude financial instruments and deferred tax assets and are allocated to countries based on where the assets are located. Non-current assets held in countries other than Australia amount to $3,151.1 million (2020: $3,181.9 million).

80
6. INCOME TAX EXPENSE AND BALANCESThe income tax expense represents tax on the pre-tax accounting profit adjusted for income and expenses never to be assessed or allowed for taxation purposes. This is also adjusted for changes in deferred tax assets and liabilities attributable to temporary differences between the tax bases of assets and liabilities and their carrying amounts in the financial statements and unused tax losses. The income tax expense is calculated on the basis of the tax laws enacted or substantively enacted at the end of the reporting period.
Income tax expense is recognised in profit or loss, except to the extent that it relates to items recognised in other comprehensive income or directly in equity. In this case, tax is also recognised in other comprehensive income or directly in equity, respectively.
(a) Income tax expense
2021$000
2020$000
Current tax expense
Current tax expense 56,058 98,026
Under/(over) provided in prior years (1,479) (2,131)
Total current tax expense 54,579 95,895
Deferred tax expense/(benefit)
Decrease/(increase) in deferred tax assets 17,014 (7,031)
(Decrease)/increase in deferred tax liabilities 9,340 2,768
Total deferred tax expense/(credit) 26,354 (4,263)
Total income tax expense 80,933 91,632
(b) Numerical reconciliation of income tax expense to prima facie tax payable
Profit before income tax expense 270,132 324,363
Prima facie income tax expense thereon at 30% 81,040 97,309
Variation in tax rates of foreign controlled entities (4,357) 25
Tax effect of permanent differences:
Non-deductible expenses related to Wells Fargo acquisition 1,823 -
Prior year tax (over)/under provided (1,479) (2,131)
Withholding tax not creditable 1,353 6,266
Non-deductible lease related provisions 805 -
Effect of changes in tax rates and laws (38) (1,213)
Benefit of tax losses not previously recognised on Equatex acquisition - (7,666)
One-off tax expense on Equatex IP restructure - (1,054)
Net other 1,786 96
Income tax expense / (credit) 80,933 91,632
(c) Amounts recognised directly in equity
Deferred tax – share-based remuneration 398 253
Deferred tax – share rights issue costs 626 -
1,024 253
(d) Tax benefit/ (expense) relating to items of other comprehensive income
Cash flow hedges 2,244 (3,564)
Net investment hedges (2,756) 3,680
(512) 116

81 | COMPUTERSHARE | ANNUAL REPORT | 2021
NOTES TO THE CONSOLIDATED FINANCIAL STATEMENTS
(e) Unrecognised tax lossesAs at 30 June 2021, companies within the consolidated entity had estimated unrecognised tax losses of $4.1 million (2020: $6.6 million) available to offset against future years’ taxable income. Tax losses of $3.4 million will expire between 2022 and 2028.
Deferred tax balancesDeferred tax assets and liabilities are recognised for temporary differences calculated at the tax rates expected to apply when the differences reverse. Deferred tax assets are recognised for deductible temporary differences and unused tax losses to the extent it is probable that future taxable amounts will be available to utilise them. Deferred tax assets and liabilities are offset when there is a legally enforceable right to offset current tax assets and liabilities and when the deferred tax balances relate to the same taxation authority.
Deferred tax assets and liabilities are not recognised for temporary differences between the carrying amount and tax bases of investments in controlled entities where the parent entity is able to control the timing of the reversal of the temporary differences and it is probable that the differences will not reverse in the foreseeable future.
Deferred tax assets
2021$000
2020$000
The balance comprises temporary differences attributable to:
Tax losses 33,200 30,004
Employee benefits 9,409 6,163
Property, Plant & Equipment 4,719 3,927
Deferred revenue 3,145 2,509
Doubtful debts 3,194 3,330
Provisions 20,125 19,427
Finance leases 47,560 35,843
Other creditors & accruals 8,689 8,436
Financial instruments and foreign exchange 67,854 77,239
Share based remuneration 5,389 3,610
Intangibles 28,357 27,276
Mortgage servicing related liabilities 44,204 67,554
Other 3,195 2,098
Total deferred tax assets 279,040 287,416
Set-off of deferred tax liabilities pursuant to set-off provisions (129,911) (126,263)
Net deferred tax assets 149,129 161,153
Movements during the year
Opening balance at 1 July 161,153 139,179
Change in accounting policy - 40,640
Opening balance at 1 July (restated) 161,153 179,819
Currency translation difference 10,370 (1,999)
Credited/(charged) to profit or loss (17,014) 7,031
Credited/(charged) to equity 1,024 253
Credited/(charged) to other comprehensive income (2,756) 3,680
Set-off of deferred tax liabilities (3,648) (28,328)
Arising from acquisitions/(disposals) - 697
Closing balance at 30 June 149,129 161,153
The total deferred tax assets expected to be recovered after more than 12 months amounts to $172.6 million (2020: $188.5 million).

82
Deferred tax liabilities
2021$000
2020$000
The balance comprises temporary differences attributable to:
Goodwill 206,053 198,449
Intangible assets 110,711 118,155
Right-of-use assets 41,104 29,976
Financial instruments and foreign exchange 298 3,065
Other 5,964 3,960
Total deferred tax liabilities 364,130 353,605
Set-off of deferred tax assets pursuant to set-off provisions (129,911) (126,263)
Net deferred tax liabilities 234,219 227,342
Movements during the year:
Opening balance at 1 July 227,342 217,589
Change in accounting policy - 36,917
Opening balance at 1 July (restated) 227,342 254,506
Currency translation difference 3,116 (107)
Charged/(credited) to profit or loss 9,341 2,768
Charged/(credited) to other comprehensive income (309) (2,194)
Set-off of deferred tax assets (3,648) (28,328)
Arising from acquisitions/(disposals) (1,623) 697
Closing balance at 30 June 234,219 227,342
The total deferred tax liabilities expected to be settled after more than 12 months amount to $287.9 million (2020: $352.6 million).
Key estimates and judgementsThe Group is subject to income taxes in Australia and jurisdictions where it has foreign operations. Significant judgement is required in determining the provision for income taxes. There are many transactions and calculations undertaken during the ordinary course of business for which the ultimate tax determination is uncertain. Where the final outcome is different from the amounts that were initially recognised, such differences will impact the current and deferred tax provisions in the period in which such determination is made.
The Group has recognised deferred tax assets relating to carried forward tax losses to the extent that it is probable that future taxable profits will be available against which these assets can be utilised. The assumptions regarding future utilisation, and therefore the recognition of deferred tax assets, may change due to future operating performance and other factors.
Contingent liability – Australian thin capitalisation
The ATO has previously challenged the inclusion of the Australian Group’s intangible assets in the thin capitalisation calculation used to determine the amount of tax-deductible interest expense in Australia. The matter has now been resolved and Computershare has been advised that no further action will be taken on the matter. Accordingly, the Group has concluded that there is no longer a contingent liability related to this matter at 30 June 2021 (30 June 2020: contingent liability $20.4 million).

83 | COMPUTERSHARE | ANNUAL REPORT | 2021
NOTES TO THE CONSOLIDATED FINANCIAL STATEMENTS
7. NOTES TO THE CONSOLIDATED CASH FLOW STATEMENT(a) Cash and cash equivalentsCash and cash equivalents comprise cash at bank and on hand, and short-term deposits with original maturities of three months or less that are readily convertible to known amounts of cash and are subject to an insignificant risk of changes in value, net of outstanding bank overdrafts. Cash and cash equivalents exclude broker client deposits reflected in the statement of financial position that are recorded as other current financial assets.
Cash and cash equivalents in the consolidated cash flow statement are reconciled to the consolidated statement of financial position as follows:
2021$000
2020$000
Shown as cash and cash equivalents in the consolidated statement of financial position 816,810 597,313
Cash and cash equivalents in the consolidated cash flow statement 816,810 597,313
(b) Reconciliation of net profit after income tax to net cash from operating activities
Net profit after income tax 189,199 232,731
Adjustments for:
Depreciation and amortisation 239,290 206,168
Net (gain)/loss on asset disposals and revaluation of assets (40,987) -
Net (gain)/loss on lease modifications and terminations 13,761 -
Share of net (profit)/loss of associates and joint ventures accounted for using equity method (389) (239)
Amortisation of USD senior note fair value adjustment to interest expense (20,960) -
Employee benefits – share based expense 20,618 18,833
Fair value adjustments 2,304 3,932
Changes in assets and liabilities:
(Increase)/decrease in receivables 35,359 45,403
(Increase)/decrease in inventories (141) (519)
(Increase)/decrease in loan servicing advances (68,681) 14,442
(Increase)/decrease in other current assets 3,518 33,452
Increase/(decrease) in payables and provisions (54,262) 6,273
Increase/(decrease) in tax balances (11,993) 48,329
Net cash and cash equivalents from operating activities 306,636 608,805
(c) Reconciliation of liabilities arising from financing activities
Current
borrowings$000
Non-current borrowings
$000
Current lease
liabilities$000
Non-current lease
liabilities$000
Cross currency
swap$000
Total$000
Opening balance at 1 July 2020 287,410 1,742,410 43,159 158,910 3,148 2,235,037
Cash flows (68,135) (273,103) (48,476) - (3,183) (392,897)
Non-cash changes:
Additions - - 2,006 74,914 - 76,920
Fair value adjustments - (19,871) - - 188 (19,683)
Transfers and other 101,958 (103,694) 51,366 (51,366) - (1,736)
Currency translation difference 1,143 41,868 2,550 11,030 51 56,642
Balance at 30 June 2021 322,376 1,387,610 50,605 193,488 204 1,954,283
(d) Acquisitions and disposals of businesses For details of businesses acquired during the year and related cash flows refer to note 8.

84
8. BUSINESS COMBINATIONSThe Group continues to seek acquisition and other growth opportunities where value can be added and returns enhanced for the shareholders. The following controlled entities and businesses were acquired by the consolidated entity at the date stated and their operating results have been included in the Group’s results from the acquisition date. Where goodwill is marked as provisional, identification and valuation of net assets acquired will be completed within a 12-month measurement period in accordance with the Group’s accounting policy.
(a) On 1 July 2020, Computershare acquired 100% of Verbatim LLC (Verbatim), a global corporate secretarial managed services provider located in the United States. Total consideration was $9.2 million. The acquisition enhances Computershare’s suite of integrated governance solutions.
This business combination did not materially contribute to the total revenue of the Group.
Details of the acquisition are as follows:
$000
Cash consideration 7,985
Contingent consideration 1,250
Total purchase consideration 9,235
Less fair value of identifiable assets acquired (5,235)
Goodwill on consolidation 4,000
The goodwill recognised is not deductible for tax purposes.
Assets and liabilities arising from this acquisition are as follows:
Fair value$000
Intangible assets 6,650
Receivables 2,519
Cash and cash equivalents 611
Payables (2,840)
Deferred tax liabilities (1,623)
Current tax liabilities (82)
Net assets 5,235
Purchase consideration:
$000
Inflow/(outflow) of cash to acquire the entities, net of cash acquired:
Cash balance acquired 611
Less cash paid (7,985)
Net inflow/(outflow) of cash (7,374)
(b) On 24 March 2021, the Group entered into an agreement to acquire the assets of Wells Fargo Corporate Trust Services (“CTS”), a leading US based provider of trust and agency services to government and corporate clients. The acquisition is a highly strategic fit with Computershare’s existing Canadian and US corporate trust operations and is expected to increase scale and market share in the US corporate trust market.
The agreed cash consideration of $750 million to be paid on completion will be funded through a combination of debt and cash proceeds from the rights issue (note 27). The acquisition is subject to customary closing conditions, which are expected to conclude by the end of calendar year 2021. All required regulatory approvals have been received post year-end.
The acquisition method of accounting is used to account for all business combinations, regardless of whether equity instruments or other assets are acquired. The consideration transferred for the acquisition of a controlled entity comprises the fair value of the assets transferred, the liabilities incurred and the equity interests issued by the Group. The consideration transferred also includes the fair value of any contingent consideration arrangement and the fair value of any pre-existing equity interest in the controlled entity.
Acquisition-related costs are expensed as incurred. Identifiable assets acquired as well as liabilities and contingent liabilities assumed in a business combination are, with limited exceptions, measured initially at their fair values at the acquisition date. Within 12 months of completing the acquisition, identifiable intangible assets are valued and separately recognised in the statement of financial position. On an acquisition-by-acquisition basis, the Group recognises any non-controlling interest in the acquiree either at fair value or at the non-controlling interest’s proportionate share of the acquiree’s net identifiable assets.

85 | COMPUTERSHARE | ANNUAL REPORT | 2021
NOTES TO THE CONSOLIDATED FINANCIAL STATEMENTS
The excess of the consideration transferred, the amount of any non-controlling interest in the acquiree and the acquisition-date fair value of any previous equity interest in the acquiree over the fair value of the Group’s share of the net identifiable assets acquired is recorded as goodwill. If those amounts are less than the fair value of the net identifiable assets of the controlled entity acquired and the measurement of all amounts has been reviewed, the difference is recognised directly in profit or loss as a gain on bargain purchase.
Contingent consideration is classified either as equity or a financial liability. Amounts classified as a financial liability are subsequently re-measured to fair value with changes in fair value recognised in profit or loss.
Key estimates and judgementsAcquisition accounting requires that management make estimates with regard to valuation of certain non-monetary assets and liabilities of the acquired entities. These estimates have particular impact in terms of valuation of intangible assets, contingent consideration liabilities and provisions. To the extent that these items are subject to determination during the initial 12 months after acquisition, the variation to estimated value will be adjusted through goodwill. To the extent that determination occurs after 12 months, any variation will impact profit or loss in the relevant period.
9. INTANGIBLE ASSETS
Goodwill$000
Customer contracts
and relationships
$000
Mortgage Servicing
Rights$000
Other3
$000Total
$000
At 1 July 2020
Opening cost 1,857,127 747,195 1,034,131 100,374 3,738,827
Opening accumulated amortisation - (324,815) (321,744) (39,442) (686,001)
Opening net book amount 1,857,127 422,380 712,387 60,932 3,052,826
Additions (net of adjustments and reclassifications)1 4,421 6,387 166,778 1,609 179,195
Disposals - - (61,303) - (61,303)
Amortisation charge2,4 - (52,264) (139,397) (13,026) (204,687)
Currency translation difference 50,799 9,461 - 2,760 63,020
Closing net book amount 1,912,347 385,964 678,465 52,275 3,029,051
At 30 June 2021
Cost 1,912,347 773,218 1,139,593 105,732 3,930,890
Accumulated amortisation - (387,254) (461,128) (53,457) (901,839)
Closing net book amount 1,912,347 385,964 678,465 52,275 3,029,051
At 1 July 2019
Opening cost 1,768,025 688,864 763,296 98,266 3,318,451
Opening accumulated amortisation - (275,231) (219,374) (41,166) (535,771)
Opening net book amount 1,768,025 413,633 543,922 57,100 2,782,680
Additions (net of adjustments and reclassifications)1 94,996 60,884 270,959 6,703 433,542
Amortisation charge2,4 - (52,846) (102,494) (11,366) (166,706)
Currency translation difference (5,894) 709 - 579 (4,606)
Transfers and other - - - 7,916 7,916
Closing net book amount 1,857,127 422,380 712,387 60,932 3,052,826
At 30 June 2020
Cost 1,857,127 747,195 1,034,131 100,374 3,738,827
Accumulated amortisation - (324,815) (321,744) (39,442) (686,001)
Closing net book amount 1,857,127 422,380 712,387 60,932 3,052,826
1 Additions comprise recognition of intangible assets resulting from business combinations and direct purchases as well as adjustments and reclassifications made on finalisation of acquisition accounting.
2 Amortisation charge is included within direct services expense in the statement of comprehensive income.
3 Other intangible assets include intellectual property, licences, software and brands.
4 The gross amount of mortgage servicing rights amortisation is partially offset in the statement of comprehensive income by the amortisation of the related mortgage servicing liabilities (note 3).

86
GoodwillGoodwill represents the excess of the cost of an acquisition over the fair value of the Group’s share of the net identifiable assets acquired. Goodwill is carried at cost less accumulated impairment losses and is tested for impairment annually or more frequently, if events or changes in circumstances indicate that it might be impaired. On disposal or termination of a previously acquired business, any associated goodwill is included in the determination of profit or loss on disposal.
The acquired goodwill can be attributed to the expected future cash flows of the acquired businesses associated with the collective experience of management and staff and the synergies expected to be achieved as a result of full integration into the Computershare Group. Where acquisitions have been made during the period, the Group has 12 months from the acquisition date in which to finalise the accounting, including calculation of goodwill. Until finalisation of acquisition accounting within the 12-month period, provisional amounts are included in the consolidated results.
Acquired intangible assetsAcquired intangible assets have a finite useful life and are carried at fair value at the date of acquisition less accumulated amortisation and impairment losses. Amortisation is calculated using the straight line method to allocate value over their estimated useful lives, typically ranging from one to twenty years.
Mortgage servicing rightsMortgage servicing rights acquired as part of business combinations are carried at their fair value at the date of acquisition less accumulated amortisation and impairment losses. Mortgage servicing rights acquired as part of ongoing operations are carried at cost less accumulated amortisation and impairment losses. Amortisation for all servicing rights is calculated using the straight line method over their estimated useful lives of eight years for the interest-sensitive portfolio and nine years for the non interest-sensitive portfolio.
Key estimates and judgementsThe estimated useful life of mortgage servicing rights reflects management’s estimate of the average life of the underlying mortgages. The most significant factors impacting the useful life are US mortgage interest rates and the rate of the borrowers’ prepayments. The average life of mortgage servicing rights decreases where US interest rates are lower or borrower prepayments are higher than previously estimated, which would result in an increase in amortisation expense. As a result of the decreases in the US interest rates that occurred during the prior year, the useful life estimate of the interest-sensitive part of the total portfolio was revised downwards from nine years to eight years effective from 1 July 2020, resulting in higher amortisation expense during the reporting period.
Software and research and development costsAll research-related costs are expensed as incurred. Software development costs are capitalised where they meet the recognition criteria for capitalisation, and are subsequently amortised using the straight line method to allocate their value over their estimated useful lives, typically ranging from eight to fifteen years.
Costs incurred in configuring or customising software as a service (SaaS) arrangements can only be recognised as intangible assets if the implementation activities create an intangible asset that the entity controls and the intangible asset meets the recognition criteria. Those costs that do not result in intangible assets are expensed as incurred, unless they are paid to the suppliers of the SaaS arrangements to significantly customise the cloud-based software for the Group, in which case the costs are recorded as a prepayment for services and amortised over the expected renewable term of the arrangement.
Impairment of intangible assets with a finite useful lifeIntangible assets with a finite useful life are tested for impairment whenever events or changes in circumstances indicate that the carrying amount may not be recoverable. An impairment loss is recognised for the amount by which the asset’s carrying amount exceeds its recoverable amount. As intangible assets do not generate independent cashflows, they are tested for impairment at the CGU level to which they belong.
10. IMPAIRMENTImpairment test for goodwillGoodwill is tested for impairment at least once a year, or more frequently if events or changes in circumstances indicate that the carrying amount may not be recoverable. Where required, impairment losses are recognised in profit or loss in the reporting period when the carrying amount exceeds recoverable amount. The recoverable amount is the higher of an asset’s fair value less costs to sell and value in use.
For the purpose of impairment testing, assets are grouped at the lowest levels for which there are largely independent cash inflows (cash generating units). Goodwill is allocated to cash generating units (CGUs), or groups of CGUs, expected to benefit from synergies of the business combination.

87 | COMPUTERSHARE | ANNUAL REPORT | 2021
NOTES TO THE CONSOLIDATED FINANCIAL STATEMENTS
The carrying amount of goodwill is allocated to the following groups of CGU’s constituting most of the Group’s operating segments:
30 June 2021$000
30 June 2020$000
Class Actions and Bankruptcy 90,114 89,901
Communication Services and Utilities 121,103 115,230
Corporate Trust 78,897 72,529
Employee Share Plans 398,619 383,057
Issuer Services 1,045,679 1,021,978
Mortgage Services and Property Rental Services 165,435 163,341
Voucher Services 12,500 11,091
1,912,347 1,857,127
When testing for impairment, the carrying amount of each group of CGUs is compared with its recoverable amount. The recoverable amount is determined based on a value-in-use calculation for each group of CGUs to which goodwill has been allocated. The value-in-use calculation uses the discounted cash flow methodology for each CGU typically based upon five years of cash flow projections plus a terminal value. In a limited number of cases, the CGU cash flow projections are for a period longer than five years to account for the nature of the cash flows and specific circumstances (eg, CGUs in a wind-down mode).
No impairment charge has been recognised for the financial year ended 30 June 2021.
Key estimates and judgementsKey assumptions used in the value-in-use calculations are described below for each group of CGUs with allocated goodwill. The impact of the Covid-19 pandemic was included in estimates of the five-year cash flow projections. Given the evolving nature of Covid-19 and uncertainty around the extent of its duration and economic impact, changes to estimates and assumptions may arise in the future.
As there are a number of CGUs in most of the operating segments, presented below are weighted averages of the assumptions applied to individual CGUs.
Five-year post-tax cash flow projections are based on approved budgets covering a one-year period, with subsequent periods based on the Group’s expectations of growth excluding the impact of possible future acquisitions, business improvement and restructuring. Cash flows also include margin income projections, which reflect expectations regarding future client balances and interest rates.
The earnings growth rates applied beyond the initial five-year period are as follows:
2021 2020 2021 2020
Class Actions and Bankruptcy 2.0% 2.0% Class Actions and Bankruptcy 8.7% 9.4%
Communication Services and Utilities
2.0% 2.0% Communication Services and Utilities
9.3% 9.6%
Corporate Trust 2.0% 2.0% Corporate Trust 8.7% 9.4%
Employee Share Plans 1.9% 1.9% Employee Share Plans 8.4% 8.1%
Issuer Services 2.1% 2.0% Issuer Services 8.8% 9.2%
Mortgage Services and Property Rental Services
2.0% 2.0% Mortgage Services and Property Rental Services
8.5% 9.0%
Voucher Services1 n/a n/a Voucher Services 24.0% 20.4%
In performing the value-in-use calculations for each CGU, the Group has applied post-tax discount rates to discount the forecast future attributable post-tax cash flows. The discount rates used reflect the risks specific to each CGU.
The equivalent pre-tax discount rates are as follows:
1 There is no terminal value for Voucher Services as the business is in wind-down mode.
Impact of reasonably possible changes in key assumptionsAs impairment testing is based on assumptions and judgements, the Group has considered sensitivity of the impairment test results to changes in key assumptions. For all operating segments, the recoverable amount exceeds the carrying amount when testing for reasonably possible changes in key assumptions.

88
11. HEDGE ACCOUNTINGThe Group applies hedge accounting as follows:
Fair value hedge Cash flow hedgeHedge of net investment in foreign operations
Nature of hedge The hedge of fair value risk of a financial liability.
The hedge of a highly probable forecast transaction. The hedge of changes in theconsolidated entity’s foreign denominated net assets due to changes in foreign currency rates.
Hedged risk Interest rate risk Interest rate risk Foreign exchange risk Foreign exchange risk
Hedged item Fixed interest rate US Private Placement issues.
Highly probable interest cash flows from which margin income is derived.
Highly probable cash flows associated with foreign currency denominated debt.
Foreign operations
Hedging instruments
Interest rate swaps Interest rate swaps Cross currency swaps Cross currency swaps, foreign currency denominated issued debt
Designation anddocumentation
At the inception of the transaction, the Group documents its risk management objective and strategy for the hedge, hedging instrument, hedged item, hedged risk and how the hedge relationship will meet the hedge effectiveness requirements.
Hedgeeffectivenessmethod
Hedge effectiveness is determined at the inception of the hedge relationship, and through periodic prospective effectiveness assessments to ensure that an economic relationship exists between the hedged item and hedging instrument. The assessment is based on:> existence of an economic relationship between the hedged item and the hedging instrument> the effect of credit risk not dominating the changes in value of either the hedged item or the hedging instrument> the hedge ratio being reflective of the Group’s risk management approach.
Accountingtreatment forthe hedginginstrument
Fair value through the income statement.
Fair value through the cash flow hedge reserve and then recognised in the income statement at the time at which the hedged item affects the income statement for the hedged risk.
Fair value through the cash flow hedge reserve and then recognised in the income statement at the time at which the hedged item affects the income statement for the hedged risk.
Fair value through the foreign currency translation reserve and recognised in the income statement at the time at which there is a disposal of the hedged foreign operation.
Accountingtreatmentfor thehedged item
Carrying value adjusted for changes in fair value attributable to the hedged risk; fair value through the income statement.
Accounted for under other accounting standards (revenue).
Accounted for under other accounting standards (foreign exchange).
Foreign exchange gains and losses are recognised in the Group’s foreign currency translation reserve.
Accountingtreatmentfor hedgeineffectiveness
Recognised in the income statement to the extent that changes in fair value of the hedged item attributable to the hedged risk are not offset by changes in fair value of the hedging instrument.
Recognised in the income statement to the extent to which changes in fair value of the hedging instrument exceed, in absolute terms, the change in the fair value of the hedged item.
Recognised in the income statement to the extent to which changes in fair value of the hedging instrument exceed, in absolute terms, the change in the fair value of the hedged item.
Recognised in the income statement to the extent to which changes in fair value of the hedging instrument exceed, in absolute terms, the change in the fair value of the hedged item.
Accountingtreatment ifthe hedgerelationship isdiscontinued
Where the hedged item still exists, adjustments to the hedged item are amortised to the income statement on an effective interest rate basis.
The gain or loss remains in the cash flow hedge reserve to the extent that the hedged cash flows are still expected to take place and subsequently recognised in the income statement at the time at which the hedged item affects the income statement for the hedged risk. Where the hedged cash flows are no longer expected to take place, the gain or loss in the cash flow hedge reserve is recognised immediately in the income statement.
The gain or loss remains in the cash flow hedge reserve to the extent that the hedged cash flows are still expected to take place and subsequently recognised in the income statement at the time at which the hedged item affects the income statement for the hedged risk. Where the hedged cash flows are no longer expected to take place, the gain or loss in the cash flow hedge reserve is recognised immediately in the income statement.
The gain or loss remains recognised in the foreign currency translation reserve until such time as the foreign operation is partially disposed of or sold.
Hedge ratio The hedge ratio is reflective of the Group’s risk management objectives.
The notional of the interest rate swap is allocated to the hedged item on a one-for-one basis.
The notional of the interest rate swap is allocated to hedged item on a one-for-one basis.
The notional amount of the cross currency swap equals the notional amount of the hedged item.
Foreign currency borrowings and swaps are allocated to the net investments in foreign operations on a one-for-one basis.

89 | COMPUTERSHARE | ANNUAL REPORT | 2021
NOTES TO THE CONSOLIDATED FINANCIAL STATEMENTS
Hedging instruments The following table details the hedging instruments, nature of hedged risks, as well as the notional and the carrying amount of derivative financial instruments and, in the case of net investment hedges, the notional of foreign denominated debt issued, for each type of hedge relationship. The maturity profile for the hedging instruments’ notional amounts is reported based on their contractual maturity. Designated cross-currency swaps for foreign exchange risk are included as a single notional amount per derivative.
2021
Hedging Instrument Risk Notional
Carrying amount
Less than 3 months
$000
3 to 12 months
$000
1 to 5 years $000
Over 5 years $000
Total $000
Total $000
Assets
Cash flow hedges Interest rate swaps Interest - - 22,540 - 22,540 319
Net investment hedges Cross currency swaps Foreign exchange - 298,608 - - 298,608 13
Liabilities
Net investment hedges Cross currency swaps Foreign exchange - 170,700 - - 170,700 218
Fair value hedges Interest rate swaps Interest - - - 350,000 350,000 1,314
2020
Assets
Cash flow hedges Interest rate swaps Interest 50,000 40,000 20,588 - 110,588 1,114
Cash flow hedges Cross currency swaps Foreign exchange - 100,000 100,000 130
Net investment hedges Cross currency swaps Foreign exchange - 183,812 - - 183,812 308
Liabilities
Net investment hedges Cross currency swaps Foreign exchange - 268,026 - - 268,026 3,456
Net investment hedges Borrowings Foreign exchange - - 100,789 - 100,789 100,789
Hedging instrument executed ratesThe following table shows the executed rates for the hedging instruments that have been designated in cash flow hedges and net investment hedges that are in place at balance date.
Hedging instruments Currency/Currency pair Weighted average
hedged rate
Cash flow hedges Interest rate swaps AUD 0.95%
Net investment hedges Cross currency swaps EUR/AUD 0.6328
CHF/AUD 0.6935
Hedge ineffectivenessHedge ineffectiveness, in the case of a fair value hedge, is the extent to which the changes in the fair value of the hedging instrument differ to that of the hedged item, and in the case of cash flow and net investment hedge relationships, the extent to which the change in the hedging instrument exceeds that of the hedged item. Sources of hedge ineffectiveness primarily arise from changes in credit risk of the counterparties, breakdown in correlation or impact of the basis spread between short-term interest rates in the same currency changes in market premiums and differences in reset dates, risk and discount rates between the hedged item (possibly represented by a hypothetical derivative) and hedging instrument. The effects of the forthcoming IBOR reforms, as outlined below, may also result in hedge ineffectiveness.
The following table reflects the hedge ineffectiveness during the period, as reported in direct services in the statement of comprehensive income:
Hedging instruments Risk
Gains/(losses)on hedging
instruments
Gains/(losses)on hedged items
attributable to the hedged risk
Hedgeineffectiveness
recognised in theincome statement
$000’s $000’s $000’s
2021
Cash flow hedges Interest rate swaps Interest (117) 127 10
Cash flow hedges Cross currency swaps Foreign exchange (9,350) 9,350 -
Fair value hedges Interest rate swaps Interest (1,314) (1,000) (2,314)
Net investment hedges Cross currency swaps Foreign exchange 9,082 (9,082) -
2020
Cash flow hedges Interest rate swaps Interest 13,810 (13,837) (27)
Cash flow hedges Cross currency swaps Foreign exchange (1,145) 1,145 -
Fair value hedges Interest rate swaps Interest 47,083 (51,718) (4,635)
Net investment hedges Cross currency swaps Foreign exchange (12,112) 12,118 6

90
Effect of IBOR reformFollowing the financial crisis, the reform and replacement of benchmark interest rates such as USD LIBOR and other interbank offered rates (‘IBORs’) has become a priority for global regulators. The Group’s risk exposure that is directly affected by the interest rate benchmark reform are some of the Group’s fixed-interest US Private Placement issues. These notes are hedged, using interest rate swaps, for changes in fair value attributable to USD LIBOR that is the current benchmark interest rate. However, as part of the reforms noted above, the UK Financial Conduct Authority (‘FCA’) has decided to no longer compel panel banks to participate in the USD LIBOR submission process after 30 June 2023 and to cease oversight of these benchmark interest rates. Regulatory authorities and private sector working groups, including the International Swaps and Derivatives Association (‘ISDA’) and the Working Group on Sterling Risk-Free Reference Rates, have been discussing alternative benchmark rates for USD LIBOR.
It is currently expected that SOFR (Secured Overnight Financing Rate) will replace USD LIBOR. There are key differences between USD LIBOR and SOFR. USD LIBOR is a ‘term rate’, which means that it is published for a borrowing period (such as 1 month or 3 months), and it is ‘forward looking’, because it is published at the beginning of the borrowing period. SOFR is currently a ‘backward-looking’ rate, based on overnight rates from actual transactions, and it is published at the end of the overnight borrowing period. Furthermore, USD LIBOR includes a credit spread over the risk-free rate, which SOFR does not. To transition existing contracts and agreements that reference USD LIBOR to SOFR, adjustments for term differences and credit differences might need to be applied to SOFR, to enable the two benchmark rates to be economically equivalent on transition.
The Group currently has three contracts which reference USD LIBOR and extend beyond 2023 ($350 million notional value). The Group currently anticipates that the areas of greatest change are updating systems and processes which capture USD LIBOR-referenced contracts, amendments to those contracts, and updating hedge designations. The Group continues to engage with industry participants to ensure an orderly transition to SOFR and to minimise the risks arising from transition.
12. FINANCIAL RISK MANAGEMENTFinancial risk management objectivesThe Group’s activities expose it to a variety of financial risks: market risk (including foreign exchange risk and interest rate risk), liquidity risk and credit risk. The Group’s overall financial risk management is carried out by a central treasury department (Group Treasury) under policies approved by the Board. The Board provides guidance for overall risk management, as well as policies covering specific areas such as currency risk management, interest rate risk management, counterparty risk management and the use of derivative financial instruments. Derivative financial instruments are used to manage specifically identified interest rate and foreign currency risks.
The Group Treasury function provides services to the business. It also monitors and manages the financial risks relating to the operations of the Group. Group Treasury identifies, evaluates and hedges financial risks in close cooperation with the regional treasury centres as permitted under policy and reports regularly to the Board.
Capital risk management objectives The primary objective of the Group’s capital management is to ensure that it minimises the working capital funding requirements through effective controls in order to support its businesses and maximise shareholder value.
A key financial ratio for the Group is net financial indebtedness to management adjusted earnings before interest, tax, depreciation and amortisation (management adjusted EBITDA). Net debt is calculated as borrowings less cash and cash equivalents. EBITDA is reported based on the currently applicable accounting standards, including AASB 16 Leases
2021$000
2020$000
Borrowings 1,709,986 2,029,820
Cash and cash equivalents (816,810) (597,313)
Net debt 893,176 1,432,507
Management adjusted EBITDA 628,234 646,361
Net debt to management adjusted EBITDA 1.42 2.22
Net debt to management adjusted EBITDA (excluding mortgage servicing debt)1 1.07 1.93
1 Excludes mortgage servicing debt of $219.5 million (2020: $187.5 million).
The Group manages its capital structure and makes adjustments to it in line with changes in economic conditions. To achieve its target capital structure, the Group may adjust the dividend payment to shareholders, conduct share buy-backs or issue new shares.
Computershare has a target neutral gearing level such that net debt to EBITDA is between 1.75x – 2.25x excluding the non-recourse SLS advance facility debt, with flexibility to temporarily go above this range to take advantage of compelling investment opportunities. Computershare will consider capital management initiatives to maintain leverage within this target band.
On 24 March 2021, Computershare announced a fully underwritten pro rata accelerated renounceable entitlement offer under which eligible shareholders were entitled to subscribe for 1 share for every 8.8 shares held, at a price of AUD$13.55 per share (a 9.6% discount to the closing price on 23 March 2021). The offer comprised an institutional entitlement offer (which completed on 7 April 2021) and a retail entitlement offer (which completed on 29 April 2021). The proceeds from the rights issue were used to repay borrowings and will be used to partially fund the CTS acquisition (note 8b). The timing of the rights issue relative to the projected financial close of the CTS acquisition has resulted in a temporary material reduction in the gearing level at balance date.

91 | COMPUTERSHARE | ANNUAL REPORT | 2021
NOTES TO THE CONSOLIDATED FINANCIAL STATEMENTS
Financial risk factors The key financial risk factors that arise from the Group’s activities are outlined below.
(a) Interest rate risk Interest rate risk arises from the possibility that changes in interest rates will affect future cash flows or fair values of financial instruments. The consolidated entity is exposed to interest rate risk through its primary financial assets and liabilities and as a result of maintaining agent and escrow agent bank accounts on behalf of clients. Given the nature of the client balances, neither the funds nor an offsetting liability are included in the Group’s financial statements. Average client balances during the year approximated $18.8 billion (2020: $17.2 billion) and in relation to these balances, the consolidated entity has in place interest rate derivatives totalling $22.5 million notionally (2020: $110.6 million).
Hedging strategy
i) Fixed rate debt
Where fixed rate debt is issued, the Group may enter interest rate derivatives to manage the change in fair value of fixed rate debt obligations, arising from changes in variable interest rates. At 30 June 2021, interest rate derivatives totalling $350.0 million hedging the fair value of fixed rated debt obligations were outstanding.
ii) Margin income
Interest rate risk is managed in accordance with Board approved policy, which sets out minimum/maximum thresholds with respect to currency and maturities of margin income balances. Floating rate debt is considered a natural hedge against margin income balances and forms part of the hedge allocation required to meet policy guidelines. The Group also uses interest rate swaps designated as cash flow hedges to manage the variability of cash flows attributable to changes in interest rates associated with highly probable interest earned on client balances (margin income).
At 30 June, 2021, $22.5 million notional value of interest rate swaps designated as a cash flow hedge of margin income were outstanding.
Interest rate sensitivity
The table below provides an indication of sensitivity of the Group’s profit before tax and other components of equity to movements in interest rates with all other variables held constant.
2021$000
2020$000
Movement in basis points +50 -50 +50 -50
Sensitivity of profit before tax
Australian dollar 2,812 (2,812) 955 (955)
United States dollar 256 (256) (399) 399
Canadian dollar 895 (895) 468 (468)
Great British pound (1,541) 1,541 (1,136) 1,136
Euro (303) 303 (306) 306
Swiss Franc (1,561) 1,561 (1,588) 1,588
Hong Kong dollar 274 (274) - -
Other 96 (96) 261 (261)
Total 928 (928) (1,745) 1,745
Sensitivity of other components of equity
United States dollar - - (51) 51
Australian dollar (382) 390 (453) 464
The sensitivity of profit before tax is the effect of assumed reasonably possible changes in interest rates for one year, based on the on-balance sheet floating rate financial assets and liabilities as at 30 June 2021. Other components of equity change as a result of an increase/decrease in the fair value of cash flow hedges. The total sensitivity analysis is based on the assumption that there are parallel shifts in the yield curve.
The above sensitivity calculation includes the impact of changes in interest rates on the fair value of recognised derivatives but excludes the impact on interest income derived from certain client balances. Client balances have been excluded from the sensitivity analysis where they are not reflected in the Group’s consolidated statement of financial position. Interest income is earned on these balances at various fixed and floating interest rates. In a rising interest rate environment, client balances that earn interest income will result in an increase to profit, while in a falling interest rate environment, client balances that earn interest income will result in a decrease to profit.

92
Total margin income generated on client balances for the year was $107.0 million (2020: $199.4 million), reflecting a yield of 0.57% (2020: 1.16%) on average client balances. The decline in margin income reflects the annualised impact of the global interest rate cuts in early 2020, as central banks around the world responded to the global pandemic. If the Group was able to achieve an additional yield of 0.25% on the total average balances of $18.8 billion held during the reporting period, the Group’s profit before tax would have increased by $47 million (-0.25%: $47 million decrease).
(b) Foreign exchange riskForeign exchange risk arises from future commercial transactions and recognised assets and liabilities denominated in a currency that is not the relevant entity’s functional currency.
Entities within the Group typically enter into external transactions and recognise external assets and liabilities that are denominated in their functional currency. Whilst a number of entities within the Group hold bank account balances in a currency which is not their local functional currency, these balances do not expose the Group to significant foreign exchange risk.
Foreign currency translation risk also arises from net investments in foreign operations held in Europe, Canada, South Africa and Asia Pacific. Accordingly, the Group’s financial position can be affected significantly by movements in the relevant currency exchange rate when translating into the consolidated entity’s presentation currency, the United States dollar.
Hedging strategy
The risk of changes in the net investments in foreign operations as a result of movements in foreign exchange rates is hedged through a combination of foreign denominated borrowings and cross-currency swaps, in currencies that match the currencies of the Group’s foreign operations.
Exchange rate sensitivity
The following table illustrates the sensitivity of the Group’s net assets (after hedging), with all other variables held constant, to movements in the United States dollar against foreign currencies as at 30 June 2021. The currencies with largest impact on the sensitivity analysis are Canadian dollar, Australian dollar, Great British pound and Swiss Franc. As a result of the exchange rate volatility observed during the year, the Group has revised its assessment of reasonably possible changes in exchange rates to 10% (2020: 5%).
2021$000
2020$000
Movement in exchange rates % +10% -10% +5% -5%
Sensitivity of other components of equity
Canadian dollar (37,180) 37,180 (13,510) 13,510
Australian dollar (77,813) 77,813 (17,752) 17,752
Great British pound 25,063 (25,063) 10,031 (10,031)
Swiss Franc (12,010) 12,010 (4,572) 4,572
(c) Credit risk Credit exposure represents the extent of credit related losses that the consolidated entity may be subject to on amounts to be received from financial assets, which include receivables, loan servicing advances, cash and cash equivalents and other financial instruments. The consolidated entity, while exposed to credit related losses in the event of non-payment by clients, does not expect any significant clients to fail to meet their obligations. The Group’s trading terms do not generally include the requirement for customers to provide collateral as security for financial assets and consequently, the consolidated entity does not hold any collateral as security. Whilst collateral is not held as security for loan servicing advances, as outlined in note 16, loan servicing advances receive priority over any other liability from the proceeds from the liquidation of the property.
The consolidated entity’s exposure to credit risk is as indicated by the carrying amounts of its financial assets. Concentrations of credit risk exist when clients have similar economic characteristics that would cause their ability to meet contractual obligations to be similarly affected by changes in economic or other conditions. The consolidated entity’s concentration of credit risk is minimised due to transactions with a large number of clients in various countries and industries. Issuer services and plans services transacts with various listed companies across a number of countries. The consolidated entity does not have a significant exposure to any individual client.
Transactions involving derivative financial instruments are with counterparties with whom the Group has signed International Swaps and Derivatives Association (ISDA) agreements and who maintain sound credit arrangements. To supplement credit ratings of counterparties the Group has a Board approved policy on managing client balance exposure and derivative instrument exposure.

93 | COMPUTERSHARE | ANNUAL REPORT | 2021
NOTES TO THE CONSOLIDATED FINANCIAL STATEMENTS
(d) Liquidity RiskLiquidity risk management implies maintaining sufficient cash and the availability of funding. The Group has staggered its various debt maturities to reduce re-financing risk. Whilst impacted by acquisitions from time to time, the Group maintains sufficient cash balances and committed credit facilities to meet ongoing commitments.
Maturity information for the Group’s debt facility is as follows:
Maturity profile (in the 12 months ending)
Debt facilities utilised
$million
Committed debt facilities
$million
June 2022 322.5 510.0
June 2023 540.7 1,050.0
June 2024 220.0 770.0
June 2025 - -
June 2026 200.0 200.0
June 2027 - -
June 2028 - -
June 2029 350.0 350.0
Total 1,633.2 2,880.0
Since balance date, the Group has executed a 12 month facility extension (to August 2022) on $125m SLS Advance Facility and appointed Arrangers in preparation for a Debt Capital Markets issuance planned to execute in 1H22.
Maturities of financial liabilitiesThe table below breaks down the Group’s financial liabilities into relevant maturity groupings.
The amounts disclosed in the table are the contractual undiscounted cash flows. For interest rate swaps, the cash flows have been estimated using the forward interest rates applicable at the end of the reporting period.
Contractual maturities of financial liabilitiesLess than
1 year$000
Between 1-5 years
$000
More than 5 years
$000
Total contractual cash flows
$000
As at 30 June 2021
Non-derivatives
Trade payables 19,889 - - 19,889
Other payables 471,871 3,061 - 474,932
Borrowings 491,919 960,497 388,150 1,840,566
Lease liabilities (undiscounted) 57,671 137,960 99,090 294,721
Total non-derivatives 1,041,350 1,101,518 487,240 2,630,108
Derivatives
Net Settled (interest rate swaps) 3,246 (530) (2,710) 6
Gross settled (cross currency swaps)
– (Inflow) (473,725) - - (473,725)
– Outflow 470,879 - - 470,879
Total derivatives 400 (530) (2,710) (2,840)
As at 30 June 2020
Non-derivatives
Trade payables 14,682 - - 14,682
Other payables 480,055 1,052 - 481,107
Borrowings 341,329 1,248,351 607,630 2,197,310
Lease liabilities (undiscounted) 49,512 151,907 94,562 295,981
Total non-derivatives 885,578 1,401,310 702,192 2,989,080
Derivatives
Gross settled (cross currency swaps)
– (Inflow) (556,465) - - (556,465)
– Outflow 554,064 - - 554,064
Total derivatives (2,401) - - (2,401)

94
(e) Fair value measurementsThe fair value of financial assets and liabilities must be estimated for recognition and measurement or for disclosure purposes. The measurement hierarchy used is as follows:
Level 1: The fair value of financial instruments traded in active markets is based on quoted market prices at the end of the reporting period for identical assets and liabilities. The quoted market price used for financial assets held by the Group is the current bid price. These instruments are included in level 1.
Level 2: The fair value of financial instruments that are not traded in an active market is determined using valuation techniques which maximise the use of observable market data and rely as little as possible on entity-specific estimates. The Group uses a variety of methods and makes assumptions that are based on market conditions existing at the end of each reporting period. This includes inputs other than quoted prices included within level 1 that are observable for the asset or liability, either directly (as prices) or indirectly (derived from prices). If all significant inputs required to fair value an instrument are observable, the instrument is included in level 2. Such instruments include derivative financial instruments and the portion of borrowings included in the fair value hedge.
Specific valuation techniques used to value financial instruments are as follows:
> Quoted market prices or dealer quotes are used for similar instruments.
> The fair value of interest rate swaps is calculated as the present value of the estimated future cash flows based on observable yield curves.
> The fair value of forward foreign exchange contracts is determined using forward exchange rates at the balance sheet date.
> The fair value of cross currency swaps is a combination of the fair value of forward foreign exchange contracts determined using forward exchange rates at the balance sheet date (for the final principal exchange) and the use of quoted market prices or dealer quotes for similar instruments (for the basis valuation).
> The fair value of interest rate swaptions is calculated using the Black-Scholes formula and quoted market prices.
Level 3: Valuation methodology of the asset or liability uses inputs that are not based on observable market data (unobservable inputs). This is the case of investments in unconsolidated structured entities (refer to note 13), which are included in the financial assets at fair value and deferred consideration (note 24) arising from business combinations.
The amount of contingent consideration recognised on business combinations is typically referenced to revenue or EBITDA targets. The Group estimates the fair value of the expected future payments based on the terms of each earn-out agreement and management’s knowledge of the business taking into account the likely impact of the current economic environment. Contingent consideration amounts are re-measured every reporting period based on most recent projections. Gains or losses arising from changes in fair value are recognised in profit or loss in the period in which they arise.
The fair value of the investment in structured entities is determined by reference to the interest in net assets of these entities, which approximate their fair values. As profits are realised and dividends are paid to investors, the net assets of these entities decrease and so does the fair value of the Group’s investment.
The following tables present the Group’s financial assets and liabilities measured and recognised at fair value at 30 June 2021. The comparative figures are also presented below.
As at 30 June 2021 Level 1$000
Level 2$000
Level 3$000
Total$000
Assets
Financial assets at fair value through profit or loss 9,162 832 32,756 42,750
Total assets 9,162 832 32,756 42,750
Liabilities
Financial liabilities at fair value through profit or loss - 1,532 - 1,532
Deferred consideration - - 10,716 10,716
Total liabilities - 1,532 10,716 12,248
As at 30 June 2020
Assets
Financial assets at fair value through profit or loss 16,976 2,651 38,065 57,692
Total assets 16,976 2,651 38,065 57,692
Liabilities
Financial liabilities at fair value through profit or loss - 3,456 - 3,456
Deferred consideration - - 17,581 17,581
Total liabilities - 3,456 17,581 21,037

95 | COMPUTERSHARE | ANNUAL REPORT | 2021
NOTES TO THE CONSOLIDATED FINANCIAL STATEMENTS
The following table presents the changes in level 3 items for the periods ended 30 June 2021 and 30 June 2020:
Financial assets at fair value through profit or loss
Deferred consideration liability
2021$000
2020$000
2021$000
2020$000
Opening balance at 1 July 38,065 38,646 (17,581) (31,797)
Payments - - 8,873 15,180
Additions - 8,519 - (1,750)
Return of capital (4,145) (9,100) - -
Gains/(losses) recognised in profit or loss (1,164) - - -
Currency translation difference - - (2,008) 786
Closing balance at 30 June 32,756 38,065 (10,716) (17,581)
Fair value of financial assets and liabilitiesThe carrying amounts of cash and cash equivalents, receivables, loan servicing advances, payables, non-interest bearing liabilities, lease liabilities and loans approximate their fair values for the Group except for the USD Senior Notes of $ 1,069.0 million (2020: $1,088.3 million), where the fair value based on level 2 valuation techniques described above was $1,065.8 million as at 30 June 2021 (2020: $1,113.7 million).
13. FINANCIAL ASSETS AND LIABILITIES AT FAIR VALUE THROUGH PROFIT OR LOSSThe Group classifies the following financial assets at fair value through profit or loss:
> debt securities that do not qualify for measurement at either amortised cost or fair value through other comprehensive income;
> derivatives, which are mandatorily measured at fair value through profit or loss;
> equity investments for which the entity has not elected to recognise fair value gains and losses through other comprehensive income; and
> investments in structured entities.
At initial recognition, the Group measures a financial asset at its fair value plus, in the case of a financial asset not at fair value through profit or loss (FVPL), transaction costs that are directly attributable to the acquisition of the financial asset. Gains or losses from subsequent re-measurement to fair value at each balance date are recognised in profit or loss.
Financial assets 2021$000
2020$000
Current
Debt securities 7,954 15,853
Derivative assets (b) 513 2,072
Equity securities 73 54
8,540 17,979
Non-current
Investment in structured entities (a) 30,257 35,565
Derivative assets (b) 319 579
Equity securities 3,634 3,569
34,210 39,713
Financial liabilities
Current
Derivative liabilities (b) 218 3,456
218 3,456
Non-current
Derivative liabilities (b) 1,314 -
1,314 -

96
(a) Investment in structured entitiesNon-current financial assets include $30.3 million of investments in unconsolidated structured entities (2020: $35.6 million). An overseas subsidiary of the Group occasionally sells economic benefits and obligations associated with mortgage servicing rights to unconsolidated structured entities while retaining a 20% interest in these entities. An unaffiliated third party, which owns 80% of the structured entities as asset manager, provides investment opportunities to investors and is considered a sponsor of these entities. The overseas subsidiary of the Group continues to service the loans associated with the mortgage servicing rights sold to the structured entities and receives compensation for providing such services.
The structured entities are designed to hold assets that will generate cash flows for their investors. The acquisition of these assets is fully funded at inception and future financial support is not expected to be required. As there is no obligation to provide further funding, the exposure to loss from the Group’s interest in the structured entities is limited to the carrying amount of the investment.
(b) Derivative financial instrumentsThe Group uses derivative financial instruments to manage specifically identified interest rate and foreign currency risks. Derivatives are initially recognised at fair value on the date a derivative contract is entered into and are subsequently re-measured to their fair value at each balance date. The method of recognising the resulting gain or loss depends on whether the derivative is designated as a hedging instrument, and if so, the nature of the item being hedged. The Group designates certain financial instruments, including derivatives, as either hedges of net investments in a foreign operation; hedges of firm commitments or highly probable forecast transactions (cash flow hedges); or fair value hedges. Refer to note 11 for further information on the Group’s hedging instruments.
2021$000
2020$000
Derivative assets
Current 513 2,072
Non-current 319 579
832 2,651
Derivative assets – current and non-current
Fair values of interest rate derivatives designated as cash flow hedges 319 1,114
Fair values of cross currency derivatives designated as hedge of net investment 13 308
Fair values of cross currency derivatives designated as cash flow hedges - 130
Fair value of derivatives for which hedge accounting has not been applied 500 1,099
Total derivative assets 832 2,651
Derivative liabilities
Current 218 3,456
Non-current 1,314 -
1,532 3,456
Derivative liabilities – current and non-current
Fair values of interest rate derivatives designated as fair value hedges 1,314 -
Fair values of cross currency derivatives designated as hedge of net investment 218 3,456
Total derivative liabilities 1,532 3,456

97 | COMPUTERSHARE | ANNUAL REPORT | 2021
NOTES TO THE CONSOLIDATED FINANCIAL STATEMENTS
14. BORROWINGSBorrowings are initially recognised at fair value and are subsequently measured at amortised cost unless designated in a fair value hedge relationship. Any difference between the proceeds (net of transaction costs) and the redemption amount is recognised in profit or loss over the borrowing period using the effective interest method. Borrowings are classified as current liabilities unless the Group has a legal right to defer settlement of the liability for at least 12 months after the balance sheet date.
2021$000
2020$000
Current
Bank loans (SLS non-recourse advance facility) (a) 99,465 178,154
ANZ syndicated facility (b) - 99,919
Other bank loans (c) 2,911 9,337
USD Senior Notes (d) 220,000 -
322,376 287,410
Non-current
Bank loans (SLS non-recourse advance facility) (a) 117,000 -
USD Senior Notes (d) 848,962 1,088,346
Revolving syndicated bank facilities (e) 421,648 654,064
1,387,610 1,742,410
(a) The borrowings of the overseas subsidiary engaged in mortgage servicing activities are secured against the loan servicing advances without recourse to the Group.
(b) On 12 March 2020, Computershare Limited executed a bilateral facility of $100.0 million with Australia and New Zealand Banking Group Limited, initially maturing in March 2021. The facility was extended on 24 November 2020 to mature in March 2022. The facility was undrawn at 30 June 2021.
(c) Other bank loans include warehouse facility held by an overseas subsidiary engaged in mortgage servicing activities.
(d) On 9 February 2012, Computershare Investor Services Inc., a controlled entity, issued 62 notes in the United States with a total value of $550.0 million. These notes were for tenors of six, seven, ten and twelve years. The six and seven-year notes with a total value of $110.0 million were repaid during the prior year. On 20 November 2018, Computershare US Inc. issued 24 notes in the United States with a total value of $550.0 million. These notes were for a tenor of seven and ten years. Fixed interest is paid on all the issued notes on a semi-annual basis.
The Group uses interest rate derivatives to manage the fixed interest exposure. The following table provides a reconciliation of the USD Senior Notes.
USD Senior Notes Reconciliation
USD Senior Notes at cost 990,000 990,000
Unamortised fair value adjustments – discontinued hedge relationship1 79,812 100,772
Fair value adjustments (850) (2,426)
Total net debt 1,068,962 1,088,346
Interest rate derivative – fair value hedge 1,314 -
Total 1,070,276 1,088,346
1 In the prior financial year, the Group disposed of interest rate derivatives hedging the USD Senior Notes. As a result, the hedge relationship was discontinued and the USD Senior notes ceased to be adjusted for changes in fair value. The fair value adjustment is amortised to interest expense in the income statement, on an effective interest basis, over the remaining term of the USD Senior Notes.
Fair value adjustments represent loan origination fees and the revaluation of the hedged portion of the USD Senior Notes. Hedged USD Senior Notes amounted to $350.0 million as at 30 June 2021 (2020: nil).
The gain or loss from re-measuring the hedging instruments (interest rate derivatives) at fair value is recognised immediately in the statement of comprehensive income along with the change in fair value of the underlying hedged item (USD Senior Notes). The fair value adjustment of the hedged USD Senior Notes reflects the valuation change due to lower market interest rates at balance sheet date for the term until maturity. The change is offset by the fair value of interest rate derivatives used to effectively convert the USD fixed interest rate notes to floating interest rates. The conversion to floating interest rate using derivatives provides a hedge against the Group’s USD interest rate risk exposure.
(e) The consolidated entity maintains revolving syndicated facilities. The first facility is a multi-currency facility of $450.0 million maturing on 17 April 2023. The second facility is a USD only facility of $500.0 million maturing 30 June 2024.
The consolidated entity also maintains bilateral debt facilities. The first is a multi-currency facility of $100.0 million maturing on 12 March 2022. The second is a multi-currency facility of $50.0 million maturing on 5 July 2023.
The revolving syndicated facilities were drawn to an equivalent of $423.7 million at 30 June 2021. The bilateral facilities were undrawn at 30 June 2021. The facilities are subject to negative pledge undertakings and impose certain covenants upon the consolidated entity. The Group has complied with the negative pledge undertakings and covenants imposed on it for the year ended 30 June 2021.
(f) A bridge facility was executed on 31 March 2021 for the CTS acquisition. This facility is a USD only facility of $375.0 million maturing on 23 March 2022. The facility was undrawn at 30 June 2021.

98
15. RECEIVABLES2021
$0002020$000
Current
Trade receivables 202,907 206,952
Unbilled receivables 165,363 173,201
Interest receivable 17,330 18,707
Less: allowance for expected credit losses (15,273) (16,316)
370,327 382,544
Other non-trade amounts 49,563 43,921
419,890 426,465
Non-current
Other 194 2,184
194 2,184
Trade and unbilled receivables Trade receivables and unbilled receivables are recognised initially at fair value and subsequently measured at amortised cost using the effective interest method, net of allowances for expected credit losses. Trade receivables generally have settlement terms of 30 days and are therefore classified as current. The right to receive consideration is unconditional.
ImpairmentThe Group applies the simplified approach to measure Expected Credit losses (ECLs), which uses a lifetime expected loss allowance for all trade and unbilled receivables. To measure the expected credit losses, trade and unbilled receivables have been grouped based on shared credit risk characteristics and days past due. The Group has established a provision matrix that is based on the payment profile of customers and the corresponding historical credit loss experience, adjusted for current and forward-looking factors specific to the debtors and the economic environment.
The Group has considered the ongoing impact of Covid-19 and its potential to affect customers’ repayment ability when measuring ECLs. This included identifying any customers in financial difficulty as a result of the pandemic, reviewing large customers in industries significantly impacted, reviewing ageing and collection issues throughout the financial year and considering the macroeconomic factors specific to each region.
Trade and unbilled receivables are written off when there is no reasonable expectation of recovery. Indicators that there is no reasonable expectation of recovery include, amongst other things, a finalisation of formal liquidation or other proceedings. A loss allowance has not been recognised in respect of other non-trade amounts, due to the nature of the receivables and counterparties as well as historical experience.
An analysis of trade and unbilled receivables and the associated allowance for expected credit losses is as follows:
Trade and unbilled receivables
Loss allowance
Net receivables
2021$000
2020$000
2021$000
2020$000
2021$000
2020$000
Current 270,520 301,755 (4,410) (4,078) 266,110 297,677
Less than 30 days overdue 51,522 45,402 (411) (616) 51,111 44,786
Between 30 and 60 days overdue 15,676 12,874 (606) (499) 15,070 12,375
Between 60 and 90 days overdue 17,514 10,675 (641) (612) 16,873 10,063
Between 90 and 120 days overdue 6,279 6,670 (998) (1,045) 5,281 5,625
More than 120 days overdue 24,089 21,484 (8,207) (9,466) 15,882 12,018
Total 385,600 398,860 (15,273) (16,316) 370,327 382,544
Movement in the allowance for expected credit losses is as follows:
Loss allowance 2021$000
2020$000
Opening balance at 1 July (16,316) (10,877)
(Increase)/decrease in loss allowance recognised in profit or loss during the year (1,681) (6,496)
Receivables written off during the year as uncollectible 3,445 2,174
Acquisition of entities and businesses (286) (1,177)
Currency translation differences (435) 60
Closing balance at 30 June (15,273) (16,316)
An impairment loss of $7.5 million was recognised in the statement of comprehensive income (2020: $nil) relating to other receivables.

99 | COMPUTERSHARE | ANNUAL REPORT | 2021
NOTES TO THE CONSOLIDATED FINANCIAL STATEMENTS
16. LOAN SERVICING ADVANCES
2021$000
2020$000
Current
Loan servicing advances 335,697 267,016
Loan servicing advances are recognised initially at fair value and subsequently measured at amortised cost using the effective interest method.
An overseas subsidiary performing loan servicing activities regularly makes payments on behalf of mortgagors related to taxes, insurance, principal and interest. The receivable represents the total value of these payments yet to be recovered. In general, the overseas subsidiary is reimbursed for advances from collections from the relevant pool of mortgages. In the event that pool level collections are not adequate for full reimbursement, the outstanding advances receive priority over any other liability from the proceeds from the liquidation of the property. Although it takes longer than 12 months for a portion of the loan servicing receivables to be collected, all servicing advances are classified as current. This reflects the fact that collections occur within the normal operating cycle of the overseas subsidiary.
ImpairmentThe Group applies the AASB 9 general approach to measuring expected credit losses on loan servicing advances. The loss allowance is based on assumptions about risk of default and expected loss rates. The Group uses judgement in making these assumptions and selecting the inputs to the impairment calculation, based on the historical losses, existing market conditions, expectations of future advances and recoverability of outstanding advances from liquidation of the underlying property.
In response to the ongoing Covid-19 pandemic, the Group reviewed expected credit losses related to advances. Computershare has considered current and forward-looking information in its assessment, including housing market information and current property valuations, and the protection mechanisms in place to ensure recoverability of advances. Although there has been an extension to the foreclosure moratorium and forbearance programs, collectibility of advances continues to be well protected.
Movement in the allowance for expected credit losses for is as follows:
2021$000
2020$000
Loss allowance
Opening balance at 1 July 2,252 2,588
Increase in loss allowance recognised in profit or loss during the year 806 1,238
Amounts written off as uncollectible (740) (1,574)
Closing balance at 30 June 2,318 2,252
17. OTHER FINANCIAL ASSETS
Current
Client deposits1 67,732 51,642
Broker deposits2 8,455 8,301
76,187 59,943
1 A subsidiary located in Switzerland is a registered broker-dealer and custodian of clients’ assets. Client monies it manages as part of providing plan managers services meet criteria for on-balance sheet recognition as other financial assets, together with a corresponding liability (note 22).
2 A subsidiary located in Canada is a licensed deposit taker. This subsidiary accepts deposits in its own name, and records these funds as other financial assets together with a corresponding liability (note 22). The deposits are insured through a local regulatory authority.
Client and broker deposits are recognised initially at fair value and subsequently measured at amortised cost.
18. INVENTORIES
Raw materials and stores, at cost 5,452 5,113
Inventories are valued at the lower of cost and net realisable value. Cost is assigned on a first-in first-out basis. Net realisable value is the estimated selling price in the ordinary course of business less the estimated costs of completion and the estimated costs to sell.

100
19. OTHER ASSETS
2021$000
2020$000
Current
Set-up fees 1,919 825
Other 3,114 2,601
5,033 3,426
Non-current
Set-up fees 2,222 1,088
2,222 1,088
Set-up fees Where upfront client fees have been deferred and the related implementation costs can be measured reliably, they are capitalised and amortised straight-line over the same period. In the year ended 30 June 2021, amortisation of $5.0 million (2020: $10.4 million) was recognised in the statement of comprehensive income relating to capitalised set-up fees.
20. PROPERTY, PLANT AND EQUIPMENT
Land $000
Buildings$000
Plant and Equipment
$000
Fixtures and
Fittings$000
Leasehold improve-
ments$000
Total$000
At 1 July 2020
Opening net book amount 8,162 24,777 56,025 3,556 17,574 110,094
Additions - - 13,239 75 3,487 16,801
Disposals - - (58) - (44) (102)
Depreciation charge - (1,314) (24,307) (2,491) (3,773) (31,885)
Currency translation differences 1,026 3,069 2,336 349 983 7,763
Transfers and other - - - 5,080 (5,080) -
Closing net book amount 9,188 26,532 47,235 6,569 13,147 102,671
Cost 9,188 40,071 262,814 36,720 46,837 395,630
Accumulated depreciation - (13,539) (215,579) (30,151) (33,690) (292,959)
At 30 June 2021 9,188 26,532 47,235 6,569 13,147 102,671
At 1 July 2019
Opening net book amount 8,415 27,882 77,710 4,980 17,625 136,612
Change in accounting policy - (350) (6,063) - - (6,413)
Restated balance at the beginning of the financial year
8,415 27,532 71,647 4,980 17,625 130,199
Acquisition of entities and businesses - - - 16 113 129
Additions - 143 18,983 385 4,532 24,043
Disposals - - (95) (7) (32) (134)
Depreciation charge - (1,398) (25,659) (1,825) (5,369) (34,251)
Currency translation differences (253) (771) (935) 7 (24) (1,976)
Transfers and other - (729) (7,916) - 729 (7,916)
Closing net book amount 8,162 24,777 56,025 3,556 17,574 110,094
Cost 8,162 35,651 258,494 29,311 46,974 378,592
Accumulated depreciation - (10,874) (202,469) (25,755) (29,400) (268,498)
At 30 June 2020 8,162 24,777 56,025 3,556 17,574 110,094
Property, plant and equipment are stated at historical costs less accumulated depreciation and impairment. Cost includes the purchase price and expenditure that is directly attributable to bringing the asset to the location and condition necessary for its intended use.

101 | COMPUTERSHARE | ANNUAL REPORT | 2021
NOTES TO THE CONSOLIDATED FINANCIAL STATEMENTS
DepreciationItems of property, plant and equipment excluding freehold land are depreciated on a straight line basis over their estimated useful life. The assets’ residual values and useful lives are reviewed, and adjusted if appropriate, at the end of each reporting period. Depreciation expense has been determined based on the following typical rates of depreciation:
> Buildings (2.5% per annum)
> Plant and equipment (10% to 50% per annum)
> Fixtures and fittings (13% to 50% per annum)
Leasehold improvements are depreciated over the shorter of the useful life of the improvements or the term of the lease.
21. LEASESThe Group leases various properties, computer equipment, motor vehicles and other items of plant and equipment. Leases vary in contract term, with renewal at the option of the Group. The Group’s leases mainly relate to property.
Leases are recognised as a right-of-use asset and a corresponding liability at the date at which the leased asset is available for use by the Group.
Amounts recognised in the statement of financial position:
Right-of-use assets 2021$000
2020$000
Buildings 185,865 166,482
Plant and Equipment 19,746 12,739
Motor Vehicles 990 811
Total 206,601 180,032
Lease Liabilities
Current 50,605 43,159
Non-current 193,488 158,910
244,093 202,069
Additions to the right-of-use assets during the year were $81.1 million (2020: $19.7 million), $19.7 million was as a result of modifications existing leases held by the Group.
Right-of-use assets are measured at cost comprising the following:
> the amount of the initial measurement of lease liability
> any lease payments made at or before the commencement date less any lease incentives received
> any initial direct costs, and
> restoration costs.
The right-of-use asset is depreciated over the shorter of the asset’s useful life and the lease term on a straight-line basis.
Lease liabilities include the net present value of the following lease payments:
> fixed payments, less any lease incentives receivable;
> variable lease payments that depend on an index or rate;
> any amounts expected to be payable under residual value guarantees;
> the exercise price of a purchase option if the lessee is reasonably certain to exercise that option; and
> payments of penalties for terminating the lease, if the lease term reflects the lessee exercising that option.
Lease payments are discounted using the interest rate implicit in the lease. If that rate cannot be determined, the lessee’s incremental borrowing rate is used, being the rate that the lessee would have to pay to borrow the funds necessary to obtain an asset of similar value in a similar economic environment with similar terms and conditions.
Lease liabilities are subsequently measured at amortised cost using the effective interest rate method. When there is a change in lease term or a change in future lease payments, lease liabilities are remeasured, with a corresponding adjustment to lease assets.

102
Amounts recognised in the Profit or Loss related to lease activities Profit before tax includes the following amounts related to leases:
2021$000
2020$000
Depreciation of leased buildings 38,567 40,628
Depreciation of leased plant and equipment 4,245 2,331
Depreciation of leased motor vehicles 334 262
Total depreciation of right-of-use assets 43,146 43,221
Interest expense on lease liabilities 8,343 7,366
Expenses related to short term and low value leases 1,360 2,852
Short-term and low-value leases Payments associated with short-term leases and leases of low-value assets are recognised on a straight-line basis as an expense in profit or loss. Short-term leases are leases with a lease term of 12 months or less. Low-value assets largely comprise IT equipment and small items of office furniture.
Commitments for leases not yet commencedAt 30 June 2021, the Group had no committed leases which had not yet commenced.
At 30 June 2020, the Group had committed to leases which had not yet commenced. Accordingly cash flows of $64.5 million (undiscounted) were not included in the lease liability because the leased asset was not available for use. These have been recognised as additions during the current reporting period.
Extension and termination optionsExtension and termination options are included in a number of leases across the Group. In determining the lease term, management considers all the facts and circumstances that create an economic incentive to exercise an extension option, or not to exercise a termination option. Extension options (or periods after termination options) are only included in the lease term if the lease is reasonably certain to be extended (or not terminated).
The total potential future lease payments (undiscounted) that have not been included in the lease liability, because it is not reasonably certain that the leases will be extended (or not terminated), is summarised as follows:
Undiscounted potential future lease payments 5 years or less$000
Greater than 5 years
$000Total
$000
As at 30 June 2021 682 13,527 14,209
As at 30 June 2020 17,635 57,255 74,890
22. PAYABLES
2021$000
2020$000
Current
Trade payables – unsecured 19,889 14,682
Expense accruals 149,639 151,609
Contract liabilities1 35,963 38,182
Interest payable 12,713 19,329
GST/VAT payable 19,423 30,229
Broker client deposits (note 17) 76,187 59,943
Employee entitlements 33,748 28,969
Unredeemed childcare vouchers 76,172 85,159
Other payables 68,026 66,635
491,760 494,737
Non-current
Other payables 3,061 1,052
3,061 1,052

103 | COMPUTERSHARE | ANNUAL REPORT | 2021
NOTES TO THE CONSOLIDATED FINANCIAL STATEMENTS
Trade and other payablesTrade and other payables represent liabilities for those goods and services provided to the Group prior to the end of the financial year that are unpaid. The amounts are unsecured and are usually paid within 30 days of recognition.
Contract liabilities1
A contract liability arises when Computershare has received consideration for performance obligations that have not yet been satisfied, including deferred revenue and upfront fees. Revenue is recognised over the life of the relevant contract term as performance obligations are satisfied.
23. PROVISIONSProvisions are recognised when the Group has a present legal or constructive obligation as a result of past events, it is probable that an outflow of resources will be required to settle the obligation and the amount can be reliably estimated. Where there are a number of similar obligations, the likelihood that an outflow will be required in settlement is determined by considering the class of obligations as a whole.
Provisions are measured at the Group’s best estimate of the expenditure required to settle the present obligation at the reporting date and discounted to present value where the impact of discounting is material. The discount rate used to determine the present value reflects current market assessments of the time value of money and the risks specific to the liability.
2021$000
2020$000
Current
Restructuring 13,265 19,408
Unredeemed voucher provision 15,267 11,442
Acquisitions related 8,053 7,951
Tax related 2,200 6,635
Legal 6,426 11,501
Prepayment protection 3,490 4,890
Lease related 4,909 1,266
Other 5,035 7,770
58,645 70,863
Non-current
Employee entitlements 14,729 12,778
Acquisitions related 9,800 9,800
Prepayment protection - 2,610
24,529 25,188
RestructuringRestructuring provisions are recognised when a detailed plan for restructuring has been developed and a valid expectation has been raised with the affected employees that the terminations will be carried out.
Unredeemed vouchersThe unredeemed voucher provision is recognised for the expected usage of unredeemed childcare vouchers over two years old.
Tax relatedTax related provisions relate to potential tax liabilities associated with prior years’ business activities.
LegalLegal provisions represent cash outflows expected to cover legal claims made against the Group. The status of all claims is monitored on a regular basis.
Prepayment protectionAs part of certain MSR related transactions, the Group has provided prepayment protection to the counterparties. The Group has recognised a provision for the amount estimated to compensate for shortfalls in cash flows, where prepayments of the unpaid principal balance exceed a certain percentage.
Lease relatedLease related provisions represent onerous contracts and costs to restore leased premises to their original condition at the end of the respective lease terms.
Acquisitions relatedAcquisition related provisions relate to significant provisions acquired as part of business combinations and are first recognised at the date of acquisition.

104
Employee entitlementsEmployee entitlements provision represents long service leave and other employee entitlements. Where payments to the employee are not expected to be settled wholly within 12 months, they are measured as the present value of expected future payments for the services provided by employees up to the reporting date.
Liability for benefits accruing to employees in relation to employee bonuses and annual leave is recognised in payables.
Movements in each class of current provision during the financial year are set out below.
Restruc-turing$000
Unre-deemed voucher
provision$000
Acquisit-ions
related$000
Tax related
$000Legal$000
Pre-payment
protection$000
Lease related
$000Other$000
Total$000
Carrying amount at start of year 19,408 11,442 7,951 6,635 11,501 4,890 1,266 7,770 70,863
Additions 19,710 9,031 1,250 - 875 17,433 3,629 2,264 54,192
Payments (24,665) (6,658) (200) (7) (5,950) (21,443) (94) (879) (59,896)
Reversals (2,208) - (1,204) (4,428) - - (4,647) (12,487)
Transfers - - - - - 2,610 - - 2,610
Foreign exchange movements 1,020 1,452 256 - - - 108 527 3,363
Carrying amount at end of year 13,265 15,267 8,053 2,200 6,426 3,490 4,909 5,035 58,645
Movements in each class of non-current provision during the financial year, other than employee entitlements, are set out below.
Acquisitions related
$000
Prepayment protection
$000Total
$000
Carrying amount at start of year 9,800 2,610 12,410
Transfers - (2,610) (2,610)
Carrying amount at end of year 9,800 - 9,800
24. DEFERRED CONSIDERATION
2021$000
2020$000
Current
Deferred settlements on acquisition of entities 9,452 8,045
Non-current
Deferred settlements on acquisition of entities 1,264 9,536
Non-current deferred settlements on acquisition of entities are payable in between one and two years.

105 | COMPUTERSHARE | ANNUAL REPORT | 2021
NOTES TO THE CONSOLIDATED FINANCIAL STATEMENTS
25. MORTGAGE SERVICING RELATED LIABILITIES
2021$000
2020$000
Current
Mortgage servicing related liabilities 34,459 43,766
Non-current
Mortgage servicing related liabilities 131,135 210,388
Mortgage servicing related liabilities represent the portion of the economic benefits of mortgage servicing rights that has been transferred to third parties. The liabilities are amortised over the same useful life as the related mortgage servicing rights (note 9).
26. INTERESTS IN EQUITY
Members of the parent entity
Non-controlling interests
2021$000
2020$000
2021$000
2020$000
Interest in the equity of the consolidated entity:
Contributed equity – ordinary shares 519,299 - 989 989
Reserves (7,052) (172,496) (2,063) (2,622)
Retained earnings 1,765,412 1,761,188 3,012 3,260
Total interests in equity 2,277,659 1,588,692 1,938 1,627
27. CONTRIBUTED EQUITYOrdinary share capital bears no special terms or conditions affecting income or capital entitlements of the shareholders and is classified as equity. Costs directly attributable to the issue of new shares are recognised directly in equity as a deduction, net of tax, from the proceeds.
If the Group reacquires its own equity instruments, for example as the result of a share buy-back, those instruments are deducted from equity and the associated shares are cancelled. No gain or loss is recognised in the profit or loss and the consideration paid including any directly attributable incremental costs (net of income taxes) is recognised directly in equity.
Movement in contributed equity Number of shares $000
Balance at 1 July 2020 540,879,593 -
Rights issue 61,625,813 620,190
Dividend reinvestment plan issues 1,223,930 12,411
Transfer to share buy-back reserve - (101,558)
603,729,336 531,043
Less: transaction costs arising on share issues - (12,370)
Deferred tax credit recognised directly in equity - 626
Balance at 30 June 2021 603,729,336 519,299
Rights issueOn 24 March 2021, Computershare announced a fully underwritten pro rata accelerated renounceable entitlement offer under which eligible shareholders were entitled to subscribe for 1 share for every 8.8 shares held, at a price of AUD$13.55 per share (a 9.6% discount to the closing price on 23 March 2021). The proceeds from the rights issue, which completed on 29 April 2021, will be used to partially fund the CTS acquisition (note 8b).

106
28. RESERVES
2021$000
2020$000
Capital redemption reserve 2 2
Foreign currency translation reserve (23,261) (88,060)
Share buy-back reserve - (101,558)
Cash flow hedge reserve 3,805 9,212
Share-based payments reserve 37,105 32,611
Equity related contingent consideration reserve (8,199) (8,199)
Transactions with non-controlling interests (16,504) (16,504)
(7,052) (172,496)
Movements during the year:
Foreign currency translation reserve
Opening balance (88,060) (71,190)
Translation of controlled entities 67,555 (20,550)
Deferred tax (2,756) 3,680
Closing balance (23,261) (88,060)
Share buy-back reserve
Opening balance (101,558) (79,460)
Excess value of shares bought over the original amount of subscribed capital - (22,098)
Transfer to contributed equity 101,558 -
Closing balance - (101,558)
Cash flow hedge reserve
Opening balance 9,212 753
Revaluation (9,467) 12,665
Reclassified to profit or loss 1,816 (642)
Tax benefit/ (expense) 2,244 (3,564)
Closing balance 3,805 9,212
Share-based payments reserve
Opening balance 32,611 40,047
Cash purchase of shares for employee and executive share plans (16,271) (25,797)
Share-based payments expense 20,765 18,361
Closing balance 37,105 32,611
Equity related contingent consideration reserve
Opening balance (8,199) (8,199)
Closing balance (8,199) (8,199)
Transactions with non-controlling interests
Opening balance (16,504) (16,504)
Closing balance (16,504) (16,504)

107 | COMPUTERSHARE | ANNUAL REPORT | 2021
NOTES TO THE CONSOLIDATED FINANCIAL STATEMENTS
Nature and purpose of reserves
(a) Foreign currency translation reserve
On consolidation, exchange differences arising on translation of the foreign controlled entities are taken to the foreign currency translation reserve. This amount is the net of gains and losses on hedge transactions and intercompany loans after adjusting for related income tax effects. When a foreign operation is disposed, the associated exchange differences are reclassified to profit or loss as part of the gain or loss on sale.
(b) Share buy-back reserve
This reserve is used to record the excess value of shares bought over the original amount of subscribed capital.
On 29 April 2021, the Group completed a rights issue (note 27). The proceeds reduced the balance of the share buy-back reserve to nil and the residual was recognised as contributed equity.
(c) Cash flow hedge reserve
This reserve records the portion of the gain or loss on a hedging instrument in a cash flow hedge that is determined to be in an effective hedge relationship.
(d) Share-based payments reserve
The share-based payments reserve is used to recognise the fair value of shares which will vest to employees under employee and executive share plans. This reserve is also used to record cash purchase of shares for employee share plans.
(e) Equity related contingent consideration reserve
This reserve is used to reflect deferred consideration for acquisitions which is payable through the issue of parent entity equity instruments.
(f) Transactions with non-controlling interests
This reserve is used to record the differences which may arise as a result of transactions with non-controlling interests that do not result in a loss of control.
29. RETAINED EARNINGS AND DIVIDENDS
2021$000
2020$000
Retained earnings
Retained earnings at the beginning of the financial year 1,761,188 1,706,427
Change in accounting policy - (10,493)
Ordinary dividends provided for or paid (184,750) (167,403)
Net profit attributable to members of Computershare Limited 188,974 232,657
Retained earnings at the end of the financial year 1,765,412 1,761,188
Dividends
Ordinary
Final dividend paid during the financial year in respect of the previous year, AUD 23 cents per share franked to 30% (2020 – AUD 23 cents per share franked to 30%)
92,378 83,864
Interim dividend paid in respect of the current financial year, AUD 23 cents per share franked to 100% (2020 – AUD 23 cents per share franked to 30%)
92,372 83,539
A final dividend in respect of the year ended 30 June 2021 was declared by the directors of the Company on 10 August 2021, to be paid on 13 September 2021. This is an ordinary dividend of AUD 23 cents per share, franked to 60%. As the dividend was not declared until 10 August 2021, a provision was not recognised as at 30 June 2021.
Dividend franking account
Franking credits available for subsequent financial years based on a tax rate of 30% 31,234 58,495
The above amounts are calculated from the balance of the franking account as at the end of the reporting period, adjusted for franking credits and debits that will arise from the settlement of liabilities or receivables for income tax after the end of the year.

108
30. DETAILS OF CONTROLLED ENTITIESThe financial year-end of all controlled entities is 30 June with the exception of Computershare Canada Inc and its controlled entities, Computershare Hong Kong Investor Services Limited and its controlled entities and Computershare International Information Consultancy Services (Beijing) Company Ltd due to local statutory reporting requirements. These entities prepare results on a 30 June year end basis for consolidation purposes. Voting power is in accordance with the ownership interest held unless otherwise stated.
The consolidated financial statements as at 30 June 2021 include the following controlled entities:
Place of incorporation
Percentage of shares held
Name of controlled entityJune 2021
%June 2020
%
Computershare Limited Australia (2) - -
A.C.N. 080 903 957 Pty Ltd Australia (1)(2) 100 100
A.C.N. 081 035 752 Pty Ltd Australia (1)(2) 100 100
A.C.N. 617 889 424 Pty Limited Australia (1) 100 100
A.C.N. 618 089 688 Pty Limited Australia (1) 100 100
CDS International Pty Limited Australia (1)(2) 100 100
Communication Services Australia Pty Limited Australia (1)(2) 100 100
Computershare Clearing Pty Limited Australia (1) 100 100
Computershare Communication Services Pty Limited Australia (1)(2) 100 100
Computershare Dealing Services Pty Ltd Australia (1) 100 100
Computershare Depositary Pty Limited Australia (1) 100 100
Computershare Finance Company Pty Limited Australia (1)(2) 100 100
Computershare Investor Services Pty Limited Australia (1)(2) 100 100
Computershare Plan Co Pty Ltd Australia (1) 100 100
Computershare Plan Managers Pty Ltd Australia (1) 100 100
Computershare Technology Services Pty Ltd Australia (1)(2) 100 100
Computershare Utility Services Pty Ltd Australia (1)(2) 100 100
CPU Share Plans Pty Limited Australia (1) 100 100
CRS Custodian Pty Ltd Australia (1) 100 100
Financial Market Software Consultants Pty Ltd Australia (1) 100 100
Georgeson Shareholder Communications Australia Pty. Ltd. Australia (1) 100 100
Global eDelivery Group Pty Ltd Australia (1) 100 100
Obadele Pty Ltd Australia (1)(2) 100 100
Q M Industries (N.S.W.) Pty. Ltd. Australia (1) 100 100
Registrars Holding Pty Ltd Australia (1)(2) 100 100
Sepon (Australia) Pty. Limited Australia (1) 100 100
Source One Communications Australia Pty Ltd Australia (1) 100 100
Switchwise Pty Ltd Australia (1) 100 100
Computershare Investor Services (Bermuda) Limited Bermuda (1) 100 100
Computershare Investor Services (BVI) Limited British Virgin Islands (1) 100 100
Computershare Canada Inc. Canada (1) 100 100
Computershare Governance Services Ltd. Canada (1) 100 100
Computershare Investment Inc. Canada (1)(4) - 100
Computershare Investments (Canada) (Holdings) ULC Canada (1) 100 100
Computershare Investments (Canada) (No.1) ULC Canada (1) 100 100
Computershare Investments (Canada) (No.2) ULC Canada (1)(4) - 100
Computershare Investments (Canada) (No.3) ULC Canada (1) 100 100
Computershare Investments (Canada) (No.4) ULC Canada (1) 100 100
Computershare Investor Services Inc. Canada (1) 100 100
Computershare Services Canada Inc. Canada (1) 100 100
Computershare Technology Services Inc. Canada (1) 100 100
Computershare Trust Company of Canada Canada (1) 100 100
Georgeson Shareholder Communications Canada Inc. Canada (1) 100 100

109 | COMPUTERSHARE | ANNUAL REPORT | 2021
NOTES TO THE CONSOLIDATED FINANCIAL STATEMENTS
Place of incorporation
Percentage of shares held
Name of controlled entityJune 2021
%June 2020
%
RicePoint Administration Inc. Canada (1) 100 100
SyncBASE Inc. Canada (1) 100 100
Computershare Investor Services (Cayman) Limited Cayman Islands (1) 100 100
Computershare International Information Consultancy Services (Beijing) Company Limited
China (1) 100 100
Computershare A/S Denmark (1) 100 100
Georgeson Shareholder SAS France (1)(5) 100 100
Computershare Communication Services GmbH Germany (1) 100 100
Computershare Deutschland GmbH & Co. KG Germany (1) 100 100
Computershare Governance Services GmbH Germany (1) 100 100
Computershare Verwaltungs GmbH Germany (1) 100 100
Equatex Deutschland GmbH Germany (1) 100 100
Computershare Investor Services (Guernsey) Limited Guernsey (1) 100 100
Computershare Asia Limited Hong Kong (1) 100 100
Computershare Hong Kong Development Limited Hong Kong (1) 100 100
Computershare Hong Kong Investor Services Limited Hong Kong (1) 100 100
Computershare Hong Kong Nominees Limited Hong Kong (1) 100 100
Computershare Hong Kong Trustees Limited Hong Kong (1) 100 100
Computershare Investor Services Limited Hong Kong (1) 100 100
Hong Kong Registrars Limited Hong Kong (1) 100 100
Computershare Finance Ireland Limited Ireland (4) - 100
Computershare Governance Services Limited Ireland (1) 100 100
Computershare Investor Services (Ireland) Limited Ireland (1) 100 100
Computershare Services Nominees (Ireland) Limited Ireland (1) 100 100
Computershare Nominees (Ireland) Limited Ireland (1) 100 100
Computershare Trustees (Ireland) Limited Ireland (1) 100 100
HML Mortgage Services Ireland Limited Ireland (1)(4) - 100
Specialist Mortgage Services Ireland Limited Ireland (1) 100 100
Computershare Italy S.r.l. Italy (1) 100 100
Computershare S.p.A. Italy (1)(5) 100 100
Georgeson S.r.l. Italy (1) 100 100
Proxitalia S.r.l. Italy (1) 100 100
Computershare Company Secretarial Services (Jersey) Limited Jersey (1) 100 100
Computershare DR Nominees Limited Jersey (1) 100 100
Computershare Investor Services (Jersey) Limited Jersey (1) 100 100
Computershare Nominees (Channel Islands) Limited Jersey (1) 100 100
Computershare Offshore Services Limited Jersey (1) 100 100
Computershare Treasury Services Limited Jersey (1) 100 100
Computershare Trustees (C.I.) Limited Jersey (1) 100 100
Computershare Trustees (Jersey) Limited Jersey (1) 100 100
EES Nominees International Limited Jersey (1) 100 100
Computershare Netherlands B.V. Netherlands (1) 100 100
Computershare Investor Services Limited New Zealand (1) 100 100
Computershare Nominees NZ Limited New Zealand (1) 100 100
ConnectNow New Zealand Limited New Zealand (1) 100 100
CRS Nominees Limited New Zealand (1) 100 100
Equatex Employee Services AS Norway (1) 100 100
Equatex Norway AS Norway (1) 100 100
Equatex Poland Sp. Z.o.o. Poland (1) 100 100
CIS Company Secretaries (Pty) Ltd South Africa (1) 74 74

110
Place of incorporation
Percentage of shares held
Name of controlled entityJune 2021
%June 2020
%
Computershare (Pty) Ltd South Africa (1) 74 74
Computershare Investor Services (Pty) Ltd South Africa (1) 74 74
Computershare Nominees (Pty) Ltd South Africa (1) 74 74
Computershare Outsourcing (Pty) Ltd South Africa (1) 74 74
Computershare South Africa (Pty) Ltd South Africa (1) 74 74
Computershare TR Services (Pty) Ltd South Africa (1) 74 74
Minu (Pty) Ltd South Africa (1) 74 74
Georgeson S.L Spain (1) 100 100
Computershare AB Sweden (1) 100 100
Computershare Schweiz AG Switzerland (1) 100 100
Computershare Technology Services AG Switzerland (1) 100 100
Equatex AG Switzerland (1) 100 100
Equatex Group Holding AG Switzerland (1) 100 100
Equatex IP AG in Liquidation Switzerland (1) 100 100
Baseline Capital Limited United Kingdom (1) 100 100
Computershare Company Nominees Limited United Kingdom (1) 100 100
Computershare Global Technology Services Limited United Kingdom (1) 100 100
Computershare Governance Services (UK) Limited United Kingdom (1) 100 100
Computershare Investments (UK) (No.2) Limited United Kingdom (1)(4) - 100
Computershare Investments (UK) (No.3) Limited United Kingdom (1) 100 100
Computershare Investments (UK) (No.7) Limited United Kingdom (1) 100 100
Computershare Investments (UK) (No.8) Limited United Kingdom (1) 100 100
Computershare Investments (UK) (No.9) Limited United Kingdom (1)(4) - 100
Computershare Investments (UK) Limited United Kingdom (1) 100 100
Computershare Investor Services Plc United Kingdom (1) 100 100
Computershare IP (UK) Limited United Kingdom (1) 100 100
Computershare Limited United Kingdom (1) 100 100
Computershare Mortgage Services Limited United Kingdom (1) 100 100
Computershare Regional Services Limited United Kingdom (1) 100 100
Computershare Services Limited United Kingdom (1) 100 100
Computershare Services Nominees Limited United Kingdom (1) 100 100
Computershare Technology Services (UK) Limited United Kingdom (1) 100 100
Computershare Trustees Limited United Kingdom (1) 100 100
Computershare Voucher Services Limited United Kingdom (1) 100 100
Credit Advisory Services Limited United Kingdom (1) 100 100
DPS Trustees Limited United Kingdom (1) 100 100
EES Capital Trustees Limited United Kingdom (1) 100 100
EES Corporate Trustees Limited United Kingdom (1) 100 100
EES Trustees Limited United Kingdom (1) 100 100
Equatex UK Ltd United Kingdom (1) 100 100
Equatex UK Nominee Ltd United Kingdom (1) 100 100
Homeloan Management Limited United Kingdom (1) 100 100
KB Analytics Limited United Kingdom (1)(4) - 100
Mortgage Systems Limited United Kingdom (1)(4) - 100
Rosolite Mortgages Limited United Kingdom (1) 100 100
Siberite Mortgages Limited United Kingdom (1) 100 100
Topaz Finance Limited United Kingdom (1) 100 100
Administar Services Group LLC United States of America (1) 100 100
Capital Markets Cooperative, LLC United States of America (1) 100 100
Capital Markets Holdings, Inc. United States of America (1) 100 100

111 | COMPUTERSHARE | ANNUAL REPORT | 2021
NOTES TO THE CONSOLIDATED FINANCIAL STATEMENTS
Place of incorporation
Percentage of shares held
Name of controlled entityJune 2021
%June 2020
%
CMC Funding, Inc. United States of America (1) 100 100
Computershare Asset Management LLC United States of America (1) 100 100
Computershare Communication Services Inc. United States of America (1) 100 100
Computershare Governance Services Inc. United States of America (1) 100 100
Computershare Holdings Inc. United States of America (1) 100 100
Computershare Inc. United States of America (1) 100 100
Computershare Mortgage Services Inc. United States of America (1) 100 100
Computershare Property Solutions LLC United States of America (1) 100 100
Computershare Technology Services, Inc. United States of America (1) 100 100
Computershare Title Services LLC United States of America (1) 100 100
Computershare Trust Company, N.A. United States of America (1) 100 100
Computershare US Inc. United States of America (1) 100 100
Computershare US Investments LLC United States of America (1) 100 100
Computershare US Services Inc. United States of America (1) 100 100
Computershare Valuation Services LLC United States of America (1) 100 100
Credit Risk Holdings, LLC United States of America (1) 100 100
Credit Risk Solutions LLC United States of America (1) 100 100
Data Point Analysis Group, LLC United States of America (1) 100 100
Equatex US Inc. United States of America (1)(4)(5) - 100
Georgeson LLC United States of America (1) 100 100
Georgeson Securities Corporation United States of America (1) 100 100
Gilardi & Co., LLC United States of America (1) 100 100
Gilco LLC United States of America (1) 100 100
GTU Ops Inc. United States of America (1) 100 100
HELOC Funding II Trust United States of America (1) 100 100
KCC Class Action Services LLC United States of America (1) 100 100
Kurtzman Carson Consultants Inc. United States of America (1) 100 100
Kurtzman Carson Consultants, LLC United States of America (1) 100 100
LenderLive Financial Services, LLC United States of America (1) 100 100
LenderLive Network, LLC United States of America (1) 100 100
MSR Robin Advances (Depositor) LLC United States of America (1) 100 100
MSR Robin Advances Issuer Trust United States of America (1) 100 100
RCNG LLC United States of America (1) 100 100
Rosenthal & Company, LLC United States of America (1) 100 100
Settlement Recovery Group LLC United States of America (1) 100 100
SLS Funding III LLC United States of America (1) 100 100
SLS Investco LLC United States of America (1) 100 100
SLS SAF Depositor LLC United States of America (1) 100 100
SLS SAF Issuing Trust United States of America (1) 100 100
SLS Servicer Advance Revolving Trust 1 United States of America (1) 100 100
Specialized Loan Servicing Holdings LLC United States of America (1) 100 100
Specialized Loan Servicing LLC United States of America (1) 100 100
Verbatim LLC United States of America (1)(3) 100 -
Corporate Creations Alabama LLC United States of America (1)(4) - 100
Corporate Creations Alaska Inc. United States of America (1)(4) - 100
Corporate Creations Arizona LLC United States of America (1)(4) - 100
Corporate Creations Arkansas LLC United States of America (1)(4) - 100
Corporate Creations California Inc. United States of America (1)(4) - 100
Corporate Creations Colorado LLC United States of America (1)(4) - 100
Corporate Creations Connecticut LLC United States of America (1)(4) - 100

112
Place of incorporation
Percentage of shares held
Name of controlled entityJune 2021
%June 2020
%
Corporate Creations Delaware LLC United States of America (1)(4) - 100
Corporate Creations District of Columbia LLC United States of America (1)(4) - 100
Corporate Creations Florida LLC United States of America (1) 100 100
Corporate Creations Georgia LLC United States of America (1)(4) - 100
Corporate Creations Hawaii LLC United States of America (1)(4) - 100
Corporate Creations Idaho LLC United States of America (1)(4) - 100
Corporate Creations Illinois LLC United States of America (1)(4) - 100
Corporate Creations Indiana LLC United States of America (1)(4) - 100
Corporate Creations Intellectual Property LLC United States of America (1)(4) - 100
Corporate Creations Iowa LLC United States of America (1)(4) - 100
Corporate Creations Kansas LLC United States of America (1)(4) - 100
Corporate Creations Kentucky LLC United States of America (1)(4) - 100
Corporate Creations Louisiana LLC United States of America (1) 100 100
Corporate Creations Maine LLC United States of America (1)(4) - 100
Corporate Creations Management LLC United States of America (1) 100 100
Corporate Creations Maryland LLC United States of America (1)(4) - 100
Corporate Creations Massachusetts Inc. United States of America (1)(4) - 100
Corporate Creations Michigan LLC United States of America (1)(4) - 100
Corporate Creations Minnesota LLC United States of America (1)(4) - 100
Corporate Creations Mississippi LLC United States of America (1) 100 100
Corporate Creations Missouri Inc. United States of America (1)(4) - 100
Corporate Creations Montana Inc. United States of America (1)(4) - 100
Corporate Creations Nebraska LLC United States of America (1)(4) - 100
Corporate Creations Network Inc. [Arkansas] United States of America (1) 100 100
Corporate Creations Network Inc. [California] United States of America (1) 100 100
Corporate Creations Network Inc. [Florida] United States of America (1) 100 100
Corporate Creations Network Inc. [Hawaii] United States of America (1) 100 100
Corporate Creations Network Inc. [Kansas] United States of America (1) 100 100
Corporate Creations Network Inc. [Maryland] United States of America (1) 100 100
Corporate Creations Network Inc. [Oklahoma] United States of America (1)(4) - 100
Corporate Creations Nevada LLC United States of America (1)(4) - 100
Corporate Creations New Hampshire LLC United States of America (1)(4) - 100
Corporate Creations New Jersey LLC United States of America (1)(4) - 100
Corporate Creations New Mexico Inc. United States of America (1) 100 100
Corporate Creations New York LLC United States of America (1) 100 100
Corporate Creations North Carolina LLC United States of America (1)(4) - 100
Corporate Creations North Dakota LLC United States of America (1)(4) - 100
Corporate Creations Ohio LLC United States of America (1)(4) - 100
Corporate Creations Oklahoma LLC United States of America (1)(4) - 100
Corporate Creations Oregon LLC United States of America (1)(4) - 100
Corporate Creations Pennsylvania LLC United States of America (1)(4) - 100
Corporate Creations Puerto Rico Inc. Puerto Rico (1) 100 100
Corporate Creations Rhode Island LLC United States of America (1)(4) - 100
Corporate Creations South Carolina LLC United States of America (1)(4) - 100
Corporate Creations South Dakota LLC United States of America (1)(4) - 100
Corporate Creations Tennessee LLC United States of America (1) 100 100
Corporate Creations Texas LLC United States of America (1)(4) - 100
Corporate Creations Utah LLC United States of America (1)(4) - 100
Corporate Creations Vermont LLC United States of America (1)(4) - 100
Corporate Creations Virginia LLC United States of America (1)(4) - 100

113 | COMPUTERSHARE | ANNUAL REPORT | 2021
NOTES TO THE CONSOLIDATED FINANCIAL STATEMENTS
Place of incorporation
Percentage of shares held
Name of controlled entityJune 2021
%June 2020
%
Corporate Creations Washington LLC United States of America (1)(4) - 100
Corporate Creations West Virginia LLC United States of America (1)(4) - 100
Corporate Creations Wisconsin LLC United States of America (1)(4) - 100
Corporate Creations Wyoming LLC United States of America (1)(4) - 100
Management Group Limited British Virgin Islands (1)(4) - 100
United Agent Group Inc. Puerto Rico (1) 100 100
United Agent Group Inc. US Virgin Islands (1) 100 100
United Agent Group Inc. [Alabama] United States of America (1) 100 100
United Agent Group Inc. [Alaska] United States of America (1) 100 100
United Agent Group Inc. [Arizona] United States of America (1) 100 100
United Agent Group Inc. [Arkansas] United States of America (1) 100 100
United Agent Group Inc. [California] United States of America (1) 100 100
United Agent Group Inc. [Colorado] United States of America (1) 100 100
United Agent Group Inc. [Connecticut] United States of America (1) 100 100
United Agent Group Inc. [Delaware] United States of America (1) 100 100
United Agent Group Inc. [Florida] United States of America (1) 100 100
United Agent Group Inc. [Georgia] United States of America (1) 100 100
United Agent Group Inc. [Hawaii] United States of America (1) 100 100
United Agent Group Inc. [Idaho] United States of America (1) 100 100
United Agent Group Inc. [Illinois] United States of America (1) 100 100
United Agent Group Inc. [Indiana] United States of America (1) 100 100
United Agent Group Inc. [Iowa] United States of America (1) 100 100
United Agent Group Inc. [Kansas] United States of America (1) 100 100
United Agent Group Inc. [Kentucky] United States of America (1) 100 100
United Agent Group Inc. [Louisiana] United States of America (1) 100 100
United Agent Group Inc. [Maine] United States of America (1) 100 100
United Agent Group Inc. [Maryland] United States of America (1) 100 100
United Agent Group Inc. [Massachusetts] United States of America (1) 100 100
United Agent Group Inc. [Michigan] United States of America (1) 100 100
United Agent Group Inc. [Minnesota] United States of America (1) 100 100
United Agent Group Inc. [Mississippi] United States of America (1) 100 100
United Agent Group Inc. [Missouri] United States of America (1) 100 100
United Agent Group Inc. [Montana] United States of America (1) 100 100
United Agent Group Inc. [Nebraska] United States of America (1) 100 100
United Agent Group Inc. [Nevada] United States of America (1) 100 100
United Agent Group Inc. [New Hampshire] United States of America (1) 100 100
United Agent Group Inc. [New Jersey] United States of America (1) 100 100
United Agent Group Inc. [New Mexico] United States of America (1) 100 100
United Agent Group Inc. [New York] United States of America (1) 100 100
United Agent Group Inc. [North Carolina] United States of America (1) 100 100
United Agent Group Inc. [North Dakota] United States of America (1) 100 100
United Agent Group Inc. [Ohio] United States of America (1) 100 100
United Agent Group Inc. [Oklahoma] United States of America (1) 100 100
United Agent Group Inc. [Oregon] United States of America (1) 100 100
United Agent Group Inc. [Pennsylvania] United States of America (1) 100 100
United Agent Group Inc. [Rhode Island] United States of America (1) 100 100
United Agent Group Inc. [South Carolina] United States of America (1) 100 100
United Agent Group Inc. [South Dakota] United States of America (1) 100 100
United Agent Group Inc. [Tennessee] United States of America (1) 100 100
United Agent Group Inc. [Texas] United States of America (1) 100 100

114
Place of incorporation
Percentage of shares held
Name of controlled entityJune 2021
%June 2020
%
United Agent Group Inc. [Utah] United States of America (1) 100 100
United Agent Group Inc. [Vermont] United States of America (1) 100 100
United Agent Group Inc. [Virginia] United States of America (1) 100 100
United Agent Group Inc. [Washington] United States of America (1) 100 100
United Agent Group Inc. [Washington D.C.] United States of America (1) 100 100
United Agent Group Inc. [West Virginia] United States of America (1) 100 100
United Agent Group Inc. [Wisconsin] United States of America (1) 100 100
United Agent Group Inc. [Wyoming] United States of America (1) 100 100
United Agent Group Management LLC United States of America (1) 100 100
United Agent Group Services Inc. [Arkansas] United States of America (1)(4) - 100
United Agent Group Services Inc. [California] United States of America (1)(4) - 100
United Agent Group Services Inc. [Delaware] United States of America (1)(4) - 100
United Agent Group Services Inc. [Hawaii] United States of America (1)(4) - 100
United Agent Group Services Inc. [Kansas] United States of America (1)(4) - 100
United Agent Group Services Inc. [Maryland] United States of America (1)(4) - 100
United Agent Group Services Inc. [Oklahoma] United States of America (1)(4) - 100
Worldwide Nominee LLC United States of America (1) 100 100
1 Controlled entities which form part of the Group are audited by PricewaterhouseCoopers member firms for the purposes of the Group audit and/or local statutory audits.
2 These wholly owned companies have entered into a deed of cross guarantee dated 26 June 2008 with Computershare Limited which provides that all parties to the deed will guarantee to each creditor payment in full of any debt of each company participating in the deed on the winding-up of that company. As a result of ASIC Corporations (Wholly-owned Companies) Instrument 2016/785 these companies are relieved from the requirement to prepare a financial report and directors’ report.
3 This company became a controlled entity during the year ended 30 June 2021.
4 These companies ceased to be controlled entities during the year ended 30 June 2021.
5 Local statutory audits performed by firms other than PricewaterhouseCoopers member firms.

115 | COMPUTERSHARE | ANNUAL REPORT | 2021
NOTES TO THE CONSOLIDATED FINANCIAL STATEMENTS
31. INVESTMENTS IN ASSOCIATES AND JOINT VENTURESInvestments in associates and joint ventures are accounted for using the equity method of accounting. Under this method, the investments are initially recognised at cost and the carrying value is subsequently adjusted for increases or decreases in the Group’s share of post-acquisition profit or loss and movements in other comprehensive income. The Group’s share of post-acquisition profits or losses from investments in associates and joint ventures is recognised in the profit or loss. Dividends received or receivable are recognised as a reduction of the carrying amount of the investment.
Set out below are the associates and joint ventures of the Group at 30 June 2021:
Name Place of incorporation Principal activity Ownership interest
Consolidated carrying amount
June2021
%
June2020
%
June2021
$000
June2020$000
Associates
Expandi Ltd United Kingdom Investor Services 25 25 7,414 6,145
Milestone Group Pty Ltd1 Australia Technology Services 20 20 - 3,148
CVEX Group, Inc2 United States Investor Services - 22.2 - -
The Reach Agency Holdings Pty Ltd Australia Investor Services 46.5 46.5 1,683 1,377
Mergit s.r.l. Italy Technology Services 30 30 - -
Total investments in associates 9,097 10,670
Joint ventures
Computershare Pan Africa Holdings Ltd Mauritius Investor Services 60 60 - -
Asset Checker Ltd United Kingdom Investor Services 50 50 - -
Total investment in associates and joint ventures 9,097 10,670
1 At 30 June 2021, Milestone Group Pty Ltd was classified as an asset held for sale.
2 On 30 April 2021, Computershare’s ownership interest in CVEX Group, Inc decreased to 16%. Consequently, from this date CVEX Group, Inc. is no longer considered an associate of the consolidated entity.
The movements in the carrying amount of equity accounted investments in associates and joint ventures are as follows:
Associates Joint Ventures
2021$000
2020$000
2021$000
2020$000
Carrying amount at the beginning of the financial year 10,670 11,087 - 39
Share of net result (after income tax) 389 241 - (2)
Dividends received (295) (354) - -
Transfer to consolidated entity - - - (36)
Transfer to held for sale1 (2,888) - - -
Share of movement in reserves 1,221 (304) - (1)
Carrying amount at the end of the financial year 9,097 10,670 - -
Milestone Group Pty Ltd (Milestone)1
On 7 July 2021, Computershare agreed to sell its 20% interest in Milestone. Completion is subject to regulatory approval and is expected to occur in the half year ending 31 December 2021. Consequently, Milestone is classified as held for sale as at 30 June 2021. Computershare’s share of proceeds from the disposal will be $19.1 million based on the agreed sale price. This amount excludes contingent consideration receivable within three years from disposal should certain revenue growth conditions be met.
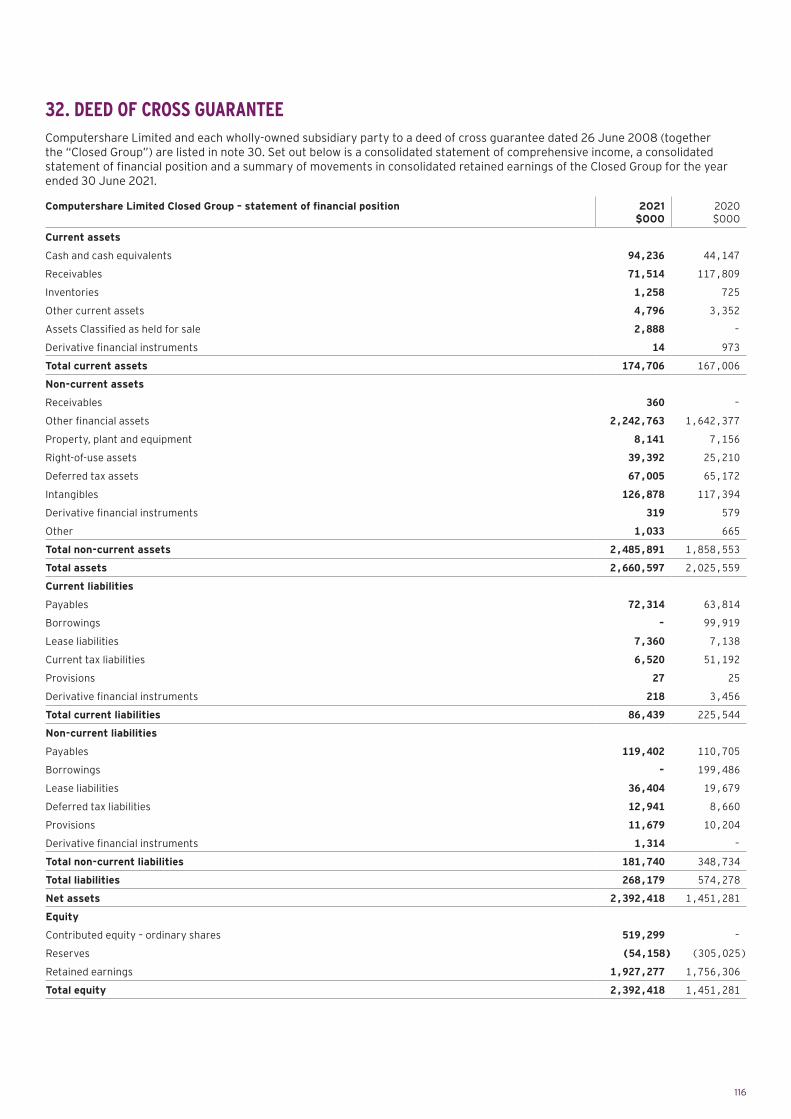
116
32. DEED OF CROSS GUARANTEEComputershare Limited and each wholly-owned subsidiary party to a deed of cross guarantee dated 26 June 2008 (together the “Closed Group”) are listed in note 30. Set out below is a consolidated statement of comprehensive income, a consolidated statement of financial position and a summary of movements in consolidated retained earnings of the Closed Group for the year ended 30 June 2021.
Computershare Limited Closed Group – statement of financial position 2021$000
2020$000
Current assets
Cash and cash equivalents 94,236 44,147
Receivables 71,514 117,809
Inventories 1,258 725
Other current assets 4,796 3,352
Assets Classified as held for sale 2,888 -
Derivative financial instruments 14 973
Total current assets 174,706 167,006
Non-current assets
Receivables 360 -
Other financial assets 2,242,763 1,642,377
Property, plant and equipment 8,141 7,156
Right-of-use assets 39,392 25,210
Deferred tax assets 67,005 65,172
Intangibles 126,878 117,394
Derivative financial instruments 319 579
Other 1,033 665
Total non-current assets 2,485,891 1,858,553
Total assets 2,660,597 2,025,559
Current liabilities
Payables 72,314 63,814
Borrowings - 99,919
Lease liabilities 7,360 7,138
Current tax liabilities 6,520 51,192
Provisions 27 25
Derivative financial instruments 218 3,456
Total current liabilities 86,439 225,544
Non-current liabilities
Payables 119,402 110,705
Borrowings - 199,486
Lease liabilities 36,404 19,679
Deferred tax liabilities 12,941 8,660
Provisions 11,679 10,204
Derivative financial instruments 1,314 -
Total non-current liabilities 181,740 348,734
Total liabilities 268,179 574,278
Net assets 2,392,418 1,451,281
Equity
Contributed equity – ordinary shares 519,299 -
Reserves (54,158) (305,025)
Retained earnings 1,927,277 1,756,306
Total equity 2,392,418 1,451,281

117 | COMPUTERSHARE | ANNUAL REPORT | 2021
NOTES TO THE CONSOLIDATED FINANCIAL STATEMENTS
Computershare Limited Closed Group – statement of comprehensive income 2021$000
2020$000
Revenues from continuing operations
Sales revenue 190,334 174,860
Other revenue 419,012 297,378
Total revenue from continuing operations 609,346 472,238
Other income 28,032 41,980
Expenses
Direct services 161,422 140,445
Technology costs 40,289 43,389
Corporate services 34,647 30,292
Finance costs 9,697 17,044
Total expenses 246,055 231,170
Share of net profit/(loss) of associates and joint ventures accounted for using the equity method (241) (9)
Profit before income tax expense 391,082 283,039
Income tax expense/(credit) 35,361 46,458
Profit for the year 355,721 236,581
Other comprehensive income
Cash flow hedges (7,651) 12,023
Exchange differences on translation of foreign operations 149,966 (29,043)
Income tax relating to components of other comprehensive income 2,244 (3,564)
Total other comprehensive income for the year, net of tax 144,559 (20,584)
Total comprehensive income for the year 500,280 215,997
Set out below is a summary of movements in consolidated retained profits for the year of the Closed Group.
Retained earnings at the beginning of the financial year 1,756,306 1,688,024
Change in accounting standards - (896)
Profit for the year 355,721 236,581
Dividends provided for or paid (184,750) (167,403)
Retained earnings at the end of the financial year 1,927,277 1,756,306
33. PARENT ENTITY FINANCIAL INFORMATION(a) Summary financial informationThe individual financial statements for the parent entity show the following aggregate amounts:
2021$000
2020$000
Balance sheet
Current assets 68,083 26,860
Non-current assets 1,286,633 1,160,235
Total assets 1,354,716 1,187,095
Current liabilities 86,212 217,057
Non-current liabilities 264,057 522,228
Total liabilities 350,269 739,285
Equity
Contributed equity – ordinary shares 519,299 -
Reserves
Share buy-back reserve - (101,558)
Capital redemption reserve 2 2
Foreign currency translation reserve 84,782 35,689
Share-based payment reserve 25,357 20,608
Equity related consideration (2,327) (2,327)
Retained earnings 377,334 495,396
Total equity 1,004,447 447,810
Profit/(loss) attributable to members of the parent entity 66,689 131,193
Total comprehensive income attributable to members of the parent entity 115,782 118,761

118
(b) GuaranteesThe parent entity’s financial guarantees have been outlined in note 34.
(c) Contingent liabilitiesThe parent entity did not have any contingent liabilities as at 30 June 2021 or 30 June 2020 other than the Australian thin capitalisation contingent liability outlined in note 6 and the matters outlined in note 34.
(d) Parent entity financial informationThe financial information for the parent entity, Computershare Limited has been prepared on the same basis as the consolidated financial statements, except as set out below.
Investments in controlled entities, associates and joint venture entitiesInvestments in controlled entities, associates and joint venture entities are accounted for at cost in the financial statements of Computershare Limited. Dividends received from associates and joint ventures are recognised in the parent entity’s profit or loss, rather than being deducted from the carrying amount of these investments.
Tax consolidation legislationComputershare Limited and its wholly-owned Australian controlled entities formed a tax consolidation group with effect from 1 July 2002.
Members of the tax consolidated group also entered into a tax sharing deed, which includes a tax funding arrangement. As a consequence, Computershare Limited, as the head entity in the tax consolidation group, has recognised the current tax liability (or receivable) relating to the wholly owned Australian controlled entities in this group in the financial statements as if that liability (or receivable) was its own. Amounts receivable or payable under the tax sharing deed are recognised separately as intercompany payables or receivables.
34. CONTINGENT LIABILITIES(a) Guarantees and IndemnitiesComputershare Limited, ACN 081 035 752 Pty Ltd, Computershare Investments (UK) (No. 3) Ltd, Computershare Finance Company Pty Ltd, Computershare US Inc. and Computershare Investor Services Inc are parties to a Guarantor Deed Poll dated 11 April 2018 in respect to the following Facility Agreements:
> $500.0 million four-year USD Syndicated Facility Agreement executed on 30 June 2020;
> $450.0 million five-year multi-currency Syndicated Facility Agreement executed on 11 April 2018;
> $375.0 million USD Syndicated Acquisition Bridge Facility executed on 31 March 2021;
> $100.0 million one-year multi-currency Bilateral Facility Agreement executed on 12 March 2020; and a
> $50.0 million five-year multi-currency Bilateral Facility Agreement executed on 28 June 2018 (refer to note 14 for further detail).
Guarantees and indemnities of $990.0 million (2020: $990.0 million) have been given to US Institutional Accredited Investors by Computershare Limited, ACN 081 035 752 Pty Ltd, Computershare Finance Company Pty Ltd, Computershare US Inc., Computershare Investments (UK) (No. 3) Ltd and Computershare Investor Services Inc under a Note and Guarantee Agreement dated 9 February 2012 and 20 November 2018.
Bank guarantees of AUD 2.7 million (2020: AUD 2.6 million) have been given in respect of facilities provided to Australian subsidiaries.
Bank guarantees of ZAR 6.8 million (2020: ZAR 6.8 million) have been given in respect of facilities provided to South African subsidiaries.
A performance guarantee of ZAR 32.0 million (2020: ZAR 32.0 million) has been given by Computershare (Pty) Ltd to provide security for the performance of obligations as a Central Securities Depository Participant.
(b) Legal and Regulatory MattersDue to the nature of operations, certain commercial and regulatory claims in the normal course of business have been made against the consolidated entity in various countries. An inherent difficulty in predicting the outcome of such matters exists. Based on current knowledge of the Group, an appropriate liability is recognised on the consolidated balance sheet if future cash outflows are considered probable with regard to a legal claim. The status of all claims is monitored on an ongoing basis, together with the adequacy of any provisions recorded in the Group’s financial statements. For the Australian thin capitalisation contingent liability refer to note 6.
(c) OtherThe Group is subject to regulatory capital requirements administered by relevant regulatory bodies in countries where Computershare operates. Failure to meet minimum capital requirements, or other ongoing regulatory requirements, can initiate action by the regulators that, if undertaken, could revoke or suspend the Group’s ability to provide trust services to customers in these markets. At all relevant times Group controlled entities have met all minimum capital requirements.
Computershare Limited (Australia) has issued a letter of warrant to Computershare (Pty) Ltd. This obligates Computershare Limited (Australia) to maintain combined tier one capital of at least ZAR 455.0 million (2020: ZAR 455.0 million).

119 | COMPUTERSHARE | ANNUAL REPORT | 2021
NOTES TO THE CONSOLIDATED FINANCIAL STATEMENTS
Potential withholding and other tax liabilities arising from distribution of all retained distributable earnings of all foreign incorporated controlled entities are $32.4 million (2020: $31.7 million). No provision is made for withholding tax on unremitted earnings of applicable foreign incorporated controlled entities as there is currently no intention to remit these earnings to the parent entity.
Computershare Limited (Australia), as the parent entity, has undertaken to own, either directly or indirectly, all of the equity interests and to guarantee performance of the obligations of Computershare Investor Services Pty Ltd, Computershare Trust Company NA, Georgeson LLC, Georgeson Securities Corporation, Computershare Trust Company of Canada and Computershare Investor Services Inc with respect to any financial accommodation related to transactional services provided by BMO Harris Bank, Chicago.
35. COMMITMENTS(a) Retirement benefits
Defined Contribution FundsThe Group maintains defined contribution superannuation schemes which provide benefits to all employees upon their disability, retirement or death. Employee contributions to the funds are based upon various percentages of employees’ gross salaries as set out below:
Australian controlled entities contribute to the defined contribution funds as follows: > Category 1 – Management (employer contributions, voluntary employee contributions)
> Category 2 – Staff (statutory employer contributions of 9.5% (increasing to 10% from 1 July 2021), voluntary employee contributions)
> Category 3 – SG (Superannuation Guarantee) Staff and casual and fixed term employees (statutory employer contributions, voluntary employee contributions)
Foreign controlled entities contribute to the defined contribution funds as follows: > United Kingdom entities – between 1% and 10% of employees’ gross salaries depending upon years of service
> United States entities – voluntary employee contributions with matching employer contribution up to 4% of employees’ eligible compensation
> Canadian entities – between 2% and 7% of employees’ base salaries dependent upon years of service
> South African entities – 12% of employees’ gross salaries
> New Zealand entities – voluntary employee contributions with matching employer contribution up to 6% of employees’ base salaries
> Hong Kong entities – between 5% and 20% of employees’ base salary dependent upon years of service
Defined Benefit FundsComputershare Communication Services GmbH maintained a defined benefit scheme which provides benefits to 2 employees (2020: 4). An actuarial assessment of the scheme was completed as at 30 June 2021 and defined benefit plan liability recognised in accordance with the actuarial valuation. The net liability is not material to the Group.
(b) Lease LiabilitiesThe Group leases various properties, computer equipment, motor vehicles and other items of plant and equipment. The Group has recognised right-of-use assets and lease liabilities (note 21) for these leases except for short-term and low-value assets.
(c) Other An overseas subsidiary performing loan servicing activities is obliged, in certain circumstances, to make payments on behalf of mortgagors related to taxes, insurance, principal and interest. The amount of these advance payments fluctuates over time as it depends on the type of loans being serviced and their performance.
As of 30 June 2021, the Group was servicing approximately $41.8 billion (2020: $24.5 billion) of mortgages owned by the US government sponsored mortgage agencies. While the Group, as the owner of the related MSRs, may have the obligation to acquire any mortgages from the serviced pool that do not meet the agencies’ lending criteria, the consolidated entity is in possession of indemnities and warranties that require originating banks to purchase such mortgages from the Group and cover any transfer costs. Only in the event of bankruptcy or dissolution of the originating bank, would Computershare retain the defective mortgage together with the underlying collateral. In these limited circumstances, the Group would have the option to either hold the mortgage or seek another buyer in the open market. The impact at 30 June 2021 of any retained mortgages is immaterial to the consolidated entity.

120
36. CAPITAL EXPENDITURE COMMITMENTSCapital expenditure commitments contracted for at balance date but not recorded in the financial statements are as follows:
2021$000
2020$000
Fit-out of premises - 1,100
Plant and equipment 1,400 2,424
1,400 3,524
37. SIGNIFICANT EVENTS AFTER YEAR ENDNo other matter or circumstance has arisen since the end of the financial year which is not otherwise dealt with in this financial report that has significantly affected or may significantly affect the operations of the consolidated entity, the results of those operations or the state of affairs of the consolidated entity in subsequent financial years.
38. RELATED PARTY DISCLOSURESKey management personnel disclosures are included in note 39. Detailed remuneration disclosures are provided in the remuneration report.
Directors’ shareholdings
Shares in the parent entity
2021 2020
Ordinary shares held at the end of the financial year 32,391,451 31,321,258
Net ordinary shares purchased/(sold) by directors during the financial year 1,030,811 (1,195,797)
The directors participated in the rights issue during the financial year to the value of AUD 14,314,139.
2021$
2020$
Ordinary dividends received during the year in respect of those ordinary shares 10,698,826 9,978,110
(a) Wholly owned Group – intercompany transactions and outstanding balances The parent entity and its controlled entities entered into the following transactions during the year within the wholly owned Group:
> Loans were advanced and repayments received on loans and intercompany accounts
> Fees were exchanged between entities
> Interest was charged between entities
> The parent entity and its Australian controlled entities have been parties to a tax sharing deed, which includes a tax funding arrangement (note 33)
> Dividends were paid between entities
> Bank guarantees were provided by the parent entity to its controlled entities (note 34)
These transactions were undertaken on commercial terms and conditions.
Ultimate controlling entityThe ultimate controlling entity of the Group is Computershare Limited.
(b) Ownership interests in related partiesInterests in controlled entities are set out in note 30. Interests held in associates and joint ventures are disclosed in note 31.

121 | COMPUTERSHARE | ANNUAL REPORT | 2021
NOTES TO THE CONSOLIDATED FINANCIAL STATEMENTS
(c) Transactions with associates and joint ventures The following transactions were entered into with associates and joint ventures:
2021$
2020$
Sales and purchases of goods and services
Sales to 286,569 250,991
Purchases from 3,936,520 2,495,705
Outstanding balances arising from sales and purchases of goods and services
Trade receivables 12,617 40,797
Trade payables 635,459 -
Loans to/from related parties
Loans receivable from Milestone Group Pty Ltd 375,674 -
These transactions were undertaken on commercial terms and conditions.
39. KEY MANAGEMENT PERSONNEL DISCLOSURESKey management personnel compensation
Short-term employee benefits 6,033,699 5,064,991
Other long-term benefits 31,422 44,699
Post-employment benefits 107,569 109,422
Share-based payments 2,144,149 1,923,270
Other 166,554 1,723,681
Total 8,483,393 8,866,063
For detailed remuneration disclosures please refer to sections 1 to 6 of the remuneration report within the Directors’ Report.
40. EMPLOYEE AND EXECUTIVE BENEFITSCertain employees are entitled to participate in share and performance rights schemes. A transaction is classified as share-based compensation where the Group receives services from an employee and pays for these in shares or similar equity instruments.
For each of the Group’s share plans, the fair value is measured at grant date and the expense is recognised over the relevant vesting period in the income statement with a corresponding increase in the share-based payments reserve. The expense is adjusted to reflect actual and expected levels of vesting.
(a) Share plans
Exempt Employee Share PlanDuring the year ended 30 June 2001 the Group introduced an Exempt Employee Share Plan. The Plan gives Computershare employees in Australia the opportunity to acquire shares in Computershare Limited. Each year, participating employees can make contributions from their pre-tax salary to acquire AUD 500 worth of shares. Such employee contributions are matched by the Group with an additional AUD 500 worth of shares being acquired for each participating employee. All permanent employees in Australia with at least six months service and employed at the allocation date are entitled to participate in this plan.
Deferred Employee Share PlanDuring the year ended 30 June 2002 a Deferred Employee Share Plan was established to enable Computershare to match dollar for dollar any employee pre-tax contributions to a maximum of AUD 3,000 per employee. Shares purchased and funded by an employee’s pre-tax salary must remain in the plan for a minimum of one year. Matching shares funded by the Group must be kept in the plan for a minimum of two years or they will be forfeited. All permanent employees in Australia employed at the allocation date are entitled to participate in this plan. A derivative of this plan and the Exempt Employee Share Plan have been made available to employees in New Zealand, Hong Kong, China, the United Kingdom, Ireland, Jersey, Germany, Canada, South Africa and the US.
Subject to the discretion of the Board, shares in the parent entity may also be allocated to selected employees on a discretionary basis having regard to special circumstances as determined by the Remuneration Committee. Such shares may be subject to vesting and performance criteria as determined by the Board or the Remuneration Committee.

122
Deferred Short-Term Incentive (DSTI) Share PlanThe Group also provides DSTI awards to key management personnel and other senior executives as part of a structured STI plan and other high performing employees on a discretionary basis. Recipients of DSTI awards must complete specified periods of service as a minimum before any share awards under the DSTI plan become unconditional.
Ordinary shares
Number of employee shares held 2021 2020
Opening balance 11,188,579 9,781,063
Shares purchased on the market 2,990,432 3,941,588
Forfeited shares reissued 253,430 183,334
Shares forfeited (254,947) (94,101)
Shares withdrawn (1,954,457) (2,623,305)
Closing balance 12,223,037 11,188,579
Fair value of shares granted through the employee share plan ($000)* 31,564 39,532
* Weighted average fair value of shares is determined by the closing price at the end of the day’s trading on the Australian Securities Exchange on the allocation date. The average price per share purchased on market was AUD $13.10.
Phantom Share Awards PlanThe Phantom Share Awards Plan (Phantom Plan) was introduced in 2013 as an alternative to the DSTI Share Plan to employees who are resident for tax purposes in countries where the taxation and/or legal requirements mean the DSTI Share Plan does not achieve the most effective outcome for Computershare or those employees. Awards under the Phantom Plan are cash-settled and vest after specified periods of service have been completed.
(b) Long-Term Incentive Plan
Performance rights and share appreciation rightsThe Company offers a long-term incentive plan (LTIP) to eligible key management personnel and senior group executives.
Since 2014, the LTIP plan has comprised awards of performance rights subject to performance hurdles. These rights are granted for no consideration and carry no dividend or voting rights. Each performance right carries an entitlement for the participant to one fully paid ordinary share in Computershare Limited subject to satisfaction of the applicable performance hurdles and continued employment over a three year performance period. Under the LTIP, 50% of each award of performance rights is subject to an EPS hurdle and 50% is subject to a TSR performance hurdle.
In 2020, Company shareholders approved a transitional LTIP for FY2021. The FY2021 LTIP award comprised 50% a grant of performance rights subject to a TSR performance hurdle and the other 50% a grant of Share Appreciation Rights (SARs). A share-settled SAR entitles the participant to a payment (in Company shares) at the end of the performance period equivalent to the amount by which the underlying Company share price has increased since the right was granted. If SARs vest, shares are allocated to the participant to the requisite value with nothing payable by the participant. The vesting value per SAR under the FY2021 LTIP will be calculated as the positive difference between AUD 13.25, being the Company share price at close on 30 June 2020 and the Company share price at the end of the performance period, being the 90-day VWAP up to and including 30 June 2023.
Set out below are summaries of performance rights and SARs granted under the LTIP:
Performance rights
Grant dateApproximate exercise date
Exercise price
Balance at beginning of
the year
Granted during
the year
Exercised during
the year
Lapsed during
the year
Balance at end of
the year
Exercisable at end of the year
5 Dec 2017 Sep 2020 $0.00 476,339 - - (476,339) - -
4 Dec 2018 Sep 2021 $0.00 520,104 - - (1,386) 518,718 -
2 Dec 2019 Sep 2022 $0.00 735,321 - - (9,393) 725,928 -
7 Dec 2020 Sep 2023 $0.00 - 430,086 - (12,674) 417,412 -
Total 1,731,764 430,086 - (499,792) 1,662,058 -
Share appreciation rights
7 Dec 2020 Sep 2023 $0.00 - 1,522,193 - (44,859) 1,477,334 -
Total - 1,522,193 - (44,859) 1,477,334 -

123 | COMPUTERSHARE | ANNUAL REPORT | 2021
NOTES TO THE CONSOLIDATED FINANCIAL STATEMENTS
The fair value of performance rights and share appreciation rights granted under the 2021 LTI plan were assessed using the following parameters:
2021 Plan TSR 2021 Plan SAR
Grant Date 7 December 2020 7 December 2020
Hurdle start date 1 July 2020 1 July 2020
Hurdle end date 30 June 2023 30 June 2023
Share price at grant date AUD 14.39 AUD 14.39
Fair value at measurement date (i) AUD 8.29 AUD 2.65
Exercise price AUD 0.00 AUD 0.00
Expected volatility (ii) 31.25% 31.25%
Option life 3 years 3 years
Expected dividend yield p.a (iii) 3.197% 3.197%
Risk free rate p.a. (iv) 0.110% 0.110%
i) To calculate fair value, a Monte Carlo simulation was used to estimate the likelihood of achieving the relative TSR hurdles and share appreciation hurdle.
ii) Expected volatility is based on historical daily share price for the three-year period preceding the grant date.
iii) Expected dividend yield is based on historic yield for the three-year period immediately preceding the grant date.
iv) Risk free interest rate is based on the three-year zero coupon Australian government bonds at grant date.
(c) Employee benefits recognised
2021$000
2020$000
Performance rights expense 1,822 1,039
Share plan and options expense 20,572 19,604
Aggregate employee entitlement liability (note 22 and 23) 48,477 41,747
41. REMUNERATION OF AUDITORSDuring the year the following fees were paid or payable for services provided by the auditor of the parent entity, its network firms and non-related audit firms:
2021$000
2020$000
Assurance services:
Auditing or review of financial statements
– PricewaterhouseCoopers Australia 989 1,021
– Network firms of PricewaterhouseCoopers Australia 3,328 2,757
4,317 3,778
Other assurance services
– PricewaterhouseCoopers Australia 461 321
– Network firms of PricewaterhouseCoopers Australia 2,146 2,013
2,607 2,334
Taxation services
– Related practices of PricewaterhouseCoopers Australia 463 329
463 329
Remuneration received, or due and receivable, by auditors other than the auditor of the parent entity and its affiliates for:
Auditing or review of financial statements 547 543

124
In the directors’ opinion:
(a) the financial statements and notes set out on pages 65 to 123 are in accordance with the Corporations Act 2001, including:
(i) complying with Accounting Standards, the Corporations Regulations 2001 and other mandatory professional reporting requirements; and
(ii) giving a true and fair view of the consolidated entity’s financial position as at 30 June 2021 and of its performance for the financial year ended on that date; and
(b) there are reasonable grounds to believe that the Company will be able to pay its debts as and when they become due and payable; and
(c) at the date of this declaration, there are reasonable grounds to believe that the members of the Closed Group identified in note 30 will be able to meet any obligations or liabilities to which they are, or may become, subject to by virtue of the deed of cross guarantee described in note 32.
Note 1 confirms that the financial statements also comply with International Financial Reporting Standards as issued by the International Accounting Standards Board.
The directors have been given the declarations by the Chief Executive Officer and Chief Financial Officer required by section 295A of the Corporations Act 2001.
Signed in accordance with a resolution of the directors.
SD Jones Chairman
SJ Irving Director
20 September 2021
DIRECTORS’ DECLARATION
REPORTS

125 | COMPUTERSHARE | ANNUAL REPORT | 2021
The Chief Executive Officer and Chief Financial Officer state that:
(a) the financial records of the consolidated entity for the financial year ended 30 June 2021 have been properly maintained in accordance with section 286 of the Corporations Act 2001; and
(b) the financial statements, and the notes to the financial statements, of the consolidated entity, for the financial year ended 30 June 2021:
(i) comply with Accounting Standards, the Corporations Regulations 2001 and other mandatory professional reporting requirements; and
(ii) give a true and fair view of the consolidated entity’s financial position as at 30 June 2021 and of their performance for the financial year ended on that date.
SJ Irving Chief Executive Officer
NSR Oldfield Chief Financial Officer
20 September 2021
DECLARATION TO THE BOARD OF DIRECTORS

126
INDEPENDENT AUDITOR’S REPORT
PricewaterhouseCoopers, ABN 52 780 433 757 2 Riverside Quay, SOUTHBANK VIC 3006, GPO Box 1331, MELBOURNE VIC 3001 T: 61 3 8603 1000, F: 61 3 8603 1999, www.pwc.com.auLiability limited by a scheme approved under Professional Standards Legislation.
PricewaterhouseCoopers, ABN 52 780 433 757 2 Riverside Quay, SOUTHBANK VIC 3006, GPO Box 1331, MELBOURNE VIC 3001 T: 61 3 8603 1000, F: 61 3 8603 1999, www.pwc.com.au
Liability limited by a scheme approved under Professional Standards Legislation.
Independent auditor’s report To the members of Computershare Limited
Report on the audit of the financial report
Our opinion In our opinion:
(a) The accompanying financial report of Computershare Limited (the Company) and its controlled entities (together the Group) is in accordance with the Corporations Act 2001, including:
i. giving a true and fair view of the Group's financial position as at 30 June 2021 and of its financial performance for the year then ended
ii. complying with Australian Accounting Standards and the Corporations Regulations 2001.
(b) The financial report and notes also comply with International Financial Reporting Standards as disclosed in Note 1.
What we have audited The Group financial report comprises:
● the consolidated statement of financial position as at 30 June 2021 ● the consolidated statement of comprehensive income for the year then ended ● the consolidated statement of changes in equity for the year then ended ● the consolidated cash flow statement for the year then ended ● the notes to the consolidated financial statements, which include significant accounting policies
and other explanatory information ● the directors’ declaration.
Basis for opinion
We conducted our audit in accordance with Australian Auditing Standards. Our responsibilities under those standards are further described in the Auditor’s responsibilities for the audit of the financial report section of our report.
We believe that the audit evidence we have obtained is sufficient and appropriate to provide a basis for our opinion.
Independence We are independent of the Group in accordance with the auditor independence requirements of the Corporations Act 2001 and the ethical requirements of the Accounting Professional & Ethical Standards Board’s APES 110 Code of Ethics for Professional Accountants (including Independence Standards) (the Code) that are relevant to our audit of the financial report in Australia. We have also fulfilled our other ethical responsibilities in accordance with the Code.

127 | COMPUTERSHARE | ANNUAL REPORT | 2021
INDEPENDENT AUDITOR’S REPORT
Our audit approach
An audit is designed to provide reasonable assurance about whether the financial report is free from material misstatement. Misstatements may arise due to fraud or error. They are considered material if individually or in aggregate, they could reasonably be expected to influence the economic decisions of users taken on the basis of the financial report.
We tailored the scope of our audit to ensure that we performed enough work to be able to give an opinion on the financial report as a whole, taking into account the geographic and management structure of the Group, its accounting processes and controls and the industry in which it operates.
Materiality
● For the purpose of our audit we used overall Group materiality of $12.9 million, which represents approximately 5% of the Group’s profit before tax, excluding the gain on disposal of an equity investment.
● We applied this threshold, together with qualitative considerations, to determine the scope of our audit and the nature, timing and extent of our audit procedures and to evaluate the effect of misstatements on the financial report as a whole.
● We chose adjusted Group profit before tax because, in our view, it is the benchmark against which the performance of the Group is most commonly measured. We adjusted for the gain on disposal of an equity investment as it was an infrequent item impacting profit and loss.
● We utilised a 5% threshold based on our professional judgement, noting it is within the range of commonly acceptable thresholds.
Audit Scope
● Our audit focused on where the Group made subjective judgements; for example, significant accounting estimates involving assumptions and inherently uncertain future events.
● The Group operates in more than 20 countries, with the majority of its business based in six geographical locations – Australia, United States of America, United Kingdom, Canada, Hong Kong and Switzerland. The Group engagement team determined the nature, timing and extent of work that needed to be performed by it and by auditors operating under its instruction (component auditors). We structured our audit approach as follows:
− We audited certain entities in Australia, United States of America, United Kingdom, Hong Kong and Canada due to their financial significance to the Group.

128
− We performed specified risk focused procedures on certain account balances for other entities in Australia, United States of America, United Kingdom, Canada and Switzerland.
− We carried out further procedures at the Group level, including procedures over consolidation and preparation of the financial statements.
● For work performed by component auditors, we determined the level of involvement required from us in order to be able to conclude whether sufficient appropriate audit evidence had been obtained. Our involvement included discussions, written instructions and holding meetings with component audit teams in Australia, United States of America, United Kingdom, Canada, Hong Kong and Switzerland.
Key audit matters Key audit matters are those matters that, in our professional judgement, were of most significance in our audit of the financial report for the current period. The key audit matters were addressed in the context of our audit of the financial report as a whole, and in forming our opinion thereon, and we do not provide a separate opinion on these matters. Further, any commentary on the outcomes of a particular audit procedure is made in that context. We communicated the key audit matters to the Risk and Audit Committee.
Key audit matter How our audit addressed the key audit matter
Impairment assessment of goodwill (Refer to note 10 of the financial statements)
The Group had a goodwill balance of USD 1.9 billion at 30 June 2021, representing approximately 36% (30 June 2020: 37%) of the total assets of the Group.
The Group is required to perform an impairment assessment of its goodwill balance at least annually under Australian Accounting Standards.
The Group performed an impairment assessment over the goodwill balance by calculating the value in use for each operating segment, which is comprised of groups of cash generating units (CGUs), or CGUs separately identified for impairment testing, using discounted cash flow models (the models).
We considered the impairment assessment of goodwill to be a key audit matter as the goodwill balance is significant to the consolidated statement of financial position and significant judgement is required by the Group in estimating future cash flows, particularly with respect to determining appropriate:
● Discount rates.
● Five year cash flow projections (in a limited number of cases, the CGU cash flow projections are for a period longer than five years to account for the nature of the cash flows and specific circumstances).
We evaluated whether the Group’s identification of CGUs, which are the smallest identifiable groups of assets that can generate largely independent cash inflows, was consistent with our knowledge of the Group’s operations and the internal organisational structure.
We evaluated whether the methods applied in calculating and allocating carrying value and value in use to the identified CGUs were in line with the requirements of Australian Accounting Standards.
In relation to the models, we performed the following procedures, amongst others:
● Tested the mathematical accuracy of the models’ calculations, on a sample basis.
● Compared cash flow forecasts to Board approved business plans.
● Compared previous cash flow forecasts to actual results to assess the historical accuracy of forecasting.
● Together with PwC valuation experts, assessed the appropriateness of discount rates contained in the models, for a sample of CGUs, by comparing these to relevant external data.
● Tested whether cash flow forecasts and terminal growth rates used in the models are consistent with our knowledge of current business conditions, externally derived data

129 | COMPUTERSHARE | ANNUAL REPORT | 2021
INDEPENDENT AUDITOR’S REPORT
Key audit matter How our audit addressed the key audit matter
● Earnings growth rates applied beyond the short-term cash flow forecasts (terminal growth rates).
(where possible) and our understanding of the business.
● For each operating segment, assessed the Group’s sensitivity analysis which included the Group’s assessment of reasonably possible changes to key assumptions.
We also considered the reasonableness of the Group’s financial report disclosures in relation to this matter in light of the requirements of Australian Accounting Standards.
Useful life assessment of Mortgage Servicing Rights (MSRs) (Refer to note 9 in the financial statements)
The Group held MSRs after amortisation of USD 678 million at 30 June 2021 (30 June 2020: USD 713 million), representing approximately 12.9% (30 June 2020: 14.3%) of the total assets of the Group. MSRs are intangible assets acquired that provide the legal right to service a particular mortgage for a fee for the duration of its life. The owner of the MSR can either service the loan itself or appoint a sub-servicer to do so.
Amortisation for MSRs is calculated using the straight-line method over their estimated useful lives of eight years for the interest-sensitive part of the portfolio and nine years for the non-interest sensitive part of the portfolio.
The estimated useful life of MSRs reflects the Group’s estimate of the average life of the underlying mortgages. The most significant factors impacting the useful life are US mortgage interest rates and the rate of the borrowers’ prepayments. The average life of MSRs decreases where US interest rates are lower or borrower prepayments are higher than previously estimated, which would result in an increase in amortisation expense.
We considered the useful life of MSRs to be a key audit matter as significant judgement is required by the Group in determining the period over which these rights will generate economic benefits.
We performed the following procedures, amongst others, over the Group’s assessment of the useful life of MSRs:
● Assessed significant assumptions as at 30 June 2021 and any changes to significant assumptions since the Group’s most recent assessment (as at 1 July 2020) by reference to externally derived data (where possible).
● Together with PwC valuation experts, tested the Group’s third party MSR valuer’s estimate for expected remaining useful life.
● Compared the Group’s estimate of useful life for the interest-sensitive and non-interest sensitive loans to that of the Group’s third party MSR valuer.
● Considered the competence and capabilities of the Group’s third party MSR valuer.
We also considered the reasonableness of the Group’s financial report disclosures in relation to this matter in light of the requirements of Australian Accounting Standards.

130
Other information The directors are responsible for the other information. The other information comprises the information included in the annual report for the year ended 30 June 2021, but does not include the financial report and our auditor’s report thereon.
Our opinion on the financial report does not cover the other information and accordingly we do not express any form of assurance conclusion thereon.
In connection with our audit of the financial report, our responsibility is to read the other information and, in doing so, consider whether the other information is materially inconsistent with the financial report or our knowledge obtained in the audit, or otherwise appears to be materially misstated.
If, based on the work we have performed on the other information that we obtained prior to the date of this auditor’s report, we conclude that there is a material misstatement of this other information, we are required to report that fact. We have nothing to report in this regard.
Responsibilities of the directors for the financial report The directors of the Company are responsible for the preparation of the financial report that gives a true and fair view in accordance with Australian Accounting Standards and the Corporations Act 2001 and for such internal control as the directors determine is necessary to enable the preparation of the financial report that gives a true and fair view and is free from material misstatement, whether due to fraud or error. In Note 1, the directors also state, in accordance with Accounting Standard AASB 101 Presentation of Financial Statements, that the financial statements comply with International Financial Reporting Standards.
In preparing the financial report, the directors are responsible for assessing the ability of the Group to continue as a going concern, disclosing, as applicable, matters related to going concern and using the going concern basis of accounting unless the directors either intend to liquidate the Group or to cease operations, or have no realistic alternative but to do so.
Auditor’s responsibilities for the audit of the financial report Our objectives are to obtain reasonable assurance about whether the financial report as a whole is free from material misstatement, whether due to fraud or error, and to issue an auditor’s report that includes our opinion. Reasonable assurance is a high level of assurance, but is not a guarantee that an audit conducted in accordance with the Australian Auditing Standards will always detect a material misstatement when it exists. Misstatements can arise from fraud or error and are considered material if, individually or in the aggregate, they could reasonably be expected to influence the economic decisions of users taken on the basis of the financial report.
A further description of our responsibilities for the audit of the financial report is located at the Auditing and Assurance Standards Board website at: https://www.auasb.gov.au/admin/file/content102/c3/ar1_2020.pdf. This description forms part of our auditor's report.

131 | COMPUTERSHARE | ANNUAL REPORT | 2021
INDEPENDENT AUDITOR’S REPORT
Report on the remuneration report
Our opinion on the remuneration report We have audited the remuneration report included in pages 44 to 62 of the directors’ report for the year ended 30 June 2021.
In our opinion, the remuneration report of Computershare Limited for the year ended 30 June 2021 complies with section 300A of the Corporations Act 2001.
Responsibilities The directors of the Company are responsible for the preparation and presentation of the remuneration report in accordance with section 300A of the Corporations Act 2001. Our responsibility is to express an opinion on the remuneration report, based on our audit conducted in accordance with Australian Auditing Standards.
PricewaterhouseCoopers Marcus Laithwaite
Melbourne Partner 20 September 2021

132
This section contains additional information required by the Australian Securities Exchange Limited listing rules not disclosed elsewhere in this report.
SHAREHOLDINGSSubstantial Shareholders The following information is extracted from the Company’s Register of Substantial Shareholders.
NameNumber of
ordinary sharesFully paid
percentage
AustralianSuper Pty Ltd 64,830,281 11.99%
Christopher John Morris 32,091,083 5.32%
State Street Corporation 30,253,648 5.01%
Class of shares and voting rightsAt 10 September 2021 there were 37,140 holders of ordinary shares in the Company. The voting rights attaching to the ordinary shares set out in clause 4 of the Company’s Constitution are:
a. the right to receive notice of and to attend and vote at all general meetings of the Company;
b. the right to receive dividends; and
c. in a winding up or a reduction of capital, the right to participate equally in the distribution of the assets of the Company (both capital and surplus), subject to any amounts unpaid on the Share and, in the case of a reduction, to the terms of the reduction.
Distribution of shareholders of shares as at 10 September 2021
Size of holdingOrdinary
shareholders
1 – 1,000 19,544
1,001 – 5,000 13,992
5,001 – 10,000 2,101
10,001 – 100,000 1,387
100,001 and over 116
Total shareholders 37,140
There were 678 shareholders holding less than a marketable parcel of 31 ordinary shares as at 10 September 2021.
Twenty Largest Shareholders of ordinary shares as at 10 September 2021Ordinary shares
Number %
HSBC Custody Nominees (Australia) Limited 165,229,433 27.37
J P Morgan Nominees Australia Pty Limited 147,945,511 24.51
Citicorp Nominees Pty Limited 71,337,633 11.82
Christopher John Morris 32,091,083 5.32
National Nominees Limited 20,254,757 3.35
Welas Pty Ltd 19,461,364 3.22
Penelope Maclagan 10,875,603 1.80
BNP Paribas Nominees Pty Ltd <Agency Lending DRP A/C> 8,992,133 1.49
BNP Paribas Noms Pty Ltd <DRP> 6,053,457 1.00
Argo Investments Limited 5,458,117 0.90
CPU Share Plans Pty Limited 4,010,221 0.66
Australian Foundation Investment Company Limited 3,630,000 0.60
Computershare Clearing Pty Ltd 3,622,483 0.60
BNP Paribas Nominees Pty Ltd Six Sis Ltd <DRP A/C> 3,258,869 0.54
HSBC Custody Nominees (Australia) Limited <Nt-Comnwlth Super Corp A/C> 3,222,214 0.53
Netwealth Investments Limited <Wrap Services A/C> 2,805,641 0.46
Fraser Island Pty Ltd <Fraser Island Unit A/C> 2,558,093 0.42
Ms Michele Jean O'Halloran 2,198,638 0.36
BNP Paribas Nominees Pty Ltd Hub24 Custodial Serv Ltd <DRP A/C> 1,693,742 0.28
Citicorp Nominees Pty Limited <Colonial First State Inv A/C> 1,680,489 0.28
Total 516,379,481 85.53
SHAREHOLDER INFORMATION
FURTHER INFORMATION

133 | COMPUTERSHARE | ANNUAL REPORT | 2021
CORPORATE DIRECTORY
DIRECTORSSimon David Jones(Chairman)Stuart James Irving(President and Chief Executive Officer)Abigail Pip ClelandTiffany Lee FullerLisa Mary GayChristopher John Morris Paul Joseph ReynoldsJoseph Mark Velli
COMPANY SECRETARYDominic Matthew Horsley
REGISTERED OFFICEYarra Falls452 Johnston StreetAbbotsford VIC 3067
Telephone +61 3 9415 5000Facsimile +61 3 9476 2500
STOCK EXCHANGE LISTINGAustralian Securities Exchange
AUDITORSPricewaterhouseCoopers2 Riverside QuaySouthbank VIC 3006
SHARE REGISTRYComputershare Investor Services Pty LimitedYarra Falls452 Johnston StreetAbbotsford VIC 3067
PO BOX 103Abbotsford VIC 3067
Telephone 1300 307 613(within Australia) + 61 3 9415 4222Facsimile + 61 3 9473 2500
INVESTOR RELATIONSYarra Falls452 Johnston StreetAbbotsford VIC 3067
Telephone +61 3 9415 5000Facsimile +61 3 9476 2500
Email [email protected]
Website www.computershare.com


Computershare LimitedABN 71 005 485 825
The Annual Reportis available online atwww.computershare.com
COMPUTERSHAREHEAD OFFICE
Yarra Falls452 Johnston StreetAbbotsford Victoria 3067Australia
Telephone: +61 3 9415 5000Facsimile: +61 3 9473 2500
COMPUTERSHARE ANNUAL REPORT | 20
21