Computers, Urban Studies, and Urban Management · •DotSpatial 1.3 •C# • The model parameters...
36
1 Computers, Urban Studies, and Urban Management Jean-Claude Thill Geography and Public Policy Univ. of North Carolina at Charlotte United States
Transcript of Computers, Urban Studies, and Urban Management · •DotSpatial 1.3 •C# • The model parameters...

1
Computers, Urban Studies, and
Urban Management
Jean-Claude Thill
Geography and Public Policy
Univ. of North Carolina at Charlotte
United States

2
Computers in Urban Planning and Management
The beginnings • Computing devices used in public planning for 100 years
• Transportation planning
• Population and housing census
• Mainframe computers
• Hardware, software, and models were a bottleneck
• Slow, not interactive (batch sessions)
• Few variables
• Coarse representation of the city region
• “Fitting the reality to the model”
3
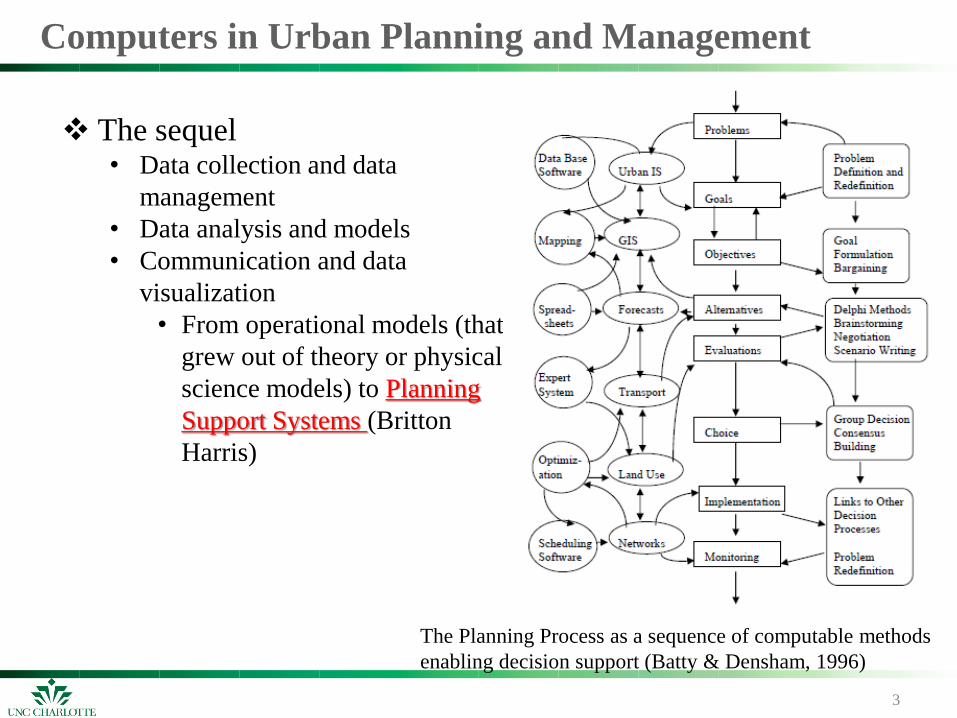
The sequel • Data collection and data
management
• Data analysis and models
• Communication and data
visualization
• From operational models (that
grew out of theory or physical
science models) to Planning
Support Systems (Britton
Harris)
Computers in Urban Planning and Management
The Planning Process as a sequence of computable methods
enabling decision support (Batty & Densham, 1996)

4
Planning Support Systems (PSS)
Many planning problems
are semi-structured
Planning problems are
inter-related • Partial or holistic view
• Modular structure
• Common “language”, with
shared data, shared vision,
interoperable modeling tools
• Collaborative environment
to solve multifaceted
problems (group DSS)
(Lolonis, 1990)
Sustainability
•Environmental
•Social
•Economic

5
Data Collection and Management
Geographic Information Systems (GIS) • Computer-based information systems
• Data is organized/referenced by their location
• Started from need in Land Information
Systems
• Enterprise GIS: framework for integrated
workflow

6
Data Collection and Management
Geographic Information Systems (GIS) • Data integration

Cadastral systems
• Parcels are a critical part of a modern GIS
Data Collection and Management
7

Cadastral systems
• Parcels are linked to many operations of government
Data Collection and Management
8

Potential Benefits to Local Government
Assures that the best available data are used in each public transaction
Avoids conflicts among land records of different public offices
Improves accuracy of real-property assessments
Provides base maps for local planning and preliminary engineering studies
Provides a standardized data base for neighborhood, municipal, county. or regional development plans
Avoids costs of maintaining separate map systems and land – data files
Encourages coordination among separate map systems and land –data files
Improves public attitudes toward administration of local government programs
Potential Benefits to provincial & national governments
Provides accurate inventories of natural assets
Provides accurate locational references for administration of state regulations such as pollution controls
Accurately locate state ownership s of other interest in land
Provides a standardize data base for management of public lands
Provides large-scale base maps for siting studies
Simplifies coordination among province and local offices
Provides a data base for monitoring objects of national concern e.g. agricultural land use and foreign ownership of real estate
Provides standardized records for managing provincial/national assistance to local programs such as housing, community development and historic preservation
Potential Benefits to private firms and individuals
Data Collection and Management
Cadastral systems
9

Property Ownership Land Records Information
System (POLARIS), Charlotte, North Carolina
Data Collection and Management
10

Charlotte-Mecklenburg Co – Property Records
Data Collection and Management
11

POLARIS – Great Search
Data Collection and Management
12

Economic Development
Data Collection and Management

Data Analysis & Modeling
Urban computing • Emerging concept where every sensor, device, person, vehicle, building,
and street in the urban areas can be used as a component to sense city
dynamics to enable city-wide computing to tackle the challenges of urban
areas (urban planning) so as to serve people and cities
• Using crowd-sourcing, volunteered geographic information to better under
use and function of cities
Questions • What‟s wrong with the city configuration?
• Does a carried out urban plan really work?

15
Data Analysis & Modeling
Urban Computing • Taxi trajectories in Beijing (67,000)
• Detection of traffic anomalies, functional regions, travel itinerary
suggestions

16
Data Analysis & Modeling
Urban Computing • Bus Smart Card, Beijing
• Commuter trips, updating travel behavior surveys

17
Data Analysis & Visualization
Models of Urban Dynamics • Evolution of Urban Models
Spatial Interaction
DRAM/EMPAL
HLFM II+
Spatial Input-Output
MEPLAN
TRANUS
Lowry:
Gravity Model 1960
1970
1980
1990
2000
Leontieff:
Input-Output Model
McFadden:
Discrete-
Choice
Models
Orcutt:
Microsimulation
Spatially Detailed
Dynamic Land Use
Models: Agent-
based Models
(ABM), UrbanSim
Alonso/Mills/Muth:
Urban Economic
Bid-Rent Theory
Geographic
Information
Systems
Dynamic
Discrete Choice
Land Use
Models:
HUDS
Equilibrium
Discrete Choice
Land Use
Models:
METROSIM
MUSSA
Hybrid Spatial I/O
Models: PECAS
Land Cover
Change Models:
LEAM, SLEUTH
Cellular Automata
Urban Growth Model

Data Analysis & Visualization: Urban Dynamics
Land use & Transportation
How is ABM/CLUES different… • Than Spatial I/O and Spatial Interaction Models
• E.g. TRANUS, MEPLAN, DRAM/EMPAL
• Dynamic, not cross-sectional equilibrium
• Microsimulates agents and spaces, not aggregate
• Than Cellular Automata Models
• Land Cover or Land Use Change Models
• Agents and behaviors not based on cell transitions
• Clearer accounting of agents, real estate, location
• Better for policy assessment and analysis
18

How C.L.U.E.S. Works
• Process-based approach
• Behavioral simulations of individual agents
• Parcel level - allows for fine-grained analyses
• Integrates transportation and land use
• Models market interactions
• Dynamically simulates annual time steps
• Portable and open-source
• Customized version of UrbanSim
19
Data Analysis & Visualization: Urban Dynamics
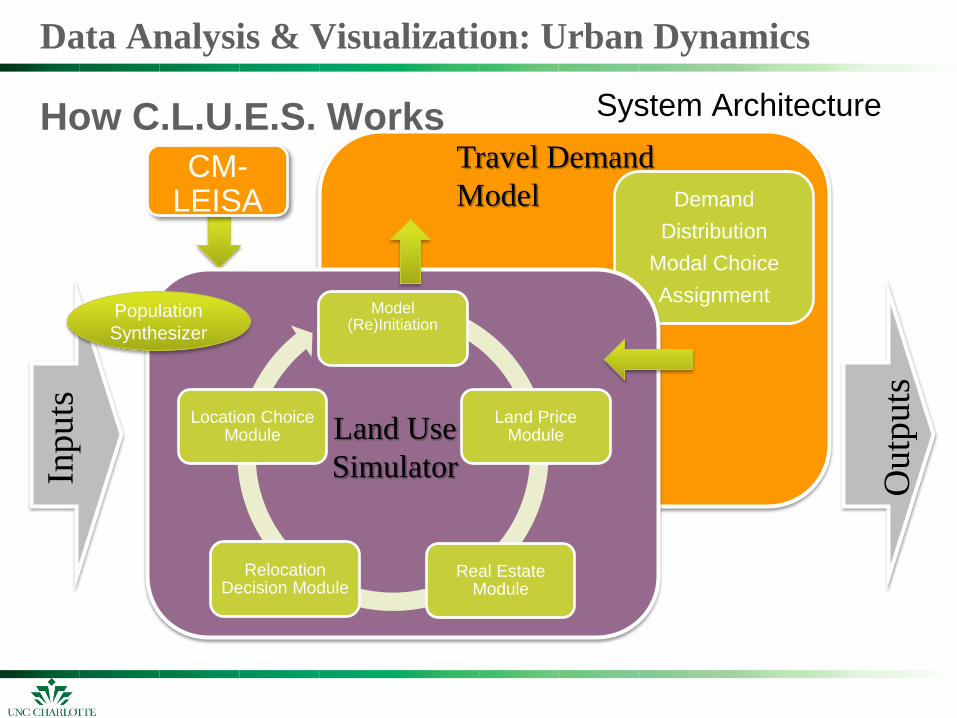
System Architecture
How C.L.U.E.S. Works
Land Use
Simulator
CM-LEISA
Inpu
ts
Demand
Distribution
Modal Choice
Assignment
Outp
uts
Travel Demand
Model
Model (Re)Initiation
Land Price Module
Real Estate Module
Relocation Decision Module
Location Choice Module Land Use
Simulator
Population
Synthesizer
Data Analysis & Visualization: Urban Dynamics

How C.L.U.E.S. Works
• Process-based approach
• Behavioral simulations of individual agents
• Parcel level - allows for fine-grained analyses
• Integrates transportation and land use
• Models market interactions
• Dynamically simulates annual time steps
• Portable and open-source
• Customized version of UrbanSim
21
Data Analysis & Visualization: Urban Dynamics

Raw Data Data Source Derived Input Data
Parcel & Tax Data
(2001-2009)
Mapping and Project Services in
Mecklenburg County
Parcels & Buildings
Development templates
PUMS (2008 )
STF3 (2000)
Census Bureau Households
Persons
Jobs & Businesses
(2006, 2008, 2010)
Employment Security Commission
ReferenceUSA
Charlotte-Mecklenburg Planning
Dept.
Jobs at place of work by
NAICS code
Zoning ordinances Charlotte-Mecklenburg Planning
Dept.
Planning Dept. of all the towns
Development constraints
Protected land North Carolina Gap Analysis Project Development constraints
FEMA Mecklenburg County Development constraints
Preliminary plans Mecklenburg County Development templates
Transport network Metrolina/CDOT Travel data
C.L.U.E.S. Inputs
Data Analysis & Visualization: Urban Dynamics
22

Economic Sectors
Construction, Natural resources, Mining
Manufacturing
Transportation, Trade, Utilities
Information
Financial activities
Professional & Business Services
Education & Health Service
Leisure & Hospitality
Other services
Government
Economic Sectors
Construction, Natural resources, Mining
Manufacturing
Transportation, Trade, Utilities
Information
Financial activities
Professional & Business Services
Education & Health Service
Leisure & Hospitality
Other services
Government
Economic
Sectors
Inputs Businesses in Parcels, Mecklenburg County, 2008
Data Analysis & Visualization: Urban Dynamics
23

Inputs
Land Use Map, Mecklenburg County, 2008
Data Analysis & Visualization: Urban Dynamics
24

Jobs Projections Sample
Outputs
Data Analysis & Visualization: Urban Dynamics
25

Policy Evaluation (what is testable?)
Land Use
Trans- portation
Land Use
Trans- portation
Other
Land Use
Trans- portation
Other
Land Use
Trans- portation
Other
PRICING
INFRA-STRUCTURE
SERVICE
REGULATORY
EDUCATION
/ MARKETING
• Taxation: property taxes • Subsidies: Business Redevelopment Zones • Development Fees
• Public Housing • Servicing land • Government buildings/other institutions
• Zoning • Micro-design building/ neighborhood issues
Changing / how to change attitude
and sensitivities (e.g. traveler
‘value of time’ as opposed to
deeply held value )
• Road tolls/congestion pricing • Gas taxes • Transit fares • Parking pricing
• Build roads, HOV • Build rail/dedicated transit ways • Operate transit services
• Rules of road (speed limit, on-street parking, HOV lanes, etc)
• Income distribution (progressive taxation,
welfare, etc)
• Emission standards (vehicle-specific) • Noise
Reference: Hunt, Kriger, and Miller, 2005
Blue text indicates
„implicit‟ policy
capability
26
Data Analysis & Visualization: Urban Dynamics

27
Under Development:
Google Earth platform
to better communicate
with the public on
urban form

Data Analysis & Visualization: Facility Location Models
28
Rapidly expanding urban areas are dynamic environments
• Need to expand existing network of public facilities to meet anticipated
increase or decrease in demand
• schools, libraries, emergency services
Closing existing facilities in areas characterized by population
decline Location models are tools for regional and urban planners and
decision makers
• Each student must be assigned to a school
• Budget determines number of schools (p-median)
• School deemed essential can be kept in the system
Public facility location models • Minimize total travel distance to the facility j
• p-median - Hakimi (1964)

29
Formulation
Objective Function
Ii Jj
ijiji XdaZmin
Where Z is the total impedance
i is a demand node, I is the set of all demand nodes
j is a school site location, J is the collection of all school sites
ai is the demand at location i
dij is the impedance between locations i and j
Xij means the allocation between demand i and site j
Data Analysis & Visualization: Facility Location Models

30
Formulation
Subject to (constraints)
p is the total number of schools to open
is minimum capacity of school site j
is maximum capacity of school site j
Yj is the location decision variable
-
1
,
{0,1}
{0,1}
ij
j J
ij j
j
j J
j i ij
i I
j i ij
i I
ij
j
X i I
X Y i I j J
Y p
C a X j J
C a X j J
X i I
Y j J
-
jC
jC
Data Analysis & Visualization: Facility Location Models
31
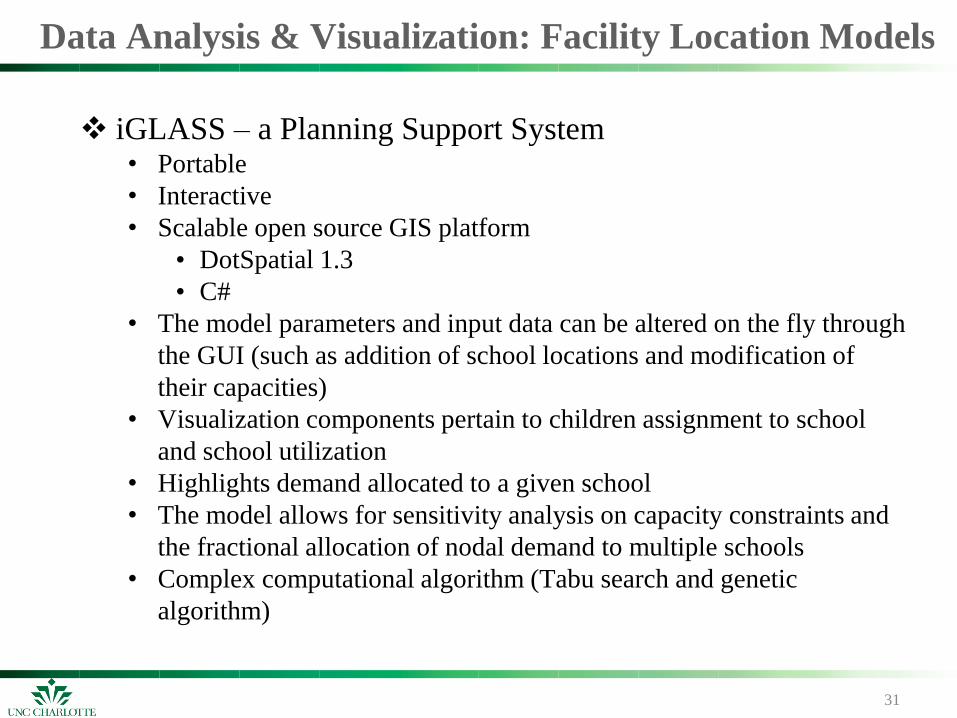
iGLASS – a Planning Support System • Portable
• Interactive
• Scalable open source GIS platform
• DotSpatial 1.3
• C#
• The model parameters and input data can be altered on the fly through
the GUI (such as addition of school locations and modification of
their capacities)
• Visualization components pertain to children assignment to school
and school utilization
• Highlights demand allocated to a given school
• The model allows for sensitivity analysis on capacity constraints and
the fractional allocation of nodal demand to multiple schools
• Complex computational algorithm (Tabu search and genetic
algorithm)
Data Analysis & Visualization: Facility Location Models

32
iGLASS Menu Toolbox
Layers
Maps
Data Analysis & Visualization: Facility Location Models

33
Conclusions
Urban studies have made major progress thanks to
computers and information technologies, and so have
urban planning and urban management
Recent trends are from model-intensive to data-intensive
The integration and coupling of data, modeling, and
visualization leverage the strength of each component
Spatial information technologies present great
opportunities for spatial urban and regional planning in fast
developing countries

35
Editable attribute tables
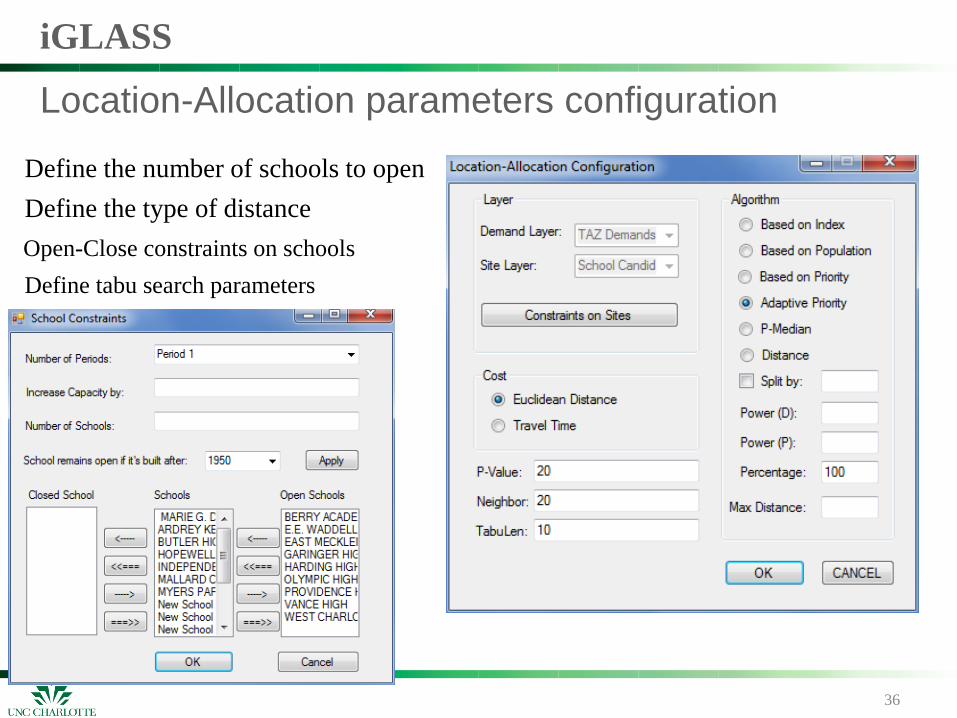
iGLASS
36
Location-Allocation parameters configuration
iGLASS
Define the number of schools to open
Define the type of distance
Open-Close constraints on schools
Define tabu search parameters