Computers, Environment and Urban Systems€¦ · methodsthatreasonand/orsupport reasoning with or...
16
Supporting geographically-aware web document foraging and sensemaking Brian Tomaszewski a,⇑ , Justine Blanford b,1 , Kevin Ross b,1 , Scott Pezanowski b,1 , Alan M. MacEachren b,1 a Department of Information Sciences & Technologies, Rochester Institute of Technology, 31 Lomb Memorial Drive, Rochester, NY 14623, USA b Department of Geography and GeoVISTA Center, The Pennsylvania State University, 302 Walker Building, University Park, PA 16801, USA article info Article history: Received 5 November 2009 Received in revised form 15 January 2011 Accepted 17 January 2011 Available online 18 February 2011 Keywords: Visual analytics Sensemaking Information foraging Geographic information retrieval Infectious disease dynamics Niger abstract This paper reports on the development and application of strategies and tools for geographic information seeking and knowledge building that leverages unstructured text resources found on the web. Geo- graphic knowledge building from unstructured web sources starts with web document foraging during which the quantity, scope and diversity of web-based information create incredible cognitive burdens on an analyst’s or researcher’s ability to judge information relevancy. Determining information relevancy is ultimately a process of sensemaking. In this paper, we present our research on visually supporting web document foraging and sensemaking. In particular, we present the Sense-of-Place (SensePlace) analytic environment. The scientific goal of SensePlace is to visually and computationally support analyst sense- making with text artifacts that have potential place, time, and thematic relevance to an analytical prob- lem through identification and visual highlighting of named entities (people, places, times, and organizations) in documents, automated inference to determine document relevance using stored knowl- edge, and a visual interface with coupled geographic map, timeline, and concept graph displays that are used to contextualize the contexts of potentially relevant documents. We present the results of a case study analysis using SensePlace to uncover potential population migration, geopolitical, and other infec- tious disease dynamics drivers for measles and other epidemics in Niger. Our analysis allowed us to dem- onstrate how our approach can support analysis of complex situations along (a) multi-scale geographic dimensions (i.e., vaccine coverage areas), (b) temporal dimensions (i.e., seasonal population movement and migrations), and (c) diverse thematic dimensions (effects of political upheaval, food security, tran- sient movement, etc.). Ó 2011 Elsevier Ltd. All rights reserved. 1. Introduction The web provides tremendous and exponentially expanding information resources that can be used to support diverse research and analytical tasks. Examples include: exploring public and local government responses to flu outbreaks (based on news reports and health department bulletins), understanding geographic varia- tion in perspectives on environment-development trade-offs (based on analysis of organization web sites and reports), monitor- ing and anticipating changing geopolitical situations (through inte- grated analysis of government documents and news stories), and analyzing the context of humanitarian crises for relief funding decision making through situation report analysis. Assembling and making sense of relevant web resources to sup- port these and other similar tasks is continually problematic due to the escalating volume of information contained in semi-structured and unstructured documents available through open source information channels (news reports, organization web sites, gov- ernment information bulletins, blogs, etc.). The volumes of poten- tially relevant data are much greater than can be processed by hand. We propose a visual analytics approach to cope with this data volume. Broadly, visual analytics has been defined as the ‘‘science of analytical reasoning facilitated by interactive visual interfaces’’ (Thomas & Cook, 2005). Here, we focus on integration of visual and computational methods to augment human information foraging and sensemaking abilities; thus to augment abilities to find relevant information and construct knowledge from that information. Document foraging and sensemaking with large numbers of di- verse documents creates three essential challenges. The first is a scientific challenge to make foraging effective by identifying and contextualizing the most relevant documents and to support sensemaking that is based upon context-dependent relationships among topics, themes, events, and locations identified in those documents. The second is a technical challenge of quickly harvest- ing and processing documents (i.e., extracting relevant text from web pages, geocoding locations, extracting key words) to support 0198-9715/$ - see front matter Ó 2011 Elsevier Ltd. All rights reserved. doi:10.1016/j.compenvurbsys.2011.01.003 ⇑ Corresponding author. Tel.: +1 585 259 9678; fax: +1 585 475 2181. E-mail addresses: [email protected] (B. Tomaszewski), [email protected] (J. Blanford), [email protected] (K. Ross), [email protected] (S. Pezanowski), maceachren@ psu.edu (A.M. MacEachren). 1 Tel.: +1 814 238 4279. Computers, Environment and Urban Systems 35 (2011) 192–207 Contents lists available at ScienceDirect Computers, Environment and Urban Systems journal homepage: www.elsevier.com/locate/compenvurbsys
Transcript of Computers, Environment and Urban Systems€¦ · methodsthatreasonand/orsupport reasoning with or...

Computers, Environment and Urban Systems 35 (2011) 192–207
Contents lists available at ScienceDirect
Computers, Environment and Urban Systems
journal homepage: www.elsevier .com/locate /compenvurbsys
Supporting geographically-aware web document foraging and sensemaking
Brian Tomaszewski a,⇑, Justine Blanford b,1, Kevin Ross b,1, Scott Pezanowski b,1, Alan M. MacEachren b,1
a Department of Information Sciences & Technologies, Rochester Institute of Technology, 31 Lomb Memorial Drive, Rochester, NY 14623, USAb Department of Geography and GeoVISTA Center, The Pennsylvania State University, 302 Walker Building, University Park, PA 16801, USA
a r t i c l e i n f o
Article history:Received 5 November 2009Received in revised form 15 January 2011Accepted 17 January 2011Available online 18 February 2011
Keywords:Visual analyticsSensemakingInformation foragingGeographic information retrievalInfectious disease dynamicsNiger
0198-9715/$ - see front matter � 2011 Elsevier Ltd. Adoi:10.1016/j.compenvurbsys.2011.01.003
⇑ Corresponding author. Tel.: +1 585 259 9678; faxE-mail addresses: [email protected] (B. Tomaszewski
[email protected] (K. Ross), [email protected] (S.psu.edu (A.M. MacEachren).
1 Tel.: +1 814 238 4279.
a b s t r a c t
This paper reports on the development and application of strategies and tools for geographic informationseeking and knowledge building that leverages unstructured text resources found on the web. Geo-graphic knowledge building from unstructured web sources starts with web document foraging duringwhich the quantity, scope and diversity of web-based information create incredible cognitive burdenson an analyst’s or researcher’s ability to judge information relevancy. Determining information relevancyis ultimately a process of sensemaking. In this paper, we present our research on visually supporting webdocument foraging and sensemaking. In particular, we present the Sense-of-Place (SensePlace) analyticenvironment. The scientific goal of SensePlace is to visually and computationally support analyst sense-making with text artifacts that have potential place, time, and thematic relevance to an analytical prob-lem through identification and visual highlighting of named entities (people, places, times, andorganizations) in documents, automated inference to determine document relevance using stored knowl-edge, and a visual interface with coupled geographic map, timeline, and concept graph displays that areused to contextualize the contexts of potentially relevant documents. We present the results of a casestudy analysis using SensePlace to uncover potential population migration, geopolitical, and other infec-tious disease dynamics drivers for measles and other epidemics in Niger. Our analysis allowed us to dem-onstrate how our approach can support analysis of complex situations along (a) multi-scale geographicdimensions (i.e., vaccine coverage areas), (b) temporal dimensions (i.e., seasonal population movementand migrations), and (c) diverse thematic dimensions (effects of political upheaval, food security, tran-sient movement, etc.).
� 2011 Elsevier Ltd. All rights reserved.
1. Introduction
The web provides tremendous and exponentially expandinginformation resources that can be used to support diverse researchand analytical tasks. Examples include: exploring public and localgovernment responses to flu outbreaks (based on news reportsand health department bulletins), understanding geographic varia-tion in perspectives on environment-development trade-offs(based on analysis of organization web sites and reports), monitor-ing and anticipating changing geopolitical situations (through inte-grated analysis of government documents and news stories), andanalyzing the context of humanitarian crises for relief fundingdecision making through situation report analysis.
Assembling and making sense of relevant web resources to sup-port these and other similar tasks is continually problematic due to
ll rights reserved.
: +1 585 475 2181.), [email protected] (J. Blanford),
Pezanowski), maceachren@
the escalating volume of information contained in semi-structuredand unstructured documents available through open sourceinformation channels (news reports, organization web sites, gov-ernment information bulletins, blogs, etc.). The volumes of poten-tially relevant data are much greater than can be processed byhand. We propose a visual analytics approach to cope with this datavolume. Broadly, visual analytics has been defined as the ‘‘science ofanalytical reasoning facilitated by interactive visual interfaces’’(Thomas & Cook, 2005). Here, we focus on integration of visualand computational methods to augment human informationforaging and sensemaking abilities; thus to augment abilities tofind relevant information and construct knowledge from thatinformation.
Document foraging and sensemaking with large numbers of di-verse documents creates three essential challenges. The first is ascientific challenge to make foraging effective by identifying andcontextualizing the most relevant documents and to supportsensemaking that is based upon context-dependent relationshipsamong topics, themes, events, and locations identified in thosedocuments. The second is a technical challenge of quickly harvest-ing and processing documents (i.e., extracting relevant text fromweb pages, geocoding locations, extracting key words) to support

B. Tomaszewski et al. / Computers, Environment and Urban Systems 35 (2011) 192–207 193
the iterative foraging-sensemaking process. The third is a visualinterface challenge of leveraging human expertise and supportinganalytical reasoning with fragmentary information of uncertainquality and relevance extracted by the computational processes(e.g., information providing input about where, when, and whyevents are happening).
In this paper, we present the Sense-of-Place (SensePlace) ana-lytic environment that is designed to address these challenges.SensePlace is a proof-of-concept system for rapid web documentacquisition and contextualization. In particular, the concept behindSensePlace is a visual analytics approach and associated softwareapplication that (a) integrates visual interfaces with computationalmethods that reason and/or support reasoning with or about place-based information and that (b) can be used successfully to foragethrough web documents relevant to both concepts of interestand places of interest and enable a sensemaking process with theforaged heterogeneous, semi-structured, place-based information.We provide a proof-of-concept of the first component throughour implementation of a working system, a demonstration thatthe system can in fact be used, and open source software that oth-ers can build upon. We provide evidence of the potential applica-tion to foraging and sensemaking in complex problem domainsby (a) describing an analytical scenario that was used to formulatethe requirements for SensePlace and (b) presenting detailed resultsof an analysis based on the case study that used SensePlace to buildan integrated understanding of human population movements in aplace (the country of Niger and its neighbors) to support infectiousdisease analysis.
We begin by outlining the theoretical framework that underliesthe design, motivation, and implementation of SensePlace to ad-dress the research challenges detailed above. After this, we providea technical overview of the SensePlace environment. Then, we pres-ent results of a case study analysis using SensePlace. Next, based oninsights from the case study, we provide ideas for future work andenhancements to our system. The paper ends with conclusions wedraw from our work.
2. Theoretical framework
2.1. What is sensemaking?
According to Klein, Moon, and Hoffman (2006:71) ‘‘Sensemak-ing is a motivated, continuous effort to understand connections(which can be among people, places, and events) in order to antic-ipate their trajectories and act effectively’’. In most real-worldproblem domains, sensemaking is a complex, iterative, non-linearprocess that involves multiple overlapping tasks; these tasks areoften focused on finding structure in ill-structured information.While much of the early research on sensemaking emphasizedorganizational management (Weick, 1988), and that focus remains,more recent attention has been directed to the sensemaking pro-cess of individual intelligence, crime, bibliographic, and other ana-lysts (Bex et al., 2007; Pirolli & Card, 2005; Stasko, Gorg, Liu, &Singhal, 2007; Zhang, Qu, Giles, & Song, 2008). There is a strongcommonality between current sensemaking research foci and pastwork in geographic visualization on support for scientific thinkingand knowledge construction using integrated visual and computa-tional methods (for examples, see: Gahegan, 2005; MacEachren,Gahegan, & Pike, 2004). Drawing upon these separate but relateddevelopments in sub-sections below, we discuss the close connec-tion between information foraging and sensemaking that moti-vates our work together with the role of visual analytics insupporting sensemaking and then discuss the place, time, and con-cept inputs that are critical to place-based sensemaking aboutevolving situations.
2.2. Information foraging and sensemaking & visual analytics
According to Pirolli and Card (1995:52), ‘‘. . . information forag-ing refers to activities associated with assessing, seeking, and han-dling information sources’’; for details, see Pirolli (2007) and Pirolliand Card (1999). Information foraging is integrally connected tothe processes of sensemaking. Mental or tangible representationsof information being retrieved through foraging activities will becompared to, integrated with, and sometimes replace existingknowledge so that (a) task-specific questions can be answeredand (b) determination of level of effort to identify additional rele-vant information can be made (Pirolli & Card, 1995; Russell, Stefik,Pirolli, & Card, 1993). Pirolli and Card (2005) model the interactionbetween knowledge and mental or tangible representations of re-trieved information by conceptually coupling information foragingand sensemaking into two ‘‘loops.’’ The first is the foraging loopwhere data is first collected and organized. The second is thesensemaking loop where hypotheses are generated, tested, andpresented. Both loops can incorporate analytical reasoning (by hu-man analysts, supported by representations and interfaces) to sup-port decision making about documents to forage for as well asreasoning about the foraged information to draw conclusions andto augment existing or build new knowledge.
Those engaging in sensemaking rely on both mental and tangi-ble (typically visual) representations to structure or frame theinformation organization process (Peuquet, 1994). When the focusof attention is sensemaking about geographic-scale phenomenonand processes (e.g., disease diffusion, drought, population migra-tion, etc.), mental and tangible representations individually or col-lectively must provide a basis for reasoning about the place, time,and concept components of information (Tomaszewski, 2008). Vi-sual interfaces provide a key support mechanism for creating theserepresentations (Bier, Card, & Bodnar, 2008; Proulx et al., 2006;Stasko, Görg, & Liu, 2008). In the present work, we emphasizevisual interfaces to geographic and temporal representationsthat can be used to organize unstructured web content by spatio-temporal location and scale.
2.3. Place, time, and concept inputs to sensemaking
From various philosophical, geographical, psychological, andscientific perspectives place, time, and concept (sometimes charac-terized as object or attribute) together provide a partial basis forgeneral understanding of the world (Peuquet, 2002). Furthermore,space and time can shape the themes, concepts, and perspectivesused to understand geographic events and processes, Thus, it islogical, particularly for domains in which geography is relevant,to conceptualize sensemaking as having place, time, and conceptinputs. A practical aspect of using place, time, and concept as in-puts to sensemaking is to help simplify reasoning about complexgeographic events and processes (Tomaszewski, 2008; Wang,Miller, Smarick, Ribarsky, & Chang, 2008). Using the intuitive cate-gories of space, time, and concept can help to simplify reasoning byproviding a common-sense structure of information (i.e., compara-ble to the classic ‘‘what, when, where, who and why’’ structure ofnews reporting) (Peuquet, 1994).
In the following section, we present our proof-of-conceptsystem based on the principals discussed in Section 2.
3. The Sense-of-Place analytical environment
The scientific goal of the Sense-of-Place (SensePlace) analyti-cal environment is to visually and computationally supportgeographically-centric sensemaking with text artifacts havingpotential place, time, and concept relevance to an analytical

Fig. 1. SensePlace architecture overview.
194 B. Tomaszewski et al. / Computers, Environment and Urban Systems 35 (2011) 192–207
problem. SensePlace is a free open source web environment builtusing Adobe Flex, Java, and Open Geospatial Standards technolo-gies.2 The label ‘‘SensePlace’’ used for the environment is meant toconvey a duality with ‘‘sensemaking,’’ as per the ideas discussedin Section 2, and ‘‘Sense-of-Place,’’ as a perspective in Geographythat examines the characteristics and attachments that makelocations (or places) unique (Tuan, 1990). An important aspect ofSensePlace from a visual analytics research perspective is theemphasis we put on combining machine-based sensemaking andreasoning with visual interfaces that support human sensemakingand reasoning. Fig. 1 provides a high-level overview of theSensePlace system architecture.
In the following sections, we discuss the major computationaland visual interface components of SensePlace.
3.1. Computational sensemaking
Computational sensemaking in SensePlace is facilitated usingontologies. Ontologies are a common representation device usedto formally model knowledge domains (Masolo et al., 2002).Knowledge modeled in an ontology can be utilized as a precursorto and support mechanism for human sensemaking; this supportcan be provided using automated reasoning services, or what wecall computational sensemaking methods.
In its current implementation, SensePlace supports use of anexisting, user-defined (rather than formally defined or automati-cally constructed) ontology for automated reasoning. SensePlace
2 http://code.google.com/p/geovista/ (Last retrieved 27 April 2010).
uses automated reasoning (AR) techniques to determine relevancerankings of documents retrieved from RSS (Really Simple Syndica-tion) feeds in relation to queries sent to the document repositoriesby using, in part, query terms derived from the user-defined ontol-ogy. AR supplies reasoning that is not realistic for a human analystto do, such as making inferences about 1000 s of documents in atime span of a few seconds to find the few that are most likely tobe relevant. In essence, AR is used to ‘‘make sense’’ (in a rough, firstapproximation) of what is retrieved in terms of the classic informa-tion retrieval paradigm of attempting to match the documents re-trieved to the user’s information needs (Pirolli, 2009). The visualinterface then supports an iterative human sensemaking processto refine (or refute) this approximation.
The specific way in which AR is used to ‘‘make sense’’ of docu-ment relevance is through query expansion (Vallet, Fernández, &Castells, 2005). Query expansion is the notion of taking a basequery string and reformulating or adding additional terms to thebase query to increase retrieval performance (Efthimiadis, 1996).For example, a search using the term ‘‘refugee camp’’ could be ex-panded to include the terms ‘‘displaced persons camp’’, ‘‘tent city’’,or ‘‘transitional shelter.’’ More specifically, SensePlace incorporatesthe basic idea of query expansion by using AR to select additionalquery terms from an ontology that are related to user-suppliedsearch terms through class subsumption and realization relation-ships. Succinctly, class subsumption is the determination of sub/super concept relationships, and is in essence, used to computeclass hierarchies (Turhan, Springer, & Berger, 2006). Using a geo-graphic example, US states are subconcepts of political entitiesand all instances of states (i.e., New York, Pennsylvania) are alsopolitical entities. When all subsumption relationships have been

Fig. 2. Query expansion and document ranking process.
B. Tomaszewski et al. / Computers, Environment and Urban Systems 35 (2011) 192–207 195
computed, the ontology is said to be classified, a step needed tosupport other reasoning services, such as instance realization.Instance realization determines which concept an instance ismost closely related to (Baader, Calvanese, McGuinness, Nardi, &Patel-Schneider, 2003). For further technical details of the ARmethods and their software implementation incorporated inSensePlace, see Tomaszewski (2009).
Fig. 2 provides a high-level overview of the SensePlace queryexpansion and document ranking processes. The ontology used inthe Niger case study presented below (derived from our priorwork on humanitarian crisis contextualization Tomaszewski &MacEachren, 2010), included information on disease, food security,political events, livelihood, infrastructure, migration and mining.
3 Between initial submission of this paper and revision, Metacarta’s free servicewas removed from the web but other services have become available (e.g., Yahoo,OpenCalais) – our system is designed to allow flexibility about which geocodingservice is used.
4 http://news.google.com/news/advanced_news_search?pz = 1&cf = all&ned =us&hl = en (Last retrieved 27 April 2010).
3.2. Geographic information retrieval
The ontology-based computational sensemaking tools de-scribed above are used to support the Geographical InformationRetrieval (GIR) components of SensePlace.’’ We discuss SensePlaceGIR capabilities in this section. It is important to note that GIR isan enabler within SensePlace, not the focus of research advances.Thus methods implemented and described here leverage a suite
of existing GIR web services and open source tools in support ofthe research advances at the heart of SensePlace; the latter as out-lined above are advances in visual interfaces to support foragingand sensemaking enabled by computational methods to processvolumes of data larger than practical for individual analysts.
The foundation of GIR methods used in SensePlace is geographicterm identification and resolution to latitude and longitude coordi-nates using the Metacarta (Rauch, Bukatin, & Baker, 2003) andYahoo geocoding services.3 As developing new methods for disam-biguating place references in documents is not a focus of this re-search, the disambiguation capabilities of these commercial-gradegeocoding services were deemed useful for our research. Further-more, we are also able to impose a geographic focus to documentsby using the advanced search options of Google News, which canrestrict documents searches to certain locations.4

Fig. 3. Overview of the tool’s visual interface components. Label A is the search results interface, B is the selected item details view, C is a document that has been retrieved, Dis the Google search results interface, E is the ontology graph view, F is the timeline view and G is the geographic. In this figure, news stories related to meningitis in Niger arebeing examined. Label A presents a list of articles found. The analyst is able to view a summary of this article in Label B. The key search terms are easily recognized in bold,black, underline. In addition the analyst can check the concepts found by viewing the ontology graph view (Label E) where the concept will be highlighted in yellow. If thearticle is relevant the analyst can read the article (Label C) by clicking on the link in Label A and map the geographic content of the article (Label G). Colors indicate differentdocuments; point shapes indicate different scales of locations found; line thickness represents the frequency in which a place has been referenced in a document. The usercan further examine the context in which a place has been referenced in a document by clicking on the symbol on the map, as evidenced by the map bubble showing a placereference ‘‘snippet’’. Lastly, the user can determine the timing of events by seeing when documents were published on the timeline graph (Label F).
196 B. Tomaszewski et al. / Computers, Environment and Urban Systems 35 (2011) 192–207
Leveraging these geographic term identification and resolutionservices, SensePlace GIR methods focus on using geographic termsindentified from documents along with ontology-based terms
(discussed in the previous section) for document ranking. The basicidea behind document ranking is to assess how closely related agiven document is to a query posed against a set of documents.

B. Tomaszewski et al. / Computers, Environment and Urban Systems 35 (2011) 192–207 197
The more closely related a document is to the query, the more rel-evant the document is considered to be for the information needsof the person or computational process conducting the search.One of the most common and popular mechanisms to support doc-ument ranking is the vector-space model (VSM), discussion ofwhich is beyond the scope of this paper, see (Manning, Raghavan,& Schütze, 2008; Salton, Wong, & Yang, 1975).
SensePlace utilizes a version of the VSM that is supplied as partof the Lucene5 open source search engine. Lucene was selected as itis a stable, easy to use, well documented search engine. In terms ofits interaction with other SensePlace components, Lucene was usedto make the final rankings of the documents retrieved by a query.The Lucene rankings utilize a custom procedure to set the indexes,document fields and boost factors for documents when applyingits version of VSM.
In Lucence terminology, an ‘‘index’’ refers to a collection of doc-uments that are stored in an indexed database repository and areanalyzed as one unit. Documents within the index have n numberof fields assigned to them. Fields are used to create reference pointswithin documents for querying. For example, a document from anRSS feed actually consists of four components – the document’s ti-tle, description, date published, and the document’s body. The con-tents of each of these components can be added as separate fieldswhen creating a document in Lucene that is added to a given index.Then, when queries are run against the index, selected fields can beincluded in the query if needed. By restricting fields included to themost relevant ones, query processing time can be reduced.
Boost factors refer to additional numerical weights that can beadded to terms when calculating their rank scores. Boost factorsare a feature that Lucene adds to the classic VSM approach it usesfor calculating document/query similarities.6 SensePlace takesadvantage of this powerful feature of Lucene by setting boost val-ues for terms based on factors such as the scale of geographicterms found in documents, reasoned query terms versus user de-fined explicit query terms, and reasoned geographic terms andgeographic terms derived through the geocoding procedures. Boostvalues for geographic terms were based on weights used in Overell,Magalhaes, and Ruger (2007).
The combined results of computational sensemaking and GIRmethods are presented to analysts through a place-time-conceptenabled interface. We discuss the visual interface provided bySensePlace in the next section.
3.3. Visual interface
SensePlace provides a visual interface with a series of views ontothe artifact processing methods and their results that individuallyand collectively are designed to support sensemaking by an ana-lyst. The interface and its views are implemented in Adobe Flexand are organized as interchangeable tabs within the overall inter-face. Fig. 3 shows the specific views that were created. These viewsinclude a search results interface (Fig. 3A–D), a timeline (Fig. 3F), ageographic map (Fig. 3G), and a concept graph (Fig. 3E).
Users have simultaneous access to pairs of views; thus they canexplore highlighted text and adjacent maps, text and a time-line + concept map, map and timeline + concept map, etc. By drag-ging tabs from one side of the interface to the other, they canrearrange views to suit their analytical needs and preferred workprocess. Original documents pop up in a separate browser window.A particular emphasis is made in each component to provide theanalyst with visual summaries of foraged information so decisions
5 http://lucene.apache.org/ (Last retrieved 17 September 2008).6 For detailed information on the similarity measure used by Lucene, see http://
lucene.apache.org/java/2_3_2/api/org/apache/lucene/search/Similarity.html (Lastretrieved 17 September 2008).
about which artifacts to investigate further can be made quickly.The combination allows analysts to investigate the where, when,and what components of artifacts independently and together.The integrated analysis helps to address questions about why par-ticular events have happened or situations have developed at par-ticular times and in particular places. In the following sub-sections,each of these interface views is described.
3.3.1. Search results viewSensePlace currently supports queries to the Google News7 and
Google News Archives8 search engines. Google News is used forobtaining current documents about a subject of interest. GoogleNews documents are obtained via an RSS feed in which the contentsof each document referenced in the RSS feed is obtained from thedocuments’ source web page and geographic and thematic referenceswithin the document are extracted – a procedure outlined inTomaszewski (2008). Google News Archives contains stories gener-ated by news agencies as well as documents such as press releasesfrom non-governmental organizations (NGOs). Google News Archiveinformation is obtained by (a) transforming the Google News ArchiveHTML page that is returned from a query into an XML documentwhich allows (b) the Google News archive page to be computation-ally processed using the tag structure that the XML imposes on theHTML page. The XML document is then traversed to find the sourceURL of a given Google News Archive document. Once the sourceURL is found, the document is then processed using the same proce-dure for processing documents derived from Google News RSS feeds.
Queries done to both Google News and Google archives are pre-sented in the search result view. The primary purpose of the searchresult view (the top left half of the Fig. 3) is to provide quick over-views of the contents of documents foraged by web queries.
On the top of the view (Fig. 3A), documents are shown ranked bytheir relevance to a given query. The relevance of each article isbased on the automated reasoning procedures discussed in Section3.1 Articles ranked by SensePlace differ from the default Google rel-evance rank due to the query expansion capabilities of SensePlace.Formal comparison between the SensePlace relevance ranking andthe Google relevance ranking was outside the scope of the presentwork; the SensePlace relevance rankings proved to be useful in thecase study analysis conducted (see Section 4 below for details).
Overviews of individual documents are designed to look similarto Google search results (Fig. 3A). Thus, an individual document isvisually represented using three components – the title of the doc-ument in bold, a two to three line summary of the beginning of thedocument, and the link to the original document in green. This de-sign was selected to follow general interface design strategies thatfavor having each visual component of an interface match existing,familiar interface conventions (Cunningham, 2002). This approachwas intended to make SensePlace easy to learn how to use. Inusability studies of a SensePlace precursor system, 1 h of trainingwas found to be sufficient to enable United Nations (UN) humani-tarian relief staff to understand how to use the tools and interface(Tomaszewski, 2009). Furthermore, we have received quite posi-tive reactions in a range of demonstrations, including to otherresearchers, to funding agency program officers, and even to alaw enforcement officer tasked with surveying the current situa-tion in foreign countries before study-abroad students travel tothose places. These reactions, while anecdotal, suggest that theSensePlace environment is intuitive.
Users can obtain detail about any document of interest in twoways, by accessing the linked original web page (which appearsin the adjacent tab, Fig. 3C) or accessing a selected item detailsview (Fig. 3B). The selected item details view applies a standard
7 http://news.google.com/ Last retrieved 3 September 2009.8 http://news.google.com/archivesearch Last retrieved 3 September 2009.

198 B. Tomaszewski et al. / Computers, Environment and Urban Systems 35 (2011) 192–207
overview + detail approach (Schneiderman, 1997). Detail is pro-vided in the form of extracted ‘raw text’ comprising the main con-tent from the retrieved document. This relevant raw content isextracting using HTML processing tools developed for this purposein previous work, see: Tomaszewski (2008). The overview containsthe named entities, specifically people, places, and organizations,that were identified in the raw text; entity identification is accom-plished using the natural language processing functions of theGeneral Architecture for Text Engineering (GATE) program(Cunningham, 2002). Named entities in each category are high-lighted in distinct colors: people in purple, organizations in orange,and places in green. In addition, the view also highlights the con-cepts found in the document (in bold underscore). Concepts, in thiscontext, are query terms entered by the human analyst and termsfrom the search support ontology (as discussed in Section 3.1).
3.3.2. TimelineThe timeline view (shown in Fig. 3F) allows analysts to quickly
search for documents by time and to recognize temporal proximityof particular documents, clusters of documents in time, and se-quences of related documents. This view supports the representa-tion of single events (i.e., an event with a specific date/time). It alsosupports the representation of time spans with specific startingand end dates.
The time view is implemented using the SIMILE timeline inter-face (SIMILE project, n.d). As seen in Fig. 3F, the timeline supportsthe addition of descriptive balloons for adding additional informa-tion to events. Users can temporally review documents returnedfrom a search in the time view by panning the time view at eitherthe year scale (bottom part of the time view shown in Fig. 3F) ormonth scale (top part of the time view shown in Fig. 3F). Userscan then click on a single event or duration icon, which opens aninformation window. This information window includes text fromthe original document as well as a link to add the places geocodedfrom the document to the geographic map.
3.3.3. Geographic map viewsAs each document is being processed by SensePlace, place
names and spatial relationships are extracted, geocoded, andmapped. The integrated map view enables users to explore this de-rived spatial context through display on the map.
The geographic information extracted from each document in-cludes the origin of the document (when possible to derive), anylocations referenced by the document and the connections be-tween origins and locations. Locations are represented by pointsymbols that vary based on the geographic scale (e.g. country, city,etc.). Lines represent the relationship between locations and theorigin of the document and the thickness of the line indicateshow many times the location was referenced in the document. Alegend that can be moved around the interface is also providedto help the analyst understand the map (Fig. 3G).
The geographic map is interactively coordinated with the time-line. This enables the analyst to quickly recognize spatio-temporalcontext of the documents. Additionally, the spatial focus and ex-tent for the geographic map can be adjusted based on interactivefunctions of the time and graph views of SensePlace. For example,selecting an event on the timeline that has a geographic connectionwill automatically pan the map to the location associated with theevent.
The geographic information derived from each document is alsoprovided as a Keyhole Markup Language (KML) file that can bedownloaded. This file can be saved for future use as well as viewedimmediately using Google Earth, allowing the analyst to takeadvantage of contextual information that may already be availablein KML format through both publicly available and internalsources.
3.3.4. Concept graph viewThe concept graph view is used to support ontology integration
in order to help an analyst find and explore potentially relevantnon-spatial dimensions within retrieved information. As discussedpreviously, the ontology is user supplied (but the current imple-mentation requires a system administrator to insert it) and resultsof queries are matched against the ontology so that the user is ableto see relevance of the stories to components of the ontology. Vi-sual representation of ontologies in graph-based formats can helpto conceptually structure information found in searches (which isusually loosely structured) and by making concepts of a given do-main accessible to a non-expert user by highlighting those con-cepts when they are found in the search and thus indicatingwhich terms may be of relevance to the user (Tergan, 2005). Con-cepts are visually represented in SensePlace using a node-link graphinterface (Fig. 3E).
The following section outlines the case study we use forgrounding our theoretical framework and demonstrating the prac-tical application of the SensePlace analytical environment. Whilewe present the case study here after presenting the details of thesystem, development of SensePlace was motivated by the underly-ing scenario characterized by the case study – of searching forinformation to understand regional situations in developing coun-tries (to support research on infectious disease dynamics as in thecase study below as well as to support activities such as sustain-able development, humanitarian relief and others).
4. Case study – infectious disease dynamics in Niger
Vaccine-preventable infectious diseases such as measles con-tinue to threaten the lives of people around the world, with thehighest rates of fatality occurring among children under the ageof five. In 2007, there were 279,006 measles cases reported glob-ally. Of these, there were an estimated 197,000 deaths (WorldHealth Organization (WHO), 2006). In regions where data are good(where, for example, records exist for cases of a disease outbreak,vaccinations, and movement of people), there are well establishedmethods to identify the source of infection, how it moves through apopulation, and the rate at which it will move (see Bharti, Xia,Bjornstad, and Grenfell (2008)) However, in regions where re-sources are not available for collecting and maintaining such re-cords, trying to understand disease dynamics within a populationis more difficult.
In the case study reported here we are interested in under-standing the dynamics of measles in sub-Saharan Africa. In partic-ular, we focus on Niger. Ranked nearly last on the United NationsDevelopment Fund index of human development, Niger is one ofthe poorest countries in the world and is continually hamperedby drought cycles and desertification. Measles is a major problem,among other diseases in Niger. Since 1980, measles epidemics haveoccurred regularly with as many as 90,000 people infected in a sin-gle year. Vaccine coverage has helped reduce measles outbreaks,with the latest campaign in 2005. Although vaccination campaignsare in effect, populations continue to be at risk to measles andother diseases such as meningitis and polio, particularly sinceNiger has a very high birth rate – 51.6 births per year per 1000population (Central Intelligence Agency (CIA), 2009).
Thus, in an effort to minimize measles epidemics (and optimizefuture vaccination campaigns) we are trying to understand thespace–time dynamics of measles in Niger. Key components toidentifying measles dynamics include:
1. Where disease reservoirs may exist. For example, areas wherevaccine coverage is non-existent or limited both within Nigerand within surrounding countries.

B. Tomaszewski et al. / Computers, Environment and Urban Systems 35 (2011) 192–207 199
2. Understanding the movement of people. For example, restric-tions on movement due to political upheaval, seasonal move-ment within Niger due to workforce requirements, movementoutside of Niger due to food security issues, and transientmovement through Niger.
Niger has good data on measles incidence over more than a dec-ade but little or no formal data on population movement. It is,therefore, possible to develop reasonable models of past measlesdynamics (as our colleagues have done, (Ferrari et al., 2008), butnot to explain the patterns as they relate to geographic scalebehavior of the population. SensePlace offers an approach and toolsto fill in part of the information gap. In the following section, wereport on a SensePlace case study application focused on the chal-lenge of understanding past population movements in Niger (overthe time period for which measles data are available). The casestudy, in addition to generating information to support researchon disease dynamics, demonstrates how SensePlace can supportweb document foraging and related sensemaking, which can leadto further foraging as well as insights derived from informationas it is contextualized using the place, time, and concept tools inSensePlace.
Fig. 4. The process used for foraging and sense making. The tool searches the webfor text documents about a particular geographic location using the search termsentered by the user. Retrieved documents are displayed in the Results tab andanalyzed by the user through the visual interface components (see Fig. 3). The userviews the articles by (i) viewing the abstract and highlighted keywords todetermine relevancy, (ii) view where the article is about through the map, and (iii)view the concepts affected and the sequence of events through the timeline.Articles can be captured using an add-in, Zotero, and information from relevantdocuments can be transcribed to a spreadsheet for later use. In addition, links to thearticles and search terms can be saved using the Save Results Option to an XML andTXT file, respectively, which can be shared with colleagues or uploaded again ifrequired in the future. Information from the articles/documents will highlight newinformation and prompt new searches using new keywords. The process is repeatedagain until the user is satisfied that they have gathered sufficient information aboutthe topic of interest. Information gathered through this tool can then be collated,synthesised and summarized by the user. Features/Components contained withinSensePlace are illustrated within the red box. (For interpretation of the references tocolour in this figure legend, the reader is referred to the web version of this article.)
Fig. 5. An example of some of the search terms utilized to find web documentsusing SensePlace about disease and migration patterns in Niger and the surroundingcountries. The search started with Migration and Measles, Niger (highlighted inred). As articles were retrieved and read new search terms were used. Some of theseare illustrated here. (For interpretation of the references to colour in this figurelegend, the reader is referred to the web version of this article.)
5. Using SensePlace – results of an analysis
SensePlace, as outlined above, is a web-based tool that providesthe analyst with a quick way to sift through text-based informationand to consider place, time, and concept components of that infor-mation. More specifically, it supports this process by (1) enablingthe analyst to perform specific searches by geographic location,(2) highlighting key information quickly within an article (e.g.search term, geographic names and organizations), (3) providingthe ability to view geographic locations mentioned in a particulararticle or in sets of articles on a map, and (4) supporting investiga-tion of the timing of single/multiple events (see Figs. 1 and 2 forcomponents and technical information). Here, ‘‘the analyst’’ wasone of this paper’s co-authors who is also a member of the VaccineModeling Initiative research team that is doing research to under-stand disease dynamics in developing countries.
While SensePlace includes basic tools for saving, reloading, andsharing information during foraging and sensemaking activities,we found it useful to also rely on two external tools to supplementthese capabilities, the Mozilla add-in, Zotero™,9 and Microsoft Ex-cel. Specifically, Zotero was used to capture copies of documentsfound and Excel was used to record information about when andwhere different events occurred, e.g., droughts, disease outbreaks,vaccination campaigns, conflicts, political events (such as elections,and civil wars). The information recorded included: Date (i.e.,Year–Month), which was either the date of the news source (ifthe article was talking about a current event) or the date describedin the text (when the article was talking about a historical event);Geographic location(s), which could be either region, country,state, district, department, or city; Description, or a brief descrip-tion of the event; Source, the data source, e.g. BBC, New YorkTimes, etc.); and a Hyperlink to the source.
The overall analysis process supported by SensePlace is illus-trated in Fig. 4 with the components included within SensePlaceillustrated in the red boxes and those in tools used together withSensePlace indicated in gray.
The SensePlace visual interface (see Fig. 3) allows the analyst toidentify key time spans and to assess relevancy of articles retrievedby searches in seconds. For time, a broad overview of relevant timeperiods to analyze can be assessed using the histogram (Fig. 3D)
9 http://www.zotero.org/ Last retrieved 4 November 2009.
with a more detailed sequence of events and possible patternsexamined using the timeline (Fig. 3F). For relevancy, the combina-tion of the selected item details view, with highlighted keywords,organizations and place names and the ability to depict the geo-graphic foci of articles on a map both help analysts quickly narrow

200 B. Tomaszewski et al. / Computers, Environment and Urban Systems 35 (2011) 192–207
in on potentially relevant documents. For example, while searchingfor information about migration patterns, a single search provideda key article that showed the geographic range of migration (Nigerto Cote D’Ivoire (approximately 700 miles South of Niger) (e.g.New York Times (1996a)). Also, geographic weighting helped theanalyst find information about meningitis pathways that may beindicative of pathways for other diseases, including measles.Specifically, in Niger during the last outbreak in 2009, the sequenceof reports uncovered by the analyst highlighted that meningitiswas first reported in Kano, Sokoto (Nigeria) with subsequentreports in Niger and Burkina Faso.
An important feature of SensePlace is its focus on supporting anextended process of foraging and sensemaking rather than one-offqueries. As information is being gathered the analyst can performnew searches using new terms found from articles and thereforebuild on existing query results. This process can continue untilan analyst has obtained sufficient information about the topic of
Fig. 6. A map illustrating the main travel routes throughout Niger and the surroundingborder of the country (black lines). Once they have reached Agadez, Arlit or Dirkou they wSeasonal migration is circular and exists throughout the region with mainly a North–Sodifferent livelihood zones either to agricultural or pastoral areas. High out-migration occseason movement can be to feeding centers (purple crosses), mining areas, larger towns/cSokoto, Maiduguri) as far as Abidjan (Cote D’Ivoire). The map was constructed manuallydirectly by SensePlace plus information in sources pointed to by the SensePlace identi(compiled from (Alfa, 1999; Herald Tribune, 2008; IRIN Africa, 2007a; United State Geol1999) Transit City (compiled from (IRIN Africa, 2007a; IRIN Africa, 2008a; Johnson, 20(compiled from (New York Times, 2001b; Reuters, 2002; The Independent, 2001)), TranTimes (2001b), OECD (2008, 2009)), Seasonal migration routes (Daily Trust, 2008; New YoInstitute, 1993a), Boundaries (Environmental Systems Research Institute, 1993b), Citireferences to colour in this figure legend, the reader is referred to the web version of th
interest. For this case study, approximately 22 search terms wereused for seven countries (see Fig. 5) to identify potential diseasereservoirs and transmission corridors. The information was cata-loged in a spreadsheet and is presented next.
5.1. Results of SensePlace Niger case study
In this section, we present the findings of the Niger case studyanalysis using SensePlace. These findings are supported with cita-tions to the large number of sources used. All sources were eitheridentified directly through use of SensePlace (i.e., they were amongthe results returned for search queries) or indirectly through links/pointers within the documents found directly. These resultsprovide a proof-of-concept demonstration of SensePlace as anapplication and of the overall visually-enabled sensemaking ap-proach it implements.
countries. Migrants will enter/depart Niger through a variety of routes along theill take the main Transit Routes (blue lines) to Europe via Algeria/Morocco or Libya.
uth movement (illustrated through the red lines). Migrants will move through theurs in three main areas Loga, Ouallam and Tahoua (FEWSNET, 2005). During the dryities in Niger (e.g. Niamey, Maradi, Zinder, Agadez) and Northern Nigeria (e.g. Kano,in ArcInfo, but is based on a combination of information found in sources identifiedfied documents: Feeding Stations (Médecins Sans Frontières (MSF), 2005), Miningogical Survey (USGS), n.d)), Livelihood Zones (FEWSNET, 2009),Gateway City (Rain,05; New York Times, 2001b; OECD, 2008; OECD, 2009; Reuters, 2002)), Sex Citysit migration route (compiled from IRIN Africa (2007a), Johnson (2005), New Yorkrk Times, 1996a; OECD, 2009; Rain, 1999). Roads (Environmental Systems Research
es (Environmental Systems Research Institute, 1993b). (For interpretation of theis article.)

Fig. 7. The timeline of events occurring between 1995 and 2006 in Niger and the surrounding countries in relation to measles occurrence in Niger (solid black line). Detaileddescription of each event along with the source of the data is summarized in Table 1. Droughts are highlighted in orange with worse years being depicted with thicker lines.Vaccination campaigns for Niger are shown with a blue cross with national countrywide coverage illustrated with a larger blue cross. (For interpretation of the references tocolour in this figure legend, the reader is referred to the web version of this article.)
B. Tomaszewski et al. / Computers, Environment and Urban Systems 35 (2011) 192–207 201
Human migration patterns in Sub-Saharan Africa are stronglylinked to the geography of the region. Migration patterns in Nigermainly follow historic trading routes (see Rain, 1999 where de-tailed fieldwork was conducted in the city of Maradi, Niger tounderstand migration patterns) such as the former trans-Saharansalt trade routes, which are mainly used by clandestine/transitmigrants today (ECOWAS-SWAC/OECD, 2006; IRIN Africa, 2008b;New York Times, 2002). Due to the harsh Sahelian climate, thenomadic existence of the majority of the population has been usedas a survival strategy against the annual hunger season; from June(post planting) to September/October (harvest) and has subse-quently led to the development of seasonal migration patternswhere millions of people will travel to find work to help theirfamilies survive, returning home when the rains begin to helpplant and harvest (IRIN Africa, 2007b).
Three main forms of migration occur within Niger and thesurrounding countries (summarized in Fig. 6) and include:
A. Transit or temporary migration en route to a destinationbeyond the Nigerian border. Niger and Mali are the gatewaycountries to Europe for many Africans and house a large numberof transient migrants (New York Times, 2001b; OECD, 2008). Thishas lead to an increase in transit migrants in particular towns suchas Agadez, Dirkou and Arlit as they wait for passage (New YorkTimes, 2001a; OECD, 2009; IRIN Africa, 2008b; New York Times,2002). The consensus is that number of migrants passing throughNiger remains difficult to estimate (IRIN Africa, 2008a; New YorkTimes, 2001a; OECD, 2009).
B. Exode or semi-permanent work migration beyond the coun-try border. This category includes temporary work migration ofNiger residents leaving their villages to seek work outside of Nigerparticularly in Nigeria, Libya and Cote d’Ivoire (Bliss, 2008). Migra-tions can last 3 months to several years. Exode migration is vital tomany families with remittances totaling close to $60 million in2005 (IRIN Africa, 2007a) from Libya and almost $200 million(Oxford Analytica, 2005) during 2003 from Cote D’Ivoire to Niger,Mali and Burkina Faso.
C. Dan Cin Rani or temporary, circular migrations (Rain, 1999);this is the most important type of migration for the people of Nigerand are likely to exhibit the strongest signal in disease dynamicsdata. Temporary seasonal circular work movement of migrantscan last approximately 3–6 months. During non-drought years,these movements are mainly rural–urban (from subsistence farms
to larger towns/cities (New York Times, 1996b)) but can also berural-rural (from subsistence farm to large commercial farm (DailyTrust, 2008) and to commercial or small-scale artisanal mines (e.g.uranium, coal, gold, trona, salt, cement) (Alfa, 1999; HeraldTribune, 2008; IRIN Africa, 2007a). The distances migrants travelvaries and is not necessarily based on economics but instead isinfluenced by family connections and the need to remain withinclose proximity to family so that they can return home to workthe land easily (Daily Trust, 2008; Rain, 1999). Destinations se-lected by migrants may also vary from year to year (Daily Trust,2008). Not only does this type of migration occur in Niger but alsoMali, Chad, Burkina Faso and Nigeria (Daily Trust, 2008; IRIN Afri-ca, 2007b). The majority of migrants are males, many leaving theirfamilies behind, but can include the movement of families, themigration of young children (Rain, 1999) and more recentlywomen, as is the case in Mali (Haan, Brock, & Coulibaly, 2002).
Seasonal, climate-driven migration is an important componentof disease-relevant population movements, but it is not the onlyfactor, and is not sufficiently well documented on an annual basisover the years for which detailed measles data are available. Thus,information foraging with SensePlace was used to build a morecomplete picture of the role different events may have influencedthe movement of people and transmission of disease between1995 and 2006. These are summarized in Fig. 7 with details of eachevent and its source documented in Table 1.
During years of drought (as illustrated in Fig. 7), the movementof people increases. For example, during 2003/2004 Niger sufferedfood shortages brought about by a drought and major locust out-break (Asia Africa Intelligence Wire, 2004; BBC News, 1997; BBCNews, 2004). Not only did this result in mass losses in agriculture,but also forced many residents of Niger to leave home and seekfood in urban centers, neighboring countries such as Nigeria andTogo (The Independent, 2005b) and therapeutic feeding centers(established by Doctors without Borders/Médecins Sans Frontières– MSF). During this time, due to a lack in basic health care andfeeding facilities in Nigeria, many Nigerians came to Niger (IRINAfrica, 2007b).
Forced migration, either through bonded labor, such as slaveryand people trafficking, particularly of children (Global MarchAgainst Child Labour (GMACL), 2006, Khaleej Times Online,2005), or political events is also likely. Although slavery was out-lawed in 1991 it is still prevalent today in Niger (The Guardian,
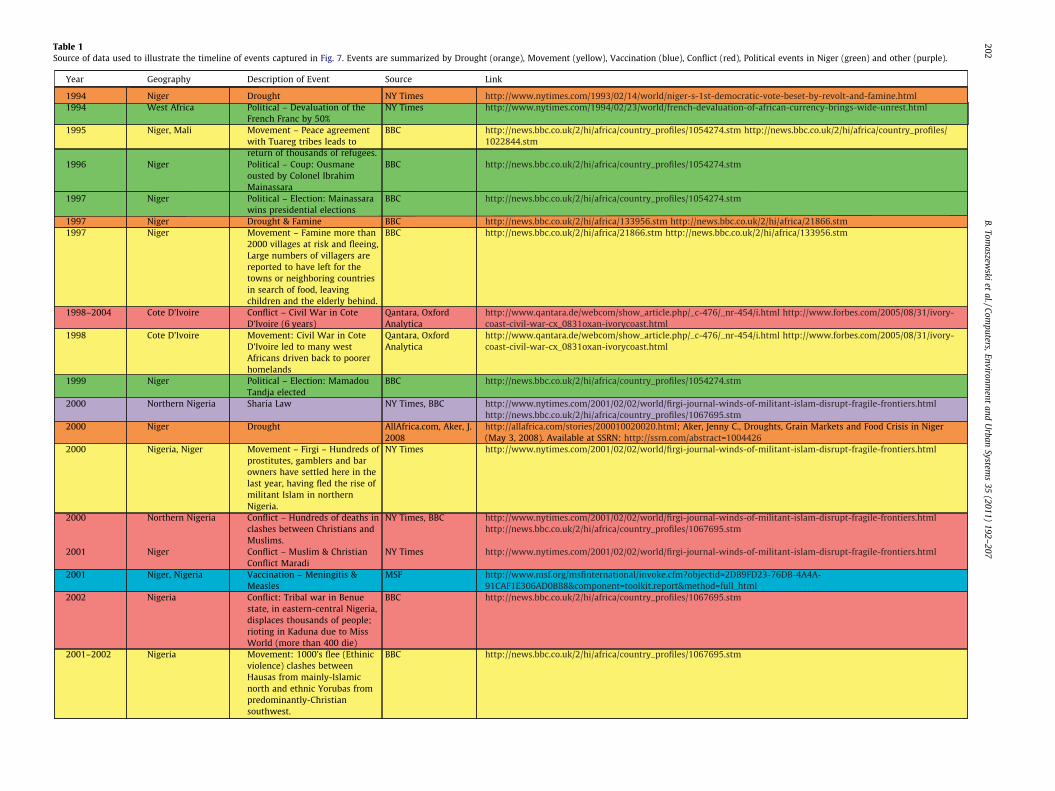
Table 1Source of data used to illustrate the timeline of events captured in Fig. 7. Events are summarized by Drought (orange), Movement (yellow), Vaccination (blue), Conflict (red), Political events in Niger (green) and other (purple).
202B.Tom
aszewski
etal./Com
puters,Environment
andU
rbanSystem
s35
(2011)192–
207

Tabl
e1
(con
tinu
ed)
B. Tomaszewski et al. / Computers, Environment and Urban Systems 35 (2011) 192–207 203

204 B. Tomaszewski et al. / Computers, Environment and Urban Systems 35 (2011) 192–207
2005; The Independent, 2005a). Many of these include childrenwho are sent to work in agriculture, mining,10 as domestic labor,or illegally traded and sent into prostitution (Global March AgainstChild Labour (GMACL), 2006); (Asia Africa Intelligence Wire, 2002;Herald Tribune, 2008).
Many parts of Africa are highly volatile causing people to movefrom areas of conflict or instability. Since Niger’s first democraticvote in 1993 there have been three elections, two coups and theassassination of President Mainassara in 1999 (BBC News, 2009).In addition there have been numerous protests and regional con-flicts (e.g. National strike against the high cost of living and protestsagainst taxes; Taureg uprising in the North; Muslim/Christianclashes in Maradi). However, three main events seem to have hadthe most significant impact on the region since 1996. These includethe devaluation of the Central African French Franc (CFA) byfifty percent in 1994 (New York Times, 1994), the civil war in CoteD’Ivoire (Johnson, 2005; Oxford Analytica, 2005), and the introduc-tion of Sharia Law in Northern Nigeria (New York Times, 2001a; TheIndependent, 2001), all of which are summarized in Fig. 7.
The devaluation of the CFA has had some impact on populationmovements throughout west Africa and may have increased thenumber of transit migrants as they try to improve their lostwealth (OECD, 2009). Cote D’Ivoire is a popular destination amongmigrants with its big city (Abidjan) and cocao plantations and dur-ing the civil war many foreign migrants were forced to returnhome leading to a reductions in remittances (Oxford Analytica,2005). While the establishment of the Sharia Law in NorthernNigeria is reported to have played a key role in fueling a thrivingsex industry along the Niger-Nigerian border, particularly inMaradi, Konni, Sashi, Maimoujia and small towns such as Firgi(New York Times, 2001a; The Independent, 2001). Not only hasthis increased the traffic and migration to these areas (Kirwin,2004), but these regions have also seen an increase in the numberof Muslim/Christian clashes and been a driver in anti-vaccinationcampaigns in many Northern States of Nigeria (FOX News, 2005)resulting in the suspension of vaccination campaigns (e.g. in Statesof Kano, Zamfara Kaduna, Bauchi, Katsina and Niger) (AssociatedPress, 2004; CNN, 2003; New York Times, 2006). As a result of this,vaccination-deficit areas have lead to the development of diseasereservoirs, particularly in Kano, known as the polio epicenter(Boston Globe, 2004), a main source for meningitis (IOL, 2006)and a hotspot for measles (Médecins Sans Frontières (MSF),2003) (see Fig. 6).
Diseases, such as polio are not only crossing the border fromNigeria into Niger but have also affected between 8 and 21 coun-tries at any one time (e.g. wild polio Reuters, 2009; Xinhua,2006). Many of these diseases are being imported through peopleas they move from place to place, such as polio along bus routesthrough Niger (Boston Globe, 2004), polio from migrants returninghome from working abroad (e.g. AIDS from Cote D’Ivoire New YorkTimes, 1996a), meningitis from Darfur Refugees in Chad (TheMedical News, 2004), or meningitis from migrants passing throughNiger (AllAfrica, 2009).
For much of this region, where the majority of the population isnomadic, borders act as an artificial boundary and are by no meansa barrier to disease movement, particularly for clandestine mi-grants. Thus, knowing where people are travelling from (allowsthe source of infection to be identified) and determining how theyare getting into and passing through countries (by foot, bus, don-key on main roads or clandestine routes) can help combat futureepidemics through the implementation of effective surveillanceand control strategies. These may include surveillance andvaccination campaigns located at border crossings, in towns within
10 See Alfa (1999) for a breakdown of tasks.
close proximity along country borders or towns that are majorcrossroads for travelers (e.g. sex cities, gateway cities or transittowns illustrated in Fig. 6). Precautions against particular diseasesare already being implemented in some of these areas. For exam-ple, recent articles highlighted border vaccination strategiesagainst meningitis along Niger-Nigeria border (IOL, 2006) and po-lio along Burkina Faso-Niger (World Health Organization (WHO),2002), as well as anti-AIDS campaigns in Firgi and Agadez (Reuters,2002).
As outlined at the start of this section, the characterization ofpopulation movements and disease reservoirs detailed above wascompiled by one analyst (who was knowledgeable in diseasedynamics but not in Niger). SensePlace was used iteratively to foragefor place-relevant documents, attempt to make sense of and syn-thesize information derived, use insights to refine or extend forag-ing activities, and ultimately build a comprehensive picture ofevents, disease, and population movements over time within andaround Niger. In the following section, we outline ideas for futurework.
6. Future work
As indicated, SensePlace is in an initial proof-of-concept, proto-type of the information foraging and sensemaking process intro-duced above. Although it is a prototype, SensePlace proved to befunctional and useful enough to help us build a detailed under-standing of population movements in Niger and related contextualfactors that have a potential impact on disease dynamics in thatcountry. The SensePlace visual interface currently provides linkedplace, time, concept, and document views that enable an analystto find relevant documents on the basis of location, time, andtheme and use documents found as part of a broader sensemakingprocess. While the approach and tools allowed an analyst to build acomprehensive understanding of the geographic situation in Nigerand identify changes in that situation over time using web-retrieved, unstructured text documents, the case study alsoidentified multiple parts of the analytical process where thecurrent prototype implementation could be improved.
Based upon the results of this research and the case study appli-cation of SensePlace to analysis of population movements and pub-lic health in Niger, six specific next steps are planned.
First the analytical reasoning methods for determining docu-ment relevance will be enhanced. Formal quantitative measure-ment of document ranking improvements using F-measures willbe added, this is a common means of measuring the effectivenessof information retrieval systems.
Second, although the SensePlace concept map is useful in high-lighting concepts occurring within an article, the concept map iscurrently tied to a single predetermined ontology inserted by a sys-tem administrator. To be more useful, concept map functionalityshould be extended to: (1) enable users to fine-tune their searchcriteria by providing specific user defined concept maps and (2)provide self-learning concept maps that are dynamically createdwith each new search.
Third, refinements to the visual interface will be made to bettersupport human reasoning. For example, incorporating new searchengines. Currently, SensePlace uses Google News and Google Ar-chives search engines to retrieve information. Although not pre-sented here, we have started to investigate the ability toincorporate new search engines and formats and visual interfacesto those search engines and their formats so as to provide the userwith the ability to customize their searches.
Fourth, methods outlined in Section 4 that emphasizedocument foraging and sensemaking about relevant documentswill be integrated with exploratory spatial data analysis methods

B. Tomaszewski et al. / Computers, Environment and Urban Systems 35 (2011) 192–207 205
applied to numerical data that analysts may be trying to contextu-alize with the SensePlace tools (e.g., in our case study, data aboutmeasles incidence and related socioeconomic and demographicstatistics).
Fifth, to better support an extended analytical process, methodswill be added to enable artifact collection and organization, analy-sis history, and insight provenance. Several ideas related to thisstep include:
(a) Ability to edit saved search results. In the system presentedin this paper, search results can be saved to an XML file for-mat and shared with colleagues or reloaded at a later date.Being able to edit the result list would be useful in sharingkey articles with colleagues and provide the ability to avoidduplication of information from multiple sources.
(b) Ability to save full query terms. Currently, SensePlace cansave key search terms and the geography specified. Beingable include the search dates and type would be beneficialin logging the searches performed.
(c) Capturing web documents. Although the add-in Zotero wasutilized during this study to capture a plethora of web doc-uments, it requires the users to manually edit data fields.Providing a feature to automatically capture web documentssystematically (e.g. by key search term) will help catalog thearticles in an easily retrieval manner.
(d) Saving data to a spreadsheet or database. The case studydemonstrated a need to transcribe data from the web arti-cles to a spreadsheet (see Section 5.1) in support of the over-all analytical processes. Automating the task of saving keydata to a spreadsheet is critical as it would speed up the datacapture process, and thus the ability to produce analyticaloutputs. Key data to capture and store in a spreadsheetinclude: date, place, detailed description, brief description,source, hyperlink to source, and date information wasaccessed.
A sixth planned step is to formally evaluate tool usabilityand utility, and investigate the sensemaking process as sup-ported by these tools, using methods and approaches similarto (Robinson, Chen, Lengerich, Meyer, & MacEachren, 2005;Tomaszewski, 2011).
6.1. Other application domains for SensePlace
Although the application domain used in this research was dis-ease dynamics, SensePlace is designed to support information for-aging and sensemaking activities in any application domainwhere place-relevant information is likely to be found in large doc-ument repositories. In particular, our team is investigating applica-tion of the SensePlace approach to vulnerability assessment ofimpoverished people (Tomaszewski, in press). SensePlace is partic-ularly well suited for vulnerability assessment due to the complexand often abstract nature of indicators that can be used to assessvulnerability; these include but are not limited to items such aslivelihoods, access to health care and clean water, social relation-ships and financial capitals (Frankenberger, Luther, Becht, &McCaston, 2002). Data and information related to these and othervulnerability indicators are often derived from diverse sources likethose discussed in the SensePlace case study.
7. Summary and conclusions
In this paper, we introduce a visual-analytics based approach toforaging for and sensemaking with the currently underutilizedplace-relevant information contained in rapidly growing document
repositories. The approach is implemented in SensePlace, aweb-based application. SensePlace uses coordinated visual inter-faces that include timelines, geographic maps, and concept graphsand computational procedures such as ontology-based documentrelevance processing, entity extraction, and geocoding to assistthe human sensemaking processes.
Using a detailed case study, we demonstrate that the approachand its implementation is effective in enabling an analyst toquickly build a comprehensive understanding of a complex and dy-namic situation, human migration over a decade in a developingcountry for which formal data are lacking. The analyst was ableto use SensePlace to improve her understanding of the main migra-tion patterns occurring in Niger, identify key disease hotspot areassurrounding Niger and determine major entry points for diseases.All of these insights are relevant for developing more robust mod-els of disease dynamics and the implications of events that impacthuman migration patterns. Case study results also highlight keyinfection zones (e.g. border trade towns, e.g. sex cities, transittowns, and gateway cities) and identify problem areas where vac-cination coverage has been halted, resulting in those areas becom-ing disease reservoirs (e.g. Northern Nigerian States), and thusenhance program guidelines for vaccinations in Niger and otherdeveloping counties.
From a geographic information science perspective, taking aplace-time-concept approach to visually-enabled information for-aging and sensmaking has been demonstrated to be viable as anapproach for collecting and making sense of large volumes ofunstructured documents, at least in the case study presented. Thisresearch provides input to a broader visual analytics goal of devel-oping integrated visual-computational methods that support hu-man reasoning in the context of complex problems withheterogeneous information. Ultimately, tools like SensePlace andthe theoretical approaches that motivate their development canlead to improved scientific research, situation assessment, andevidence-based decision making.
Acknowledgements
This material is based upon work supported by the U.S. Depart-ment of Homeland Security’s VACCINE Center under Award Num-ber 2009-ST-061-CI0001, by the U.S. National Science Foundation(Grant EIA-0306845), and by a grant funded by the Bill andMelinda Gates Foundation.
References
Alfa, S. (1999). Child labour in small-scale mines Niger. In N. Jennings (Ed.), ChildLabour in Small-Scale Mining: Examples from Niger, Peru & Philippines.International Labour Organization.
AllAfrica. (2009). Africa: Migrants and meningitis – A moving threat. <http://allafrica.com/stories/200904210927.html> Retrieved 20.08.09.
Asia Africa Intelligence Wire (2002). More than 200 child miners withdrawn fromWestern Niger. <http://www.accessmylibrary.com/coms2/summary_0286-25415109_ITM> Retrieved 04.11.09.
Asia Africa Intelligence Wire (2004). Locusts invade agricultural areas inNiger. <http://www.accessmylibrary.com/coms2/summary_0286-13357589_ITM> Retrieved 04.11.09.
Associated Press (2004). Two more Nigerian states boycott vaccines. <http://www.usatoday.com/news/world/2004-02-24-polio-vaccine_x.htm> Retrieved04.11.09.
Baader, F., Calvanese, D., McGuinness, D., Nardi, D., & Patel-Schneider, P. (2003). TheDescription Logic Handbook: Theory, Implementation, and Applications. New York:Cambridge University Press.
BBC News (1997). Famine threatens Niger. <http://news.bbc.co.uk/2/hi/africa/21866.stm> Retrieved 31.03.09.
BBC News (2004). Locusts ravage northern Nigeria. <http://news.bbc.co.uk/2/hi/africa/3580092.stm> Retrieved 31.03.09.
BBC News (2009). Country profile: Niger. <http://news.bbc.co.uk/2/hi/africa/country_profiles/1054396.stm> Retrieved 31.03.09.
Bex, F., Van den Braak, S., Van Oostendorp, H., Prakken, H., Verheij, B., & Vreeswijk,G. (2007). Sense-making software for crime investigation: How to combinestories and arguments?. Law, Probability and Risk.

206 B. Tomaszewski et al. / Computers, Environment and Urban Systems 35 (2011) 192–207
Bharti, N., Xia, Y., Bjornstad, O., & Grenfell, B. (2008). Measles on the edge: Coastalheterogeneities and infection dynamics. PLoS ONE, 3(4), e1941.
Bier, E., Card, S., & Bodnar, J. (2008). Entity-based collaboration tools for intelligenceanalysis. In Paper presented at the IEEE Symposium on Visual Analytics Scienceand Technology. VAST’08.
Bliss, J. (2008). Exode and HIV/AIDS. <http://jrobinpcv.blogspot.com/2008/11/exode-and-hivaids.html> Retrieved 31.03.
Boston Globe (2004). Polio’s path: By bus and by boat, crippling virus spreads,despite vaccine drive. <http://www.boston.com/news/globe/health_science/articles/2004/12/07/polios_path/> Retrieved 04.11.09.
Environmental Systems Research Institute (Cartographer) (1993a). Digital Chart ofthe World (DCW): Road Layer.
Environmental Systems Research Institute (Cartographer) (1993b). ESRI Data &Maps.
Central Intelligence Agency (CIA) (2009). CIA – The world factbook – Niger. <http://www.cia.gov/library/publications/the-world-factbook/geos/ng.html> Retrieved04.11.09.
CNN (2003). Three Nigerian states halt polio vaccinations over AIDS fears. <http://www.cnn.com/2003/WORLD/africa/10/27/nigeria.polio.reut/index.html> Retri-eved 04.11.09.
Cunningham, H. (2002). GATE, A general architecture for text engineering.Computers and the Humanities, 36(2), 223–254.
Daily Trust (2008). Nigeria: Life of the migrant worker. <http://allafrica.com/stories/200805051224.html> Retrieved 04.11.09.
ECOWAS-SWAC/OECD (2006). Atlas on regional integration in West Africa:Population series. Migration. <http://www.oecd.org/dataoecd/41/47/38409521.pdf> Retrieved 04.11.09.
Efthimiadis, E. (1996). Query expansion. Annual Review of Information Science andTechnology, 31, 121–187.
Ferrari, M., Grais, R., Bharti, N., Conlan, A., Bjornstad, O., Wolfson, L., et al. (2008).The dynamics of measles in sub-Saharan Africa. Nature, 451(7179), 679–684.
FEWSNET (2005). Niger Livelihood Profiles. <http://www.fews.net/pages/country.aspx?gb=ne&l=en> Retrieved 04.11.09.
FEWSNET (2009). Livelihoods zone map. <http://www.fews.net/pages/livelihoods-country.aspx?gb=ne&l=en> Retrieved 26.03.09.
FOX News (2005). Polio spread fueled by vaccine taboo. <http://www.foxnews.com/story/0,2933,155524,00.html> Retrieved 31.03.09.
Frankenberger, T., Luther, K., Becht, J., & McCaston, M. (2002). Household LivelihoodSecurity Assessments: A Toolkit for Practitioners. Atlanta, GA: CARE USA, PHLS Unit.
Gahegan, M. (2005). Beyond tools: Visual support for the entire process ofGIScience. In J. Dykes, A. MacEachren, & M. J. Kraak (Eds.), ExploringGeovisualization (pp. 83–99). Elsevier.
Global March Against Child Labour (GMACL) (2006). Review of child labour,education and poverty agenda: Niger country report. <http://www.globalmarch.org/resourcecentre/PHotos/Niger.pdf> Retrieved 04.11.09.
Haan, A. D., Brock, K., & Coulibaly, N. (2002). Migration, livelihoods and institutions:Contrasting patterns of migration in Mali. Journal of Development Studies, 37(23).
Herald Tribune (2008). To survive, children mine gold under dangerous conditions.<http://www.heraldtribune.com/article/20080811/ARTICLE/808110331&title=To_survive__children_mine_gold_under_dangerous_conditions> Retrieved04.11.09.
IOL (2006). Meningitis spread checked in Niger province. <http://www.int.iol.co.za/index.php?set_id=1&click_id=68&art_id=qw1146448261155N264> Retrieved04.11.09.
IRIN Africa (2007a). NIGER: Migration benefits still seen to outweigh risks. <http://www.irinnews.org/Report.aspx?ReportId=73822> Retrieved 13.08.09.
IRIN Africa (2007b). NIGER-NIGERIA: Nigeria’s malnourished throng to Niger’sfeeding centres. <http://www.irinnews.org/Report.aspx?ReportId=72720>Retrieved 13.08.09.
IRIN Africa (2008a). West Africa: Migrants risk all to cross desert. <http://www.alertnet.org/thenews/newsdesk/IRIN/8a2b8af1f3fb6ebdd1865155aac13943.htm>Retrieved 10.11.09.
IRIN Africa (2008b). West Africa: Voices from clandestinity. <http://allafrica.com/stories/200810100002.html> Retrieved 21.04.09.
Johnson, D. (2005). Exodus from Africa: The search for a better life. <http://www.qantara.de/webcom/show_article.php/_c-476/_nr-454/i.html> Retrieved04.11.09.
Khaleej Times Online (2005). Bitterness, broken dreams for Benin’s child slaves.<http://www.khaleejtimes.com/DisplayArticle.asp?xfile=data/todaysfeatures/2005/June/todaysfeatures_June43.xml§ion=todaysfeatures> Retrieved04.11.09.
Kirwin, M. (2004). The Socio-Political Effects of Nigerian Shari’a on Niger. OhioUniversity.
Klein, G., Moon, B., & Hoffman, R. (2006). Making sense of sensemaking 1:Alternative perspectives. IEEE Intelligent Systems, 21(4), 70–73.
MacEachren, A., Gahegan, M., & Pike, W. (2004). Visualization for constructing andsharing geo-scientific concepts. Proceedings of the National Academy of Sciences,101(90001), 5279–5286.
Manning, C. D., Raghavan, P., & Schütze, H. (2008). Introduction to InformationRetrieval. Cambridge University Press.
Masolo, C., Borgo, S., Gangemi, A., Guarino, N., Oltramari, A., & Schneider, L. (2002).The WonderWeb Library of Foundational Ontologies. LADSEB-Cnr, Padova, IT,Preliminary Report D, 17.
Médecins Sans Frontières (MSF) (2003). Beauty and the beast – Nigeria. <http://www.msf.org/msfinternational/invoke.cfm?component=article&objectid=1098D725-EFA8-4D56-8D2FFF2044583C0C&method=full_html> Retrieved 04.11.09.
Médecins Sans Frontières (MSF) (2005). Our programs in NIGER, September 1st2005. <http://www.msf.org/source/countries/africa/niger/2005/map-activities.gif> Retrieved 28.05.09.
New York Times. (1994). French devaluation of African currency brings wide unrest.<http://www.nytimes.com/1994/02/23/world/french-devaluation-of-african-currency-brings-wide-unrest.html> Retrieved 04.11.09.
New York Times (1996a). Migrant workers take aids risk home to Niger. <http://www.nytimes.com/1996/02/08/world/migrant-workers-take-aids-risk-home-to-niger.html> Retrieved 31.03.09.
New York Times (1996b). US and France suspend aid after military coup in Niger.<http://select.nytimes.com/gst/abstract.html?res=F30D14FF3B5D0C7A8EDDA80894DE494D81> Retrieved 31.03.09.
New York Times (2001a). Firgi journal; winds of militant islam disrupt fragilefrontiers. <http://www.nytimes.com/2001/02/02/world/firgi-journal-winds-of-militant-islam-disrupt-fragile-frontiers.html> Retrieved 04.11.09.
New York Times (2001b). Out of Africa or Bust, with a desert to cross. <http://www.nytimes.com/2001/01/04/world/out-of-africa-or-bust-with-a-desert-to-cross.html> Retrieved 04.11.09.
New York Times (2002). The World; a road that death often travels. <http://www.nytimes.com/2002/08/18/weekinreview/the-world-a-road-that-death-often-travels.html?pagewanted=1> Retrieved 04.11.09.
New York Times (2006). Rumor, fear and fatigue hinder final push to end polio.<http://www.nytimes.com/2006/03/20/international/asia/20polio.html?_r=1&pagewanted=all> Retrieved 04.11.09.
OECD (2008). Niger: Land of transit: Interview with Mr. Guy-Michel Bolouvi.<http://www.oecd.org/dataoecd/15/31/42097752.pdf> Retrieved 04.11.09.
OECD (2009). Chapter 9. Niger – A crossroads of african migration networks:interview with guy-Michel BOLOUVI. In Regional Challenges of West AfricanMigration: African and European Perspectives. (pp. 199–208).
Overell, S., Magalhaes, J., & Ruger, S. (2007). Forostar: A system for GIR. Lecture Notesin Computer Science, 4730, 930.
Oxford Analytica (2005). Ivorian conflict takes toll on region. <http://www.forbes.com/2005/08/31/ivory-coast-civil-war-cx_0831oxan-ivorycoast.html> Retri-eved 04.11.09.
Peuquet, D. (1994). It is about time: a conceptual framework for the representationof temporal dynamics in geographic information systems. Annals of theAssociation of American Geographers, 84(3), 441–461.
Peuquet, D. (2002). Representations of Space and Time. Guilford Press.Pirolli, P. (2007). Information Foraging Theory: Adaptive Interaction with Information.
USA: Oxford University Press.Pirolli, P. (2009). Powers of 10: Modeling complex information-seeking systems at
multiple scales. Computer, 42(3), 33–40.Pirolli, P., & Card, S. (2005). The sensemaking process and leverage points for analyst
technology as identified through cognitive task analysis. In Paper presented atthe International Conference on Intelligence Analysis. McLean, VA.
Pirolli, P., & Card, S. (1995). Information foraging in information accessenvironments. Proceedings of the SIGCHI Conference on Human Factors inComputing Systems, 51–58.
Pirolli, P., & Card, S. (1999). Information foraging. Psychological Review, 106,643–675.
Proulx, P., Tandon, S., Bodnar, A., Schroh, D., Harper, R., & Wright, W. (2006). Avianflu case study with n space and geotime. In Paper presented at the IEEESymposium on Visual Analytics Science and Technology. Baltimore, MD, USA.
Rain, D. (1999). Eaters of the Dry Season: Circular Labor Migration in the West AfricanSahel. Westview Press.
Rauch, E., Bukatin, M., & Baker, K. (2003). A confidence-based framework fordisambiguating geographic terms. In Proceedings of the HTL/NAACL Workshopon the Analysis of Geographic References.
Reuters (2002). Prostitutes in border boomtown struggle with AIDS. <http://www.aegis.com/news/re/2002/RE020103.html> Retrieved 04.11 09.
Reuters (2009). Nigeria outbreaks a setback for polio eradication. <http://www.medscape.com/viewarticle/590550> Retrieved 04.11.09.
Robinson, A., Chen, J., Lengerich, E., Meyer, H., & MacEachren, A. (2005). Combiningusability techniques to design geovisualization tools for epidemiology.Cartography and Geographic Information Science, 32(4), 243–255.
Russell, D., Stefik, M., Pirolli, P., & Card, S. (1993). The cost structure of sensemaking.In Paper presented at the Proceedings of the INTERACT’93 and CHI’93conference on Human factors in computing systems.
Salton, G., Wong, A., & Yang, C. (1975). A vector space model for automatic indexing.Communications of the ACM, 18(11), 613–620.
Schneiderman, B. (1997). Designing the User Interface: Strategies for Effective Human–Computer Interaction. Reading, MA: Addison-Wesley.
SIMILE project (n.d). Timeline. <http://simile.mit.edu/timeline/> Retrieved 14.01.08.Stasko, J., Gorg, C., Liu, Z., & Singhal, K. (2007). Jigsaw: Supporting investigative
analysis through interactive visualization. In Paper presented at the VAST.Sacramento, CA.
Stasko, J., Görg, C., & Liu, Z. (2008). Sensemaking across text documents: Human-centered, visual exploration with Jigsaw. In Paper presented at the SensemakingWorkshop@ CHI 2008. Florence, Italy.
Tergan, S.-O. (2005). Digital concept maps for managing knowledge andinformation. In S.-O. Tergan & T. Keller (Eds.), Knowledge and InformationVisualization. LNCS 3426 (pp. 185–204). Heidelberg, Berlin: Springer-Verlag.
The Guardian (2005). Cry freedom, quietly. After outlawing slavery, Niger’sgovernment now appears eager to cover the problem up. <http://www.guardian.co.uk/world/2005/may/10/worlddispatch.jeevanvasagar> Retrieved04.11.09.

B. Tomaszewski et al. / Computers, Environment and Urban Systems 35 (2011) 192–207 207
The Independent (2001). Niger’s border prostitutes and the profits of Islam. <http://www.independent.co.uk/news/world/africa/nigers-border-prostitutes-and-the-profits-of-islam-683723.html> Retrieved 04.11.09.
The Independent (2005a). Beginning of the end for Niger slave trade. <http://www.independent.co.uk/news/world/africa/beginning-of-the-end-for-niger-slave-trade-527274.html> Retrieved 04.11.09.
The Independent (2005b). Drought and locust plague leave Niger on the brink offamine. <http://www.independent.co.uk/news/world/africa/drought-and-locust-plague-leave-niger-on-the-brink-of-famine-499462.html> Retrieved31.03.
The Medical News (2004). Meningitis vaccination campaign in northeast Chad tofight epidemic. <http://www.news-medical.net/news/2004/04/09/375.aspx>Retrieved 04.11.09.
Thomas, J. J., & Cook, K. A. (2005). Illuminating the Path: The Research andDevelopment Agenda for Visual Analytics. Los Alametos, CA: IEE.
Tomaszewski, B. (2008). Producing geo-historical context from implicit sources: ageovisual analytics approach. The Cartographic Journal, 45(3), 165–181.
Tomaszewski, B. (2009). A Geovisual Analytics Approach for Producing Geo-HistoricalContext. University Park, PA: Penn State University.
Tomaszewski, B. (2011). Situation awareness and virtual globes: Applications fordisaster management. Computers and Geosciences, 37, 86–92.
Tomaszewski, B. (in press). Examining the effects of Global Economic Crisis (GEC)on poverty through natural disasters impacts – An overview of the UNOOSARIVAF Project. In Paper presented at the Proceedings of the the Fourth UnitedNations International UN-SPIDER Bonn Workshop on Disaster Management andSpace Technology: ‘‘The 4C – Challenge: Communication – Coordination –Cooperation – Capacity Development’’. Bonn, Germany.
Tomaszewski, B., & MacEachren, A. (2010). Geo-historical context support forinformation foraging and sensemaking: Conceptual model, implementation,and assessment. In Paper presented at the IEEE Conference on Visual AnalyticsScience and Technology (IEEE VAST). Salt Lake City, Utah, USA.
Tuan, Y. (1990). Topophilia: A Study of Environmental, Perception, Attitudes and Values.Columbia University Press.
Turhan, A., Springer, T., & Berger, M. (2006). Pushing doors for modeling contextswith OWL DL – a case study. In Fourth Annual IEEE International Conference onPervasive Computing and Communications Workshop (PerCom). pp. 13–17.
United State Geological Survey (USGS) (Cartographer) (n.d). Niger Minerals Map.Vallet, D., Fernández, M., & Castells, P. (2005). An Ontology-Based Information
Retrieval Model. In Second European Semantic Web Conference (ESWC 2005).Lecture Notes in Computer Science, 3532. pp. 455–470.
Wang, X., Miller, E., Smarick, K., Ribarsky, W., & Chang, R. (2008). InvestigativeVisual Analysis of Global Terrorism. In Paper presented at the ComputerGraphics Forum.
Weick, K. (1988). Enacted sensemaking in crisis situations. Journal of ManagementStudies, 25(4), 305–317.
World Health Organization (WHO) (2002). WHO launches new vaccination drivealong Burkina Faso-Niger border. <http://www.highbeam.com/doc/1G1-91036945.html> Retrieved 04.11.09.
World Health Organization (WHO) (2006). Progress in reducing global measlesdeaths: 1999–2004. Weekly Epidemiological Record, 10(81), 89–96.
Xinhua (2006). UNICEF alerts Nigeria of polio cases. <http://news.xinhuanet.com/english/2006-05/04/content_4507498.htm> Retrieved 04.11.09.
Zhang, X., Qu, Y., Giles, C., & Song, P. (2008). CiteSense: Supporting sensemaking ofresearch literature. In Paper presented at the CHI. Florence, Italy.