Computers and Electronics in Agriculture - USDA · Computers and Electronics in Agriculture 76...
6
Computers and Electronics in Agriculture 76 (2011) 38–43 Contents lists available at ScienceDirect Computers and Electronics in Agriculture journal homepage: www.elsevier.com/locate/compag A portable scanning system for evaluation of spray deposit distribution Heping Zhu a,∗ , Masoud Salyani b , Robert D. Fox a a USDA-ARS Application Technology Research Unit, Wooster, OH, USA b University of Florida, Citrus Research & Education Center, Lake Alfred, FL, USA article info Article history: Received 19 March 2010 Received in revised form 8 December 2010 Accepted 3 January 2011 Keywords: DepositScan Droplet density Droplet distribution Image analysis Imaging instrumentation Spray coverage Spray quality abstract Preventing over- or under-spray applications on intended targets require a system to rapidly measure spray coverage and provide spray quality feedback information. A portable scanning system was devel- oped that could quickly evaluate spray deposit distribution and coverage area on deposit collectors such as water sensitive paper or Kromekote ® card. The system is integrated with a handheld business card scanner, deposit collectors, a laptop computer, and a custom-designed software package entitled “DepositScan”. The software is composed of a set of custom plug-ins that are used by an image-processing program (ImageJ) to produce a number of measurements suitable for describing spray deposit distri- bution. The program worked with the handheld business card scanner to scan spray deposits on the collectors. After scanning the collectors, individual droplet sizes, their distributions, total droplet num- ber, droplet density, amount of spray deposits, and percentage of spray coverage are displayed on the computer screen and saved in a spreadsheet. Spots smaller than 23.9 m are ignored by DepositScan when 2400 dpi resolution was used. Observations of nominal size spots through a stereoscopic micro- scope verified the accuracy of the system, and demonstrated that because of pixel limitations, the accuracy of any image-processing program using the pixel recognition technique would decrease as the spot sizes decrease. The portable scanning system offers a convenient solution for on-the-spot evaluation of spray quality under various working conditions. © 2011 Elsevier B.V. All rights reserved. 1. Introduction The effect of pesticide on the environment is a major concern throughout the world. Several European countries have regulated a reduction of total pesticide use (Matteson, 1995; Falconer, 1998; Franzén, 2007). Improving the spray application process is the most feasible approach to achieve this reduction without reducing the efficacy of pest control. This can be accomplished by spraying only when pests reach a critical threshold in the crop and by applying the spray uniformly over the entire canopy. Typical spray applica- tions generally provide over sprays to accessible parts of the target canopy and under sprays to hard-to-reach parts of the foliage. Hard- to-reach parts include the undersides of lower leaves of a field crop, the interior of dense bushes and tree canopies, etc. If sprays are applied uniformly throughout the canopy, significant reduction in the amount of applied active ingredient can be achieved without diminishing pest control. Concerns about the overuse of pesticides also have led to increased use of biological or ‘natural’ materials for pest control. Often these materials are not as effective as their chemical coun- terparts (synthetic pesticides) and require extensive coverage of ∗ Corresponding author. Tel.: +1 330 263 3871; fax: +1 330 263 3953. E-mail address: [email protected] (H. Zhu). plant canopies. Albertsson et al. (2010) in studies using ‘physically active’ materials, such as soaps and oils, found that effective con- trol of pests require nearly complete coverage of target canopies. The application of these materials requires quick and reliable tech- niques to detect their spray coverage quality. Several investigators have studied the relationships between spray application parameters (droplet density and pesticide con- centration) and the efficacy of pest control under laboratory and field conditions. In a laboratory study, Fisher and Menzies (1976) investigated the effects of the droplet density and exposure rate of newly hatched larvae of Grapholitha molesta (Busck) to carbaryl residues. When exposed continuously to carbaryl droplet residues, larvae reached a convulsive state in times inversely related to the number per cm 2 and to the percent area covered with droplets. Washington (1997), investigating the effects of fungicide spray droplet density, droplet size, and proximity of the spray deposit to fungal spores on banana leaf surface, concluded that calibrat- ing agricultural spray aircraft to deposit fungicide spray droplets with a mean density of 30 droplets/cm 2 and a VMD of 300–400 m would probably increase deposition efficiency on crop foliage and enhance disease control compared to aircraft calibrated to spray finer droplets. Falchieri et al. (1995) studied the relationship between the feed- ing behaviour of gypsy moth larvae exposed to Bt pesticide deposits and spray application parameters. They found that feeding inhibi- 0168-1699/$ – see front matter © 2011 Elsevier B.V. All rights reserved. doi:10.1016/j.compag.2011.01.003
Transcript of Computers and Electronics in Agriculture - USDA · Computers and Electronics in Agriculture 76...

A
Ha
b
a
ARRA
KDDDIISS
1
taFfewttcttatd
iOt
0d
Computers and Electronics in Agriculture 76 (2011) 38–43
Contents lists available at ScienceDirect
Computers and Electronics in Agriculture
journa l homepage: www.e lsev ier .com/ locate /compag
portable scanning system for evaluation of spray deposit distribution
eping Zhua,∗, Masoud Salyanib, Robert D. Foxa
USDA-ARS Application Technology Research Unit, Wooster, OH, USAUniversity of Florida, Citrus Research & Education Center, Lake Alfred, FL, USA
r t i c l e i n f o
rticle history:eceived 19 March 2010eceived in revised form 8 December 2010ccepted 3 January 2011
eywords:epositScanroplet densityroplet distribution
mage analysis
a b s t r a c t
Preventing over- or under-spray applications on intended targets require a system to rapidly measurespray coverage and provide spray quality feedback information. A portable scanning system was devel-oped that could quickly evaluate spray deposit distribution and coverage area on deposit collectorssuch as water sensitive paper or Kromekote® card. The system is integrated with a handheld businesscard scanner, deposit collectors, a laptop computer, and a custom-designed software package entitled“DepositScan”. The software is composed of a set of custom plug-ins that are used by an image-processingprogram (ImageJ) to produce a number of measurements suitable for describing spray deposit distri-bution. The program worked with the handheld business card scanner to scan spray deposits on thecollectors. After scanning the collectors, individual droplet sizes, their distributions, total droplet num-
maging instrumentationpray coveragepray quality
ber, droplet density, amount of spray deposits, and percentage of spray coverage are displayed on thecomputer screen and saved in a spreadsheet. Spots smaller than 23.9 �m are ignored by DepositScanwhen 2400 dpi resolution was used. Observations of nominal size spots through a stereoscopic micro-scope verified the accuracy of the system, and demonstrated that because of pixel limitations, the accuracyof any image-processing program using the pixel recognition technique would decrease as the spot sizes
anninrking
decrease. The portable scquality under various wo
. Introduction
The effect of pesticide on the environment is a major concernhroughout the world. Several European countries have regulatedreduction of total pesticide use (Matteson, 1995; Falconer, 1998;ranzén, 2007). Improving the spray application process is the mosteasible approach to achieve this reduction without reducing thefficacy of pest control. This can be accomplished by spraying onlyhen pests reach a critical threshold in the crop and by applying
he spray uniformly over the entire canopy. Typical spray applica-ions generally provide over sprays to accessible parts of the targetanopy and under sprays to hard-to-reach parts of the foliage. Hard-o-reach parts include the undersides of lower leaves of a field crop,he interior of dense bushes and tree canopies, etc. If sprays arepplied uniformly throughout the canopy, significant reduction inhe amount of applied active ingredient can be achieved withoutiminishing pest control.
Concerns about the overuse of pesticides also have led toncreased use of biological or ‘natural’ materials for pest control.ften these materials are not as effective as their chemical coun-
erparts (synthetic pesticides) and require extensive coverage of
∗ Corresponding author. Tel.: +1 330 263 3871; fax: +1 330 263 3953.E-mail address: [email protected] (H. Zhu).
168-1699/$ – see front matter © 2011 Elsevier B.V. All rights reserved.oi:10.1016/j.compag.2011.01.003
g system offers a convenient solution for on-the-spot evaluation of sprayconditions.
© 2011 Elsevier B.V. All rights reserved.
plant canopies. Albertsson et al. (2010) in studies using ‘physicallyactive’ materials, such as soaps and oils, found that effective con-trol of pests require nearly complete coverage of target canopies.The application of these materials requires quick and reliable tech-niques to detect their spray coverage quality.
Several investigators have studied the relationships betweenspray application parameters (droplet density and pesticide con-centration) and the efficacy of pest control under laboratory andfield conditions. In a laboratory study, Fisher and Menzies (1976)investigated the effects of the droplet density and exposure rateof newly hatched larvae of Grapholitha molesta (Busck) to carbarylresidues. When exposed continuously to carbaryl droplet residues,larvae reached a convulsive state in times inversely related to thenumber per cm2 and to the percent area covered with droplets.Washington (1997), investigating the effects of fungicide spraydroplet density, droplet size, and proximity of the spray depositto fungal spores on banana leaf surface, concluded that calibrat-ing agricultural spray aircraft to deposit fungicide spray dropletswith a mean density of 30 droplets/cm2 and a VMD of 300–400 �mwould probably increase deposition efficiency on crop foliage and
enhance disease control compared to aircraft calibrated to sprayfiner droplets.Falchieri et al. (1995) studied the relationship between the feed-ing behaviour of gypsy moth larvae exposed to Bt pesticide depositsand spray application parameters. They found that feeding inhibi-
tronics in Agriculture 76 (2011) 38–43 39
tdatg0dgskNfa
sasoasieci
odeufrepf
d(aaoHaeuetcts
stwsbo
2
gapwq
H. Zhu et al. / Computers and Elec
ion was more closely related to Bt concentration than to dropletensity and dose per unit area. The highest feeding inhibition waschieved with 10 BIU/L at 9 droplets/cm2. Koger et al. (2004) inves-igated the effect of glyphosate rate and coverage on pitted morninglory control. Increasing percent leaf exposure to glyphosate fromto 100% increased control from 57 to 75%. These results also
emonstrated that inadequate control of pitted morning glory withlyphosate was more related to plant resistance to glyphosate thanpray coverage. Hewitt and Meganasa (1993), using a motorizednapsack mist blower to discharge a 2.4% ULV spray (VMD 55 �m;MD 25 �m) of cypermethrin within grass and maize canopies,
ound that a minimum of about 9 droplets/cm2 was required tochieve 50% Spodoptera exempta larvae kill.
The quality of spray application in the field is usually mea-ured by collectors (e.g., water sensitive paper or Kromekote® card)ttached to selected target areas or leaves and inspected afterpraying (Sundaram et al., 1987; Theriault et al., 2001). Imagingr scanning devices are used to measure spots on the collectorsnd to calculate the size distribution, area covered, or other mea-ures of spray-coverage quality. Spot sizes are difficult to measuref spot density is too high, i.e., coverage is greater than 20% (Foxt al., 2003). However, in most of these cases, the coverage on theollectors is greater than required for effective pest control, so thiss not a problem (Fox et al., 2008).
No spray coverage quality standard exists for a specific insectr disease. Coverage quality depends on droplet size, number ofeposits and extent of coverage on target leaves or collectors. Forffectiveness, a greater number of spray droplets per unit area willsually have a higher probability of reaching the critical thresholdor pest control. Syngenta Crop Protection AG (Basel, Switzerland)ecommended at least 20–30 droplets/cm2 for insecticide or pre-mergence herbicide applications, 30–40 droplets/cm2 for contactost-emergence herbicide applications, and 50–70 droplets/cm2
or fungicide applications to provide satisfactory results.Several spot size measurement systems and methods have been
iscussed by Franz (1993), Salyani and Fox (1994, 1999), Wolf2003), and Hoffmann and Hewitt (2005). These systems are oper-ted under laboratory conditions to provide valuable informationbout the quality of the spray coverage when comparing sprayersr treatments from one sprayer with different operating conditions.owever, these systems are either too large or too slow to be valu-ble for spray coverage comparisons for growers at various trainingvents or for comparative field studies. Also, the pixel resolutionsed in these systems is very low (less than 300 dpi), causing a greatrror in the spray deposition analysis. In contrast, a portable devicehat quickly scans collectors with a high pixel resolution and thenalculates spray coverage data would be very useful to measure dis-ributions of coverage during spray experiments or to demonstratepray coverage at grower field days.
The objective of this study was to develop an easy-to-use andmall portable device using a pixel recognition scanning techniqueo measure spray quality under various working conditions. Thisill enable users to quickly determine spray deposits on collectors
uch as water sensitive paper and Kromekote® card, and provide aaseline for the spray coverage quality required for effective controlf insects or diseases and minimize off-target loss.
. Materials and methods
A spray deposition recognition system was developed by inte-
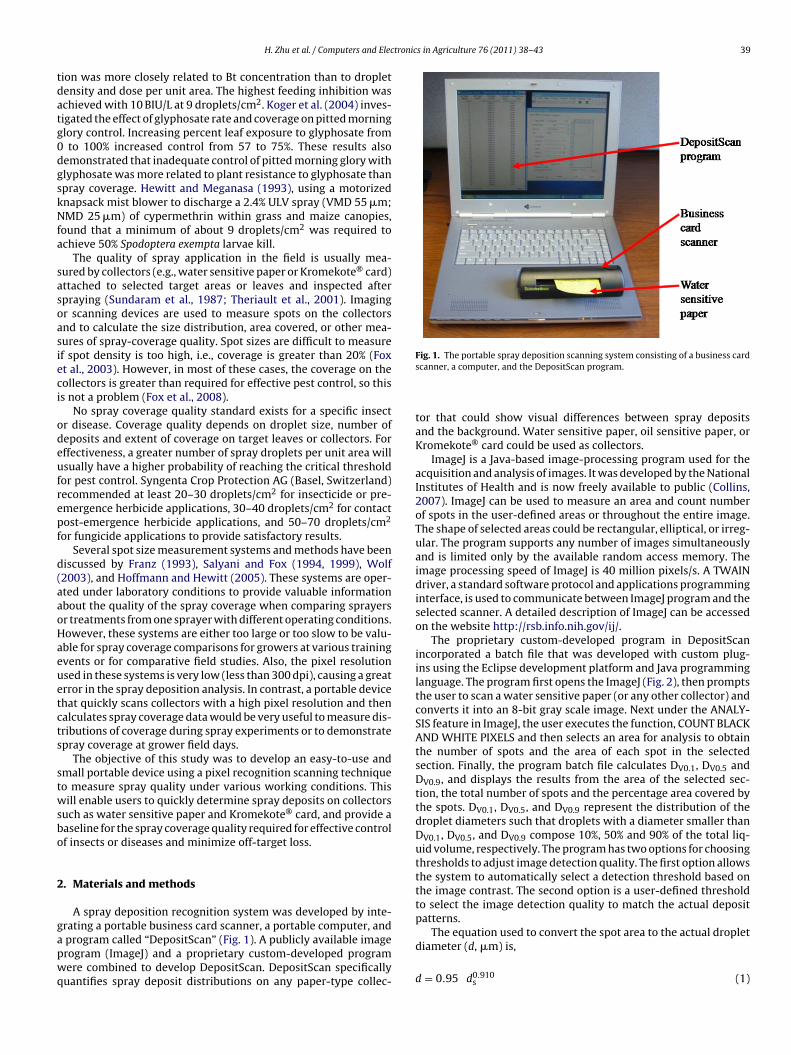
rating a portable business card scanner, a portable computer, andprogram called “DepositScan” (Fig. 1). A publicly available imagerogram (ImageJ) and a proprietary custom-developed programere combined to develop DepositScan. DepositScan specificallyuantifies spray deposit distributions on any paper-type collec-
Fig. 1. The portable spray deposition scanning system consisting of a business cardscanner, a computer, and the DepositScan program.
tor that could show visual differences between spray depositsand the background. Water sensitive paper, oil sensitive paper, orKromekote® card could be used as collectors.
ImageJ is a Java-based image-processing program used for theacquisition and analysis of images. It was developed by the NationalInstitutes of Health and is now freely available to public (Collins,2007). ImageJ can be used to measure an area and count numberof spots in the user-defined areas or throughout the entire image.The shape of selected areas could be rectangular, elliptical, or irreg-ular. The program supports any number of images simultaneouslyand is limited only by the available random access memory. Theimage processing speed of ImageJ is 40 million pixels/s. A TWAINdriver, a standard software protocol and applications programminginterface, is used to communicate between ImageJ program and theselected scanner. A detailed description of ImageJ can be accessedon the website http://rsb.info.nih.gov/ij/.
The proprietary custom-developed program in DepositScanincorporated a batch file that was developed with custom plug-ins using the Eclipse development platform and Java programminglanguage. The program first opens the ImageJ (Fig. 2), then promptsthe user to scan a water sensitive paper (or any other collector) andconverts it into an 8-bit gray scale image. Next under the ANALY-SIS feature in ImageJ, the user executes the function, COUNT BLACKAND WHITE PIXELS and then selects an area for analysis to obtainthe number of spots and the area of each spot in the selectedsection. Finally, the program batch file calculates DV0.1, DV0.5 andDV0.9, and displays the results from the area of the selected sec-tion, the total number of spots and the percentage area covered bythe spots. DV0.1, DV0.5, and DV0.9 represent the distribution of thedroplet diameters such that droplets with a diameter smaller thanDV0.1, DV0.5, and DV0.9 compose 10%, 50% and 90% of the total liq-uid volume, respectively. The program has two options for choosingthresholds to adjust image detection quality. The first option allowsthe system to automatically select a detection threshold based onthe image contrast. The second option is a user-defined thresholdto select the image detection quality to match the actual depositpatterns.
The equation used to convert the spot area to the actual droplet
diameter (d, �m) is,d = 0.95 d0.910s (1)

40 H. Zhu et al. / Computers and Electronics in Agriculture 76 (2011) 38–43
geJ pr
W
d
awsc
d
SwsTtoditpwto
tto
V
wuid
va
V
%
w
wngavicd
pus, Japan) with a SPOTTM Insight color digital camera (DiagnosticInstruments, Inc., Sterling Heights, MI) to capture the spot images.The image area of each spot was then measured with the Polyg-onal Hand-trace feature of Image-Pro® Plus program (version 4.1,
Fig. 2. The page heading of Ima
here,
s =√
4A
�(2)
nd A is the spot area (�m2) acquired from ImageJ. The spot areaas calculated from number of spot image pixels divided by the
canning resolution. In this program, the scanning resolution washosen up to 2400 dots per inch (dpi), or 10.58 �m per pixel length.
The final equation to calculate the actual droplet diameter is,
= 1.06 A0.455 (3)
The constants in the spread factor Eq. (1) were modified byalyani and Fox (1994) to calculate sizes of droplets deposited onater sensitive papers. The constants were verified with known
izes of single droplets produced by a single droplet generator.here are alternatives of the spread factors for different collec-ors, and some were determined from the mid-points of rangesf droplets produced by spinning disc atomizers. To accommodateifferent spread factors, the DepositScan also reports the area of
ndividual spots and allows the use of spread factor equations otherhan Eq. (1). In practice, some spots might be the result of overlap-ing deposits by several droplets and the resulting droplet diameterould then be a combination of several droplet diameters. Unfor-
unately, the program cannot distinguish a deposit originating fromne droplet or from several overlapping droplets.
After all the deposits are converted into actual droplet diame-ers, the diameters are sorted from smallest to largest, and based onhe calculated diameter, Eq. (4) is then used to calculate the volumef each droplet.
i = �di3
6, i = 1, . . . , N (4)
here, Vi is the individual droplet volume (�m3), di is the individ-al droplet diameter calculated with Eq. (3), i is the order of the
ndividual droplet in the sorted range, and N is the total number ofroplets on the sample collector.
After the volume of each droplet is calculated, the cumulativeolume (Vj) and percentage cumulative volume (%Vj) of dropletsre calculated with Eqs. (5) and (6), respectively,
j =j∑
i=1
Vi, j = 1, ......, N (5)
Vj = Vj
VN× 100 (6)
here, j is the sequenced order of the droplets in the sorted range.The program then searches for droplet diameters at the point
here %Vj = 10 for DV0.1, %Vj = 50 for DV0.5, and %Vj = 90 for DV0.9. Ifo value of %Vj exactly matches the10, 50, or 90 thresholds, the pro-ram will search for the closest higher and lower points to the value,
nd interpolate between the two closest points to obtain the %Vjalue. By dividing the area of the selected section, spray coverages calculated from the total of the spot areas, the droplet density wasalculated from total number of droplets, and the amount of sprayeposits per unit area is calculated from the cumulative volume Vj.ogram after DepositScan starts.
Any portable business card scanner with over 600 dpi resolu-tion that supports for a Twain driver is suitable for this system. Inthis study, a ScanShell 800N business card scanner (CSSN, Inc., LosAngeles, CA) with imaging resolution at 2400 dpi and a scan capabil-ity width up to 10.5 cm was used to test the DepositScan program.A laptop computer with Windows 2000 or later operating systemwas used to operate the DepositScan program. The scanner wasconnected to the computer high power USB port. In the absence ofa high power port, a port from a portable high power USB hub canbe used.
A reference card containing spots with “nominal” sizes (Fig. 3)produced by Hoechst AG (Frankfurt, Germany) was used to testthe accuracy of DepositScan. The reference card contained uniformspots ranging in size from 50 to 1000 �m in diameter. These spotsare usually used for spray applicators to visualize droplet sizeson water or oil sensitive papers. The actual size of each spot wasdetermined with a stereoscopic microscope (Model SZX12, Olym-
Fig. 3. Hoechst reference card containing “nominal” spot sizes of 50, 100, 250, 500,and 1000 �m used to test the accuracy of DepositScan.
H. Zhu et al. / Computers and Electronic
Fp
MweHma1satn
ttts53SFca
3
s2(sTD1Ts
ltsloatp
lector, users could use them to compare spray deposition quality
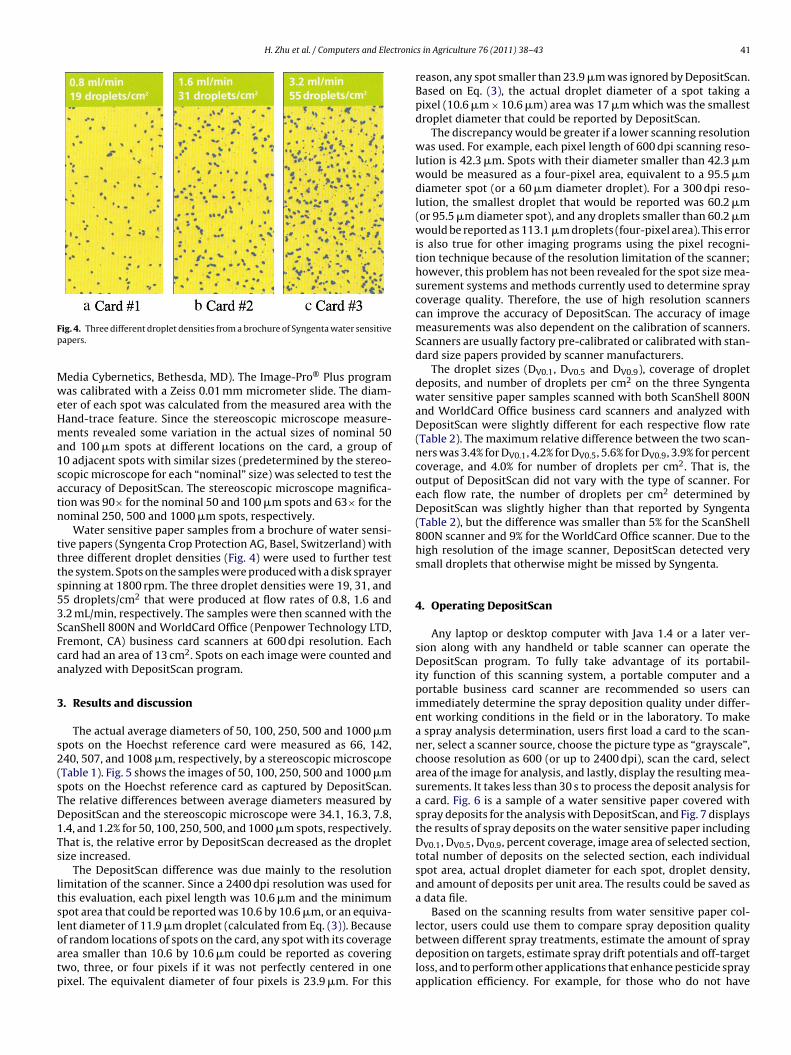
ig. 4. Three different droplet densities from a brochure of Syngenta water sensitiveapers.
edia Cybernetics, Bethesda, MD). The Image-Pro® Plus programas calibrated with a Zeiss 0.01 mm micrometer slide. The diam-
ter of each spot was calculated from the measured area with theand-trace feature. Since the stereoscopic microscope measure-ents revealed some variation in the actual sizes of nominal 50
nd 100 �m spots at different locations on the card, a group of0 adjacent spots with similar sizes (predetermined by the stereo-copic microscope for each “nominal” size) was selected to test theccuracy of DepositScan. The stereoscopic microscope magnifica-ion was 90× for the nominal 50 and 100 �m spots and 63× for theominal 250, 500 and 1000 �m spots, respectively.
Water sensitive paper samples from a brochure of water sensi-ive papers (Syngenta Crop Protection AG, Basel, Switzerland) withhree different droplet densities (Fig. 4) were used to further testhe system. Spots on the samples were produced with a disk sprayerpinning at 1800 rpm. The three droplet densities were 19, 31, and5 droplets/cm2 that were produced at flow rates of 0.8, 1.6 and.2 mL/min, respectively. The samples were then scanned with thecanShell 800N and WorldCard Office (Penpower Technology LTD,remont, CA) business card scanners at 600 dpi resolution. Eachard had an area of 13 cm2. Spots on each image were counted andnalyzed with DepositScan program.
. Results and discussion
The actual average diameters of 50, 100, 250, 500 and 1000 �mpots on the Hoechst reference card were measured as 66, 142,40, 507, and 1008 �m, respectively, by a stereoscopic microscopeTable 1). Fig. 5 shows the images of 50, 100, 250, 500 and 1000 �mpots on the Hoechst reference card as captured by DepositScan.he relative differences between average diameters measured byepositScan and the stereoscopic microscope were 34.1, 16.3, 7.8,.4, and 1.2% for 50, 100, 250, 500, and 1000 �m spots, respectively.hat is, the relative error by DepositScan decreased as the dropletize increased.
The DepositScan difference was due mainly to the resolutionimitation of the scanner. Since a 2400 dpi resolution was used forhis evaluation, each pixel length was 10.6 �m and the minimumpot area that could be reported was 10.6 by 10.6 �m, or an equiva-ent diameter of 11.9 �m droplet (calculated from Eq. (3)). Because
f random locations of spots on the card, any spot with its coveragerea smaller than 10.6 by 10.6 �m could be reported as coveringwo, three, or four pixels if it was not perfectly centered in oneixel. The equivalent diameter of four pixels is 23.9 �m. For thiss in Agriculture 76 (2011) 38–43 41
reason, any spot smaller than 23.9 �m was ignored by DepositScan.Based on Eq. (3), the actual droplet diameter of a spot taking apixel (10.6 �m × 10.6 �m) area was 17 �m which was the smallestdroplet diameter that could be reported by DepositScan.
The discrepancy would be greater if a lower scanning resolutionwas used. For example, each pixel length of 600 dpi scanning reso-lution is 42.3 �m. Spots with their diameter smaller than 42.3 �mwould be measured as a four-pixel area, equivalent to a 95.5 �mdiameter spot (or a 60 �m diameter droplet). For a 300 dpi reso-lution, the smallest droplet that would be reported was 60.2 �m(or 95.5 �m diameter spot), and any droplets smaller than 60.2 �mwould be reported as 113.1 �m droplets (four-pixel area). This erroris also true for other imaging programs using the pixel recogni-tion technique because of the resolution limitation of the scanner;however, this problem has not been revealed for the spot size mea-surement systems and methods currently used to determine spraycoverage quality. Therefore, the use of high resolution scannerscan improve the accuracy of DepositScan. The accuracy of imagemeasurements was also dependent on the calibration of scanners.Scanners are usually factory pre-calibrated or calibrated with stan-dard size papers provided by scanner manufacturers.
The droplet sizes (DV0.1, DV0.5 and DV0.9), coverage of dropletdeposits, and number of droplets per cm2 on the three Syngentawater sensitive paper samples scanned with both ScanShell 800Nand WorldCard Office business card scanners and analyzed withDepositScan were slightly different for each respective flow rate(Table 2). The maximum relative difference between the two scan-ners was 3.4% for DV0.1, 4.2% for DV0.5, 5.6% for DV0.9, 3.9% for percentcoverage, and 4.0% for number of droplets per cm2. That is, theoutput of DepositScan did not vary with the type of scanner. Foreach flow rate, the number of droplets per cm2 determined byDepositScan was slightly higher than that reported by Syngenta(Table 2), but the difference was smaller than 5% for the ScanShell800N scanner and 9% for the WorldCard Office scanner. Due to thehigh resolution of the image scanner, DepositScan detected verysmall droplets that otherwise might be missed by Syngenta.
4. Operating DepositScan
Any laptop or desktop computer with Java 1.4 or a later ver-sion along with any handheld or table scanner can operate theDepositScan program. To fully take advantage of its portabil-ity function of this scanning system, a portable computer and aportable business card scanner are recommended so users canimmediately determine the spray deposition quality under differ-ent working conditions in the field or in the laboratory. To makea spray analysis determination, users first load a card to the scan-ner, select a scanner source, choose the picture type as “grayscale”,choose resolution as 600 (or up to 2400 dpi), scan the card, selectarea of the image for analysis, and lastly, display the resulting mea-surements. It takes less than 30 s to process the deposit analysis fora card. Fig. 6 is a sample of a water sensitive paper covered withspray deposits for the analysis with DepositScan, and Fig. 7 displaysthe results of spray deposits on the water sensitive paper includingDV0.1, DV0.5, DV0.9, percent coverage, image area of selected section,total number of deposits on the selected section, each individualspot area, actual droplet diameter for each spot, droplet density,and amount of deposits per unit area. The results could be saved asa data file.
Based on the scanning results from water sensitive paper col-
between different spray treatments, estimate the amount of spraydeposition on targets, estimate spray drift potentials and off-targetloss, and to perform other applications that enhance pesticide sprayapplication efficiency. For example, for those who do not have

42 H. Zhu et al. / Computers and Electronics in Agriculture 76 (2011) 38–43
Table 1Comparison of average areas and diameters measured by DepositScan and a stereoscopic microscope for nominal spot diameters of 50, 100, 250, 500 and 1000 �m shownon a Hoechst AG (Frankfurt, Germany) reference card. Percent coefficients of variation (CV) are presented in parentheses.
Nominal Determined by DepositScan Determined by stereoscopic microscope
Diameter (�m) Area (�m2) Diameter (�m) Area (�m2) Diameter (�m)
50 6093 (25%) 88 (13%) 3390 (12%) 66 (6%)100 21,505 (10%) 165 (5%) 15,906 (6%) 142 (3%)250 52,688 (9%) 259 (4%) 45,342 (4%) 240 (2%)500 196,236 (5%) 500 (2%) 201,924 (3%) 507 (2%)
1000 777,954 (2%) 995 (1%) 797,752 (3%) 1008 (2%)
Fig. 5. Images of nominal 50, 100, 250, 500, and 1000 �m spots (not scaled) on Hoechst reference card captured with DepositScan.
Table 2Comparison of results of DepositScan between two different scanners.
Scanner Card# Flow rate (mL/min) Droplet size (�m) Coverage (%) Droplets/cm2
DV0.1 DV0.5 DV0.9 Measured Labeleda
ScanShell 800N 1 0.8 341 388 506 3.57 19.9 192 1.6 380 432 589 7.05 32.3 313 3.2 364 485 646 11.13 56.4 55
WorldCard Office 1 0.8 338 381 490 3.43 20.7 192 1.6 367 414 556 6.92 31.6 313 3.2 359 487 670 10.92 56.7 55
a Shown on the card reported by Syngenta.
Fig. 6. A sample of spray deposit on a water sensitive paper for analysis withDepositScan.
Fig. 7. Results of a spray deposit analysis on the water sensitive paper displayed byDepositScan.

tronic
afluodmeph
5
caqaItsevdchq2ipsTs
DTuoct
A
No
H. Zhu et al. / Computers and Elec
ccess to facilities such as particle size measurement system anduorescent analytical equipment, the scanning results could besed for estimation of droplet size classification and spray depositsn collectors. However, since the software does not correct for theroplet overlap, the estimate of droplet size and spray depositionay be inaccurate when the percentage spray coverage is large (for
xample, over 20%). The DepositScan software is available to theublic without charge, and can be downloaded from the websitettp://www.ars.usda.gov/mwa/wooster/atru/depositscan.
. Summary
DepositScan quickly analyzes distributions of spray deposits onollectors such as water sensitive papers or Kromekote® cards thatre widely used for determinations of pesticide spray depositionuality on spray targets. The program was developed using Eclipsend the Java compiler to produce a set of plug-ins accepted by themageJ application. In operation, DepositScan first requires the usero scan samples and then converts them to produce an 8-bit graycale images, then calculates the number of deposits and area ofach deposit in the selected section. Finally, results such as indi-idual droplet size, droplet distribution, total number of droplets,roplet density, amount of spray deposits per unit area and per-entage of area coverage are displayed and saved. The programas two options for choosing thresholds to adjust image detectionuality. The scanning resolution used in the program can go up to400 dpi, which would allow detection of a droplet that has a min-
mum diameter of 17 �m. The portable scanning system with theixel recognition technique offers a convenient solution for on-the-pot evaluation of spray quality under various working conditions.he use of DepositScan also could improve accuracy of pesticidepray applications.
However, because of pixel limitations, the accuracy ofepositScan decreases along with the decreased size of the spot.his limitation would also apply to any other imaging programsing pixel recognition. The program could not discriminate amongverlapped deposits on water sensitive paper or other collectors. Itsapability was also limited when spot coverage on collectors wasoo dense.
cknowledgement
The Authors gratefully acknowledge Stephen Sciarini, Barryudd and Yu Chen for their technical assistance in developmentf the scanning system.
s in Agriculture 76 (2011) 38–43 43
Mention of proprietary product or company is included forthe convenience of the readers and does not imply any endorse-ment or preferential treatment by USDA-ARS or The University ofFlorida.
References
Albertsson, J., Bjorkholm, A.M., Mickelaker, J., Svensson, S.A., 2010. Physically actingpesticides – application technology in berry production. In: Aspects of AppliedBiology 99, International Advances in Pesticide Application, pp. 401–407.
Collins, T.J., 2007. ImageJ for microscopy. BioTechniques 43 (Suppl. 1), 25–30.Falchieri, D., Mierzejewski, K., Maczuga, S., 1995. Effects of droplet density and
concentration on the efficacy of Bacillus thuringiensis and carbaryl againstgypsy moth larvae (Lymantria dispar L.). J. Environ. Sci. Health Part B 30 (4),535–548.
Falconer, K.E., 1998. Managing diffuse environmental contamination from agricul-tural pesticides: an economic perspective on issues and policy options, withparticular reference to Europe. Agric. Ecosyst. Environ. 69 (1), 37–54.
Fisher, R.W., Menzies, D.R., 1976. Effect of spray droplet density and exposure timeon the immobilization of newly-hatched oriental fruit moth larvae. J. Econ. Ento-mol. 69 (4), 438–440.
Fox, R.D., Derksen, R.C., Cooper, J.A., Krause, C.R., Ozkan, H.E., 2003. Visual and imagesystem measurement of spray deposits using water sensitive paper. Appl. Eng.Agric. 19 (5), 549–552.
Fox, R.D., Derksen, R.C., Zhu, H., Brazee, R.D., Svensson, S.A., 2008. A historyof air-blast sprayer development and future prospects. Trans. ASABE 51 (2),405–410.
Franz, E., 1993. Spray coverage analysis using a hand-held scanner. Trans. ASAE 36(5), 1271–1278.
Franzén, M., 2007. Programme to reduce the risks connected with the use of pesti-cides in Sweden. In: SuProFruit, 9th Workshop on Spray Application Techniquesin Fruit Growing , pp. 1–7.
Hewitt, A.J., Meganasa, T., 1993. Droplet distribution densities of a pyrethroid insec-ticide within grass and maize canopies for the control of Spodoptera exemptalarvae. Crop Prot. 12 (1), 59–62.
Hoffmann, W.C., Hewitt, A.J., 2005. Comparison of three imaging systems for water-sensitive papers. Appl. Eng. Agric. 21 (6), 961–964.
Koger, C.H., Poston, D.H., Reddy, K.N., 2004. Effect of glyphosate spray coverageon control of pitted morningglory (Ipomoea lacunosa). Weed Technol. 18 (1),124–130.
Matteson, P.C., 1995. The “50% pesticide cuts” in Europe: a glimpse of our future?Am. Entomol. 41 (4), 210–220.
Salyani, M., Fox, R.D., 1994. Performance of image analysis for assessment of simu-lated spray droplet distribution. Trans. ASAE 37 (4), 1083–1089.
Salyani, M., Fox, R.D., 1999. Evaluation of spray quality by oil and water-sensitivepapers. Trans. ASAE 42 (1), 37–43.
Sundaram, K.M.S., Groot, P.D., Sundaram, A., 1987. Permethrin deposits and airborneconcentrations downwind from a single swath application using a back packmist blower. J. Environ. Sci. Health Part B 22 (2), 171–193.
Theriault, R., Salyani, M., Panneton, B., 2001. Spray distribution and recov-ery in citrus application with a recycling sprayer. Trans. ASAE 44 (5),
1083–1088.Washington, J.R., 1997. Relationship between the spray droplet density of two pro-tectant fungicides and the germination of Mycosphaerella fijiensis ascospores onbanana leaf surfaces. Pest. Sci. 50, 233–239.
Wolf, R.E., 2003. Assessing the ability of DropletScan to analyze spray droplets froma ground operated sprayer. Appl. Eng. Agric. 19 (5), 525–530.