Computer simulation of the biomass production rate of cyclic fed batch continuous culture
7
J. appl. Chem. Biotechnol. 1978,28,784-790 Computer Simulation of the Biomass Production Rate of Cyclic Fed Batch Continuous Culture Robert Keller and Irving J. Dunn Technisch-Chemisches Laboratorium, Swiss Federal Institute of Technology (ETH), 8092 Zurich, Switzerland (Paper received 14 December 1977 and accepted I0 March 1978) The biomass productivity of cyclically operated variable volume fermenters has been investigated as a function of the initial volume and the feed flow rate. The results of computer simulations show that the productivity-dilution rate curves are similar to those for a constant volume chemostat, which represents a limiting case for the cyclic operation. Both cyclic fed batch and fed batch plus batch operation have been studied for Monod and substrate inhibition kinetics. The results obtained for variable volume operation can be used to estimate the loss in productivity when a chemostat inadver- tently undergoes volume fluctuations. 1. Introduction The batch reactor and the chemostat represent extremes in fermenter operation, as they are either completely discontinuous or completely continuous. Semi-continuous operation is possible either by feeding concentrated substrate and emptying the reactor when the reactor has reached a high biomass concentration, or by feeding dilute substrate and emptying the reactor when the tank is filled to capacity. The feed flow rate can either be maintained constant or be varied in order to achieve constant concentrations of substrates in the reactor. The intermittent outlet flow rate can be either moderate or high enough to cause instantaneous emptying of the reactor. If the fermenter is to be started again with an inoculation from the previous batch, this can be achieved by leaving part of the culture in the fermenter. Repeated filling and emptying to specified volumes results in a cyclic variable volume operation. Pirtl has termed this 'repeated fed batch culture' and has noted that even though the volume may be changing, a quasi-steady state can be theoretically established. He has analysed the product production for a cyclic fed batch culture under quasi-steady state conditions and found that when the specific product formation rate is constant, and the fraction of reactor volume emptied is small, cyclic operation approaches chemostat operation. Dunn and Mor2 showed that the p = F/ Y quasi-steady state condition m y hold for both increasing or decreas- ing fermentation volumes. Computer simulations showed that after an initial transient period the quasi-steady state is achieved where the change in organism concentration d Xldt = 0 and substrate concentration, S, is either slowly increasing or decreasing depending on whether the volume is decreasing or increasing. As pointed out by Yaman6 and Hirano3 the governing differential equations have simple sol- utions for particular limiting conditions. Whether volume changes must be considered in a fed batch system depends on the ratio of medium feed rate to tank volume. Most of the experimental work using fed batch cultures has been done under nearly constant volume conditions, either feeding at a constant rate4 or e~ponentially.~ Experiments have been reporteds.7 in which anti- biotic fermentations were operated in a cyclic variable volume fashion. Industrially, antibiotics and baker's yeast are said to be produced by various types of cyclic-fed batch processes. 0375-9210/78/1100-0784 $02.00 0 1978 Society of Chemical Industry 784
-
Upload
robert-keller -
Category
Documents
-
view
213 -
download
1
Transcript of Computer simulation of the biomass production rate of cyclic fed batch continuous culture
J. appl. Chem. Biotechnol. 1978,28,784-790
Computer Simulation of the Biomass Production Rate of Cyclic Fed Batch Continuous Culture
Robert Keller and Irving J. Dunn
Technisch-Chemisches Laboratorium, Swiss Federal Institute of Technology (ETH), 8092 Zurich, Switzerland
(Paper received 14 December 1977 and accepted I0 March 1978)
The biomass productivity of cyclically operated variable volume fermenters has been investigated as a function of the initial volume and the feed flow rate. The results of computer simulations show that the productivity-dilution rate curves are similar to those for a constant volume chemostat, which represents a limiting case for the cyclic operation. Both cyclic fed batch and fed batch plus batch operation have been studied for Monod and substrate inhibition kinetics. The results obtained for variable volume operation can be used to estimate the loss in productivity when a chemostat inadver- tently undergoes volume fluctuations.
1. Introduction
The batch reactor and the chemostat represent extremes in fermenter operation, as they are either completely discontinuous or completely continuous. Semi-continuous operation is possible either by feeding concentrated substrate and emptying the reactor when the reactor has reached a high biomass concentration, or by feeding dilute substrate and emptying the reactor when the tank is filled to capacity. The feed flow rate can either be maintained constant or be varied in order to achieve constant concentrations of substrates in the reactor. The intermittent outlet flow rate can be either moderate or high enough to cause instantaneous emptying of the reactor. If the fermenter is to be started again with an inoculation from the previous batch, this can be achieved by leaving part of the culture in the fermenter. Repeated filling and emptying to specified volumes results in a cyclic variable volume operation. Pirtl has termed this 'repeated fed batch culture' and has noted that even though the volume may be changing, a quasi-steady state can be theoretically established. He has analysed the product production for a cyclic fed batch culture under quasi-steady state conditions and found that when the specific product formation rate is constant, and the fraction of reactor volume emptied is small, cyclic operation approaches chemostat operation. Dunn and Mor2 showed that the p = F/ Y quasi-steady state condition m y hold for both increasing or decreas- ing fermentation volumes. Computer simulations showed that after an initial transient period the quasi-steady state is achieved where the change in organism concentration d Xldt = 0 and substrate concentration, S, is either slowly increasing or decreasing depending on whether the volume is decreasing or increasing.
As pointed out by Yaman6 and Hirano3 the governing differential equations have simple sol- utions for particular limiting conditions. Whether volume changes must be considered in a fed batch system depends on the ratio of medium feed rate to tank volume. Most of the experimental work using fed batch cultures has been done under nearly constant volume conditions, either feeding at a constant rate4 or e~ponentially.~ Experiments have been reporteds.7 in which anti- biotic fermentations were operated in a cyclic variable volume fashion. Industrially, antibiotics and baker's yeast are said to be produced by various types of cyclic-fed batch processes.
0375-9210/78/1100-0784 $02.00 0 1978 Society of Chemical Industry
784

Biomass production rate computer simulation 785
Although no experiments have been reported which can be used to confirm the previous theoretical work completely, it is expected that the conclusions are essentially valid as long as the limiting substrate concentration does not change at a rate which would cause unbalanced growth. In the Present work this theory is assumed to apply, and the characteristics of cyclic variable volume fermentations are investigated.
2. Theory
Two types of cyclic variable volume fed batch operation will be considered, fed batch and fed batch plus batch operation. A cycle begins with the filling period during which the reactor is filled from the initial culture volume, VO, to the final volume, Vt, with a constant feed flow rate, F.
With fed batch plus batch operation the fermentation continues at constant volume, Vt, until the substrate concentration is equal to 1 % of the feed concentration, SO. At this point, or immedi- ately after the reactor is filled if no batch period is used, the reactor is emptied instantaneously to volume VO. The concentrations of biomass and substrate at the beginning of each period are those from the end ofthe previous period. The reactor is repeatedly cycled until a steady state is achieved, during which the reactor variables for each repeating cycle reproducibly vary with time.
The balance equations for the filling period have been developed previously2 and are
dX - - = ( p - D)X dt
V= Vo+ Ft (3)
where F= constant from t = 0 to t e = (Vt - Vo)/F and D = F/ V. Both Monod and substrate inhibition kinetics are investigated using the equations,
and
During the batch period, F=O and equations (1) and (2) reduce to those for a batch fermen- tation. The initial and final biomass concentrations, the productivity, W, for each reproducible cycle is calculated from,
This value can be compared to the chemostat productivity for Monod kinetics,
and for substrate inhibition kinetics,
(pm- D)-[(D-pm)2-4D2KdK~]1'2 -~ -
2DIKr W = DY So- l Since equations (1) and (2) can be solved analytically only for special cases a numerical solution
is required. For simplification and generality the problem is formulated dimensionlessly as follows:
786 R. Keller and 1. J. Dunn
The dimensionless biomass concentration, f , is so defined that as the quasi-steady state is approached, f approaches 1 .O. The dimensionless feed flow rate, F, is defined in terms of the total volume, Vt, so that F becomes equivalent to a dimensionless dilution rate for the ful l tank when operated as a chemostat.
In dimensionless form equations (1)-(4) become:
(la) -- - (p- D ) X d f dt
d S dr
~ =(l--S)D-/iR
?= Po+ Fi
where D = PI ?
3. Results of the computer simulations
Equations (1)-(4) were solved using the FORTRAN-based simulation language GASP-IV.* The simulation of cyclic-fed batch operation was started with i?itial conditions from a batch which causes a transient start-up period before reproducible cycles are established. As with a chemostat, the transient state is dependent on the initial conditions, but the steady state is not.
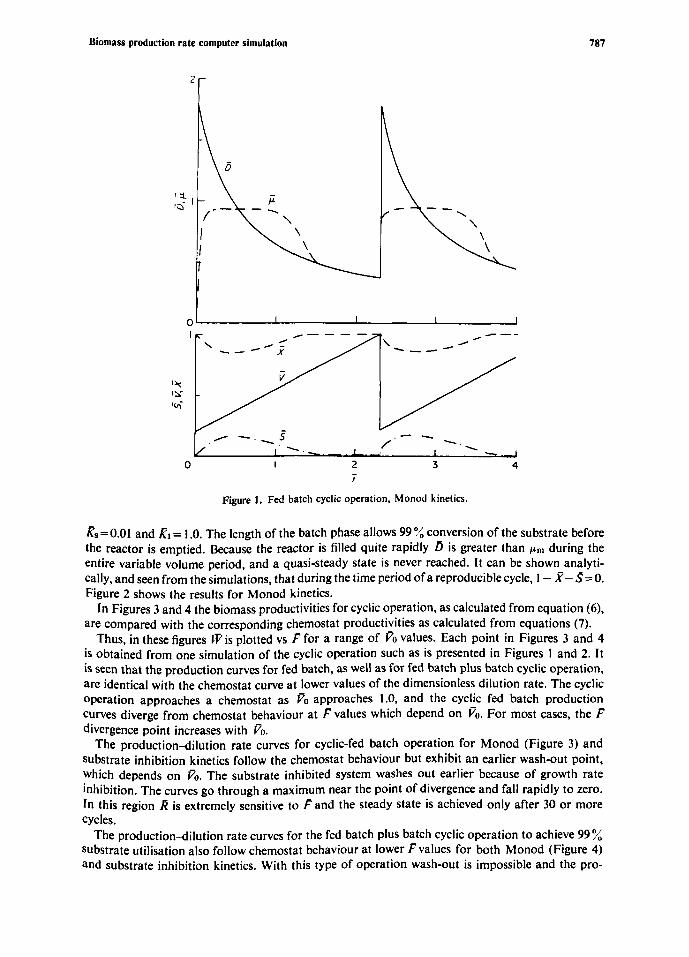
Figure 1 gives the results for the fed batch cyclic operation with Monod kinetics. Here the start-up period is very short. The values of the parameters in this simulation are F=0.35, ?0=0.2 and Ks= 0.01. The value of F determines the slope of the V vs icurve and is responsible for the minimum in f and the maximum in s during the filling phase. The quasi-steady state is reached at I = 1.5, where p= D, z=constant and s changes slowly with p. This condition remains until the emptying time at I= 2.3.
Similar results are obtained for the same situation with substrate inhibition kinetics. In this case inhibition effects cause p to pass through a minimum and maximum before reaching the quasi- steady state at i= I .8.
Simulations were run for cyclic operation for Monod and substrate inhibition kinetics when a constant volume batch phase is added to each cycle. The parameters used here are ?0=0.2, F= 1.0,
Biomass production rate computer simulation 787
t
Figure 1. Fed batch cyclic operation, Monod kinetics.
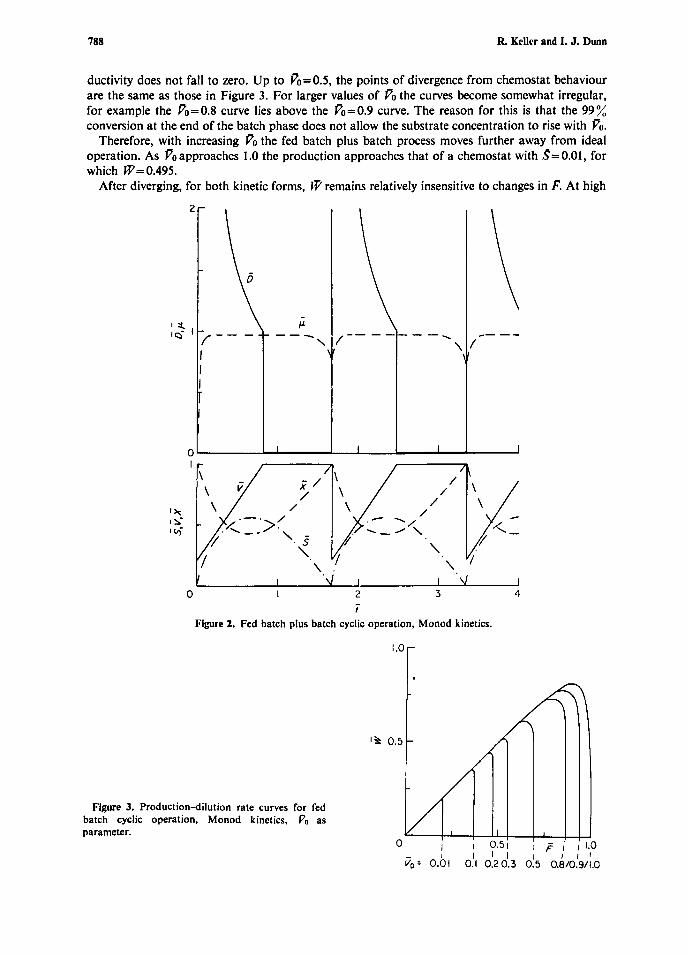
%= 0.01 and & = 1 .O. The length of the batch phase allows 99 % conversion of the substrate before the reactor is emptied. Because the reactor is filled quite rapidly D is greater than pm during the entire variable volume period, and a quasi-steady state is never reached. It can be shown analyti- cally, and seen from the simulations, that during the time period of a reproduciblecycle, I - X- S= 0. Figure 2 shows the results for Monod kinetics. In Figures 3 and 4 the biomass productivities for cyclic operation, as calculated from equation (6),
are compared with the corresponding chemostat productivities as calculated from equations (7). Thus, in these figures Cvis plotted vs F for a range of Po values. Each point in Figures 3 and 4
is obtained from one simulation of the cyclic operation such as is presented in Figures 1 and 2. It is seen that the production curves for fed batch, as well as for fed batch plus batch cyclic operation, are identical with the chemostat curve at lower values of the dimensionless dilution rate. The cyclic operation approaches a chemostat as PO approaches 1.0, and the cyclic fed batch production curves diverge from chemostat behaviour at F values which depend on PO. For most cases, the F divergence point increases with PO.
The production-dilution rate CUmes for cyclic-fed batch operation for Monod (Figure 3) and substrate inhibition kinetics follow the chemostat behaviour but exhibit an earlier wash-out point, which depends on Po. The substrate inhibited system washes out earlier because of growth rate inhibition. The curves go through a maximum near the point of divergence and fall rapidly to zero. In this region is extremely sensitive to F and the steady state is achieved only after 30 or more cycles.
The production-dilution rate curves for the fed batch plus batch cyclic operation to achieve 99% substrate utilisation also follow chemostat behaviour at lower F values for both Monod (Figure 4) and substrate inhibition kinetics. With this type of operation wash-out is impossible and the pro-
788 R. Keller and I. J. Dunn
ductivity does not fall to zero. Up to r0=0.5, the points of divergence from chemostat behaviour are the same as those in Figure 3. For larger values of PO the curves become somewhat irregular, for example the V0=0.8 curve lies above the p0=0.9 curve. The reason for this is that the 99% conversion at the end of the batch phase does not allow the substrate concentration to rise with PO.
Therefore, with increasing PO the fed batch plus batch process moves further away from ideal operation. As rooapproaches 1.0 the production approaches that of a chemostat with s=O.Ol, for which W= 0.495.
After diverging, for both kinetic forms, W remains relatively insensitive to changes in F. At high
2
0
Figure 3. Production-dilution rate curves for fed batch cyclic operation, Monod kinetics, Po as parameter.
I - - \ - -
I
/
\
I d I 0 I 2 3 4 -
I
Figure 2. Fed batch plus batch cyclic operation, Monod kinetics.
I .o
Ih 0.5
0

Biomass production rate computer simulation 789
- F
Figure 4. Production-dilution rate curves for fed batch plus batch cyclic operation, Monod kinetics, VCI as parameter.
values of F the reactor is rapidly filled and the constant values for correspond to the simple pure batch productivities. The production rates of a metabolite whose specific yield is constant would be represented by dilution curves similar to Figure 4.
4. Discussion
The time variations of the important quantities in cyclic fed batch fermentations, which are given in Figures 1 and 2, give a physical idea of the process. Of course, each simulation applies only to a particular set of parameters: flow rate, initial volume and kinetic constants. It is important to note that productivity of the cyclic operation considered here is not restricted to a quasi-steady state condition. A quasi-steady state may occur over part of the cycle as seen in Figure 1 or not at all as seen in Figure 2. This situation is in contrast to that analysed theoretically by Pirtl and experi- mentally by Pirt and co -~orke r s .~ .~
Normally, in order to calculate the production it would not be necessary to solve equations (1) and (2) for each new situation because Figures 3 and 4 show that before the wash-out point the production curves follow those of a chemostat. Therefore each new situation requires only solving equation (7). It is remarkable that the rather complex cyclic-fed batch operation can be reduced to this simple representation.
The slope of the production-inhibition rate curves in Figures 3 and 4 has a value of 1.0 which can be shown analytically by considering that the cycle time is given by r e = ( Vt- Vo)/F. Substituting into equation (6) gives W = XeF/Vr or in dimensionless form, r=p,?. Thus for the region where z e = 1 .O, the slope of P vs F is 1 .O. This applies to both kinetic forms.
Maintenance of constant volume in a chemostat can be difficult, and continually fluctuating volume can be analysed in terms of cyclic operation. Thus, Figures 3 and 4 can be used for chemo- stat operation to estimate the loss in productivity which might be caused by small but continual volume changes. For example, assume a chemostat with &=O.ol is operating with P=0.8. A 10% fluctuating change in volume corresponds approximately to the Po= 0.9 cyclic-fed batch situation; no change in rwould be expected. A 20% volume fluctuation would bring r from 0.77 to 0.74, while 30% fluctuations would cause wash-out.
Cyclic-fed batch culture while being conceptually more complex than either batch or continuous culture may, for some fermentations, be the easiest operating procedure. The equipment necessary is only slightly more complex than that required for batch operation, and the difficulty of main- taining constant volume is obviated. i t is not possible to advocate cyclic-fed batch operation for any particular type of fermentation because the questions of sterility and mutation have the same importance here as for chemostat culture. The biomass productivity cyclic fed batch operation was

790 R. Keller and I. J. Dunn
of primary concern in this work, but it would also be interesting to investigate the formation of a metabolite product as a function of its formation kinetics. From a dynamic point of view, little is known about the influence on fermentation of time varying substrate concentrations, especially as related to metabolite production. Cyclic operation could be found to be advantageous in this respect.
Nomenclature D F KS
K I W S so r t e V vo vt X X€! xo Y
cc P m -
Dilution rate, F/ V and F/ Vt (1-1) Flow rate (L3 tr1) Kinetic constant (M L-3)
Inhibition constant (M L-3) Biomass productivity (M L-3 f - l )
Substrate concentration in reactor (M L-3) Substrate concentration in feed (M L-3) Time measured from beginning of cycle ( I ) Total cycle time ( 1 ) Reactor liquid volume (L3) Reactor liquid volume beginning a cycle (L3) Maximum reactor liquid volume (La) Biomass concentration (M L-3) Biomass concentration at the end of a cycle (M L-3) Biomass concentration at the beginning of a cycle (M L-3) Yield coefficient Specific growth rate ( r - 1 )
Maximum specific growth rate ( r - ' ) Overbar refers to dimensionless quantities defined in equation (8).
References I . Pirt, S. J . J . appl. Chem. Biotechnol. 1974, 24, 415. 2. Dunn, 1. J . ; Mor, J.-R. Biotechnol. Bioeng. 1975, 14, 1805. 3. Yamank, T.; Hirano, S. J . Ferment. Technol. 1977, 55, 156. 4. Yoshida, F.; Yamank, T. Biotechnal. Bioeng. 1974, 16, 635. 5. Yamank, F.; Kishimoto, M.; Yoshida, F. J . Ferment. Technol. 1976, 54, 229. 6. Court, J . R.; Pirt, S. J . Abstracts Fifth Int. Ferment. Symp., Berlin, 1976, 127. 7. Trilli, A.; Michelini, V.; Montavani. V.: Pirt, S. J. J . appl. Chem. Biotechnal. 1977, 27, 219. 8. Pritsker, A. A. 9. The GASP I V Simulation Language Wiley, New York, 1974.