Android Malware Identi cation Through Visual Exploration ...

Computer Assisted Photo Identification of Dermochelys coriacea
P.M. de Zeeuw, E.J. Pauwels,Centrum Wiskunde & Informatica, Amsterdam (NL)
{paul.de.zeeuw,eric.pauwels}@cwi.nl
E.B. RanguelovaPrime Vision, Delft (NL)
D.M. BuonantonyDuke University
Beaufort, North Carolina (USA)[email protected]
S.A. EckertWIDECAST
Ballwin, Missouri (USA)[email protected]
1. Introduction
Identification marking is a fundamental tool usedfor conservation, management and research of wildanimal populations. For marine turtles, markingis generally accomplished through the use of plas-tic or metal livestock tags attached to a flipper, orthrough the use of injected electronic Passive Inte-grated Transponder (PIT) tags. However, difficultiesin applying long-term marking methods on sea turtleshave significantly hindered the ability to accuratelymeasure a wide variety of biological and populationvariables like population size, reproductive output andlongevity. One method specifically evaluated on theleatherback sea turtle (Dermochelys coriacea) is theuse of photo-identification to identify individual ani-mals. Leatherbacks are listed as critically endangeredby the International Union for Conservation of Natureand Natural Resources, see also Eckert et al. [4].
A feature unique to leatherbacks is the presence ofthe so-called pink spot, a de-pigmented patch locatedon the dorsal surface of the head, directly over thepineal gland, see Figure 1. Pioneering studies by Mc-Donald and Dutton [6] showed that the shapes of pinkspots appeared distinct enough between individuals tobe used as a unique identifier.
However, as data collections expand, photo-identification by human analysts involves increas-ingly laborious and tedious browsing through a photodatabase, up to prohibitive levels. We thereforeseek to construct a computer-assisted system, ca-pable of automatically matching pink spot pho-tographs against a database of earlier encounters,with the purpose of identifying individual and re-migrant leatherbacks. Because re-sightings are notfrequent, one operational requirement is that the risk
of overlooking a genuine match should be extremelylow. For related work, on other species, see BranzanAlbu et al. [1], Ranguelova et al. [7], Van Tienhovenet al. [8] and references therein.
Figure 1. The same leatherback pho-tographed at different occasions. Yellowrectangles indicate manual cropping priorto automatic matching, see Figure 2.
Overview Images of the same animal taken at dif-ferent occasions may vary with respect to illumination,

resolution and viewing angle. Figure 1 highlights howmanual cropping of the pink spot involves a somewhatarbitrary choice. Furthermore, through the years, thespot can become partially occluded due to scars andpollution. We have to design a robust image match-ing algorithm able to withstand the above variations.Since the head’s dorsal surface is essentially flat andthe size of the spot is small with respect to the dis-tance to the camera, the geometric deformation be-tween images of the same animal can be satisfactorilymodeled by an affine transformation, i.e. a combina-tion of translation, scaling, shearing and rotation.
The computer-assisted system that we proposeis based on the Scale Invariant Feature Transform(SIFT, Lowe [5]) which selects so-called keypoints andgathers gradient information around them in descrip-tor vectors. To achieve the required low false negativerate we perform the subsequent matching of imageswhile using relaxed control parameters. This resultsin many spurious matches which are then pruned byinsisting on the affine consistency of the keypoint lo-cations, see Figure 2 for an illustration. Addition-ally, we check the cross correlation of gray values at anumber of selected high contrast regions. The com-ponents of the matching procedure are explained inSection 3. In Section 4 we put the procedure to thetest by means of two datasets, one of which involvesimportant changes over time.
2 Image Preprocessing
The first step when entering an image in the systemis cropping, which is performed manually as part ofthe data entry procedure. This results in a smallerimage, in which the pink spot features prominentlyand most of the background clutter has been removed,as illustrated by the yellow rectangles in Figure 1.
Although SIFT keypoint matching has been ex-tended to colour images [2], it proves advantageousto convert our images into grayscale as they containlittle colour information, carrying shades of pink andgray. We opt for the following two conversions:
1. Image Fusion In general, image fusion seeks tocombine salient information in two or more images ofthe same scene into a single highly informative im-age. Here we consider the R, G and B componentas three separate images that are fused into one, thegrayscale image. The particular (multiresolution) fu-sion method we use is described in De Zeeuw [3].Hereby the conversion into grayscale appears to bewithout noticeable loss of information.
2. Opponent based colour contrast To highlightthe pink spot we compute the contrast (K) betweenthe red component (R) and the (almost) average ofgreen (G) and blue (B):
K = R− 0.4(G+B).
Notice that we settle for a factor 0.4 rather than 0.5 asit strikes a good balance between removing flashlightand enhancing contrast.
3 Image matching
SIFT keypoints extraction and matching For agiven grayvalue image the SIFT algorithm [5] searches— across different scales — for well-localized regionsthat stand out from their local background. It pro-duces the location of the region centres, as well asthe appropriate scale and the orientation with respectto the dominant gradients. Along with each keypointpi comes a keypoint descriptor δi, which is a featurevector (of length 128) summarizing local gradient in-formation. These features are defined such that theyare independent of image scaling and rotation and, toa considerable extent, invariant to changes in illumi-nation and 3D camera viewpoint.
The similarity of images is then quantified bymatching their SIFT keypoints, based on the cor-responding descriptors. More formally, let’s assumethat the SIFT algorithm has identified n points pi
in I and n′ points p′j in I ′. For each keypoint
pi (i = 1 . . . n) in I one looks for the best matchingkeypoint p′
j (j = 1 . . . n′) in image I ′ by searchingfor the smallest distance d(δi, δ′
j) between their re-spective 128-sized descriptors δi and δ′
j . Only if thisminimal distance is significantly better than the sec-ond best match (to say, point p′
k with descriptor δ′k)
in the sense that d(δi, δ′j) < DRd(δi, δ′
k) (for somethreshold value 0 < DR < 1), then this match isretained; otherwise it is rejected.
The fraction DR is called the distance ratio, andits value has a significant influence on the number ofmatches found. Low values for this control parametermake the inequality condition more exacting, resultingin a small number of keypoint matches, if any at all.Conversely, picking a DR-value close to 1 relaxes theinequality condition, resulting in more point matches.The downside of the latter lenient threshold value isthat the risk of producing spurious point matches be-tween dissimilar regions in both images is also quiteelevated, see top of Figure 2.
As mentioned before, due to the fact that re-sightings are relatively rare, the penalty for false neg-atives (overlooking an actual match) far outweighs

the inconvenience of a false positive (a match thatdoes not hold up under scrutiny). For that reasonwe allow for lenient values of DR (up to 0.9) anduse additional checks on the geometry and grayvaluesto remove erroneous matches. As a first sieve, weonly retain matches that are bi-directional, i.e. theypersist when we swap the roles of I and I ′. This al-ready significantly reduces the number of erroneousmatches. Nevertheless, it is unlikely that all of themwill be weeded out and we have to resort to the before-mentioned constraints (next).
Affinely consistent constellations At this pointin the processing we have two paired-up sets,P = {p1, . . . , pi, . . . , pk} in image I and P ′ ={p′
1, . . . , p′i, . . . , p
′k} in image I ′, where each point pi
is uniquely matched to its counterpart p′i. As the per-
missive choice of the DR parameter frequently resultsin a multitude of spurious matches, we now search forthe maximal subset(s) S ⊂ P , and the correspondingS′ ⊂ P ′, that are related through an affine transfor-mation A,
A(pi) = p′i, ∀pi ∈ S.
The rationale is clear: since we know that the geo-metric deformation between different images of thesame pink spot are well approximated by an affinetransformation (see introduction), correctly matchedkeypoints need to satisfy the same constraint. SubsetsS and S′ will be called affinely consistent constella-tions. The larger the constellations, the stronger theevidence that the proposed matches are genuine.
To identify these constellations, we resort to ex-haustive search. More precisely, we consider everypossible quintet of keypoints in I together with thequintet of paired up keypoints in I ′ and check whetherthere exists an affine transformation that maps thequintet in I onto the quintet in I ′ (within a predefinedtolerance). If this is the case, we try to expand thequintet by including more points for which the affinetransformation proves accurate. This step is iterated,each time recomputing the affine transformation onthe expanded set, until no more points can be added.
In this way, each initial quintet Q will give rise toaffinely consistent constellations SQ and S′
Q. Thelargest of such constellations (in terms of numberof points) over all quintets Q are called the largestaffinely consistent constellations of the paired-uppointsets P and P ′.
Figure 2 illustrates how this procedure, when ap-plied to the 31 matches generated by SIFT (top),removes erroneous matches to end up with affinelyconsistent constellations of seven points.
Figure 2. Matching the pineal spots of Fig-ure 1. Top: Visualization of matched key-points (31) using Lowe’s matching algo-rithm. Bottom: Largest affinely consis-tent constellations: subsets of maximumsize (7) that are related through an affinetransformation.
Region-based checking At this point we are leftwith a constellation of (m say) affinely consistentmatches. If this number is large (typically m > 10)then we can safely assume that the two images match.Conversely, if m is small (m < 5) then this a strongindication that the corresponding images are non-matching/different. If, however, m takes on an in-termediate value then we need additional verificationbased on local image content.
We proceed as follows. Given the constellation ofm affinely consistent bi-directional matches betweenthe two images I and I ′ we can estimate the bestfitting affine transformation A, i.e. the one that mini-mizes
∑mi=1 ‖A(pi)− p′
i‖2. We then apply this trans-formation to the whole image I, producing A(I). Ifthis transformation is for real, grayvalues in A(I) andI ′ should be highly correlated. To check the abovewe select 15 high contrast subregions R′ in I ′. Us-ing cross-correlation, we find the locations of the bestmatching counterparts (R) in the registered imageA(I). If the images I and I ′ are indeed matching
(and A is the correct affine transform) then the cen-tres of the regions R and R′ should be close. As thescore for region-matching we count how many (r say)of the 15 selected regions satisfy the proximity. Thefinal similarity score s for the image pair I and I ′ isthen defined as the sum s = m+ r.
4 Results
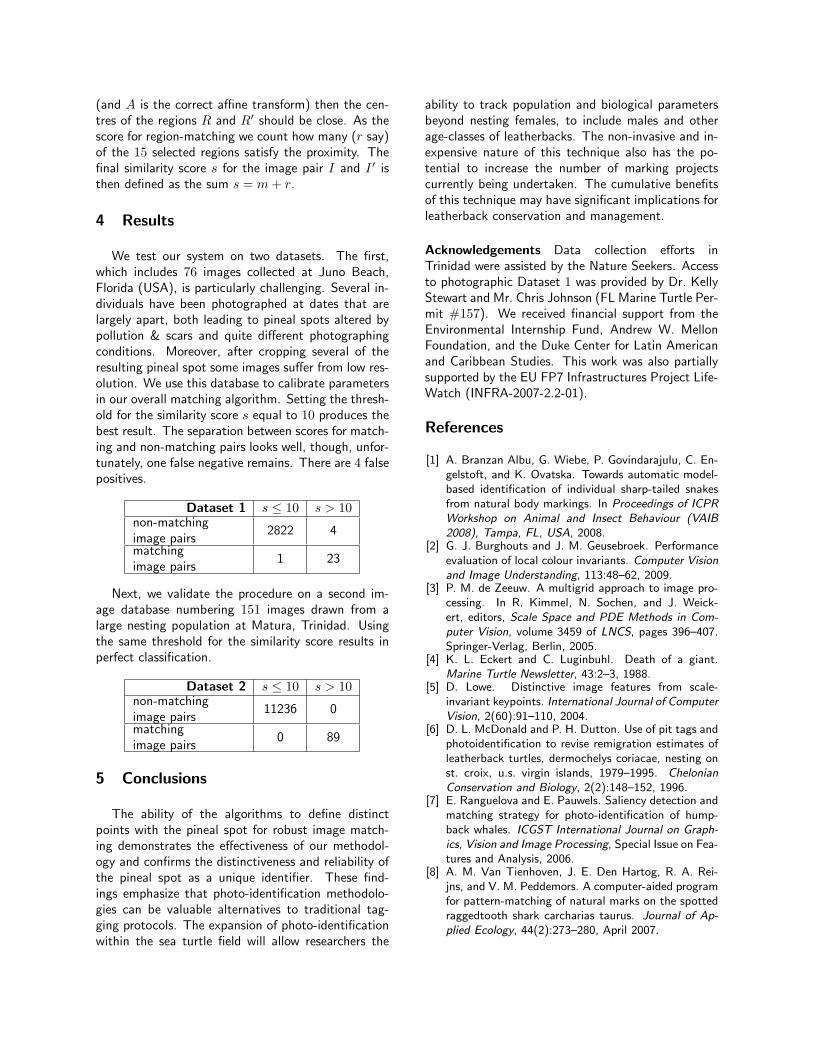
We test our system on two datasets. The first,which includes 76 images collected at Juno Beach,Florida (USA), is particularly challenging. Several in-dividuals have been photographed at dates that arelargely apart, both leading to pineal spots altered bypollution & scars and quite different photographingconditions. Moreover, after cropping several of theresulting pineal spot some images suffer from low res-olution. We use this database to calibrate parametersin our overall matching algorithm. Setting the thresh-old for the similarity score s equal to 10 produces thebest result. The separation between scores for match-ing and non-matching pairs looks well, though, unfor-tunately, one false negative remains. There are 4 falsepositives.
Dataset 1 s ≤ 10 s > 10non-matchingimage pairs
2822 4
matchingimage pairs
1 23
Next, we validate the procedure on a second im-age database numbering 151 images drawn from alarge nesting population at Matura, Trinidad. Usingthe same threshold for the similarity score results inperfect classification.
Dataset 2 s ≤ 10 s > 10non-matchingimage pairs
11236 0
matchingimage pairs
0 89
5 Conclusions
The ability of the algorithms to define distinctpoints with the pineal spot for robust image match-ing demonstrates the effectiveness of our methodol-ogy and confirms the distinctiveness and reliability ofthe pineal spot as a unique identifier. These find-ings emphasize that photo-identification methodolo-gies can be valuable alternatives to traditional tag-ging protocols. The expansion of photo-identificationwithin the sea turtle field will allow researchers the
ability to track population and biological parametersbeyond nesting females, to include males and otherage-classes of leatherbacks. The non-invasive and in-expensive nature of this technique also has the po-tential to increase the number of marking projectscurrently being undertaken. The cumulative benefitsof this technique may have significant implications forleatherback conservation and management.
Acknowledgements Data collection efforts inTrinidad were assisted by the Nature Seekers. Accessto photographic Dataset 1 was provided by Dr. KellyStewart and Mr. Chris Johnson (FL Marine Turtle Per-mit #157). We received financial support from theEnvironmental Internship Fund, Andrew W. MellonFoundation, and the Duke Center for Latin Americanand Caribbean Studies. This work was also partiallysupported by the EU FP7 Infrastructures Project Life-Watch (INFRA-2007-2.2-01).
References
[1] A. Branzan Albu, G. Wiebe, P. Govindarajulu, C. En-gelstoft, and K. Ovatska. Towards automatic model-based identification of individual sharp-tailed snakesfrom natural body markings. In Proceedings of ICPRWorkshop on Animal and Insect Behaviour (VAIB2008), Tampa, FL, USA, 2008.
[2] G. J. Burghouts and J. M. Geusebroek. Performanceevaluation of local colour invariants. Computer Visionand Image Understanding, 113:48–62, 2009.
[3] P. M. de Zeeuw. A multigrid approach to image pro-cessing. In R. Kimmel, N. Sochen, and J. Weick-ert, editors, Scale Space and PDE Methods in Com-puter Vision, volume 3459 of LNCS, pages 396–407.Springer-Verlag, Berlin, 2005.
[4] K. L. Eckert and C. Luginbuhl. Death of a giant.Marine Turtle Newsletter, 43:2–3, 1988.
[5] D. Lowe. Distinctive image features from scale-invariant keypoints. International Journal of ComputerVision, 2(60):91–110, 2004.
[6] D. L. McDonald and P. H. Dutton. Use of pit tags andphotoidentification to revise remigration estimates ofleatherback turtles, dermochelys coriacae, nesting onst. croix, u.s. virgin islands, 1979–1995. ChelonianConservation and Biology, 2(2):148–152, 1996.
[7] E. Ranguelova and E. Pauwels. Saliency detection andmatching strategy for photo-identification of hump-back whales. ICGST International Journal on Graph-ics, Vision and Image Processing, Special Issue on Fea-tures and Analysis, 2006.
[8] A. M. Van Tienhoven, J. E. Den Hartog, R. A. Rei-jns, and V. M. Peddemors. A computer-aided programfor pattern-matching of natural marks on the spottedraggedtooth shark carcharias taurus. Journal of Ap-plied Ecology, 44(2):273–280, April 2007.