Computationally Efficient Clustering of Audio …fractor/papers/friedland_137.pdf ·...
35
Computationally Efficient Clustering of Audio-Visual Meeting Data Hayley Hung, Gerald Friedland, and Chuohao Yeo Abstract This chapter presents novel computationally efficient algorithms to ex- tract semantically meaningful acoustic and visual events related to each of the par- ticipants in a group discussion using the example of business meeting recordings. The recording setup involves relatively few audio-visual sensors, comprising a lim- ited number of cameras and microphones. We first demonstrate computationally efficient algorithms that can identify who spoke and when, a problem in speech processing known as speaker diarization. We also extract visual activity features ef- ficiently from MPEG4 video by taking advantage of the processing that was already done for video compression. Then, we present a method of associating the audio- visual data together so that the content of each participant can be managed individ- ually. The methods presented in this article can be used as a principal component that enables many higher-level semantic analysis tasks needed in search, retrieval, and navigation. 1 Introduction With the decreasing cost of audio-visual sensors and the development of many video-conferencing systems, a growing trend for creating instrumented meeting rooms could be observed. As well as aiding teleconferencing, such meeting rooms could be used to record all meetings as a tool for staff training and development or to remind them of certain agenda items that were discussed. Given the number of H. Hung ( ) University of Amsterdam, Amsterdam, Netherlands e-mail: [email protected] G. Friedland International Computer Science Institute (ICSI), Berkeley, USA C. Yeo Institute for Infocomm Research, Singapore, Singapore L. Shao et al. (eds.), Multimedia Interaction and Intelligent User Interfaces, Advances in Pattern Recognition, DOI 10.1007/978-1-84996-507-1_2, © Springer-Verlag London Limited 2010 25
Transcript of Computationally Efficient Clustering of Audio …fractor/papers/friedland_137.pdf ·...
Computationally Efficient Clusteringof Audio-Visual Meeting Data
Hayley Hung, Gerald Friedland,and Chuohao Yeo
Abstract This chapter presents novel computationally efficient algorithms to ex-tract semantically meaningful acoustic and visual events related to each of the par-ticipants in a group discussion using the example of business meeting recordings.The recording setup involves relatively few audio-visual sensors, comprising a lim-ited number of cameras and microphones. We first demonstrate computationallyefficient algorithms that can identify who spoke and when, a problem in speechprocessing known as speaker diarization. We also extract visual activity features ef-ficiently from MPEG4 video by taking advantage of the processing that was alreadydone for video compression. Then, we present a method of associating the audio-visual data together so that the content of each participant can be managed individ-ually. The methods presented in this article can be used as a principal componentthat enables many higher-level semantic analysis tasks needed in search, retrieval,and navigation.
1 Introduction
With the decreasing cost of audio-visual sensors and the development of manyvideo-conferencing systems, a growing trend for creating instrumented meetingrooms could be observed. As well as aiding teleconferencing, such meeting roomscould be used to record all meetings as a tool for staff training and development orto remind them of certain agenda items that were discussed. Given the number of
H. Hung (�)University of Amsterdam, Amsterdam, Netherlandse-mail: [email protected]
G. FriedlandInternational Computer Science Institute (ICSI), Berkeley, USA
C. YeoInstitute for Infocomm Research, Singapore, Singapore
L. Shao et al. (eds.), Multimedia Interaction and Intelligent User Interfaces,Advances in Pattern Recognition,DOI 10.1007/978-1-84996-507-1_2, © Springer-Verlag London Limited 2010
25

26 H. Hung et al.
meetings that occur for a single person or even a work group, recording and stor-ing meetings alone would not be useful unless they could be searched and browsedeasily later.
In this chapter, we discuss ways in which we can move toward the use of instru-mented meeting rooms while also minimizing the amount of audio-visual sensors,thus enabling fast setup and portability; We show experiments to cluster the audioand visual data of each person where only one microphone and two cameras areused to record the group meetings. From this, we present computationally efficientalgorithms for extracting low-level audio and video features. The chapter is dividedinto sections describing firstly the general challenges of the meeting room scenarioand what types of applications have been proposed. Then, we describe the relatedwork on audio-visual speaker segmentation and localization in Sect. 2. In Sect. 3,we describe the overall approach that is presented in this chapter. Then, we describethe audio-visual sensor setup that we used in evaluating our algorithms in Sect. 4.Next, we describe how speakers and their turn-taking patterns are extracted usingan online speaker diarization algorithm (Sect. 5). Then, in Sect. 6, we describe howvisual activity from individuals can be extracted from compressed-domain featuresand compare this to conventional pixel-domain processing. In Sect. 7, we describea method of associating audio-visual data and present bench-marking results. Weconclude in Sect. 9 and discuss the future challenges.
2 Background
Clustering audio-visual meeting data can involve the grouping of events on differentlevels. From the coarsest level, we may want to group them based on date, location,or which work-group participated. If we increase the granularity, we observe eventswithin a single meeting such as the types of activities that took place. Increasingthe granularity further, each activity consists of a conversation type (ranging frommonologue to discussion) where speech turn-taking events occurs. For each speechevent, there are also accompanying motion features, such as a nod of the head, thatmight accompany a statement of agreement. We can go further in granularity byobserving each speech utterance such as separation into phonemes. The motion canbe organized based on the types of motion that occur such as whether it is an upwardor downward motion.
Like any data mining task, our ultimate obstacle in creating a system that cancater completely to our searching and browsing needs is the problem of the Seman-tic Gap. The semantic gap is defined as the difference between the cognitive rep-resentation of some data compared to what can be extracted in terms of its digitalrepresentation. In this chapter, we concentrate on discussing how audio-visual meet-ing data can be clustered by who spoke when and where. The approach we presenthere consists of two tasks. The first clusters audio data based on how many speakersthere are and when they speak. Semantically, this is not so meaningful since we onlyknow that there are N speakers and when they spoke but we do not know who eachspeaker was. The second task takes these speaker clusters and identifies where they

Computationally Efficient Clustering of Audio-Visual Meeting Data 27
are in a set of video streams by associating the clustered audio with video features,which can then be used to show the corresponding speakers at the relevant time.This step already closes the semantic gap in terms of finding speakers and whenthey spoke and provides audio and video footage of how a speaker delivered a line.
Historically, speaker diarization has been a useful tool for the speech processingcommunity since once the speakers have been identified, automatic speech recog-nition (ASR) can be applied to the utterances and attributed to a particular person.There are many who believe that closing the semantic gap has involved process-ing speech in terms of its verbal content. From a linguistic viewpoint, this seemsto be the natural choice if we wish to extract the verbal content of what is beingsaid so that interactions can be analyzed semantically. However, while semanticsare closely related to verbal cues, meaning can also be extracted from nonverbalfeatures. In some cases, the nonverbal cues can be a better indicator of the senti-ment of the delivery of a phrase. A common example would be the use of sarcasmwhere someone may say “yes” when they actually mean “no”. Analyzing the ver-bal content alone would provide us with the incorrect interpretation of the messagebut looking at the nonverbal cues, we might see that the delivery contained audiofeatures that are more highly correlated with disagreement.
Practically speaking, systems that can automatically analyze audio-visual datausing ASR and computational linguistics face many challenges. In natural speech,people do not always speak in perfect sentences and may correct themselves, changetopic, talk over each other or complete each other’s sentences. Typically ASR algo-rithms are plagued with challenges such as variations in accent, overlapping speech,and differences in delivery of the same word from the same person (which can de-pend on the preceding and following words), errors from detected words whichare out of vocabulary, or inaccurate language models. The state-of-the art word er-ror rate (WER) using distant microphones is around 25% using close-talk head-setmicrophones and around 40% using a distant (0.5 m) microphone source [29]. Interms of computational linguistics, analyzing dialog acts (the aim of the utterancee.g. agreement, disagreement, knowledge transfer), summarization, topic detectionor the sentiment of what was said based on the ASR output can introduce furthererrors into the system chain. This is particularly problematic if the content of theexchanges are to be used for the analysis of higher semantic concepts from the data.
Analyzing or identifying these higher semantic concepts goes beyond the tradi-tional meeting browsing technologies that can be used to navigate between changesin topic in a conversation or simple functions just as skipping through a video every5 minutes. Being able to analyze a meeting by its social nonverbal content takesthe potential of meeting browsing technology to a more intuitive level for users.Much of data mining and audio-visual clustering has been treated as a data-drivenproblem but perhaps in the context of recorded meetings and in particular whereconversations are concerned, we must not overlook the stable nature of the nonver-bal behavior that is exhibited during these interactions. For example, it is known thatwe move more than our mouths when we talk; we gesticulate for emphasis or to helpus get our point across [43]. If our final goal is to browse meeting data in terms ofsocial memory triggers, can the patterns of nonverbal behavior seen in social inter-actions be used to cluster the data too? That is, could aspects of nonverbal behavior
28 H. Hung et al.
during conversations provide us a simple and practical solution to this problem? Re-cent work on estimating behavioral constructs such as find who is dominant [35],the personality of participants [52] or what roles people have [20] suggest that usingautomatically extracted nonverbal cues can be effective.
For meetings in a natural setting, we expect to see mostly unconstrained conver-sations. Natural conversation in meetings involve many factors that are generallyunwanted in a clean test scenario. The first is overlaps or interruptions in speech.Traditional data-sets [50] that are used to test audio-visual synchrony algorithmsassume that only one person speaks at a time. In more complex cases, one per-son mouths words not corresponding to the associated audio sequence in order toconfound simpler synchrony algorithms. Others contain subjects reciting digits si-multaneously. However, in all cases, the speech is not natural and test data in suchconditions do not reflect the majority of circumstances in which people find them-selves talking.
Other aspects of real conversations involves natural body movements. In natu-ral conversations, people move to aid emphasis of what they are saying, providefeedback for others and regulate their gaze patterns to encourage a smooth flow ofconversation between conversants [30, 43]. Promising work has been presented totake advantage of the correlation between more holistic body motion and speech[31, 32, 59, 60]. Such methods have shown a relationship between global bodymotion and speech over longer term sequences. The experiments presented in thischapter, continues in this direction, exploring the extent to which we can use find-ings in the psychology literature to address the audio-visual clustering problem inmeetings more directly for constructing a plausible practical approach to the prob-lem of speaker localization. For the remainder of this section, we will discuss firstlythe general challenges faced with organizing meeting data. Then we will concen-trate the discussion on related work on speaker diarization and on audio-visual syn-chrony, related to speech and finally some background on the findings in psychologyon audio-visual synchrony during conversations.
2.1 Challenges in Meeting Analysis
Organizing audio-visual meeting data involves using many different sorting criteria.For now, let us concentrate on scenarios where all the conversants are co-locatedso that interactions can occur face-to-face. Even under such circumstances whereacoustic and lighting conditions can be controlled, there are still considerable chal-lenges that can be addressed in a multi-disciplinary domain from signal processing,to computer vision, linguistics, and human–computer interaction.
Activities in meetings consist mainly of conversations or interactions betweenthe participants. Within meetings, people can communicate with each other in dif-ferent permutations and at different times. They can talk over each other, have sub-conversations, be involved in multiple conversations at the same time, and can pro-vide verbal as well as nonverbal signals to others. In some cases the verbal andnonverbal delivery of a message can be contradictory.

Computationally Efficient Clustering of Audio-Visual Meeting Data 29
As well as investigating group conversational dynamics in the work place froma psychological perspective [6, 17, 49], work has been done in the domain of com-putational modeling [2, 40, 48, 54]. Due to European project initiatives, the com-putational modeling of meetings has been considered in terms of either visual oraudio-visual segmentation of the group activities as discussions, monologues, note-taking, presentations or writing on a white board from the Multi-Modal MeetingManager Corpus (M4) (http://www.idiap.ch/mmm/corpora/m4-corpus/) [2, 40, 54]where the meetings were scripted so each meeting activity and the times of exe-cution were predetermined. The main problem with approaching meeting analysisfrom this perspective is that in reality, it is very difficult to objectively label mono-logues, dialogues, discussions, or presentations. For example, if someone is givinga presentation and someone else asks a question, which ultimately leads to a dis-cussion, then is the current scenario a presentation or a discussion? The answer liesin the interval over which the judgment is made or the temporal context which isapplied. Therefore, depending on whether the judgment is made on a fine-grainedtime scale or a longer time scale, the judgment of the scenario can also be different.Since the M4 corpus, new audio-visual meeting data (Augmented MultiParty In-teraction (AMI) corpus http://www.idiap.ch/mmm/corpora/ami) has been recorded,where the scripting part of the scenario was removed. In more natural meeting sce-narios, people do not cut from doing a presentation to a discussion or a monologuenecessarily so annotating these meetings in terms of meeting actions is not practical.
With this in mind, it is probably easier to extract semantically meaningful fea-tures which are easier to evaluate. The problem with analyzing meeting actions isthat labeling is strongly dependent on the temporal context. Rather than examiningtemporal intervals of time, we can also segment based on events such as a changeof speaker or when someone starts or stops speaking. Such instantaneous events aremuch less ambiguous to label. This can be done by either speech/nonspeech detec-tion for cases where each person has their own microphone [66] or using speaker di-arization if a single microphone cannot be directly associated with a single speaker.
If we are able to cluster the audio and video information of a speaker, we canbegin to analyze more complex behaviors such as who responds to whom. Analy-sis of turn-taking patterns in discussions can be quite powerful for indicating whois dominant [35] or what roles people play in a meeting [20, 34]. With an audio-visual clustering method we could automatically obtain both the audio and videoinformation for the project manager for a meeting, for example. Given that the dis-cussion above has established that it is easier to analyze meetings in terms of theseturn-taking events, we provide a background review of speaker diarization. In ad-dition, we provide a review of work on the audio-visual association of speakers sothat some semantic meaning can be associated with the speakers that are identified.Finally, we provide some background information about how human body motionsare related to speech during conversations.
30 H. Hung et al.
2.2 Background on Speaker Diarization
The goal of speaker diarization is to segment audio into speaker-homogeneous re-gions with the ultimate goal of answering the question “who spoke when?” [55].While for the related task of speaker recognition, models are trained for a specific setof target speakers which are applied to an unknown test speaker for acceptance (thetarget and test speaker match) or rejection (mismatch), in speaker diarization thereis no prior information about the identity or number of the speakers in the record-ing. Conceptually, a speaker diarization system therefore performs three tasks: First,discriminate between speech and nonspeech regions (speech activity detection); sec-ond, detect speaker changes to segment the audio data; third, group the segmentedregions together into speaker-homogeneous clusters.
Some systems combine the two last steps into a single one, i.e., segmentationand clustering is performed in one step. In the speech community, different speakerdiarization approaches have been developed over the years. They can be organizedinto either one-stage or two-stage algorithms, metric-based, and probabilistic sys-tems, and either model-based or non-model-based systems.
Many state-of-the-art speaker diarization systems use a one-stage approach, i.e.,the combination of agglomerative clustering with Bayesian Information Criterion(BIC) [12] and Gaussian Mixture Models (GMMs) of frame-based cepstral features(MFCCs) [55] (see Sect. 5). Recently, a new speaker clustering approach, whichapplies the Ng–Jordan–Weiss (NJW) spectral clustering algorithm to speaker di-arization is reported [45].
In two-stage speaker diarization approaches, the first step (speaker segmenta-tion) aims to detect speaker change points and is essentially a two-way classifi-cation/decision problem, i.e., at each point, a decision on whether it is a speakerchange point or not needs to be made. After the speaker change detection, the speechsegments, each of which contains only one speaker, are then clustered using eithertop-down or bottom-up clustering.
In model-based approaches, pretrained speech and silence models are used forsegmentation. The decision about speaker change is made based on frame assign-ment, i.e., the detected silence gaps are considered to be the speaker change points.Metric-based approaches are more often used for speaker segmentation. Usually, ametric between probabilistic models of two contiguous speech segments, such asGMMs, is defined, and the decision is made via a simple thresholding procedure.
Over the years, research has concentrated on finding metrics for speaker changedetection. Examples are the Bayesian Information Criterion (BIC) [12], crossBIC (XBIC) [4, 36], Generalised Likelihood Ratio (GLR) [18], Gish distance[26], Kullback–Leibler distance (KL) [9], Divergence Shape Distance (DSD) [39].A more detailed overview can be found in [3]. Newer trends include the investiga-tion of new features for speaker diarization, such as [24, 61], and novel initializationmethods.
Computationally Efficient Clustering of Audio-Visual Meeting Data 31
2.3 Background on Audio-Visual Synchrony
So far, the speaker diarization system provides some intervals of speech associatedwith a single person, but we do not have information about what they look like orhow the message was delivered nonverbally. This can be done by associating theaudio streams with the correct video stream by identifying or exploiting the syn-chrony between the two modalities. Alternatively, sound source localization fromvideo can be used to tackle a similar problem. Most computational modeling hasinvolved identifying one or two people in a single video camera only where short-term synchrony of lip motion and speech are the basis for audio-visual localization.Audio-visual synchrony or sound source localization can be considered a task initself. However, both these tasks could be combined, and recent work has started toconsider both speaker diarization and localization as a single audio-visual task.
Common approaches to audio-visual speaker identification involve identifyinglip motion from frontal faces [13, 21, 22, 46, 47, 53, 57, 58]. Therefore, the un-derlying assumption is that motion from a speaker comes predominantly from themotion of the lower half of their face. This is further enforced by artificial audio-visual data of short duration, where only one person speaks. In these scenarios,natural conversation is not possible, and so problems with overlapping speech arenot considered. In addition, gestural or other nonverbal behaviors associated withnatural body motion during conversations are artificially suppressed [50].
Nock et al. [46] presents an empirical study to review definitions of audio-visualsynchrony and examine their empirical behavior. The results provide justificationsfor the application of audio-visual synchrony techniques to the problem of activespeaker localization in the more natural scenario of broadcast video. Zhang et al.[69] presented a multimodal speaker localization method using a specialized satel-lite microphone and omni-directional camera. Though the results seem comparableto the state-of-the-art, the solution requires specialized hardware, which is not desir-able in practice. Noulas et al. [47] integrated audio-visual features for online audio-visual speaker diarization using a dynamic Bayesian network (DBN), but tests werelimited to two-person camera views. Tamura et al. [58] demonstrate that the dif-ferent shapes the mouth can take when speaking facilitates word recognition undertightly constrained test conditions (e.g., frontal position of the subject with respectto the camera while reading digits).
The approaches discussed above were often tested on very limited data sets(which are not always publicly available) and were often recorded in highly con-strained scenarios where individuals were unable to move or talk naturally. In gen-eral, the speakers face the camera frontally and do not talk over or interrupt eachother. In contrast to previous methods which combine audio and video sources inthe early stages of the speaker diarization process, we present a late fusion approachwhere noisy video streams are associated with estimated speaker channels.
In terms of finding speakers in conversational settings where video data does notcapture high-resolution faces, Vajaria et al. [59, 60] were the first to consider theglobal body motion could be synchronous with speech. They presented a systemthat combines audio and video on a feature-level using eigenvector decomposition
32 H. Hung et al.
of global body motion. Hung et al. [31] developed this notion further by consideringhow simple motion features could be used to identify speakers in video streams forgroup discussions. Finally Campbell and Suzuki [10] analyzed speech and uppertorso motion behavior in meetings to study participation levels but did not go furtherinto evaluating how well speech and motion could be correlated.
2.4 Human Body Motions in Conversations
In contrast to much previous work in this area, we have found that relying on lip mo-tion to identify speakers is not always necessary and is not always possible [31, 32].In the psychology literature, it has been shown on many occasions that speaker andalso listener movements are directly related to the role they play in a conversation[37, 43]. We will explore this in more detail here to show that such nonverbal cuesplay a huge role in understanding and inferring behavior types in conversations.
In social psychology, human body movements in conversations have been studiedfrom different perspectives. The first looks at the movements of speakers, the secondlooks at the movement of listeners, and the final considers the synchrony betweenthe movements of speakers and listeners. The first two are important for understand-ing what differentiates speakers from listeners in terms of kinesic behavior, whilethe third is used more to measure the degree of mutual engagement between con-versants. The latter is beyond the scope of this paper, but more details can be foundin a critique of work on interactional synchrony by Gatewood and Rosenwein [25].
The first aspect involving the movement of speakers suggests that speakers ac-company their speech with gestures [37, 43]. Gestures accompanying speech them-selves have been classified in many different ways. Adam Kendon defined gestureas a
“range of visible bodily actions that are . . . generally regarded as part of a person’s willingexpression” (p. 49).
The reason for gesturing has been explained as a means of increasing precision [27,43], an evolutionary origin of language [38], or as an aid to speaking to facilitatelexical retrieval [42, 43]. Whatever the reason for moving when speaking, psychol-ogists are in agreement that we definitely move a number of body parts when wespeak. Moreover, it was noted by Gatewood and Rosenwein that “normal humanbeings exhibit remarkable integration of speech and body motion at the subsecondtime scale” (p. 13, [25]). Such a phenomenon was labeled as “self synchrony” byCondon and Ogston [15], who later elaborated that,
“As a normal person speaks, his body ‘dances’ in precise and ordered cadence with thespeech as it is articulated. The body moves in patterns of change which are directly pro-portional to the articulated pattern of the speech stream . . . . There are no sharp boundarypoints but on-going, ordered variations of change in the body which are isomorphic withthe ordered variations of speech” (p. 153) [16].
Gestures that accompany speech can be divided into a number of different cat-egories involving manipulation of facial features, head pose, the trunk (or upper
Computationally Efficient Clustering of Audio-Visual Meeting Data 33
torso), arms, shoulders, and hands. Hadar et al. found that short and rapid headmovements can accompany points of stress in a sentence as a person speaks [27]. Inaddition, Hadar et al. also found that the frequency of large linear movements of thehead was correlated with a person’s speaking time in a conversation [28]. In largergroups, speakers can also move their head to address all the participants. Depend-ing on the person’s status within the group, their level of conversant monitoring canvary [19].
Hand motions have been shown to be very related to the content of what is beingsaid; it has been suggested by Armstrong et al. that
“Most gestures are one to a clause, but when there are successive features within a clause,each corresponds to an idea unit in and of itself . . . . Each gesture is created at the momentof speaking and highlights what is relevant. . . " (p. 40–41) [5].
McNeill called such gestures “spontaneous” where “their meaning is determinedon-line with each performance” (p. 67) [43] and identified four types of relation-ships between spontaneous gestures and speech: iconic, metaphoric, beat, and ab-stract deictic. Iconic gestures represent objects and events in terms of resemblance;metaphoric gestures represent an abstraction; beat features are rhythmic movementsof the hand such as for counting or indexing a list; and abstract deictics representlocations of objects within a gesture space [43].
The listener in a conversation can provide feedback to the speaker, indicate thatthey wish to claim the floor, or indicate their interest in a conversation. It was foundby Hadar et al. [27] that listener’s head movements tended to involve more “linearand expansive” movements when indicating that they wanted to speak, “symmet-ric and cyclic” when providing simple feedback such as “yes” or “no” responses,and “linear but with shorter movements” during pauses in the other’s speech, whichcould be attributed to “synchrony” behavior between conversants. While speaker’smovements tend to be more pronounced, the movements of listeners are less pro-nounced but still observable. Harrigan found that body movements occurred morefrequently when a person was requesting a turn than during the middle of someoneelse’s speaking turn [30], showing that listeners tend to move less. She also foundthat hand gestures tended to precede a turn compared to feedback responses thatwere observed from motion from the head such as nods, shakes and tilts, facial ex-pressions, and shoulder shrugs. In particular, gestures from the hands were relatedto speech, serving to accent or emphasize what was being said.
3 Approach
Figure 1 shows a flow diagram of the approach that we have taken for clusteringthe audio-visual meeting data in terms of who spoke when and where they are. Thegoal of the presented system is to identify speakers and their approximate locationsin multiple camera streams, in an online and real-time fashion. We perform experi-ments with four-participant meetings for cases where there are either four cameras(one for each person) or two cameras (two people are shown per camera). A sum-mary of the approach is listed below.

34 H. Hung et al.
Fig. 1 Figure showing our approach. The work consists of two stages: (a) solving the task of “whois speaking now?” based on audio information only; (b) associating speakers with video streams.Different types of video features (c–d) are used to enhance the practicality and performance of thesystem
(a) Online real-time speaker diarization: Speaker clusters are generated using theaudio data to represent each speaker and when they speak. From this unsu-pervised data-driven method, a set of speaker clusters are generated where itis assumed that one speaker corresponds to one cluster.
(b) Audio-visual association of speakers streams and video: Using these speakerclusters, audio-visual association with a set of video streams is performed sothat the video or approximate spatio-temporal location of a speaker can befound from multiple cameras. We carried out experiments showing whetherit is possible to associate all participants to their audio source correctly in abatch manner and how the performance degrades as the length of the meetingis shortened. As the window size gets smaller, the likelihood of more thanone person speaking within the same time interval is greatly reduced, so wefinally carried out experiments on selecting and evaluating whether just thespeaker was associated with the correct video stream.
(c–d) Extraction of visual activity features: The video features themselves are com-puted in the compressed domain to take advantage of processing that is al-ready required for the video compression process. Using these features, it ispossible to do some spatial video-processing in order to identify the locationsof two participants in video streams. We try using different sets of camerasto both represent and localize speakers in the meeting. Finally, to improvelocalization performance, we tried creating a binary representation of eachperson’s visual activity, which generated a cleaner signal than the originalraw features used.
4 The Augmented MultiParty Interaction (AMI) Corpus
One of the largest corpora of meeting room data has been recorded by the Aug-mented MultiParty Interaction (AMI) corpus which was created out of a European

Computationally Efficient Clustering of Audio-Visual Meeting Data 35
Fig. 2 All available views in the data set
Fig. 3 Plan of theexperimental meeting room
Union funded project [11]. This initiative generated a corpus that contains both 100hours of audio-visual data and annotations from semantically low-level features,such as who is speaking to, more semantically meaningful concepts, such as di-alogue acts or who is looking at whom. In each meeting, four participants weregrouped together, and were asked to design a remote control device over a series ofsessions. Each person was assigned a role such as “Project Manager”, “MarketingExpert”, or “Industrial Designer”. A microphone array and four cameras were set inthe center of the room. Side and rear cameras were also mounted to capture differentangles of the meeting room and its participants, as shown in Fig. 2.
Each camera captures the visual activity of a single seated participant, who isassigned a seat at the start of each meeting session. Participants are requested not tochange seats during the session. No other people enter or leave the meeting duringthe session, so there are always only four interacting participants. Each person alsowore a headset and a lapel microphone. A plan view of the meeting room is shownin Fig. 3.
36 H. Hung et al.
5 Audio Speaker Diarization
5.1 Traditional Offline Speaker Diarization
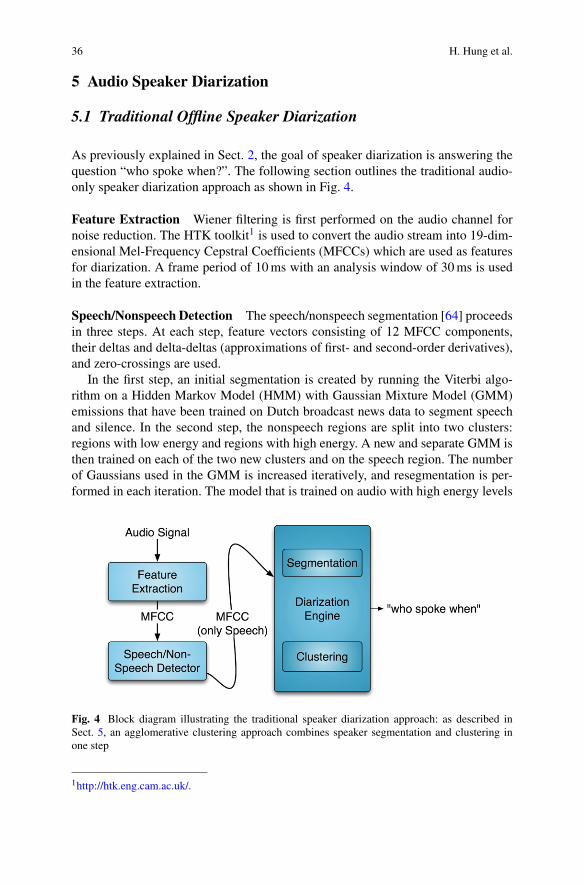
As previously explained in Sect. 2, the goal of speaker diarization is answering thequestion “who spoke when?”. The following section outlines the traditional audio-only speaker diarization approach as shown in Fig. 4.
Feature Extraction Wiener filtering is first performed on the audio channel fornoise reduction. The HTK toolkit1 is used to convert the audio stream into 19-dim-ensional Mel-Frequency Cepstral Coefficients (MFCCs) which are used as featuresfor diarization. A frame period of 10 ms with an analysis window of 30 ms is usedin the feature extraction.
Speech/Nonspeech Detection The speech/nonspeech segmentation [64] proceedsin three steps. At each step, feature vectors consisting of 12 MFCC components,their deltas and delta-deltas (approximations of first- and second-order derivatives),and zero-crossings are used.
In the first step, an initial segmentation is created by running the Viterbi algo-rithm on a Hidden Markov Model (HMM) with Gaussian Mixture Model (GMM)emissions that have been trained on Dutch broadcast news data to segment speechand silence. In the second step, the nonspeech regions are split into two clusters:regions with low energy and regions with high energy. A new and separate GMM isthen trained on each of the two new clusters and on the speech region. The numberof Gaussians used in the GMM is increased iteratively, and resegmentation is per-formed in each iteration. The model that is trained on audio with high energy levels
Fig. 4 Block diagram illustrating the traditional speaker diarization approach: as described inSect. 5, an agglomerative clustering approach combines speaker segmentation and clustering inone step
1http://htk.eng.cam.ac.uk/.
Computationally Efficient Clustering of Audio-Visual Meeting Data 37
is added to the nonspeech model to capture non-speech-like sounds such as music,slamming doors, paper rustling, etc. In the final step, the speech model is comparedto all other models using the Bayesian Information Criterion (BIC). If the BIC scoreis positive, the models are added to the speech model.
Speaker Segmentation and Clustering In the segmentation and clustering stageof speaker diarization, an initial segmentation is first generated by randomly parti-tioning the audio track into k segments of the same length. k is chosen to be muchlarger than the assumed number of speakers in the audio track. For meetings data,we use k = 16. The procedure for segmenting the audio data takes the followingsteps:
1. Train a set of GMMs for each initial cluster.2. Resegmentation: Run a Viterbi decoder using the current set of GMMs to seg-
ment the audio track.3. Retraining: Retrain the models using the current segmentation as input.4. Select the closest pair of clusters and merge them. This is done by going over all
possible pairs of clusters and computing the difference between the sum of theBayesian Information Criterion (BIC) scores of each of the models and the BICscore of a new GMM trained on the merged cluster pair. The clusters from thepair with the largest positive difference are merged, the new GMM is used, andthe algorithm repeats from the resegmentation step.
5. If no pair with a positive difference is found, the algorithm stops, otherwise thealgorithm repeats from step 2.
A more detailed description can be found in [64].The result of the algorithm consists of a segmentation of the audio track with n
clusters and an audio GMM for each cluster, where n is assumed to be the numberof speakers.
The computational load of such a system can be decomposed into three com-ponents: (1) find the best merge pair and merge; (2) model retraining and realign-ment; (3) other costs. After profiling the run-time distribution of an existing speakerdiarization system, we find that the BIC score calculation takes 62% of the totalrun-time.
Analyzing how the best merge hypothesis is found, the reason for the high costof the BIC score calculation can be identified. Let Da and Db represent the databelonging to cluster a and cluster b, which are modeled by θa and θb , respectively. Drepresents the data after merging a and b, i.e., D = Da ∪Db , which is parameterizedby θ . The Merge Score (MS) is calculated as (1) [1]:
MS(θa, θb) = logp(D|θ) − (logp(Da|θa) + logp(Db|θb)
). (1)
For each merge hypothesis a and b, a new GMM (θ ) needs to be trained. When thesystem is configured to use more initial clusters, which is preferable for better initialcluster purity, the computational load can become prohibitive.
The speaker diarization output consists of meta-data describing speech segmentsin terms of starting time, ending time, and speaker cluster name. This output is
38 H. Hung et al.
usually evaluated against manually annotated ground truth segments. A dynamicprogramming procedure is used to find the optimal one-to-one mapping betweenthe hypothesis and the ground truth segments so that the total overlap between thereference speaker and the corresponding mapped hypothesized speaker cluster ismaximized. The difference is expressed as Diarization Error Rate (DER), whichis defined by NIST.2 The DER can be decomposed into three components: misses(speaker in reference, but not in hypothesis), false alarms (speaker in hypothesis,but not in reference), and speaker errors (mapped reference is not the same as hy-pothesized speaker).
This Speaker Diarization System has competed in the NIST evaluations of thepast several years and established itself well among state-of-the-art systems.3
The current official score is 21.74% DER for the single-microphone case (RT07evaluation set). This error is composed of 6.8% speech/nonspeech error and 14.9%speaker clustering error. The total speaker error includes all incorrectly classifiedsegments, including overlapped speech. NIST distinguishes between recordingswith multiple distant microphones (MDM) and recordings with one single distantmicrophone (SDM). In the case of MDM, beam-forming is typically performed toproduce a single channel out of all available ones.
For our approach, the various experimental conditions that we used can be cat-egorized into a single distant microphone case and an individual close-talk micro-phone. For the first case, a single audio stream was created by mixing individualclose-talk microphone data, i.e., “Mixed Headset” or “Mixed Lapel” using a sum-mation. For the latter condition, a single microphone was selected from a micro-phone array from either the table or ceiling sources.
5.2 Online Speaker Diarization
Our first goal is to segment live-recorded audio into speaker-homogeneous regionsto answer the question “who is speaking now?”. For the system to work live andonline, the question must be answered on intervals of captured audio that are assmall as possible and performed in at least real-time. The online speaker diariza-tion system has been described in detail in [62] and has two steps: (i) training and(ii) recognition, which will be described in more detail in the subsequent sections.Figure 5 shows a summary of the on-line audio diarization algorithm.
Unsupervised Bootstrapping of Speaker Models To bootstrap the creation ofmodels, we use the speaker diarization system proposed by Wooters et al. [64] whichwas presented in Sect. 5.1 in the first meeting of each session. This also results inan estimation of the number of speakers and their associated speaker models. Oncemodels have been created, they are added to the pool of speaker models and can be
2http://nist.gov/speech/tests/rt/rt2004/fall.3NIST rules prohibit publication of results other than our own. Please refer to the NIST websitefor further information: http://www.nist.gov/speech/tests/rt/rt2007.

Computationally Efficient Clustering of Audio-Visual Meeting Data 39
Fig. 5 Summary of the on-line audio diarization algorithm
reused for all subsequent meetings. The speaker diarization system used for trainingis explained as follows.
Speaker Recognition In recognition mode, the system records and processeschunks of audio as follows. First, Cepstral Mean Subtraction (CMS) is implementedto reduce stationary channel effects [56]. While some speaker-dependent informa-tion is lost, according to our experiments performed, the major part of the discrimi-nant information remains in the temporally varying signal. In the classification step,the likelihood for each audio frame is computed against each set of Gaussian Mix-tures obtained in the training step. From our previous experiments on larger meetingcorpora, [62], we decided to use two-second chunks of audio. This introduces a la-tency of about 2.2 seconds after the person has started talking (recording 200 audioframes at 10-ms intervals plus a processing time of 0.1×real time).
The decision on whether a segment belongs to a certain speaker or the nonspeechmodel is reached using majority vote on the likelihoods of an audio frame belongingto a GMM. If the audio segment is classified as speech, we compare the winningspeaker model against the second best model by computing the likelihood ratio. Weuse this as an indicator of the confidence level. In our experiments, we assume thatthere are speaker models for all possible speakers, so we used the highest confidencelevel to indicate the most likely speaker. For a more realistic case, it is possible toapply a threshold to the confidence level to detect an unknown speaker, but thiscurrently requires manual intervention.
A Note on Model Order Selection Offline audio speaker diarization can lead tomore clusters than speakers since the method is data-driven, and therefore cluster
40 H. Hung et al.
merging stops depending on whether the BIC score is improved or worsened bymerging two candidate clusters. Due to the robustness of our online speaker diariza-tion algorithm, while more clusters than participants can be generated in the offlinetraining phase, in the online stage, noisy or extraneous clusters have much lowerlikelihoods, so they are never selected as likely speaker models. We found in ourexperiments that the number of recognized clusters and that of actual participantswere always equal.
It is also important to note that the data we use includes overlapping speech.These periods are automatically ignored when the speaker models are generatedto ensure they remain as clean as possible. Work has been carried out to addressoverlapping speech in offline diarization systems but involve a second pass overthe diarized audio signal, which would not be feasible for an on-line and real-timesystem [8].
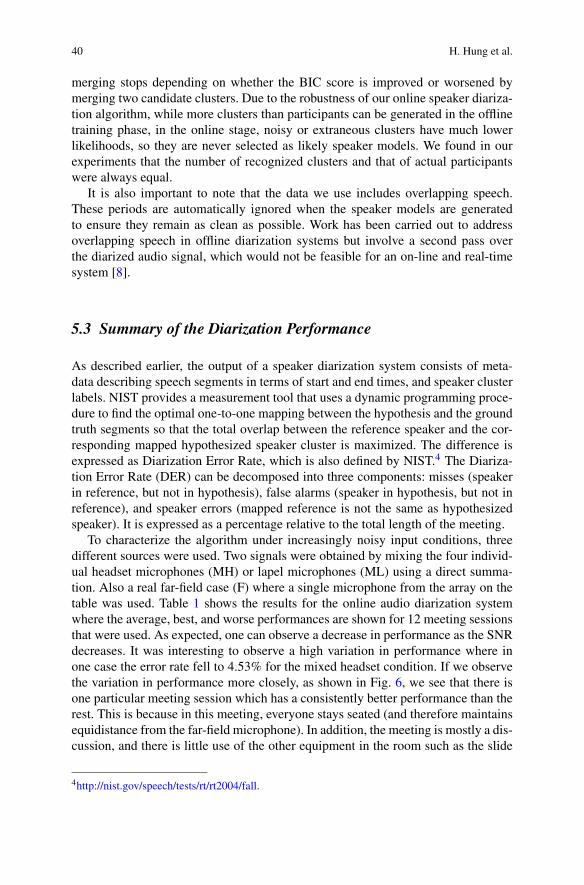
5.3 Summary of the Diarization Performance
As described earlier, the output of a speaker diarization system consists of meta-data describing speech segments in terms of start and end times, and speaker clusterlabels. NIST provides a measurement tool that uses a dynamic programming proce-dure to find the optimal one-to-one mapping between the hypothesis and the groundtruth segments so that the total overlap between the reference speaker and the cor-responding mapped hypothesized speaker cluster is maximized. The difference isexpressed as Diarization Error Rate, which is also defined by NIST.4 The Diariza-tion Error Rate (DER) can be decomposed into three components: misses (speakerin reference, but not in hypothesis), false alarms (speaker in hypothesis, but not inreference), and speaker errors (mapped reference is not the same as hypothesizedspeaker). It is expressed as a percentage relative to the total length of the meeting.
To characterize the algorithm under increasingly noisy input conditions, threedifferent sources were used. Two signals were obtained by mixing the four individ-ual headset microphones (MH) or lapel microphones (ML) using a direct summa-tion. Also a real far-field case (F) where a single microphone from the array on thetable was used. Table 1 shows the results for the online audio diarization systemwhere the average, best, and worse performances are shown for 12 meeting sessionsthat were used. As expected, one can observe a decrease in performance as the SNRdecreases. It was interesting to observe a high variation in performance where inone case the error rate fell to 4.53% for the mixed headset condition. If we observethe variation in performance more closely, as shown in Fig. 6, we see that there isone particular meeting session which has a consistently better performance than therest. This is because in this meeting, everyone stays seated (and therefore maintainsequidistance from the far-field microphone). In addition, the meeting is mostly a dis-cussion, and there is little use of the other equipment in the room such as the slide
4http://nist.gov/speech/tests/rt/rt2004/fall.

Computationally Efficient Clustering of Audio-Visual Meeting Data 41
Table 1 Diarization results in terms of the Diarization Error Rate (DER) using both offline and on-line methods. Note that the offline results were computed using meetings of 5-minute length, whilethe online results were bootstrapped using longer meetings but speaker models were producedfrom just 60 s of speech from each person. Results are also presented using different microphonesources where the associated signal-to-noise ratio for each source is shown in brackets
Input Offline results Online results
Video Methods F (21 dB) ML (22 dB) MH (31 dB) F (21 dB) ML (22 dB) MH (31 dB)
Average DER (%) 33.16 36.35 36.16 18.26 26.18 28.57
Fig. 6 Comparison of the online speaker diarization performance across different input conditionsand over the different meetings that were considered
screen or white board. In contrast, meeting IS1006d is one of the worst perform-ing meetings because people are often presenting at the whiteboard or slide screen.It is also interesting to observe that while the relative performance when using thefar-field and headset microphones remain fairly consistent (the far-field case alwaysperforms worse), the mixed lapel condition does not. This could be explained byadditional noise generated by shifting of the body or touching the microphone byaccident, particularly when participants were moving around the meeting room.
6 Extracting Computationally Efficient Video Features
With the increased need for recording and storing video data, many modern dayvideo cameras have hardware to encode the signal at the source. In order to capturevisual activity efficiently, we leverage the fact that meeting videos are already incompressed form so that we can extract visual activity features at a much lowercomputational cost.
These features are generated from compressed-domain information such as mo-tion vectors and block discrete-cosine transform coefficients that are accessible with
42 H. Hung et al.
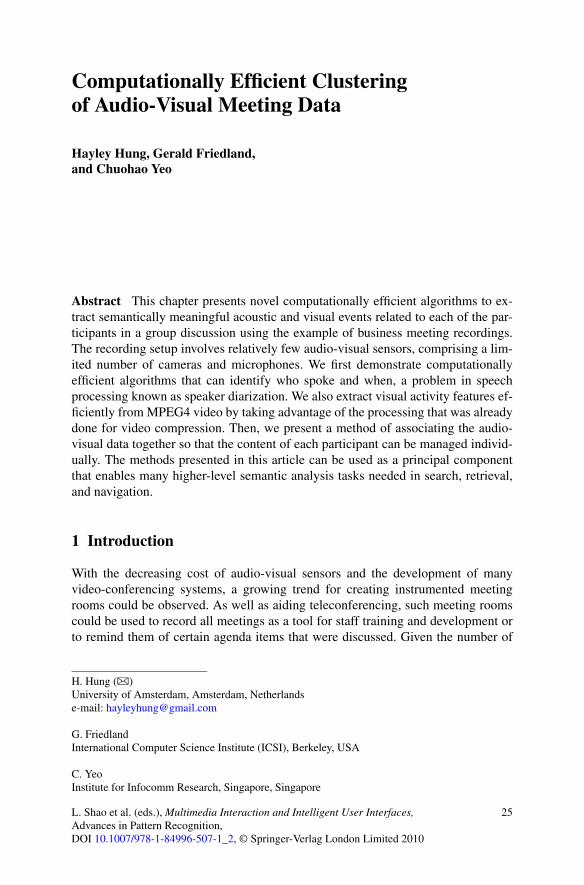
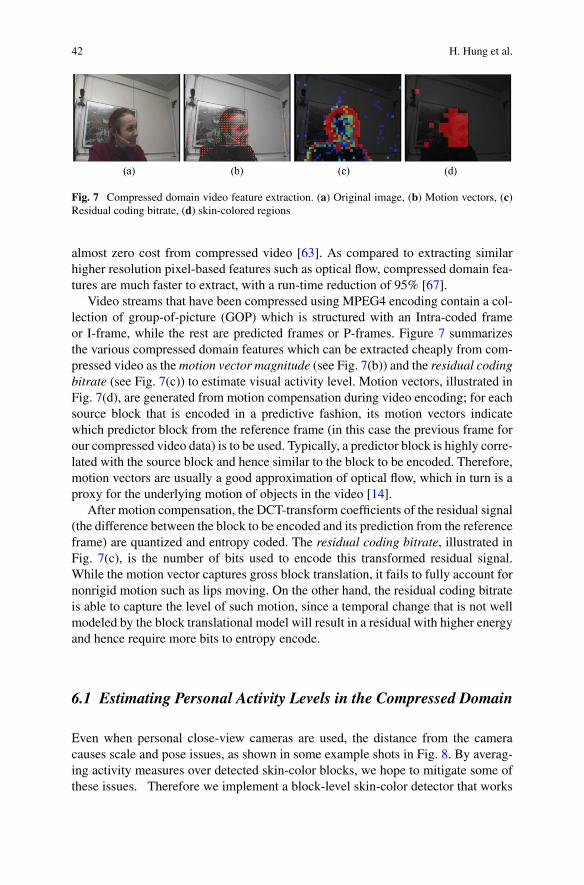
Fig. 7 Compressed domain video feature extraction. (a) Original image, (b) Motion vectors, (c)Residual coding bitrate, (d) skin-colored regions
almost zero cost from compressed video [63]. As compared to extracting similarhigher resolution pixel-based features such as optical flow, compressed domain fea-tures are much faster to extract, with a run-time reduction of 95% [67].
Video streams that have been compressed using MPEG4 encoding contain a col-lection of group-of-picture (GOP) which is structured with an Intra-coded frameor I-frame, while the rest are predicted frames or P-frames. Figure 7 summarizesthe various compressed domain features which can be extracted cheaply from com-pressed video as the motion vector magnitude (see Fig. 7(b)) and the residual codingbitrate (see Fig. 7(c)) to estimate visual activity level. Motion vectors, illustrated inFig. 7(d), are generated from motion compensation during video encoding; for eachsource block that is encoded in a predictive fashion, its motion vectors indicatewhich predictor block from the reference frame (in this case the previous frame forour compressed video data) is to be used. Typically, a predictor block is highly corre-lated with the source block and hence similar to the block to be encoded. Therefore,motion vectors are usually a good approximation of optical flow, which in turn is aproxy for the underlying motion of objects in the video [14].
After motion compensation, the DCT-transform coefficients of the residual signal(the difference between the block to be encoded and its prediction from the referenceframe) are quantized and entropy coded. The residual coding bitrate, illustrated inFig. 7(c), is the number of bits used to encode this transformed residual signal.While the motion vector captures gross block translation, it fails to fully account fornonrigid motion such as lips moving. On the other hand, the residual coding bitrateis able to capture the level of such motion, since a temporal change that is not wellmodeled by the block translational model will result in a residual with higher energyand hence require more bits to entropy encode.
6.1 Estimating Personal Activity Levels in the Compressed Domain
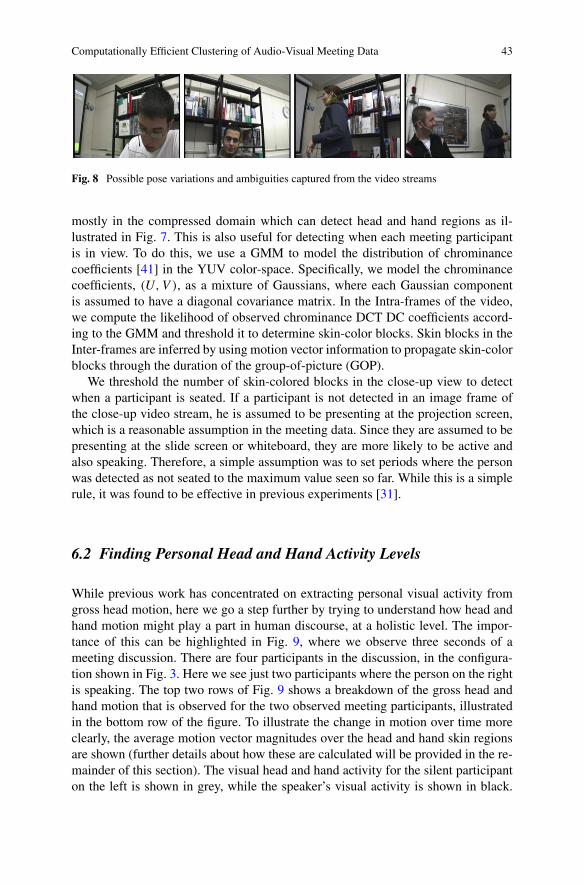
Even when personal close-view cameras are used, the distance from the cameracauses scale and pose issues, as shown in some example shots in Fig. 8. By averag-ing activity measures over detected skin-color blocks, we hope to mitigate some ofthese issues. Therefore we implement a block-level skin-color detector that works
Computationally Efficient Clustering of Audio-Visual Meeting Data 43
Fig. 8 Possible pose variations and ambiguities captured from the video streams
mostly in the compressed domain which can detect head and hand regions as il-lustrated in Fig. 7. This is also useful for detecting when each meeting participantis in view. To do this, we use a GMM to model the distribution of chrominancecoefficients [41] in the YUV color-space. Specifically, we model the chrominancecoefficients, (U,V ), as a mixture of Gaussians, where each Gaussian componentis assumed to have a diagonal covariance matrix. In the Intra-frames of the video,we compute the likelihood of observed chrominance DCT DC coefficients accord-ing to the GMM and threshold it to determine skin-color blocks. Skin blocks in theInter-frames are inferred by using motion vector information to propagate skin-colorblocks through the duration of the group-of-picture (GOP).
We threshold the number of skin-colored blocks in the close-up view to detectwhen a participant is seated. If a participant is not detected in an image frame ofthe close-up video stream, he is assumed to be presenting at the projection screen,which is a reasonable assumption in the meeting data. Since they are assumed to bepresenting at the slide screen or whiteboard, they are more likely to be active andalso speaking. Therefore, a simple assumption was to set periods where the personwas detected as not seated to the maximum value seen so far. While this is a simplerule, it was found to be effective in previous experiments [31].
6.2 Finding Personal Head and Hand Activity Levels
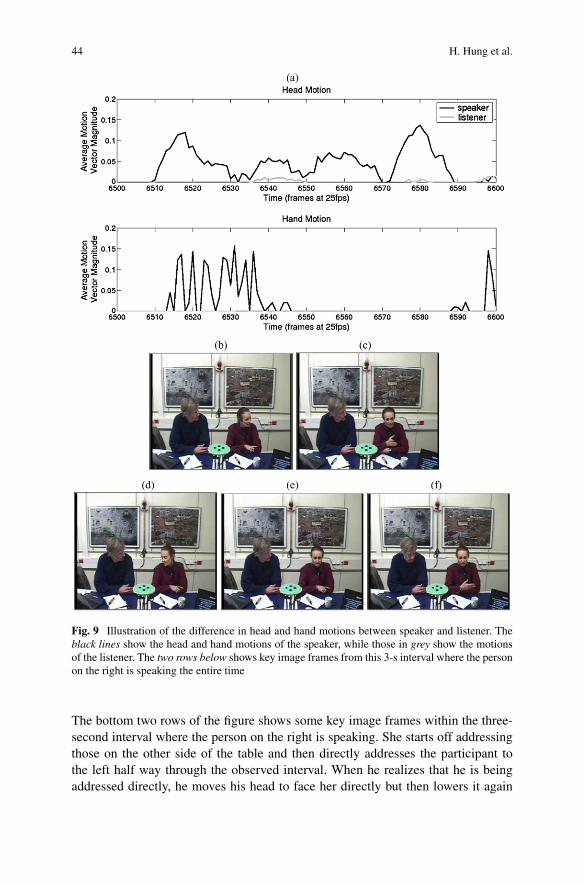
While previous work has concentrated on extracting personal visual activity fromgross head motion, here we go a step further by trying to understand how head andhand motion might play a part in human discourse, at a holistic level. The impor-tance of this can be highlighted in Fig. 9, where we observe three seconds of ameeting discussion. There are four participants in the discussion, in the configura-tion shown in Fig. 3. Here we see just two participants where the person on the rightis speaking. The top two rows of Fig. 9 shows a breakdown of the gross head andhand motion that is observed for the two observed meeting participants, illustratedin the bottom row of the figure. To illustrate the change in motion over time moreclearly, the average motion vector magnitudes over the head and hand skin regionsare shown (further details about how these are calculated will be provided in the re-mainder of this section). The visual head and hand activity for the silent participanton the left is shown in grey, while the speaker’s visual activity is shown in black.
44 H. Hung et al.
Fig. 9 Illustration of the difference in head and hand motions between speaker and listener. Theblack lines show the head and hand motions of the speaker, while those in grey show the motionsof the listener. The two rows below shows key image frames from this 3-s interval where the personon the right is speaking the entire time
The bottom two rows of the figure shows some key image frames within the three-second interval where the person on the right is speaking. She starts off addressingthose on the other side of the table and then directly addresses the participant tothe left half way through the observed interval. When he realizes that he is beingaddressed directly, he moves his head to face her directly but then lowers it again
Computationally Efficient Clustering of Audio-Visual Meeting Data 45
when attention is shifted away from him. In terms of hand motion, we see that thespeaker is the only person of the two that moves during this interval. Note that inthis paper, we describe head motion to be observed from skin-color regions, whichcaptures visual activity inside the face as well as some translations and deformationsof the face region.
The example in Fig. 9 shows that a speaker and an attentive listener can havevery different behavior types if we simply observe the head and hand motions sepa-rately. It is also interesting to observe that partial occlusion of one of the hands doesnot affect the discrimination between the roles of these two meeting participants. Ofcourse, the data is not always as clean and depends on how involved the participantswere. Note also that the motion vector magnitudes were shown for illustrative pur-poses only; in our experiments, we use the residual coding bitrate, which we foundto produce better results since it tends to smooth out large and fast variations in thevisual activity, and can also detect small motions from the lips if they are visible.
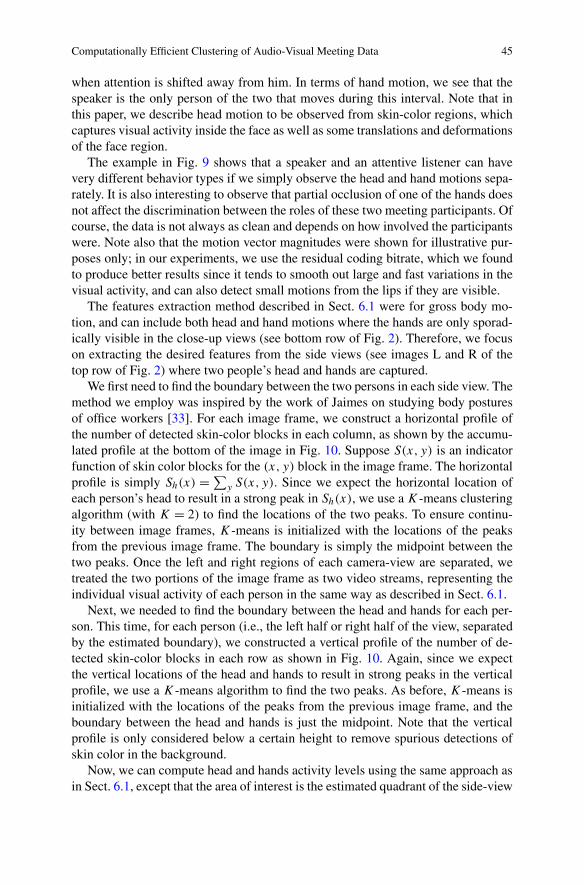
The features extraction method described in Sect. 6.1 were for gross body mo-tion, and can include both head and hand motions where the hands are only sporad-ically visible in the close-up views (see bottom row of Fig. 2). Therefore, we focuson extracting the desired features from the side views (see images L and R of thetop row of Fig. 2) where two people’s head and hands are captured.
We first need to find the boundary between the two persons in each side view. Themethod we employ was inspired by the work of Jaimes on studying body posturesof office workers [33]. For each image frame, we construct a horizontal profile ofthe number of detected skin-color blocks in each column, as shown by the accumu-lated profile at the bottom of the image in Fig. 10. Suppose S(x, y) is an indicatorfunction of skin color blocks for the (x, y) block in the image frame. The horizontalprofile is simply Sh(x) = ∑
y S(x, y). Since we expect the horizontal location ofeach person’s head to result in a strong peak in Sh(x), we use a K-means clusteringalgorithm (with K = 2) to find the locations of the two peaks. To ensure continu-ity between image frames, K-means is initialized with the locations of the peaksfrom the previous image frame. The boundary is simply the midpoint between thetwo peaks. Once the left and right regions of each camera-view are separated, wetreated the two portions of the image frame as two video streams, representing theindividual visual activity of each person in the same way as described in Sect. 6.1.
Next, we needed to find the boundary between the head and hands for each per-son. This time, for each person (i.e., the left half or right half of the view, separatedby the estimated boundary), we constructed a vertical profile of the number of de-tected skin-color blocks in each row as shown in Fig. 10. Again, since we expectthe vertical locations of the head and hands to result in strong peaks in the verticalprofile, we use a K-means algorithm to find the two peaks. As before, K-means isinitialized with the locations of the peaks from the previous image frame, and theboundary between the head and hands is just the midpoint. Note that the verticalprofile is only considered below a certain height to remove spurious detections ofskin color in the background.
Now, we can compute head and hands activity levels using the same approach asin Sect. 6.1, except that the area of interest is the estimated quadrant of the side-view

46 H. Hung et al.
Fig. 10 Example of the horizontal and vertical profiles of the skin blocks and the located bound-aries between the two people and their respective head and hand regions. The accumulated horizon-tal of the skin-color blocks is shown at the bottom of the example snap-shot. The vertical profilesof the skin-color blocks for each corresponding person are shown to the left and right of the imageframe. The detected skin color regions are highlighted in red, and the estimated boundaries usingthe horizontal and vertical profiles are shown in green
that contains the subject of interest, i.e., left person’s head, left person’s hands, rightperson’s head, and right person’s hands.
We evaluated the boundary estimation described above on one meeting session,where bounding boxes of speakers’ heads had been annotated. The error rate offinding the boundary between two persons was 0.4%, where an error is defined as theestimated boundary not cleanly separating the bounding boxes of the two persons.The error rate of finding the boundary between the head and hands is 0.5%, wherethe error is defined as the estimated boundary not being below the head boundingboxes of the respective person. We found that errors occurred mostly when the handstouched the face or moved above the shoulders or when a person reached acrossthe table to their neighbor’s table area. From this two-camera setup, four differentpersonal activity features were generated; head activity; hand activity; the averageactivity of the head and hand blobs; and the maximum of the average head andaverage hand motion after the features were normalized.
6.3 Estimating Speakers Using Video Only
From previous experiments, we have found that speech and the visual activity ofthe speaker are better correlated over long-term intervals [31, 32]. We know thatpeople who move are not necessarily talking, but we know that people who talk willtend to move. This is further illustrated by the distributions in Fig. 11(a) where we
Computationally Efficient Clustering of Audio-Visual Meeting Data 47
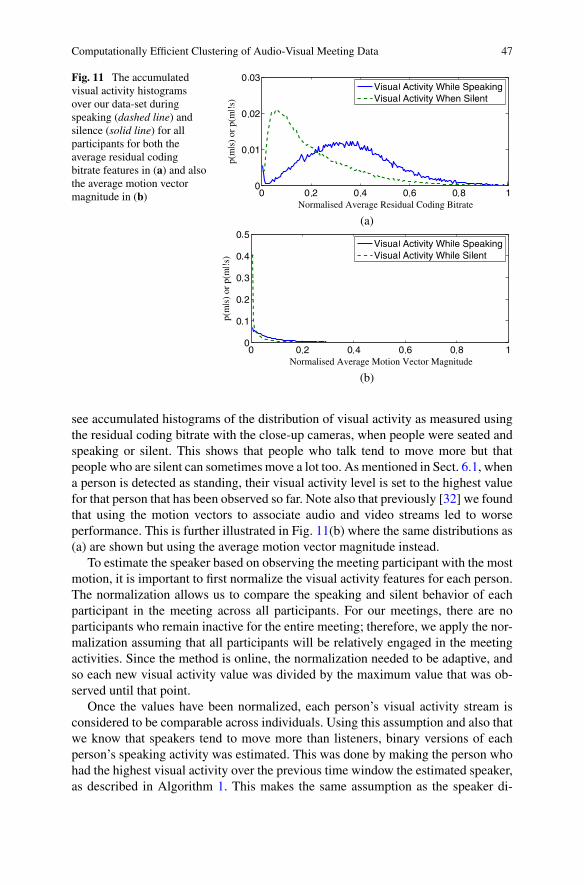
Fig. 11 The accumulatedvisual activity histogramsover our data-set duringspeaking (dashed line) andsilence (solid line) for allparticipants for both theaverage residual codingbitrate features in (a) and alsothe average motion vectormagnitude in (b)
see accumulated histograms of the distribution of visual activity as measured usingthe residual coding bitrate with the close-up cameras, when people were seated andspeaking or silent. This shows that people who talk tend to move more but thatpeople who are silent can sometimes move a lot too. As mentioned in Sect. 6.1, whena person is detected as standing, their visual activity level is set to the highest valuefor that person that has been observed so far. Note also that previously [32] we foundthat using the motion vectors to associate audio and video streams led to worseperformance. This is further illustrated in Fig. 11(b) where the same distributions as(a) are shown but using the average motion vector magnitude instead.
To estimate the speaker based on observing the meeting participant with the mostmotion, it is important to first normalize the visual activity features for each person.The normalization allows us to compare the speaking and silent behavior of eachparticipant in the meeting across all participants. For our meetings, there are noparticipants who remain inactive for the entire meeting; therefore, we apply the nor-malization assuming that all participants will be relatively engaged in the meetingactivities. Since the method is online, the normalization needed to be adaptive, andso each new visual activity value was divided by the maximum value that was ob-served until that point.
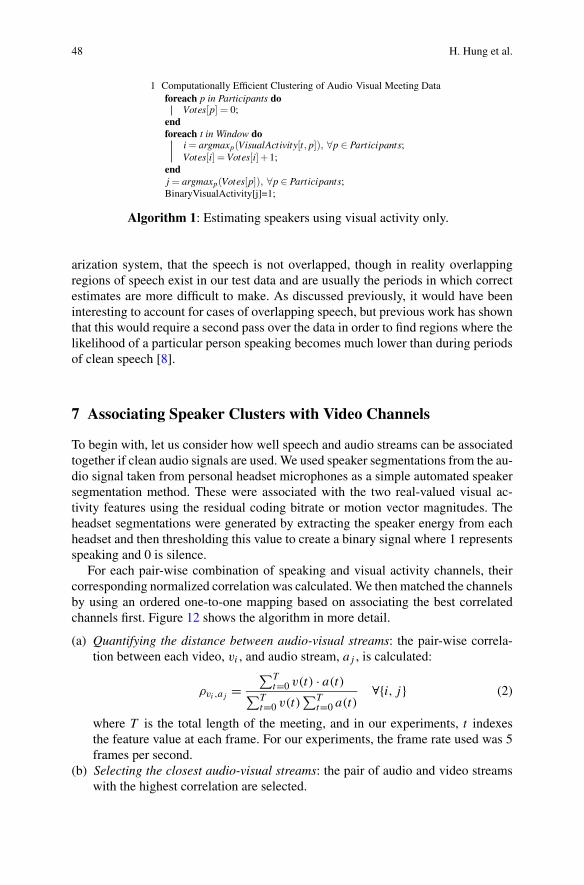
Once the values have been normalized, each person’s visual activity stream isconsidered to be comparable across individuals. Using this assumption and also thatwe know that speakers tend to move more than listeners, binary versions of eachperson’s speaking activity was estimated. This was done by making the person whohad the highest visual activity over the previous time window the estimated speaker,as described in Algorithm 1. This makes the same assumption as the speaker di-
48 H. Hung et al.
Algorithm 1: Estimating speakers using visual activity only.
arization system, that the speech is not overlapped, though in reality overlappingregions of speech exist in our test data and are usually the periods in which correctestimates are more difficult to make. As discussed previously, it would have beeninteresting to account for cases of overlapping speech, but previous work has shownthat this would require a second pass over the data in order to find regions where thelikelihood of a particular person speaking becomes much lower than during periodsof clean speech [8].
7 Associating Speaker Clusters with Video Channels
To begin with, let us consider how well speech and audio streams can be associatedtogether if clean audio signals are used. We used speaker segmentations from the au-dio signal taken from personal headset microphones as a simple automated speakersegmentation method. These were associated with the two real-valued visual ac-tivity features using the residual coding bitrate or motion vector magnitudes. Theheadset segmentations were generated by extracting the speaker energy from eachheadset and then thresholding this value to create a binary signal where 1 representsspeaking and 0 is silence.
For each pair-wise combination of speaking and visual activity channels, theircorresponding normalized correlation was calculated. We then matched the channelsby using an ordered one-to-one mapping based on associating the best correlatedchannels first. Figure 12 shows the algorithm in more detail.
(a) Quantifying the distance between audio-visual streams: the pair-wise correla-tion between each video, vi , and audio stream, aj , is calculated:
ρvi,aj=
∑Tt=0 v(t) · a(t)
∑Tt=0 v(t)
∑Tt=0 a(t)
∀{i, j} (2)
where T is the total length of the meeting, and in our experiments, t indexesthe feature value at each frame. For our experiments, the frame rate used was 5frames per second.
(b) Selecting the closest audio-visual streams: the pair of audio and video streamswith the highest correlation are selected.

Computationally Efficient Clustering of Audio-Visual Meeting Data 49
Fig. 12 Greedy Algorithm for ordered and discriminative pairwise associations between audioand video streams. (i) All pairwise combinations of the audio and video streams are correlated.(ii) The pair with the highest correlation is associated first and then eliminated from the correlationmatrix
Table 2 Proportion of correctly associated meetings using speech segmentations generated fromindividual headset microphones that were then associated with visqual activity from the close-view cameras. EvH: Hard evaluation strategy where all audio-visual streams in the meeting mustbe associated correctly; EvM Medium evaluation strategy where at least two of the audio-visualstreams in the meeting must be associated correctly; EvS Soft evaluation strategy where at leastone of the audio-visual streams in the meeting must be associated correctly
EvS EvM EvH
Residue 1.00 1.00 0.90
Vector 1.00 0.95 0.81
(c) Selection of the next closest audio-visual streams: the next best correlated pairof audio and video streams is selected.
(d) Full assignment of audio and video streams: step (c) is repeated until all audio-visual streams are associated.
Since the association is performed on a meeting basis, it is important to evaluatethe performance similarly. Three evaluation criteria are used to observe the diffi-culty in associating more channels correctly in each meeting. Hard (EvH), medium(EvM), and soft (EvS) criteria are used that assign respectively a score of 1 for eachmeeting only when all, at least two, or at least one of the pairs of associated au-dio and visual streams is correct for each meeting. We refrain from evaluating ona participant basis since the meeting-based ordered mapping procedure, by defini-tion, discriminates pairs that are easier to distinguish, as a means of improving theassociation from noisier channels which may have less observable activity.
The proportion of correctly associated meetings using both visual activity featuretypes are shown in Table 2. Correlating the headset segmentations and Residue vi-sual activity channels performed best. Also, it was also encouraging to see that evenfor the hard evaluation strategy, the performance remained high for this case.

50 H. Hung et al.
For the online association method, the association method described above wasmodified so that after all streams were associated within a 2-s sliding window. Then,only the person who spoke for the longest time was assigned their associated videostream for that window.
8 Audio-Visual Clustering Results
Speaker localization experiments were run on the same meeting data that was usedin the previous section. The outputs from the online speaker diarization were usedas a reference to determine which video stream contained the relevant speaker. Asdescribed in Sect. 6, the visual activity of each individual could be represented by anumber of features. These are summarized in Table 3. In addition, a binary featurecan be derived from each of these using the method described in Sect. 6.3.
For the 4-camera and 2-camera case, the location of each stream was known soevaluation was straightforward. For the 2-camera case, it was assumed that eachhalf of the frame would be treated as a single stream, leading to four possible videocandidates. An analysis window of 2 s was used with a 40-ms shift.
8.1 Using Raw Visual Activity
As an initial extension to the method presented in the previous subsection, we ap-plied the online association algorithm to the real-valued average residual codingbitrate in the five video forms described in Table 3. The results are summarized inTable 4, where evaluation was done using the same scoring as for the online diariza-tion. Rather than comparing the speaker reference with the speaker clusters, whichwas done for the speaker diarization evaluation, we compare the speaker referencewith the estimated video stream labels. For clarity, we refer to this measure as theassociation error rate (AER), but the mechanics of the performance measure are thesame as the DER. We see that the error is quite high in all cases but note that theresults are still better than random, where the error would be closer to 80% since theassociated video could be one of the four participants or none of them. Comparingthe performance more carefully across the different input audio conditions, we seethat there is again a slight improvement in performance when the mixed headsetsignal is used rather than the far-field microphone. Comparing across the differentvideo features that were tried, using the mean residual coding bitrate for the esti-mated hand regions from the 2-camera set-up for each person gave the best results,but there was not a significant difference between the best and worse average results.
Table 3 Summary of video features that were used
4 close-up cameras Head Close-up
2 mid-view cameras Head+Hands Head Hands Max(Head,Hands)

Computationally Efficient Clustering of Audio-Visual Meeting Data 51
Table 4 Audio-visual speaker localization with the real-valued average residual coding bitrate foreach person, using the different video feature methods. The signal-to-noise ratio for each audiotype is shown in brackets for each input audio source. The results show the average AER over allthe meetings for each experimental condition, where the bracketed number shows the lowest AERthat was achieved
Input videomethods
Input audio conditions
F (21 dB) ML (22 dB) MH (31 dB)
AER (%) (Min) AER (%) (Min) AER (%) (Min)
Head(Closeup) 68.39 (64.92) 68.42 (65.45) 68.04 (64.82)
Max(Head,Hands) 68.05 (62.75) 67.91 (62.09) 68 (60.62)
Heads 68.1 (64.25) 67.84 (63.79) 67.98 (63.03)
Head+Hands 67.67 (61.54) 67.58 (61.87) 67.54 (61.31)
Hands 67.92 (61.41) 67.65 (61.29) 67.64 (61.13)
8.2 Using Estimates of Speaking Activity from Video
We then conducted similar experiments with each video feature type replaced byits binarized version using the method described in Sect. 6.3. These binarized videostreams were then associated with the relevant audio stream as described in Sect. 7.The results are summarized in terms of AER again in Table 5. Here we see a signif-icant increase in performance when these binarized visual activity values are used.This indicates that our hypothesis that people who talk tend to move more is quitesuccessful at finding speakers from video only. Overall, the best speaker and videoassociation performance was observed when the motion from the close-up cameraswas used. This is not surprising since the head is represented at a higher resolutionand therefore lip motion is better captured. It is encouraging to see that even whenusing the 2-camera set-up, where the size of the heads was about half of those in theclose-view cameras, the performance is slightly worse but still comparable. Of the2-camera features, the one using head activity alone gave the best average perfor-mance, but the best performance for any session used the Max(Head,Hands) feature.This indicates that hand motion can still be effective for discriminating speakersfrom listeners and is complementary to head motion. The worse average AER ofthe Max(Head,Hands) case compared to the Heads is likely to be due to how muchbody motion was attributed to meeting activities such as using a laptop, writing, ormanipulating the remote control prototype they were designing.
Since the AER is not a widely used performance measure, in multimodal pro-cessing tasks, we also provide the average precision, recall, and F-measure whenusing the far-field microphone and binary estimates of speaking activity in Table 6.Here the boldened values show the best achieved performance for a single meet-ing, while the number on the left shows the average. Using these measures, similardifferences in performance are observed, although here, using the maximum of thehead and hand motion appears to give the best overall performance for the 2-cameracase. Again, the 4-camera case performs the best. It is also interesting to observethat the head-only and the Max(Head,Hands) features perform similarly, while the

52 H. Hung et al.
Table 5 Audio-visual speaker localization results using binary estimates of speaking status fromeach person’s visual activity. The signal-to-noise ratio for each audio type is shown in brackets foreach input audio source. The results show the average AER for each experimental condition, andthe accompanying bracketed number shows the minimum AER that was achieved from one of the12 sessions that were used
Input videomethods
Input audio conditions
F (21 dB) ML (22 dB) MH (31 dB)
AER (%) (Min) AER (%) (Min) AER (%) (Min)
Head(Close-up) 41.89 (20.19) 41.91 (19.71) 41.55 (19.71)
Max(Head,Hands) 42.38 (22.24) 42.82 (22.37) 42.83 (22.39)
Heads 42.3 (26.27) 42.75 (26.42) 42.62 (26.4)
Head+Hands 46 (33.3) 46.83 (33.41) 46.24 (33.31)
Hands 53.83 (34.48) 54.79 (34.55) 54.18 (34.67)
Table 6 Summary of the average precision, recall, and F-measure for the different video featuretypes. Results for using the far-field microphone are shown and the binary estimates of speakingstatus from visual activity. For each video feature, the highest performance is shown boldened
Input video methods Prec. Recall F-meas.
Head(Close-up) 52.74 72.93 41.64 62.53 44.72 66.18
Max(Heads,Hands) 50.64 68.62 41.58 62.26 43.59 63.1
Head 51.01 66.41 41.95 58.18 43.93 60.2
Head+Hands 39.63 56.51 34.17 54.21 34.68 49.44
Hands 37.17 56.91 31.33 48.12 31.64 43.28
Head+Hands and hands-only features perform similarly badly compared to the rest.This indicates that for both listeners and speakers, observing head motion is morediscriminative in most situations. However, the success of the feature which takesthe maximum of the head and hand motion indicates that the head and hand featuresshould be treated independently since they are complementary.
From the results we have presented, it seems that using the binary estimates ofspeaking activity from video is effective. However, the performance is not as highas estimating speakers from the audio alone. We can observe the locations of failuremodes by looking more closely at an example meeting, which is shown in Fig. 13.Here the binary segmentations of the estimated speaker are shown using the as-sociation method described in Sect. 7 (first row); the binary estimates of speakingactivity from video (second row); and the speaker clusters generated from the on-line speaker diarization algorithm (third row). The final row shows the ground truthspeaker segmentations. We can see that there are occasions (e.g., between 150–200 s and 600–700 s) when the binary estimates of speaking activity fail since theperson who moves the most is not talking. This is not surprising since there is still aconsiderable overlap observed in the speaker and listener activity shown in Fig. 11previously. Furthermore, we observed that there are occasions where nonspeakers

Computationally Efficient Clustering of Audio-Visual Meeting Data 53
Fig. 13 Graphical comparison of different feature representations and estimates. White areas in-dicate either that someone is speaking. The first row shows the estimated associated video stream,given the diarized speaker clusters in the third row; the second row shows the estimate of speakerstatus from just the motion activity taken from the maximum of the head and hand motion; and thefinal row shows the ground-truth speaker segmentations
were involved in other activities while someone was speaking (e.g., working on alaptop). However, there are also observed cases where speaker diarization fails andthe speaker estimates from video was successful (between 350–450 s). The failurein the speaker diarization could be caused by speaker models being confused dueto either short utterances or because the speaker models were only generated from60 s of speech for each speaker in the training phase. This example of complemen-tary failure modes suggests that combining the audio and video features at an earlierstage may also improve the speaker diarization performance.
9 Discussion
In this chapter, we have discussed offline systems which can be used for post-processing of previously recorded data. However, audio-visual mining of the datacould also happen in real-time. A system that can work online and in real-time isuseful for remote meeting scenarios where subtle information about an interactioncan be lost through transmission. These could relate to transmission failure of oneor more modalities but could also be due to the inherent time delay between send-ing and receiving data. In terms of more complex immersion problems within theremote meeting scenario, it is also difficult for remote participants to know whento interrupt in a conversation or judge the mood or atmosphere of the group they
54 H. Hung et al.
are interacting with. For colocated meetings, live-recording and summary may beuseful for a quick recap if someone missed what was said (e.g., a phone call inter-ruption) but does not want to interrupt the conversation flow in order to catch upon information they missed. Aside from this, live processing also aids post-meetingbrowsing since a live capability could be used to enable live tagging of automati-cally segmented events such as how an issue on the agenda was received by othermeeting participants. Of course, some of the tags could be substituted by automatedevent identification methods, but when certain technologies are not available, tag-ging is an extremely useful way of labeling information. In particular, tagging hasbeen used extensively for mining image data with the emergence of social network-ing sites where photos are organized amongst self-organized groups. It has beendemonstrated that imagery data itself need not be used for mining the data if tagsare available [44].
Moving away from the online and real-time problems, there are other ways inwhich the performance of the speaker diarization and audio-visual association taskcan be improved. In particular, while the approach presented in this chapter demon-strated a late fusion approach, given that we know that speech and body motion itcorrelated, there is also motivation to make the task into a speaker diarization andlocalization task by fusing the modalities early on in the clustering process. This isparticularly interesting since clustering video data alone into speakers tends to re-quire a priori knowledge of the number or participants. Of course, techniques suchas face detection can be employed to identify the speakers, but this may not bepractical if the resolution of faces is in the video and nonfrontal faces tend to bedifficult to detect robustly. Research on fusing audio and visual features for speakerdiarization or speaker localization as discussed in Sect. 2 has shown an improve-ment in performance over single-modality methods. However most work performsexperiments on data where two talking heads are visible and remain relatively sta-tionary with fully frontal faces. Few consider more global body movements [10, 31,32, 59, 60]. Vajaria et al. [59, 60] was one of the first to use gross body movementfor speaker diarization and localization but suffer from the need to cluster spatiallyseparated noisy visual features. Recently some preliminary success by using just asingle camera and microphone [23] to perform speaker diarization where the audioand visual features are fused early on in the agglomerative clustering process. Re-sults for the speaker diarization task show improvement, despite the low resolutionof each participant in the captured video. In both cases, the correlation of speechand motion from different body parts was not considered for the diarization task.Also, finding a suitable way to evaluate the locations of speakers in the video in asimilar way to the diarization performance is yet to be found.
With the success of multimodal speaker diarization methods, it is clear that thetrend is moving toward using multiple sensors and multiple modalities to solvedata-mining problems, certainly in the domain of meeting analysis. The importanceof multimodal data mining when capturing human behavior is further emphasizedsince psychologically, both modalities are used differently when we communicatesocially and communicate very different messages. It is sometimes these differencesand in particular unusual events which trigger memories for us about a particular
Computationally Efficient Clustering of Audio-Visual Meeting Data 55
conversation. It could be said that these are the events which are the most difficult tofind again once they have been archived. This brings us to the application of estimat-ing dominance, which was demonstrated at the end of this chapter. It showed thateven with computationally efficient methods for clustering the data where the esti-mates of the raw outputs was degraded, the performance of the semantically higherlevel dominance task was not necessarily affected. This addresses some interestingquestions about how the problem of the semantic gap should be addressed in datamining. From a cognitive perspective, perhaps we would expect that the verbal con-tent of each speaker would need to be analyzed. However, experiments have shownthat using speaking time alone is quite robust, even if the estimates of the speakerturns are not as accurate. Given these results, one might ask the question of whetherother semantically high-level behavioral types or affiliations can be characterizedusing equally simple features such as the excitement levels in a meeting [65], roles[68], or personality [52].
Ultimately, one could argue that to address the semantic gap in mining meet-ing data, we must start from the questions we ask ourselves when trying to searchthrough meeting data such as in terms of what happened, what were the conclusions,and how people interacted with each other. From a functional perspective, knowingthe meeting agenda and the final outcomes are useful, but from a social perspectiveknowing about the subtle nonverbal behavior tells us more about relationships be-tween colleagues or clients. For example, knowing how a person usually behavescan help us to detect unusual behavior, which could be indications of stress, if, forexample, the person has been delegated too much work. These are ultimately usefultools to ensure that teams in organizations work effectively and that staff are notoverworked or under-utilized. From an individual perspective, there are those thatargue that success is well correlated with “emotional intelligence” which is definedas the ability to monitor both one’s own and the other’s feelings and emotions in or-der to guide one’s thinking and actions [51]. Automatically estimating the feelingsand emotions of others are topics of interest currently [7, 65]. In particular, recentwork on distinguishing real from fake facial expressions of pain has shown thatautomated systems perform significantly better than human observers [7]. Such re-search shows the potential of using machines to help us understand how we interactand in particular how this could potentially be used to help individuals in becomingmore aware of social interactions around them. Ultimately, such knowledge shouldlead to more efficient team-working where perhaps the easiest failure mode in teamsoccurs through a break-down in communication between members.
Acknowledgements This research was partly funded by the US VACE program, the EU projectAMIDA (pub. AMIDA-103), the Swiss NCCR IM2, and the Institute for Infocomm Research,Singapore.
References
1. Ajmera, J., Wooters, C.: A robust speaker clustering algorithm. In: Proc. IEEE AutomaticSpeech Recognition Understanding Workshop (2003)

56 H. Hung et al.
2. Al-Hames, M., Dielmann, A., Gatica-Perez, D., Reiter, S., Renals, S., Rigoll, G., Zhang,D.: Multimodal integration for meeting group action segmentation and recognition. In: Proc.Multimodal Interaction and Related Machine Learning Algorithms Workshop (MLMI–05),pp. 52–63. Springer, Berlin (2006)
3. Anguera, X.: Robust speaker diarization for meetings. PhD thesis, Technical University ofCatalonia, Barcelona, Spain, December 2006
4. Anguera, X., Peskin, B., Aguilo, M.: Robust speaker segmentation for meetings: the ICSI-SRIspring 2005 diarization system. In: Proc. of NIST MLMI Meeting Recognition Workshop,Edinburgh (2005)
5. Armstrong, D.F., Stokoe, W.C., Wilcox, S.: What is gesture? In: Gesture and the Nature ofLanguage pp. 40–41. Cambridge University Press, Cambridge (1995)
6. Bales, R.F.: Interaction Process Analysis: A Method for the Study of Small Groups. Addison-Wesley, Cambridge (1950)
7. Bartlett, M., Littlewort, G., Vural, E., Lee, K., Cetin, M., Ercil, A., Movellan, J.: Data min-ing spontaneous facial behavior with automatic expression coding. In: Verbal and NonverbalFeatures of Human–Human and Human–Machine Interaction, pp. 1–20 (2008)
8. Boakye, K., Trueba-Hornero, B., Vinyals, O., Friedland, G.: Overlapped speech detection forimproved speaker diarization in multiparty meetings. In: IEEE International Conference onAcoustics, Speech and Signal Processing (ICASSP), pp. 4353–4356 (2008)
9. Campbell, J.P.: Speaker recognition: a tutorial. In: Proceedings of the IEEE, pp. 1437–1462(1997)
10. Campbell, N., Suzuki, N.: Working with very sparse data to detect speaker and listener partic-ipation in a meetings corpus. In: Workshop Programme, vol. 10, May 2006
11. Carletta, J.C., Ashby, S., Bourban, S., Flynn, M., Guillemot, M., Hain, T., Kadlec, J.,Karaiskos, V., Kraiij, W., Kronenthal, M., Lathoud, G., Lincoln, M., Lisowska, A., McCowan,M., Post, W., Reidsma, D., Wellner, P.: The AMI meeting corpus: a pre-announcement. In:Joint Workshop on Machine Learning and Multimodal Interaction (MLMI) (2005)
12. Chen, S., Gopalakrishnan, P.: Speaker, environment and channel change detection and clus-tering via the Bayesian information criterion. In: Proceedings of DARPA Speech RecognitionWorkshop (1998)
13. Chen, T., Rao, R.R.: Cross-modal prediction in audio-visual communication. In: InternationalConference on Acoustics, Speech and Signal Processing (ICASSP), vol. 4, pp. 2056–2059(1996)
14. Coimbra, M.T., Davies, M.: Approximating optical flow within the MPEG-2 compressed do-main. IEEE Trans. Circuits Syst. Video Technol. 15(1), 103–107 (2005)
15. Condon, W.S., Ogston, W.D.: Sound film analysis of normal and pathological behavior pat-terns. J. Nerv. Ment. Dis. 143(4), 338 (1966)
16. Condon, W.S., Osgton, W.D.: Speech and body motion synchrony of the speaker–hearer. In:The Perception of Language, pp. 150–184 (1971)
17. DABBS, J.M.J.R., Ruback, R.B.: Dimensions of group process: amount and structure of vocalinteraction. Adv. Exp. Soc. Psychol. 20, 123–169 (1987)
18. Delacourt, P., Wellekens, C.J.: Distbic: a speaker-based segmentation for audio data index-ing. In: Speech Communication: Special Issue in Accessing Information in Spoken Audio,pp. 111–126 (2000)
19. Dovidio, J.F., Ellyson, S.L.: Decoding visual dominance: attributions of power based on rel-ative percentages of looking while speaking and looking while listening. Soc. Psychol. Q.45(2), 106–113 (1982)
20. Favre, S., Salamin, H., Dines, J., Vinciarelli, A.: Role recognition in multiparty recordingsusing social affiliation networks and discrete distributions. In: IMCI ’08: Proceedings of the10th International Conference on Multimodal Interfaces, pp. 29–36. ACM, New York (2008)
21. Fisher, J.W., Darrell, T.: Speaker association with signal-level audiovisual fusion. IEEE Trans.Multimed. 6(3), 406–413 (2004)
22. Fisher, J.W., Darrell, T., Freeman, W.T., Viola, P.A.: Learning joint statistical models foraudio-visual fusion and segregation. In: Conference on Neural Information Processing Sys-tems (NIPS), pp. 772–778 (2000)

Computationally Efficient Clustering of Audio-Visual Meeting Data 57
23. Friedland, G., Hung, H., Yeo, C.: Multi-modal speaker diarization of real-world meetingsusing compressed-domain video features. In: Proceedings of IEEE ICASSP, April 2009
24. Friedland, G., Vinyals, O., Huang, Y., Mueller, C.: Prosodic and other long-term features forspeaker diarization. Trans. Audio Speech Lang. Process. 17 (2009)
25. Gatewood, J.B., Rosenwein, R.: Interactional synchrony: genuine or spurious? A critique ofrecent research. J. Nonverbal Behav. 6(1), 12–29 (1981)
26. Gish, H., Schmidt, M.: Text-independent speaker identification. IEEE Signal Process. Mag.18–32 (1994)
27. Hadar, U., Steiner, T.J., Clifford Rose, F.: Head movement during listening turns in conversa-tion. J. Nonverbal Behav. 9(4), 214–228 (1985)
28. Hadar, U., Steiner, T.J., Grant, E.C., Clifford Rose, F.: The timing of shifts of head posturesduring conversation. Hum. Mov. Sci. 3, 237–245 (1984)
29. Hain, T., Burget, L., Dines, J., Garau, G., Karafiat, M., van Leeuwen, D., Lincoln, M., Wan, V.:The 2007 AMI(DA) system for meeting transcription. In: Multimodal Technologies for Per-ception of Humans. Lecture Notes in Computer Science, vol. 4625, pp. 414–428. Springer,Berlin (2008). International Evaluation Workshops CLEAR 2007 and RT 2007, Baltimore,MD, USA, May 8–11, 2007, Revised Selected Papers
30. Harrigan, J.A.: Listener’s body movements and speaking turns. Commun. Res. 12, 233–250(1985)
31. Hung, H., Friedland, G.: Towards audio-visual on-line diarization of participants in groupmeetings. In: Workshop on Multi-Camera and Multi-Modal Sensor Fusion Algorithms andApplications in Conjunction with ECCV, Marseille, France, October 2008
32. Hung, H., Huang, Y., Yeo, C., Gatica-Perez, D.: Associating audio-visual activity cues in adominance estimation framework. In: IEEE Computer Society Conference on Computer Vi-sion and Pattern Recognition Workshop on Human Communicative Behavior, Alaska (2008)
33. Jaimes, A.: Posture and activity silhouettes for self-reporting, interruption management, andattentive interfaces. In: International Conference on Intelligent User Interfaces, pp. 24–31.ACM, New York (2006)
34. Jayagopi, D.B., Ba, S.O., Odobez, J.-M., Gatica-Perez, D.: Predicting two facets of socialverticality in meetings from five-minute time slices and nonverbal cues. In: Proceedings ICMI(2008)
35. Jayagopi, D.B., Hung, H., Yeo, C., Gatica-Perez, D.: Modeling dominance in group conversa-tions using nonverbal activity cues. IEEE Trans. Audio Speech Lang. Process. (2008)
36. Juang, B., Rabiner, L.: A probabilistic distance measure for hidden Markov models (1985)37. Kendon, A.: Conducting Interaction: Patterns of Behavior in Focused Encounters. Cambridge
University Press, Cambridge (1990)38. Kendon, A.: Some considerations for a theory of language origins. Man, New Ser. 26(2), 199–
221 (1991)39. Kim, H.-G., Sikora, T.: Hybrid speaker-based segmentation system using model-level clus-
tering. In: Proceedings of the IEEE International Conference on Audio and Speech SignalProcessing (2005)
40. McCowan, L., Gatica-Perez, D., Bengio, S., Lathoud, G., Barnard, M., Zhang, D.: Automaticanalysis of multimodal group actions in meetings. IEEE Trans. Pattern Anal. Mach. Intell.27(3), 305–317 (2005)
41. McKenna, S.J., Gong, S., Raja, Y.: Modelling facial colour and identity with Gaussian mix-tures. Pattern Recognit. 31(12), 1883–1892 (1998)
42. McNeill, D.: Hand and Mind. What Gestures Reveal About Thought. University of ChicagoPress, Chicago (1992)
43. McNeill, D.: Language and Gesture. Cambridge University Press, New York (2000)44. Negoescu, R.-A., Gatica-Perez, D.: Topickr: Flickr groups and users reloaded. In: MM ’08:
Proc. of the 16th ACM International Conference on Multimedia, Vancouver, Canada, October2008. ACM, New York (2008)
45. Ning, H., Liu, M., Tang, H., Huang, T.: A spectral clustering approach to speaker diariza-tion In: The Ninth International Conference on Spoken Language Processing, Proceedings ofInterspeech (2006)

58 H. Hung et al.
46. Nock, H.J., Iyengar, G., Neti, C.: Speaker localisation using audio-visual synchrony: an em-pirical study. In: ACM International Conference on Image and Video Retrieval, pp. 488–499(2003)
47. Noulas, A., Krose, B.J.A.: On-line multi-modal speaker diarization. In: International Confer-ence on Multimodal Interfaces, pp. 350–357. ACM, New York (2007)
48. Otsuka, K., Yamato, J., Takemae, Y., Murase, H.: Quantifying interpersonal influence in face-to-face conversations based on visual attention patterns. In: Proc. ACM CHI Extended Ab-stract, Montreal, April 2006
49. Parker, K.C.H.: Speaking turns in small group interaction: a context-sensitive event sequencemodel. J. Pers. Soc. Psychol. 54(6), 965–971 (1988)
50. Patterson, E.K., Gurbuz, S., Tufekci, Z., Gowdy, J.N.: CUAVE: a new audio-visual databasefor multimodal human–computer interface research. In: International Conference on Acous-tics, Speech, and Signal Processing, pp. 2017–2020 (2002)
51. Petrides, K.V., Frederickson, N., Furnham, A.: The role of trait emotional intelligence inacademic performance and deviant behavior at school. Pers. Individ. Differ. 36(2), 277–293(2004)
52. Pianesi, F., Mana, N., Cappelletti, A., Lepri, B., Zancanaro, M.: Multimodal recognition ofpersonality traits in social interactions. In: International Conference on Multimodal interfaces,pp. 53–60. ACM, New York (2008)
53. Rao, R., Chen, T.: Exploiting audio-visual correlation in coding of talking head sequences. In:International Picture Coding Symposium, March 1996
54. Reiter, S., Schuller, B., Rigoll, G.: Hidden conditional random fields for meeting segmenta-tion. In: 2007 IEEE International Conference on Multimedia and Expo, pp. 639–642 (2007)
55. Reynolds, D.A., Torres-Carrasquillo, P.: Approaches and applications of audio diarization. In:Proc. of International Conference on Audio and Speech Signal Processing, 2005
56. Reynolds, D.A.: Speaker identification and verification using Gaussian mixture speaker mod-els. Speech Commun. 17(1–2), 91–108 (1995)
57. Siracusa, M.R., Fisher, J.W.: Dynamic dependency tests for audio-visual speaker association.In: International Conference on Acoustics, Speech and Signal Processing, April 2007
58. Tamura, S., Iwano, K., Furui, S.: Multi-modal speech recognition using optical-flow analysisfor lip images. In: Real World Speech Processing (2004)
59. Vajaria, H., Islam, T., Sarkar, S., Sankar, R., Kasturi, R.: Audio segmentation and speakerlocalization in meeting videos. Proc. Int. Conf. Pattern Recognit. 2, 1150–1153 (2006)
60. Vajaria, H., Sarkar, S., Kasturi, R.: Exploring co-occurrence between speech and body move-ment for audio-guided video localization. IEEE Trans. Circuits Syst. Video Technol. 18, 1608–1617 (2008)
61. Vinyals, O., Friedland, G.: Modulation spectrogram features for speaker diarization. In: Pro-ceedings of Interspeech, September 2008, pp. 630–633 (2008)
62. Vinyals, O., Friedland, G.: Towards semantic analysis of conversations: a system for the liveidentification of speakers in meetings. In: Proceedings of IEEE International Conference onSemantic Computing, August 2008, pp. 456–459 (2008)
63. Wang, H., Divakaran, A., Vetro, A., Chang, S.F., Sun, H.: Survey of compressed-domain fea-tures used in audio-visual indexing and analysis. J. Vis. Commun. Image Represent. 14(2),150–183 (2003)
64. Wooters, C., Huijbregts, M.: The ICSI RT07s speaker diarization system. In: Proceedings ofthe NIST RT07 Meeting Recognition Evaluation Workshop. Springer, Berlin (2007)
65. Wrede, B., Shriberg, E.: Spotting “hot spots” in meetings: human judgments and prosodiccues. In: Proc. Eurospeech, pp. 2805–2808 (2003)
66. Wrigley, S.J., Brown, G.J., Wan, V., Renals, S.: Speech and crosstalk detection in multi-channel audio. IEEE Trans. Speech Audio Process. 13, 84–91 (2005)
67. Yeo, C., Ramchandran, K.: Compressed domain video processing of meetings for activ-ity estimation in dominance classification and slide transition detection. Technical ReportUCB/EECS-2008-79, EECS Department. University of California, Berkeley, June 2008

Computationally Efficient Clustering of Audio-Visual Meeting Data 59
68. Zancanaro, M., Lepri, B., Pianesi, F.: Automatic detection of group functional roles in faceto face interactions. In: International Conference on Multimodal interfaces, pp. 28–34. ACM,New York (2006)
69. Zhang, C., Yin, P., Rui, Y., Cutler, R., Viola, P.: Boosting-based multimodal speaker detec-tion for distributed meetings. IEEE International Workshop on Multimedia Signal Processing(MMSP) (2006)