COMPUTATIONAL MODELLING FOR DISH-TO-DISH COUPLING ... · A transfer function determined from an...
9
Vol.109 (1) March 2018 SOUTH AFRICAN INSTITUTE OF ELECTRICAL ENGINEERS 69 COMPUTATIONAL MODELLING FOR DISH-TO-DISH COUPLING INVESTIGATIONS ON MEERKAT TELESCOPE S. Kuja ∗ and P. G. Wiid ∗ ∗ Department of Electrical and Electronic Engineering, Stellenbosch University, Stellenbosch, Western Cape 7600, South Africa, e-mail: [email protected] and [email protected] Abstract: The MeerKAT telescope will form part of the Square Kilometre Array (SKA) which will have orders of magnitude greater sensitivity than existing radio telescopes. Radio Frequency Interference (RFI) poses a great threat to such sensitive equipment. We characterize electromagnetic (EM) signals on a single dish structure using a physical scale model, computational electromagnetic (CEM) modelling and field measurement. The CEM code and method of moments frequency domain numerical technique are utilised throughout the study. We successfully achieve CEM model verification through measurement of a physical scale model in an anechoic chamber. The validated model is further verified with full scale on-site measurements. A transfer function determined from an incident electric field and the associated induced currents on various cables of a single dish structure is used to compare simulation and measurement. We use our corroborated CEM model to investigate dish to dish coupling in order to predict whether the MeerKAT system would be at risk. With a low power radiation of -70 dBm from a neighbouring dish, we predict coupled power of less than -120 dBm to the nearest dish. Key words: Anechoic chamber, computational electromagnetic (CEM) modelling, dish to dish coupling, method of moments, radio frequency interference (RFI), telescope, transfer function. 1. INTRODUCTION Advances in astronomy have led to the development and use of large single dish telescopes such as Arecibo [1], and arrays of smaller dishes such as the Low-Frequency Array (LOFAR) [2,3]. To this end the Square Kilometre Array (SKA) telescope is planned, which will be the world’s largest and most sensitive telescope, consisting of thousands of receivers [4]. The MeerKAT is a precursor to this project and will form part of the SKA radio telescope phase 1 at a later stage [4]. Radio Frequency Interference (RFI) has the potential to degrade the ability of the SKA telescope to do the science for which it is being constructed [5]. Thus, a clean RFI environment is essential for the MeerKAT to achieve its scientific objectives. In this regard, measures have been taken by South African (SA) SKA to maintain the electromagnetic (EM) quietness of South Africa’s Karoo site which lies within a remote area in the Northern Cape Province of South Africa. The SA SKA identified and declared the site radio quiet under the SA Astronomy Advantage Act [6]. Furthermore, they have ensured that electromagnetic compatibility (EMC) engineering is a constant component of the developing infrastructure for the initial SA SKA demonstrator known as Karoo Array Telescope (KAT-7) and MeerKAT [7]. Our research group, EMRIN (EMC Metrology Research and INnovation) has been actively involved in EMC related issues for the SA SKA. Some of the research areas that EMRIN has focused on include: lightning-induced RFI, lightning surge protection, and earthing [8, 9]; cable layout, structure shielding and cable transfer impedance [7, 10]. The close proximity of the individual MeerKAT dishes at the core site could potentially lead to unexpected inter-coupling problems from low-level radiation due to currents on structure cables [11]. Mutual coupling between antennas used in radio telescope array had previously been done with electrically small antennas such as dipoles [12–15]. A similar idea has been utilized in complex and electrically large structures but within the structure itself, e.g. in-flight coupling configurations in aeroplanes [16–18]. In this paper we present MeerKAT to MeerKAT EM coupling investigations with special interest in the qualification of cabling and shielding around the receiver indexer (RI). The RI is one of the critical parts of the MeerKAT antenna that we focus on because of its sensitive receivers. We use physical scale model measurements to corroborate our computational model which is further validated with on-site measurements for full scale application. This approach enables us to effectively use our verified computational electromagnetic (CEM) model alone to predict electromagnetic interference (EMI) into and from the MeerKAT dishes. Our method is applicable in many areas of large electronic systems such as wind farms, future SKA and other radio astronomy installations or system for EMI prediction and assessment. For instance in propagation studies, a thoroughly validated model can simply be duplicated for multiple structures that can create a multipath effect with unique EMI environment. The paper has been organized as follows: Section 2. gives a brief description of the MeerKAT telescope and describes the regions of interest (RI and the stub-up regions); Section 3. discusses verification procedure of the computational model; in Section 4. the key findings are underlined where we compare EM coupling on the actual MeerKAT dish with simulation results and discuss dish-to-dish coupling; we give our concluding remarks in Section 5..
Transcript of COMPUTATIONAL MODELLING FOR DISH-TO-DISH COUPLING ... · A transfer function determined from an...
Vol.109 (1) March 2018 SOUTH AFRICAN INSTITUTE OF ELECTRICAL ENGINEERS 69
COMPUTATIONAL MODELLING FOR DISH-TO-DISH COUPLINGINVESTIGATIONS ON MEERKAT TELESCOPE
S. Kuja∗ and P. G. Wiid∗
∗ Department of Electrical and Electronic Engineering, Stellenbosch University, Stellenbosch, WesternCape 7600, South Africa, e-mail: [email protected] and [email protected]
Abstract: The MeerKAT telescope will form part of the Square Kilometre Array (SKA) whichwill have orders of magnitude greater sensitivity than existing radio telescopes. Radio FrequencyInterference (RFI) poses a great threat to such sensitive equipment. We characterize electromagnetic(EM) signals on a single dish structure using a physical scale model, computational electromagnetic(CEM) modelling and field measurement. The CEM code and method of moments frequency domainnumerical technique are utilised throughout the study. We successfully achieve CEM model verificationthrough measurement of a physical scale model in an anechoic chamber. The validated model is furtherverified with full scale on-site measurements. A transfer function determined from an incident electricfield and the associated induced currents on various cables of a single dish structure is used to comparesimulation and measurement. We use our corroborated CEM model to investigate dish to dish couplingin order to predict whether the MeerKAT system would be at risk. With a low power radiation of -70dBm from a neighbouring dish, we predict coupled power of less than -120 dBm to the nearest dish.
Key words: Anechoic chamber, computational electromagnetic (CEM) modelling, dish to dishcoupling, method of moments, radio frequency interference (RFI), telescope, transfer function.
1. INTRODUCTION
Advances in astronomy have led to the development anduse of large single dish telescopes such as Arecibo [1],and arrays of smaller dishes such as the Low-FrequencyArray (LOFAR) [2, 3]. To this end the Square KilometreArray (SKA) telescope is planned, which will be theworld’s largest and most sensitive telescope, consisting ofthousands of receivers [4]. The MeerKAT is a precursor tothis project and will form part of the SKA radio telescopephase 1 at a later stage [4].
Radio Frequency Interference (RFI) has the potential todegrade the ability of the SKA telescope to do the sciencefor which it is being constructed [5]. Thus, a cleanRFI environment is essential for the MeerKAT to achieveits scientific objectives. In this regard, measures havebeen taken by South African (SA) SKA to maintain theelectromagnetic (EM) quietness of South Africa’s Karoosite which lies within a remote area in the Northern CapeProvince of South Africa. The SA SKA identified anddeclared the site radio quiet under the SA AstronomyAdvantage Act [6]. Furthermore, they have ensuredthat electromagnetic compatibility (EMC) engineering isa constant component of the developing infrastructure forthe initial SA SKA demonstrator known as Karoo ArrayTelescope (KAT-7) and MeerKAT [7]. Our research group,EMRIN (EMC Metrology Research and INnovation) hasbeen actively involved in EMC related issues for theSA SKA. Some of the research areas that EMRIN hasfocused on include: lightning-induced RFI, lightning surgeprotection, and earthing [8, 9]; cable layout, structureshielding and cable transfer impedance [7, 10].
The close proximity of the individual MeerKAT dishesat the core site could potentially lead to unexpected
inter-coupling problems from low-level radiation due tocurrents on structure cables [11]. Mutual coupling betweenantennas used in radio telescope array had previouslybeen done with electrically small antennas such as dipoles[12–15]. A similar idea has been utilized in complexand electrically large structures but within the structureitself, e.g. in-flight coupling configurations in aeroplanes[16–18]. In this paper we present MeerKAT to MeerKATEM coupling investigations with special interest in thequalification of cabling and shielding around the receiverindexer (RI). The RI is one of the critical parts of theMeerKAT antenna that we focus on because of its sensitivereceivers. We use physical scale model measurementsto corroborate our computational model which is furthervalidated with on-site measurements for full scaleapplication. This approach enables us to effectively useour verified computational electromagnetic (CEM) modelalone to predict electromagnetic interference (EMI) intoand from the MeerKAT dishes. Our method is applicablein many areas of large electronic systems such as windfarms, future SKA and other radio astronomy installationsor system for EMI prediction and assessment. For instancein propagation studies, a thoroughly validated model cansimply be duplicated for multiple structures that can createa multipath effect with unique EMI environment.
The paper has been organized as follows: Section 2. gives abrief description of the MeerKAT telescope and describesthe regions of interest (RI and the stub-up regions); Section3. discusses verification procedure of the computationalmodel; in Section 4. the key findings are underlined wherewe compare EM coupling on the actual MeerKAT dishwith simulation results and discuss dish-to-dish coupling;we give our concluding remarks in Section 5..
Vol.109 (1) March 2018SOUTH AFRICAN INSTITUTE OF ELECTRICAL ENGINEERS70
�������������������������
���������������������
���������������������������������������������������������
���������
�����
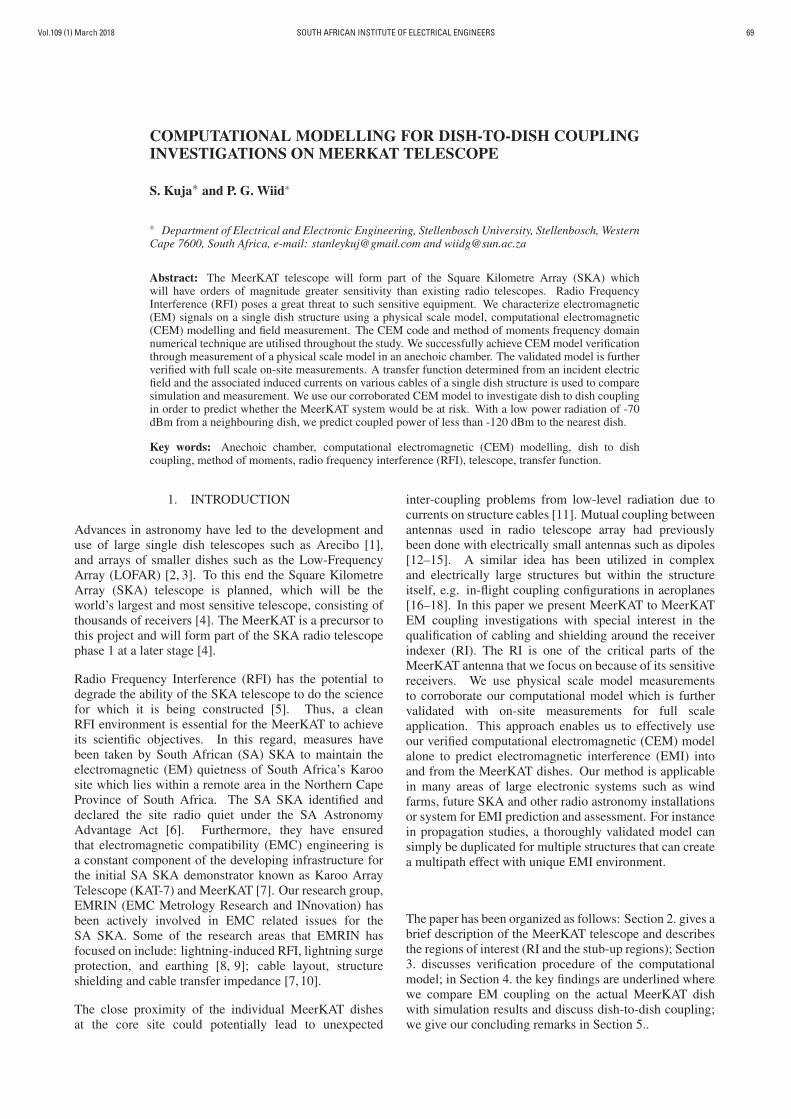
Figure 1: A side view of a 13.5 m Gregorian dual off-setMeerKAT dish (M63) at the core site.
2. THE MEERKAT TELESCOPE
The MeerKAT is an array of 64 dishes where each is a 13.5m Gregorian dual off-set configuration. The first installedMeerKAT dish (M063) was raised on the 27th of March2014 [4]. A photo of the dish taken by S. O. K. author atthe core site in May 2015 is shown in Fig. 1. The yoke,pedestal, reflectors, RI and the back structure are someof the main parts of the MeerKAT dish visible externally.The following Sections 2.1 and 2.2 describe two areas ofinterest, where our main focus is on RI.
2.1 Receiver Indexer (RI)
The MeerKAT receiver indexer is a metallic turn-tablewhere shielded electronic components, the UHF andL-Band receivers are installed. A maximum of fourreceivers can be mounted on the RI. It rotates eachreceiver to a precise position at the secondary focus of theellipsoidal sub-reflector [19]. The sub-reflector and the RIare configured with the connecting structure such that theyare below the main reflector (Fig. 1). This allows easyaccess and servicing of the RI region.
The SKA has conducted rigorous EMC compliance testingon the RI and pedestal structure. Cables from the RIare connected to various electrical components of theMeerKAT antenna, many through EMC filters. Connectorsare used to join these cables to electronics which havedifferent functions on the telescope. Some of the possiblepenetrable areas for RFI would be through cable shields orconnectors around the RI. One of the main objectives wasto predict where currents would be induced on the structure
�������������
����������������������� ��������������������
�����������������������������������
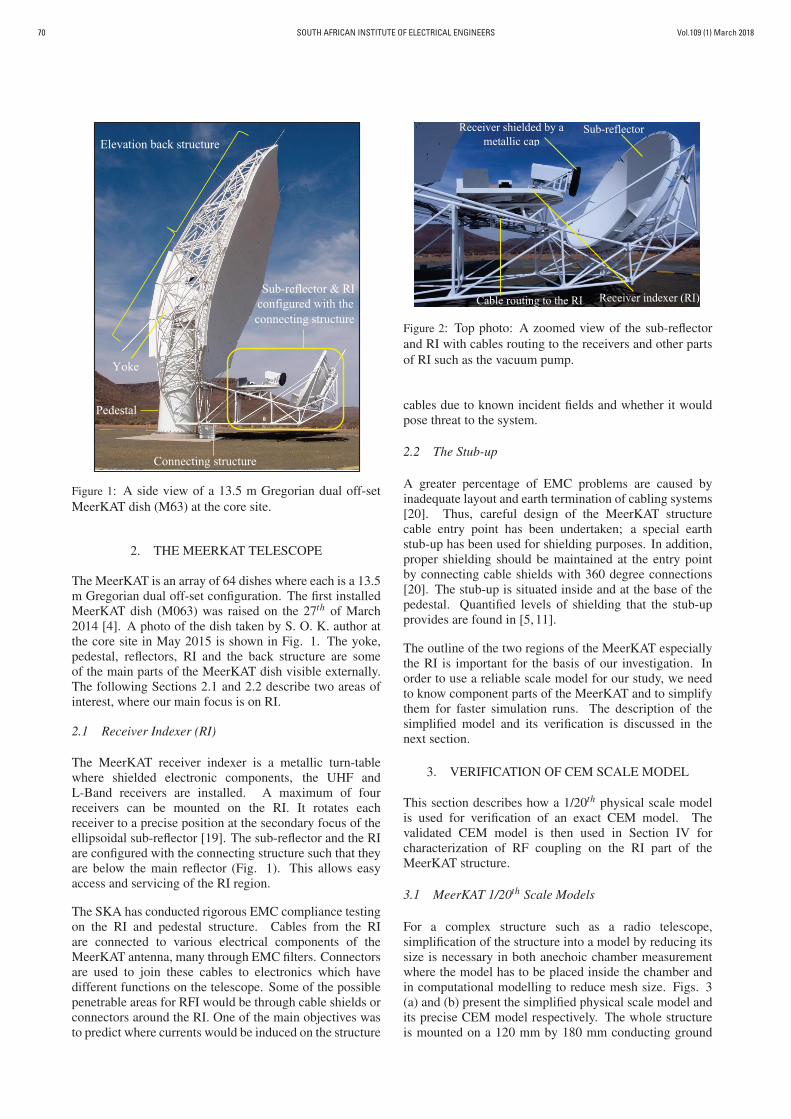
Figure 2: Top photo: A zoomed view of the sub-reflectorand RI with cables routing to the receivers and other partsof RI such as the vacuum pump.
cables due to known incident fields and whether it wouldpose threat to the system.
2.2 The Stub-up
A greater percentage of EMC problems are caused byinadequate layout and earth termination of cabling systems[20]. Thus, careful design of the MeerKAT structurecable entry point has been undertaken; a special earthstub-up has been used for shielding purposes. In addition,proper shielding should be maintained at the entry pointby connecting cable shields with 360 degree connections[20]. The stub-up is situated inside and at the base of thepedestal. Quantified levels of shielding that the stub-upprovides are found in [5, 11].
The outline of the two regions of the MeerKAT especiallythe RI is important for the basis of our investigation. Inorder to use a reliable scale model for our study, we needto know component parts of the MeerKAT and to simplifythem for faster simulation runs. The description of thesimplified model and its verification is discussed in thenext section.
3. VERIFICATION OF CEM SCALE MODEL
This section describes how a 1/20th physical scale modelis used for verification of an exact CEM model. Thevalidated CEM model is then used in Section IV forcharacterization of RF coupling on the RI part of theMeerKAT structure.
3.1 MeerKAT 1/20th Scale Models
For a complex structure such as a radio telescope,simplification of the structure into a model by reducing itssize is necessary in both anechoic chamber measurementwhere the model has to be placed inside the chamber andin computational modelling to reduce mesh size. Figs. 3(a) and (b) present the simplified physical scale model andits precise CEM model respectively. The whole structureis mounted on a 120 mm by 180 mm conducting ground

Vol.109 (1) March 2018 SOUTH AFRICAN INSTITUTE OF ELECTRICAL ENGINEERS 71
������������������������
������ �������� ���������������
������������
(a)
�������
������� �����
�������
�������
�������
�������
����
�����������������
�������
(b)
Figure 3: (a) Physical scale model inside anechoic chamber(b) Measurement set-up using computational electromag-netic (CEM) model discretised in the Method-of-Moments(MoM) based code FEKO.
plane; largest ground plane size to get through a standarddoor. EM characterization of a single dish structureusing the scale and CEM models has been studied in [9].However, the initial models did not have the RI and stub-upcomponents incorporated. These parts were retrofitted intothe early model at our engineering mechanical workshopand later replicated in FEKO.
A close-up view of the RI section of the models are shownin Fig. 4. The RI in Fig. 4 (a) is a 1/20th simplified versionof a full scale model (Fig. 4 (b)) according to SA SKAmechanical design. The simplification was performed toreduce the electrical size of the structure in order to speedup simulation runs. Fig. 4 (c) is an exact physical scalemodel of Fig. 4 (a). The semi-rigid cable seen in Fig. 4(c) connects the metallic box with the ground plane. Thebox represents shielded electronics behind the receivers onthe actual MeerKAT telescope. A Sub-miniature version A(SMA) connector is joined with the semi-rigid cable belowthe ground plate to create one of the ports for scatteringparameter measurements. The cable represents a worstcase cable shield running to the pedestal in the absenceof any bonding. Therefore, induced currents from fieldsshould exhibit a worst case coupling.
3.2 Anechoic Chamber Measurements
The simplified physical scale model described in theprevious subsection is used to obtain measured data forvalidation of our computational model. A two-portAgilent PNAX vector network analyser (VNA) placedoutside the anechoic chamber is connected to the scalemodel inside the chamber and thereafter we calibrate itusing a Short-Open-Load-Through (SOLT) procedure. Wethen carry out S-parameter measurements on the scalemodel from 45 MHz to 3000 MHz with 201 frequencypoints. The upper frequency value is limited by thecomputational cost of modelling while the choice for lowerfrequency is a matter of preference so that the model canbe characterized from lower frequency values below thechamber’s absorption limit. Usually, close coupling resultsare acceptable below the chamber absorption frequency.
(a) (b)
������������
����������������
(c)
Figure 4: (a) Simplified 1/20th of the RI CEM model (b)South African SKA full scale mechanical design of RI withits component parts (c) An exact physical scale model of(a).
However, this is not the case with plane wave antennacoupling measurements in the same chamber [21].
Fig. 3 (b) gives a measurement set-up of our multi-portscale model in the anechoic chamber connected to thetwo-port VNA. We terminate all unused ports with a 50ohm load for comparison to simulation where every port isdefined as 50 ohm. Measurement of S-parameters on eachpair of ports results into both ports’ reflection coefficients,S11 and S22 as well as the transmission coefficients S12 orS21. The measured S-parameters together with those fromCEM modelling are compared in Section 3.4.
3.3 Computational Modelling
The use of computational modelling is essential in ourresearch since on-site measurement opportunities are verylimited. Various numerical full-wave and asymptotic highfrequency solvers can be used in CEM modelling [22].The main idea in these techniques is to discretise or meshan unknown electromagnetic property, say, surface currentor E-field [23]. We use MoM code full-wave numericalmethod due to its efficiency on metallic surfaces and openboundaries.
The Method of Moments (MoM): In MoM, the numberof segments depend only on the shape and size of theconducting body [24]. Therefore, for electrically largeor complex structures, MoM becomes computationallyexpensive in terms of runtime and memory required.However, access to our university’s computational facility(Babbage) and Centre for High Performance Computing(CHPC) in Cape Town, South Africa, has made thismethod viable for our huge simulations. An extensiveand successful use of MoM in EMC studies for KAT-7is found in [25]. Babbage in our engineering departmenthas a 256 GB RAM and 12 cores mostly occupied by asingle simulation. While in the CHPC the solver load isadministered by a way of parallel processing which allowsit to be efficient in high-speed data processing.
Simulation: CEM model in Fig. 3 (b) is validated usingscattering parameter measurements we have discussed inSection 3.2. We fix the impedance of each port as
Vol.109 (1) March 2018SOUTH AFRICAN INSTITUTE OF ELECTRICAL ENGINEERS72
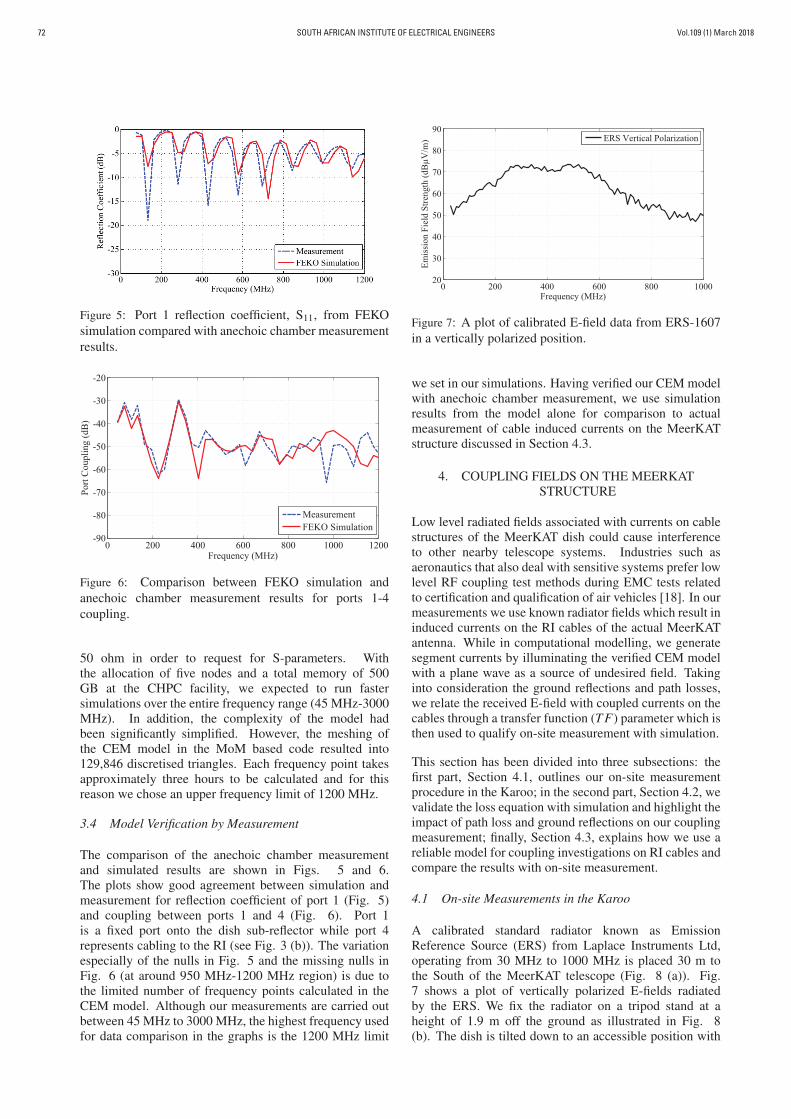
Figure 5: Port 1 reflection coefficient, S11, from FEKOsimulation compared with anechoic chamber measurementresults.
0 200 400 600 800 1000 1200-90
-80
-70
-60
-50
-40
-30
-20
Frequency (MHz)
Port
Cou
plin
g (d
B)
MeasurementFEKO Simulation
Figure 6: Comparison between FEKO simulation andanechoic chamber measurement results for ports 1-4coupling.
50 ohm in order to request for S-parameters. Withthe allocation of five nodes and a total memory of 500GB at the CHPC facility, we expected to run fastersimulations over the entire frequency range (45 MHz-3000MHz). In addition, the complexity of the model hadbeen significantly simplified. However, the meshing ofthe CEM model in the MoM based code resulted into129,846 discretised triangles. Each frequency point takesapproximately three hours to be calculated and for thisreason we chose an upper frequency limit of 1200 MHz.
3.4 Model Verification by Measurement
The comparison of the anechoic chamber measurementand simulated results are shown in Figs. 5 and 6.The plots show good agreement between simulation andmeasurement for reflection coefficient of port 1 (Fig. 5)and coupling between ports 1 and 4 (Fig. 6). Port 1is a fixed port onto the dish sub-reflector while port 4represents cabling to the RI (see Fig. 3 (b)). The variationespecially of the nulls in Fig. 5 and the missing nulls inFig. 6 (at around 950 MHz-1200 MHz region) is due tothe limited number of frequency points calculated in theCEM model. Although our measurements are carried outbetween 45 MHz to 3000 MHz, the highest frequency usedfor data comparison in the graphs is the 1200 MHz limit
� ��� ��� ��� ��� ������
��
��
��
��
��
��
��
��������� ���
�������� ����� �������� ���� �� ��� ������� �����������
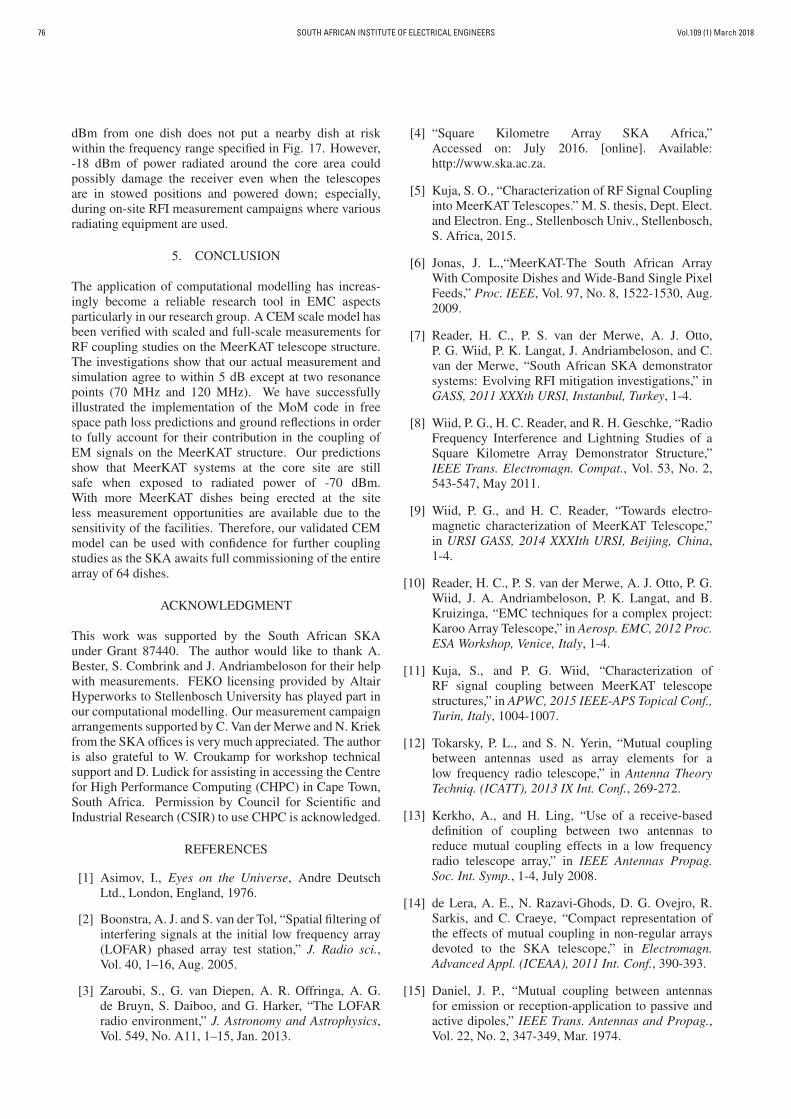
Figure 7: A plot of calibrated E-field data from ERS-1607in a vertically polarized position.
we set in our simulations. Having verified our CEM modelwith anechoic chamber measurement, we use simulationresults from the model alone for comparison to actualmeasurement of cable induced currents on the MeerKATstructure discussed in Section 4.3.
4. COUPLING FIELDS ON THE MEERKATSTRUCTURE
Low level radiated fields associated with currents on cablestructures of the MeerKAT dish could cause interferenceto other nearby telescope systems. Industries such asaeronautics that also deal with sensitive systems prefer lowlevel RF coupling test methods during EMC tests relatedto certification and qualification of air vehicles [18]. In ourmeasurements we use known radiator fields which result ininduced currents on the RI cables of the actual MeerKATantenna. While in computational modelling, we generatesegment currents by illuminating the verified CEM modelwith a plane wave as a source of undesired field. Takinginto consideration the ground reflections and path losses,we relate the received E-field with coupled currents on thecables through a transfer function (T F) parameter which isthen used to qualify on-site measurement with simulation.
This section has been divided into three subsections: thefirst part, Section 4.1, outlines our on-site measurementprocedure in the Karoo; in the second part, Section 4.2, wevalidate the loss equation with simulation and highlight theimpact of path loss and ground reflections on our couplingmeasurement; finally, Section 4.3, explains how we use areliable model for coupling investigations on RI cables andcompare the results with on-site measurement.
4.1 On-site Measurements in the Karoo
A calibrated standard radiator known as EmissionReference Source (ERS) from Laplace Instruments Ltd,operating from 30 MHz to 1000 MHz is placed 30 m tothe South of the MeerKAT telescope (Fig. 8 (a)). Fig.7 shows a plot of vertically polarized E-fields radiatedby the ERS. We fix the radiator on a tripod stand at aheight of 1.9 m off the ground as illustrated in Fig. 8(b). The dish is tilted down to an accessible position with

Vol.109 (1) March 2018 SOUTH AFRICAN INSTITUTE OF ELECTRICAL ENGINEERS 73
ERS
(a)
�
������
���������������
����
(b)
Figure 8: (a) A photograph of the MeerKAT telescope withits main reflector facing in the Western direction and to theSouth of the structure is the ERS (b) Transmitting ERS at30 m away from the dish. Inset: Close up view of the ERS.
the RI being 3.2 m above the ground. We use a 1 GHzcurrent probe and a hand-held Rohde and Schwarz FSH4spectrum analyser (SA) to measure induced potentials onselected cable points around the receiver indexer. Due tosafety concerns, the MeerKAT facility is powered downand the sensitive receivers are wrapped up by metallic capsto shield them from ERS emissions and other measurementequipment. The nearby KAT-7 dishes are switched off aswell and we only had four hours to do all our plannedmeasurements.
4.2 Validation of Free Space Path Loss (FSPL)
In ground wave propagation such as our measurementsdescribed in Section 4.1, the incident E-field received bythe antenna depends on free space path loss (FSPL) andground reflections (GR). Usually, the received wave is thesum of the direct and ground-reflected waves. In viewof the path loss, we validate the data from free spaceloss equation with simulation. In practical units, the lossequation is given by [26].
FSPL (dB) = 20log( f )+20log(d)−27.55 (1)
where f is frequency in MHz and d is the path length inmetres. We compute FSPL values in Matlab using thefrequency range, 30 MHz to 1000 MHz and path length,30 m, as in the actual measurement.
In our simulation set-up, we define two perfect electricconductor (PEC) dipoles of size 0.0625 m without theground plane, i.e., homogeneous free space medium (seeFig. 9). One of the dipoles is 1.9 m above the “ground”while the other is at a height of 3.2 m off the same surface.They transmit or receive in the vertical polarization andthe separation distance between them is 30 m. Throughuse of the Friis transmission equation, it is possible torelate FEKO-FSPL with the S-parameters requested from
�����
������������
Figure 9: A set-up of two dipoles in a CEM environmentused to obtain S-parameters for calculation of FSPL.
Prec Prad
Port 2 Port 1
Pout Pin
Figure 10: An illustrative diagram of two dipole portsutilized in obtaining (2). Prec is power received while Pradis power radiated.
our simulation [27–29]. Using Fig. 10 to represent a lineararrangement of nodes and branches in series, with only oneincoming (Pin) and one outgoing (Pout ) signal, FSPL can bedetermined through Eq. (2) [27].
FSPL = G2∣∣∣∣
1S21�
∣∣∣∣2
= G2[
|S21|2
(1−|S11|2)(1−|S22|2)
]−1
(2)
where |S21�|2 ≡ power received/power radiated is the
transmission coefficient which gives the loss-factor due tothe surrounding medium. The S-parameters, S11, S22, S21and gain, G, are obtained directly from our simulation. Inorder to account for GR, we include a ground plane in ourset-up given in Fig. 9. We use different ground planesseparately. The first one is an infinite ground plane (PECor perfect magnetic conductor (PMC)) which gives a worstcase GR. In the second case, we use soil characteristics ofthe very-dry ground, medium-dry ground and wet groundprovided in [30], to define a dielectric medium for theground plane. The results for the six set-ups: with noground plane; with PEC ground plane; with PMC groundplane; with very-dry ground; with medium-dry ground;with wet ground are discussed in the following paragraph.
The comparison between the simulated prediction of FSPLand the theoretical formulation of Eq. (1) is given inFig. 11. The plots for FSPL from simulation and the lossequation is within 1.5 dB. The degree of losses predictedby PEC or PMC ground reflections is less except at 420MHz frequency for PEC and below 100 MHz as well asat 860 MHz for PMC. The PEC or PMC ground-reflectedwave add out of phase with the direct wave, so they canceland result into more loss and less power at the receivingdipole. However, due to the signals adding in phase atabout 800 MHz (PEC) and 410 MHz (PMC) we realize6 dB less loss. Since the difference between simulatedFSPL and PEC/PMC is within 5 dB, real ground (Karoosoil) reflections would be less than 5 dB in comparison toFSPL. From the three soil characteristics obtained fromthe International Telecommunication Union standards,

Vol.109 (1) March 2018SOUTH AFRICAN INSTITUTE OF ELECTRICAL ENGINEERS74
� ��� ��� ��� ��� ��� ��� ��� ��� ��� ������
��
��
��
��
��
��
��
��
��������� ���
������� ����
�
�
���� ���� �� � ���� �� ��� ������� ������ ���
Figure 11: Comparison of FSPL from simulation andcomputed data from (1). Different FEKO simulationplots accounting for both FSPL & GR are also shownthrough PEC, PMC and various soil characteristics suchas very-dry ground, medium-dry ground and wet ground.Path length used is 30 m for all the configurations.
����� ���� �� �� �
�������� ������� ����
�� ������ ����� ����� � � � ����� ��
Figure 12: An exact and verified FEKO model of thephysical model (see Fig 3 (a)) being illuminated with aplane wave of magnitude 1 V/m.
very-dry ground would reasonably represent the Karoo soil(semi-arid region). The plot for very-dry ground in Fig.11 is in between the FSPL and PMC for most part of thefrequency band. For vertical polarization, the PMC givesa good approximation of real ground characteristics whosereflection coefficient approaches minus 1 [31]. Actually,the graph for very-dry ground follows a similar trend asPMC. For the discussions presented in this section andgiven that discretisation of the dielectric medium for theKaroo soil requires more computational power, we useour verified FSPL to compute the E-field received at theMeerKAT cables with 5 dB margin of uncertainty.
4.3 RF Coupling Investigations Using Verified 1/20th
CEM Model
We use our verified model in Fig. 12 for EM couplingstudies and thereafter compare the results with on-site
���� � ���� �
�������� ���
(a)
���� � ���� ��
���� � ���� ��
(b)
Figure 13: (a) Top section of RI showing two wires 1 and 2(b) Bottom section of RI with segments 42 and 43 of wire1. The wires represent cables on the actual dish connectingto RI components (refer to Fig. 2).
measurements described in Section 4.1. Firstly, the modelis tilted to have a similar orientation compared to the fullscale measurement set-up (refer to Fig. 8 (a)). Secondly,we illuminate it with a normalised 1 V/m plane wavewith a vertically polarized E-field. By utilizing MoMcode, we discretise the CEM model over a frequencyrange of 600 MHz to 3400 MHz which is equivalent to30 MHz to 170 MHz in full scale terms. The choice forthe lower frequency depends on the lowest frequency theERS operates while the upper frequency is limited by thememory available in our computational cluster, Babbage.In order to have the required induced segment currents weinclude two wires 1 and 2 (see Fig. 13 (a)) which representreal cables that run to the RI of the MeerKAT dish.
For better evaluation of our results from on-sitemeasurement and computational modelling, we considera transfer function (T F) given as.
T F =Erec (V/m)
I (μA)(3)
where Erec is the received E-field at the MeerKAT structureor model and I is the wire segment induced current. FromEq. (3) we derive the units of T F as dBμΩ/m. Inactual measurements, cable induced RF current (I) in μA iscalculated by dividing the current probe output (V ) in μVwith the known probe transfer impedance (ZT ) as shown inEq. (4).
I =V (μV)
ZT (Ω)(μA) (4)
Due to the impact of FSPL, we expect that Erec used in Eq.(3) to be less than the E-field radiated by the ERS. In linearterms Erec is computed using Eq. (5).

Vol.109 (1) March 2018 SOUTH AFRICAN INSTITUTE OF ELECTRICAL ENGINEERS 75
�� �� �� ��� ��� ��� �������
����
���
���
���
���
���
��������� ���
�������� �������� ��������
�������������������
Figure 14: Comparison of transfer function (T F) due toinduced currents on the limit-switch cable on the actualMeerKAT dish and wire segment 42 on the CEM model.The error bars give the uncertainty in our measured results.
�� �� �� ��� ��� ��� �������
���
���
���
���
���
���
���
���
��������� ���
�������� �������� ��������
���� � ��� ������ � ��� ��
Figure 15: Comparison of transfer function due to coupledcurrents on segments 42 and 43 on same wire of CEMmodel.
Erec =Erad√FSPL
(5)
where Erad is the ERS radiated E-field plotted in Fig. 7.
The measured versus simulated results which have beenscaled down in frequency are presented in Fig. 14. Alongthe plot of our measured results are the error bars whichindicate the standard deviations from the mean. In thesame Fig. 14, simulation results agree with measurementto within a 5 % error margin except at 70 MHz and120 MHz. Effect of resonance is suspected at a 70MHz frequency on the actual cable and at 120 MHz onwire segment. Cable length between bonds in actualmeasurement is not precisely represented in the exactscaled length in the CEM model. The first resonance at 40MHz corresponds to the wire length of 37.5 cm from thereceiver indexer then what follows is multiple wavelengthresonances at 80 MHz and 120 MHz. As for the actualdish the bonding occurs at 4.3 m (cable length) from theRI and this corresponds to 70 MHz frequency where theresonance is observed. Hence, the reason our plots fall
RFI Source: Dish M000
Dish M002
Figure 16: RF coupling between two MeeKAT dishes(M000 and M002) separated by a distance of 29.4 m; theclosest between any two dishes at the core site.
40 60 80 100 120 140 160
-160
-140
-120
-100
-80
-60
Frequency [MHz]
Pow
er C
oupl
ing
Leve
ls [d
Bm
]
Coupled Power when Prad
= -18 dBm
Coupled Power when Prad
= -70 dBm
Figure 17: Comparison of power received in MeerKAT dishM002 when power radiated (Prad) in dish M000 is -18 dBmor -70 dBm.
outside the error margin at those specific frequencies.
We exclusively use simulation to do further analysis onour results. We compare transfer function due to inducedcurrents on segments 42 and 43 on wire 1 shown in Fig.13 (b). The results give good agreement as depicted inFig. 15. A relative error of less than 0.02 is attained whichis equivalent to a desired confidence level greater than 98%. Therefore, it is reasonable to say that the magnitudeof the induced segment currents on same “wire 1” is thesame. We then investigate dish to dish RF coupling byduplicating our CEM model in two positions that representthe actual MeerKAT dishes, M000 and M002. The twotelescopes give the shortest separation distance of 29.4m, closer than any other pair in the core area. Fig. 16shows dish M002 exposed to unwanted emissions fromM000 and its orientation is such that maximum powercouples into the structure. As a guideline for safeguardingthe equipment, the SA SKA set a conservative figure of-100 dBm as the maximum power that would saturateMeerKAT receivers. We define our radiated power (Prad)as -18 dBm and -70 dBm and for each Prad we requestfor the received power in dish M002. The results in Fig.17 show that when Prad is -18 dBm and -70 dBm thelevel of coupled power is above and below -100 dBm,respectively. Therefore, we predict that a radiation of -70
Vol.109 (1) March 2018SOUTH AFRICAN INSTITUTE OF ELECTRICAL ENGINEERS76
dBm from one dish does not put a nearby dish at riskwithin the frequency range specified in Fig. 17. However,-18 dBm of power radiated around the core area couldpossibly damage the receiver even when the telescopesare in stowed positions and powered down; especially,during on-site RFI measurement campaigns where variousradiating equipment are used.
5. CONCLUSION
The application of computational modelling has increas-ingly become a reliable research tool in EMC aspectsparticularly in our research group. A CEM scale model hasbeen verified with scaled and full-scale measurements forRF coupling studies on the MeerKAT telescope structure.The investigations show that our actual measurement andsimulation agree to within 5 dB except at two resonancepoints (70 MHz and 120 MHz). We have successfullyillustrated the implementation of the MoM code in freespace path loss predictions and ground reflections in orderto fully account for their contribution in the coupling ofEM signals on the MeerKAT structure. Our predictionsshow that MeerKAT systems at the core site are stillsafe when exposed to radiated power of -70 dBm.With more MeerKAT dishes being erected at the siteless measurement opportunities are available due to thesensitivity of the facilities. Therefore, our validated CEMmodel can be used with confidence for further couplingstudies as the SKA awaits full commissioning of the entirearray of 64 dishes.
ACKNOWLEDGMENT
This work was supported by the South African SKAunder Grant 87440. The author would like to thank A.Bester, S. Combrink and J. Andriambeloson for their helpwith measurements. FEKO licensing provided by AltairHyperworks to Stellenbosch University has played part inour computational modelling. Our measurement campaignarrangements supported by C. Van der Merwe and N. Kriekfrom the SKA offices is very much appreciated. The authoris also grateful to W. Croukamp for workshop technicalsupport and D. Ludick for assisting in accessing the Centrefor High Performance Computing (CHPC) in Cape Town,South Africa. Permission by Council for Scientific andIndustrial Research (CSIR) to use CHPC is acknowledged.
REFERENCES
[1] Asimov, I., Eyes on the Universe, Andre DeutschLtd., London, England, 1976.
[2] Boonstra, A. J. and S. van der Tol, “Spatial filtering ofinterfering signals at the initial low frequency array(LOFAR) phased array test station,” J. Radio sci.,Vol. 40, 1–16, Aug. 2005.
[3] Zaroubi, S., G. van Diepen, A. R. Offringa, A. G.de Bruyn, S. Daiboo, and G. Harker, “The LOFARradio environment,” J. Astronomy and Astrophysics,Vol. 549, No. A11, 1–15, Jan. 2013.
[4] “Square Kilometre Array SKA Africa,”Accessed on: July 2016. [online]. Available:http://www.ska.ac.za.
[5] Kuja, S. O., “Characterization of RF Signal Couplinginto MeerKAT Telescopes.” M. S. thesis, Dept. Elect.and Electron. Eng., Stellenbosch Univ., Stellenbosch,S. Africa, 2015.
[6] Jonas, J. L.,“MeerKAT-The South African ArrayWith Composite Dishes and Wide-Band Single PixelFeeds,” Proc. IEEE, Vol. 97, No. 8, 1522-1530, Aug.2009.
[7] Reader, H. C., P. S. van der Merwe, A. J. Otto,P. G. Wiid, P. K. Langat, J. Andriambeloson, and C.van der Merwe, “South African SKA demonstratorsystems: Evolving RFI mitigation investigations,” inGASS, 2011 XXXth URSI, Instanbul, Turkey, 1-4.
[8] Wiid, P. G., H. C. Reader, and R. H. Geschke, “RadioFrequency Interference and Lightning Studies of aSquare Kilometre Array Demonstrator Structure,”IEEE Trans. Electromagn. Compat., Vol. 53, No. 2,543-547, May 2011.
[9] Wiid, P. G., and H. C. Reader, “Towards electro-magnetic characterization of MeerKAT Telescope,”in URSI GASS, 2014 XXXIth URSI, Beijing, China,1-4.
[10] Reader, H. C., P. S. van der Merwe, A. J. Otto, P. G.Wiid, J. A. Andriambeloson, P. K. Langat, and B.Kruizinga, “EMC techniques for a complex project:Karoo Array Telescope,” in Aerosp. EMC, 2012 Proc.ESA Workshop, Venice, Italy, 1-4.
[11] Kuja, S., and P. G. Wiid, “Characterization ofRF signal coupling between MeerKAT telescopestructures,” in APWC, 2015 IEEE-APS Topical Conf.,Turin, Italy, 1004-1007.
[12] Tokarsky, P. L., and S. N. Yerin, “Mutual couplingbetween antennas used as array elements for alow frequency radio telescope,” in Antenna TheoryTechniq. (ICATT), 2013 IX Int. Conf., 269-272.
[13] Kerkho, A., and H. Ling, “Use of a receive-baseddefinition of coupling between two antennas toreduce mutual coupling effects in a low frequencyradio telescope array,” in IEEE Antennas Propag.Soc. Int. Symp., 1-4, July 2008.
[14] de Lera, A. E., N. Razavi-Ghods, D. G. Ovejro, R.Sarkis, and C. Craeye, “Compact representation ofthe effects of mutual coupling in non-regular arraysdevoted to the SKA telescope,” in Electromagn.Advanced Appl. (ICEAA), 2011 Int. Conf., 390-393.
[15] Daniel, J. P., “Mutual coupling between antennasfor emission or reception-application to passive andactive dipoles,” IEEE Trans. Antennas and Propag.,Vol. 22, No. 2, 347-349, Mar. 1974.
Vol.109 (1) March 2018 SOUTH AFRICAN INSTITUTE OF ELECTRICAL ENGINEERS 77
[16] Weston, D. A., “Comparison of techniques forprediction and measurement of antenna to antennacoupling on an aircraft,” in 10th Int. Symp.Electromagn. Compat., 228-233, Sept. 2011.
[17] Medgyesi-Mitschang, L. N., “Coupling Effects onElectrically Small Antennas on Aircraft,” in IEEE Int.Symp. Electromagn. Compat., 1-6, Aug. 1977.
[18] Romero, S. F., A. L. Morales, M. A. Cancela, andG. G. Gutirrez, “Validation procedure of low levelcoupling tests on real aircraft structure,” in EMCEUROPE, 2012 Int. Symp., 1-6.
[19] “13.5 m MeerKAT Dual Offset Antenna: SystemDescription Document.” Vertex AntennentechnikGmbH, General Dynamics Company, 2013.
[20] Williams, T., EMC for Product Designers, 2nd ed.Newnes, ISBN: 0750624663, 1996.
[21] Wiid, P. G., “Lower uncertainty PCB-LPDA antennameasurement on open area test site,” in IEEE ICEAA,2013 Int. Conf., 911-914.
[22] Jakobus, U., and G. Smith, “State of the art ofelectromagnetic modelling in FEKO,” in 6th EUCAP,853854, Mar. 2012.
[23] Davidson, D. B., Computational Electromagneticsfor RF and Microwave Engineering, CambridgeUniv. Press, New York, NY, USA, 2005.
[24] Ludick, D. J., E. Lezar, and U. Jakobus, “Charac-teristic mode analysis of arbitrary electromagneticstructures using FEKO,” in IEEE ICEAA 2012 Int.Conf., 208-211.
[25] Wiid, P. G., “Lightning Protection and RadioFrequency Interference Mitigation for the KarooArray Telescope,” Ph.D. dissertation, Dept. Elect.and Electron. Eng., Stellenbosch Univ., Stellenbosch,S. Africa, 2010.
[26] Phillips, C., D. Sicker, and D. Grunwald, “A Surveyof Wireless Path Loss Prediction and CoverageMapping Methods,” IEEE Commun. Surveys Tuts.,Vol. 15, No. 1, 255-270, Feb. 2013.
[27] Pozar, D. M., Microwave Engineering, 4th ed., JohnWiley & Sons, Inc., Hoboken, NJ, USA, 194–200,2012.
[28] Phiri, T. J., D. B. Davidson, and P. G. Wiid,“Propagation modelling for the South African SKAsite,” in APWC, 2015 IEEE-APS Topical Conf., Turin,Italy, 1329-1332.
[29] Seybold, J. S., Introduction to RF Propagation, JohnWiley & Sons, Inc., Hoboken, NJ, USA, 2005.
[30] ITU-R, “Electrical Characteristics of the Surface ofthe Earth,” Int. Telecommun. Union, Tech. Rep. Rec.ITU-R P.527-3, 1992.
[31] Hviid, J. T., J. B. Andersen, J. Toftgard, and J.Bojer, “Terrain-Based Propagation Model for RuralArea–An Integral Equation Approach,” IEEE Trans.Antennas and Propag., Vol. 43, No. 1, 41-46, Jan.1995.