Computational Fluid Dynamics Modelling of Heat Treatment ... · nickel based superalloys for...
10
Computational fluid dynamics modelling of heat treatment of single crystal nickel based superalloys for turbine blade application Francesco Cosentino 1 , Nils Warnken 1 , Jean-Christophe Gebelin 1 , Robert W Broomfield 1 and Roger C Reed 1 1 Department of Metallurgy and Materials, The University of Birmingham, Edgbaston, Birmingham, B15 2TT, UK Keywords: Heat Treatment, CFD modelling, RR3010, microstructure, creep. Abstract A numerical model based on computational fluid dy- namics (CFD) is developed to simulate the vacuum heat treatment of single crystal turbine blades. Radi- ation and forced convection heat transfer are taken into account to model ramping-up, holding and gas fan quenching. This enables quantitative predictions to be made of temperature fields inside a laboratory- scale vacuum furnace. The uniformity of the expected temperature field is studied with a particular aim to predict hot spots or locations with higher risk of in- cipient melting. Simulation of the gas fan quenching process allows estimation of the quench rate to be made as a function of position within the furnace and critical furnace processing parameters. The effect of quench rate and ageing time on the microstructure of RR3010 superalloy has been characterised using scanning electron microscopy. Two representative structures with different average γ 0 size have been tested in creep in three temperature regimes and with three different level of stresses, in an attempt to gain better understanding of the influence of microstruc- ture on creep performance. Our results indicate that at lower creep testing temperatures, larger γ 0 size con- fers longer time to rupture; however, as the testing temperature increases, the influence of microstructure is less pronounced. Introduction Single crystal nickel based superalloys used for turbine blade application are manufactured by investment casting. The conditions used during processing pro- duce a casting with a high degree of microsegregation. Thus, the distribution of elements in the as-cast state is not uniform with chemical heterogeneity present on a scale inherited from the dendritic microstructure formed during solidification, see Fig. 1. The presence of such microsegregation is known to impair the me- chanical properties considerably and therefore, during the manufacturing process, a heat treatment stage is often employed [1]. This involves a slow ramping up of the temperature, followed by a holding at a temperature above the γ 0 solvus and finally a fast quench, during which a fine dispersion of precipitates is produced. The heating rate should be slow enough to avoid incipient melting, while the temperature and the duration of the holding should be enough to dis- solve interdendritic γ 0 precipitates. During quenching a particular concern is the uniformity of cooling rates between components produced in any given batch. It is evident that this is a complicated process for which the precise control of the temperature plays a vital role. So far, very little attention has been paid to the mathematical modelling of the heat treat- ment process, perhaps due to its inherent complexity. Currently the analysis and optimisation of the heat treatment process relies heavily on trial-and-error experimentation, even though numerical simulation capabilities are becoming more readily available. In Figure 1: Scanning electron micrograph of an as-cast RR3010 turbine blade showing a typical dendritic microstructure. 673
Transcript of Computational Fluid Dynamics Modelling of Heat Treatment ... · nickel based superalloys for...

Computational fluid dynamics modelling of heat treatment of single crystalnickel based superalloys for turbine blade application
Francesco Cosentino1, Nils Warnken1, Jean-Christophe Gebelin1,Robert W Broomfield1 and Roger C Reed1
1Department of Metallurgy and Materials, The University of Birmingham,Edgbaston, Birmingham, B15 2TT, UK
Keywords: Heat Treatment, CFD modelling, RR3010, microstructure, creep.
Abstract
A numerical model based on computational fluid dy-namics (CFD) is developed to simulate the vacuumheat treatment of single crystal turbine blades. Radi-ation and forced convection heat transfer are takeninto account to model ramping-up, holding and gasfan quenching. This enables quantitative predictionsto be made of temperature fields inside a laboratory-scale vacuum furnace. The uniformity of the expectedtemperature field is studied with a particular aim topredict hot spots or locations with higher risk of in-cipient melting. Simulation of the gas fan quenchingprocess allows estimation of the quench rate to bemade as a function of position within the furnace andcritical furnace processing parameters. The effect ofquench rate and ageing time on the microstructureof RR3010 superalloy has been characterised usingscanning electron microscopy. Two representativestructures with different average γ′ size have beentested in creep in three temperature regimes and withthree different level of stresses, in an attempt to gainbetter understanding of the influence of microstruc-ture on creep performance. Our results indicate thatat lower creep testing temperatures, larger γ′ size con-fers longer time to rupture; however, as the testingtemperature increases, the influence of microstructureis less pronounced.
Introduction
Single crystal nickel based superalloys used for turbineblade application are manufactured by investmentcasting. The conditions used during processing pro-duce a casting with a high degree of microsegregation.Thus, the distribution of elements in the as-cast stateis not uniform with chemical heterogeneity presenton a scale inherited from the dendritic microstructureformed during solidification, see Fig. 1. The presenceof such microsegregation is known to impair the me-chanical properties considerably and therefore, during
the manufacturing process, a heat treatment stageis often employed [1]. This involves a slow rampingup of the temperature, followed by a holding at atemperature above the γ′ solvus and finally a fastquench, during which a fine dispersion of precipitatesis produced. The heating rate should be slow enoughto avoid incipient melting, while the temperature andthe duration of the holding should be enough to dis-solve interdendritic γ′ precipitates. During quenchinga particular concern is the uniformity of cooling ratesbetween components produced in any given batch.It is evident that this is a complicated process forwhich the precise control of the temperature playsa vital role. So far, very little attention has beenpaid to the mathematical modelling of the heat treat-ment process, perhaps due to its inherent complexity.Currently the analysis and optimisation of the heattreatment process relies heavily on trial-and-errorexperimentation, even though numerical simulationcapabilities are becoming more readily available. In
Figure 1: Scanning electron micrograph of an as-castRR3010 turbine blade showing a typical dendriticmicrostructure.
673

this work, a model based on computational fluid dy-namics (CFD) is presented for the simulation of theheat treatment of turbine blades. Our modelling fo-cusses on a laboratory-scale vacuum furnace and takesinto account the radiation heat transfer during theheating stage and the forced convection heat transfercommonly used during cooling. The model providesprediction of the thermal history of the treated com-ponent and can be used to identify the regions thatare at risk of incipient melting. Simulation of the gasflow provides prediction of cooling rates in differentregions of the blade aerofoil and as a function of theposition in the furnace load. These results can be usedto assess the uniformity of quenching, and to improvethe furnace design towards a more homogenous flowfield.
Furthermore, it is very important to correlate theeffect of heat transfer to microstructure and propertiesof the alloy. Microstructure models exist that, tak-ing into account the thermodynamic of the alloy andtransformation kinetics, are able to predict microstruc-tural features like dendritic arrays and evolution ofmicrosegregation [2] or precipitation and coarseningof the γ′ phase [3, 4]. Naturally, these models needprocessing information, i.e. temperature histories ofthe type that the present modelling can provide, sothat one ambitious goal is the coupling of processingand materials models so that properties can be pre-dicted as a function of processing data. For the heattreatment process, the ultimate goal is to improvematerial properties and in particular the creep life.There is undoubtedly an influence of microstructureand thus cooling rate; therefore it is important to un-derstand how the microstructure influences creep lifein order to optimise the performance of any existingalloy. Therefore, in this paper extensive characterisa-tion of the influence of cooling rates and ageing timesupon the development of the γ - γ′ structure has beenperformed. Based on the results, two microstructureswere selected for evaluation of their mechanical per-formance. Creep testing was performed, at three testtemperatures and three stresses per temperature.
Numerical Modelling
In this work, computational fluid dynamics (CFD)methods are employed. It is well known that CFDmethods are well established for treating a wide va-riety of engineering problems particularly involvingheat transfer and fluid flow; however, it does not ap-pear to have been used widely for furnace modellingso far. In this research CFD has been used to model a
vacuum heat treatment furnace using the commercialsoftware package ANSYS Fluent version 13. Duringthe ramping up stage, heat is transferred by radia-tion in a very low pressure atmosphere and thereforenatural convection is not significant; in this investiga-tion the mechanisms of heat transfer considered areradiation between surfaces and conduction in solids.Cooling is obtained by high pressure gas quenching.In order to achieve this, the furnace is pressurized toa predefined level and a fan used to drive the flowthrough the furnace chamber. In this latter case, themain mechanism of heat transfer is forced convection;thus radiation has not been taken into account. Dueto the different physical processes involved, the sim-ulation activity has been divided into two separatestages.
Modelling of the heating stage
The geometrical model used for the heating stageis illustrated in Fig. 2 together with the furnaceused for the validatory experimentation. The modelwas designed using CAD files of the furnace geome-try, which is located in the Interdisciplinary ResearchCentre (IRC) at the University of Birmingham; al-though of a laboratory scale, it possesses most of thecharacteristics of a industry-scale gas fan quenching(GFQ) furnace. Initially, our modelling has dealt withthree cylindrical specimens placed side by side, therack used to accommodate the furnace load and aset of heating elements, all enclosed in a cubic cham-ber made out of insulating material; this is furtherbounded by the external vessel, water cooled to roomtemperature. The model was then further developedto include a turbine blade of realistic geometry. Withthis model, transient calculation were performed topredict temperature fields inside the furnace duringthe heat treatment.
One overarching requirement for realistic modellingis the specification of the heat balance in the furnace.This was accomplished by specifying the tempera-tures of the heating elements as a function of timeand assuming these to be uniform. The boundaryconditions used for the simulated heat treatments aregiven in Fig. 3. The heat losses from the furnacewalls were assumed to be due to radiation alone, andthe external far field temperature was set to 300 K.Natural convection was neglected in the calculation.Radiation was accounted for using the S2S radiationmodel as implemented in ANSYS Fluent [5]. TheS2S radiation model considers the radiation from sur-face to surface; it does not consider any influence of
674

(a) Laboratory-scale vacuum furnace at the University ofBirmingham.
(b) Computer model of the furnace arrangement to be simu-lated.
Figure 2: Vacuum furnace used for validation experiments and associated CAD geometry.
the gas phase such as scattering or absorption. Theheat flux emitted from a surface is proportional to itstemperature and to a combination of size, orientationand distance of all surfaces with respect to each other.All these geometric features are accounted for usingappropriate viewfactors.
Modelling of the gas quenching
Modelling of the cooling process requires the compu-tation of the flow field inside the furnace chamber.Computational fluid dynamics [6] has been used tosolve numerically the Navier-Stokes equations, cou-pled with the heat transport equations, using a finitevolume approach. This gives the time dependent tem-perature within the solution domain. The effect ofturbulence has been included using the k-ω model[5]. The boundary conditions for the flow simulationwere specified in terms of the pressure drop betweenthe inlet and the outlet, assuming uniform pressuredistribution at each boundary. For the specificationof these values, measurements were performed using adifferential pressure transmitter. The furnace param-eters that control the intensity of the quenching arethe gas pressure and the percentage of the maximumfan speed. For any given combination of these usedin a validation experiment, the pressure differencebetween the inlet and outlet was measured and ap-plied in the calculation. In order to keep the runtimeat an acceptable level, the physics of the problem
has been simplified. It has been assumed that themain mechanism of heat transfer is forced convection;therefore the contributions of radiation heat transferand natural convection are not been included in thecalculations. Moreover it is assumed that the flowfield does not change with temperature. The geom-etry of the furnace used for quenching simulationsis different from that of the heating model; here themodel includes openings that allow the gas to enterand leave the furnace (i.e. inlet and outlets) as well asbaffles that are of primary importance in determiningthe overall flow field.
Simulation Results and ExperimentalValidation
Heating model
Transient simulations were performed to predict theheating curves of (i) cylindrical specimens and (i) arepresentative turbine blade. The temperature pre-dicted by the model was validated against thermocou-ple readings. The 1.5 mm diameter thermocouples(type N) were positioned inside holes drilled alongthe centreline of the cylindrical specimen to a typicaldepth of 4 mm. Experiments were repeated to ensureconsistent reading and the measurement were foundto be within the limits of error of the instrument(0.75% of the reading). In Fig. 4 the furnace tem-perature is shown at the holding temperature. The
675

(a) First attempt. (b) Refined boundary condition.
Figure 3: Simulation result. The plots show the temperature as a function of time. The curve with squaremarker represents the measured experimental value; the curve with no marker is the simulation boundarycondition and the triangle marked is the model prediction.
heating element temperature is uniform, consistentwith its use as a boundary condition. The tempera-ture decreases towards the centre of the furnace butthe higher gradients are found between the heatingelements and the walls, where temperature reachesa minimum value. In the core of the furnace (thespace occupied by rack and samples) the temperaturedistribution is influenced by the presence of the rackwhich shadows the heater radiation, and the gradientis much more shallow with a variation in temperatureis about 6 K at the holding, which can be consideredas uniform. Of course during the ramping this situa-tion is worse. Due to symmetry, the temperatures ofthe cylinders on either side are almost identical, andhigher than the temperature of the central cylinder byhalf a degree. Although not significant in this case itis important to be able to quantify this temperaturedifference since it can become significant in industrialscale applications where an elevated number of partsare heat treated at the same time. Fig. 3-a showsthe temperature of a point inside the middle cylinderand compares it with the predictions of the model.Good agreement is observed especially at higher tem-peratures, whilst at lower temperatures the cylindertemperature is underpredicted. There are severalpossible reasons for this discrepancy, but the mainsource of error is considered to be the accuracy ofthe boundary condition. The temperature of heatingelements cannot be directly measured using thermo-couples and because of the unsteadiness of the heatingprocess it is not trivial to derive. Refinement of the
boundary condition therefore remarkably improvesthe simulation accuracy (as shown in Fig. 3-b). Thetemperature distribution on the surface of the heattreated components was found to vary considerablydepending on the stage of the heat treatment. This isillustrated in Fig. 5 for the case of the turbine bladeconsidered. In Fig. 5-a the temperature during hold-ing is illustrated. Here the temperature of the heatingelement is fixed; the overall temperature variation in
Figure 4: Prediction of temperature distribution dur-ing holding.
676

(a) snapshot during holding (b) snapshot during ramping up
Figure 5: Temperature distribution on the surface of a turbine blade. Isothermal hold (a) and ramping (b).
the blade is predicted to be 2 K. The temperature ishighest at mid-height of the aerofoil. The minimumis located at the shroud which is not facing directlythe heating element. The root is equally not facingthe heating element, but the higher mass provides ahigher thermal inertia and hence a lower temperature.During the transient stage the temperature differenceis found to be greater, and can be larger than 10 K,as shown in Fig. 5-b. Here the temperature is higheron the aerofoil and lower in the root, indicating thatduring heating the temperature is a function of thelocal thickness of the component.
Quenching model
Calculation of fluid flow during quenching was per-formed to predict cooling rates of the treated com-ponents. In order to get accurate results, the flowquantities at the boundaries must be defined withcare. Since both velocity and pressure are not uni-form, specifying constant quantities at the boundariesin the model of Fig. 6-a resulted in velocity vectorsnormal to the inlet, which did not capture the flowinhomogeneities. It was then necessary to simulatehow the gas enters into the furnace by moving theinlet backwards and by including the top duct intothe model, as shown in Fig. 6-b. In this way the flowdevelops in the top channel so that the gas direction atthe entrance of the hot zone is correctly reproduced.Simulations of different quenching conditions wereperformed. In what follows, the results of quenchingat 1 bar of absolute pressure and 30 % fan speed –where the maximum fan speed is 3000 revolutionsper minute (RPM) – are discussed. These conditions
resulted in a pressure drop across the furnace of about30 Pa. Fig. 6-b shows a side view of the furnace. Theflow is entering the domain from the inlet – note thatthe fan itself has not been explicitly modelled – andtravels through the furnace leaving from the outlet.The flow velocity at the inlet is about 2.5 m/s, forthe combination of pressure and fan speed mentionedearlier. It then accelerates near the entrance of thehot zone because the section is smaller. The highestvelocity is found above the first baffle and betweenthe last two baffles, which is where the flow starts tochange direction to enter the hot zone. The positionand orientation of the baffles direct the flow towardsthe back of the furnace, hence the quenching is ex-pected to be inhomogeneous. The velocity magnitudeof the flow hitting the blade varies between 1 and3 m/s. At the furnace exit, similar to the entrance,there is an increase of flow speed because the sectionis smaller. Fig. 6-c shows the velocity magnitude ina front view of the furnace. Due to the symmetry ofthe furnace the flow field is symmetric as well, andflow separation can be observed due to the presenceof the heating elements. The cooling curve predictedfrom the simulation agrees well with the experimentalvalue measured using a thermocouple fitted in a holeinside a cylinder, as shown in Fig. 7. The agreementis good considering that radiation and natural convec-tion have been neglected. In particular, the influenceof pressure and fan speed is captured in a realisticway. The flow field depicted in Fig. 6-b and -c is alsovalidated by the readings of four retractible thermo-couples which are placed near the four corners of thefurnace. For each of the quenching experiments, thetwo thermocouples in the back corners read higher
677

(a) Initial geometry (b) Final geometry: side view (c) Final geometry: front view
Figure 6: Quenching furnace model: Velocity magnitude profiles for different geometries.
cooling rates than the ones in the front, consistentwith a higher flow speed at the back of the furnace.The influence of the flow field can also be observed interms of their effect on heat transfer and temperatureon the quenched components. Fig. 8 shows the calcu-lated heat transfer coefficient (HTC) distribution onthe surface of the blade. The side of the blade thatfaces the incoming flow shows higher values of HTCthan the back and the root, which was oriented to-wards the back part of the furnace. The temperatureon the other hand is influenced by a combination ofHTC and local thickness of the component, as canbe seen in Fig. 9. The temperature is higher in theroot, despite the greater HTC there, because of thegreater mass; for the same reason (very low mass)
0 50 100 150 200 250600
800
1000
1200
1400
1600
time [s]
tem
pera
ture
[k]
1 bar / 30 %
5 bar / 30 %
8 bar / 30 %
Figure 7: Quenching curves for different pressure andfan speeds. Comparison between experiment (dashedline) and simulation results (solid line).
the aerofoil is rapidly quenched. The temperaturedifference across the entire blade is quite large, whichleads to very different local cooling rate.
Microstructure characterisation
The microstructure of the single crystal superal-loy RR3010, subjected to different quenching condi-tions and ageing times, has been characterised usingscanning electron microscopy (SEM). Solution heat-treated cylindrical specimens were subjected to solu-tioning treatments of 1.5 hours at 1637 K (1364 ◦C).After the dissolution of γ′, the samples were quenchedat four different cooling rates, followed by ageing forthree different times at 1423 K (1150 ◦C). The detailsare summarised in Table 1.
The characterisation focussed on the determination
Figure 8: Variation of heat transfer coefficient on theblade surface.
678

Table 1: Quenching plus ageing conditions matrixMeasured Cooling Rate Ageing at 1423 K
251 K /minute 1 hour - 5 hour
362 K /minute 1 hour 3 hour 5 hour437 K /minute 1 hour 3 hour 5 hour
507 K /minute 1 hour 3 hour 5 hour
of the average precipitate size and its distribution.The samples were prepared by cutting slices normalto the solidification direction, mounting, grinding withprogressively smaller grit size and final polishing withaluminium oxide suspension with grit size of 0.02 µm.Chemical etching was performed using Kalling’s solu-tion which preferentially removes the γ′ phase in orderto enhance the contrast of precipitate/matrix interface.The SEM micrographs were analysed using the freelyavailable image processing software ImageJ followingmethods reported in [7]. Each image in grayscale wasimported into the software and converted to binaryusing a threshold value, to distinguish matrix fromprecipitate. The software was then calibrated usingthe scale bar of the image; thereafter a particle searchwas performed to return a list of the particles foundtogether with their respective areas. The size of theparticle was taken as the diameter of a circle of areaequivalent to that determined. For each sample aminimum of 5 images were analysed and the averagevalue of the diameter taken. A micrograph of theas-received material is given in Fig. 10. It can be seenthat the structure is pretty irregular; the γ′ particles
Figure 9: Predicted temperature within various sec-tions of the blade.
Figure 10: SEM micrograph of an RR3010 solutiontreated with a standard quench rate.
appear as approximately cubical but the edges arenot sharp. This is typical of a structure that hasbeen subject to a slow quenching. The average γ′
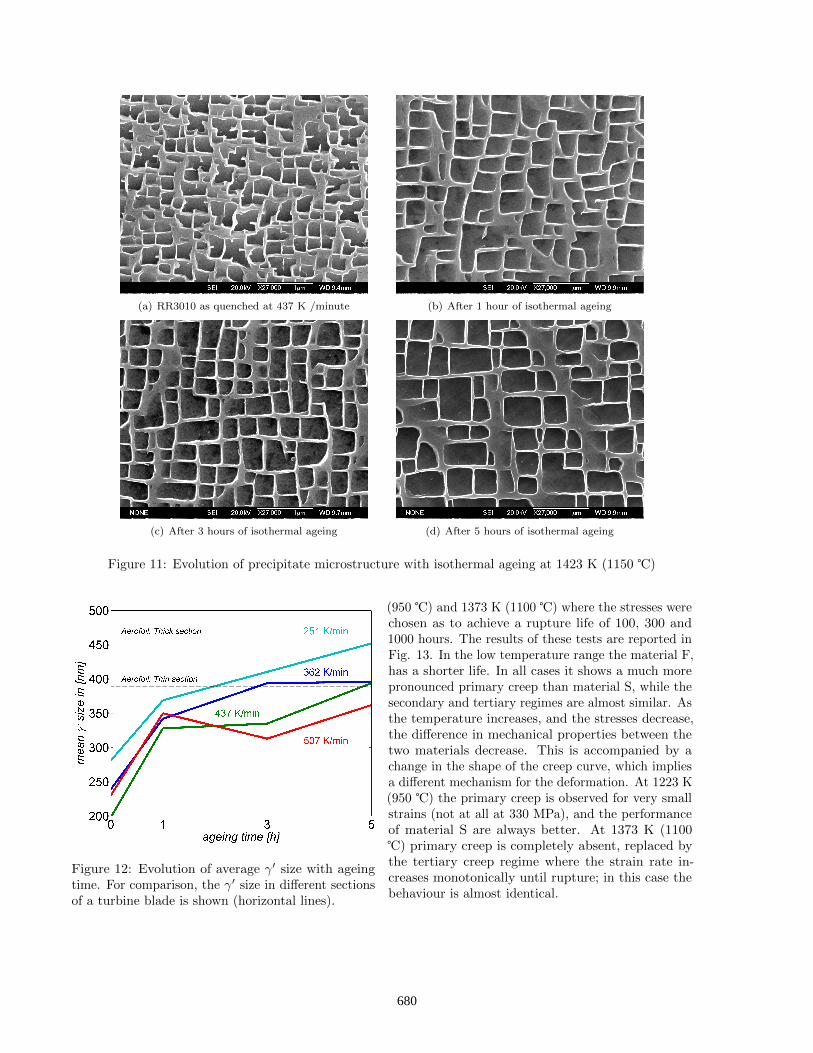
size was found to be 538 ± 81 nm. In Fig. 11 theevolution of the structure during ageing is shown. Themicrographs refer to the material quenched at 437K/minute and its subsequent ageing.
During rapid quenching small γ′ particles precipi-tate with a very irregular shape. In the subsequentageing heat treatment, the size increases sharply dur-ing the first hour and the shape alters towards cubic;thereafter the size evolves more slowly but with anincreasing tendency for the precipitates to align morestrongly along the cube directions. In the final image11-d – after 5 hours of ageing – one can see that theγ channels have become visibly more narrow. Similarconsiderations apply to the samples quenched withdifferent rates. The measured values of the precipitatesize and their evolutions are shown in Fig. 12.
Creep Tests
A matrix of creep tests was performed to investigatethe creep performances of RR3010 with different av-erage γ′ size. From the results of the analysis of Fig.12 two conditions were selected to produce materialwith a γ′ size of 300 nm (a fast quench with shortageing time) and 500 nm (a slow quench with longerageing time). The letter F (fast) and S (slow) willbe used to refer to those. Tests were performed atthree temperature, namely 1123 K (850 ℃), 1223 K
679
(a) RR3010 as quenched at 437 K /minute (b) After 1 hour of isothermal ageing
(c) After 3 hours of isothermal ageing (d) After 5 hours of isothermal ageing
Figure 11: Evolution of precipitate microstructure with isothermal ageing at 1423 K (1150 ℃)
Figure 12: Evolution of average γ′ size with ageingtime. For comparison, the γ′ size in different sectionsof a turbine blade is shown (horizontal lines).
(950 ℃) and 1373 K (1100 ℃) where the stresses werechosen as to achieve a rupture life of 100, 300 and1000 hours. The results of these tests are reported inFig. 13. In the low temperature range the material F,has a shorter life. In all cases it shows a much morepronounced primary creep than material S, while thesecondary and tertiary regimes are almost similar. Asthe temperature increases, and the stresses decrease,the difference in mechanical properties between thetwo materials decrease. This is accompanied by achange in the shape of the creep curve, which impliesa different mechanism for the deformation. At 1223 K(950 ℃) the primary creep is observed for very smallstrains (not at all at 330 MPa), and the performanceof material S are always better. At 1373 K (1100℃) primary creep is completely absent, replaced bythe tertiary creep regime where the strain rate in-creases monotonically until rupture; in this case thebehaviour is almost identical.
680

0 50 100 150 2000
10
20
30
Time [h]
Str
ain
[%]
(a) 1123 K (850 ℃) - 655 MPa
0 100 200 300 4000
5
10
15
20
Time [h]
Str
ain
[%]
(b) 1123 K (850 ℃) - 590 MPa
0 500 1000 1500 20000
5
10
15
20
25
Time [h]
Str
ain
[%]
(c) 1123 K (850 ℃) - 520 MPa
0 50 100 150 2000
10
20
30
40
Time [h]
Str
ain
[%]
(d) 1223 K (950 ℃) - 435 MPa
0 100 200 3000
10
20
30
40
Time [h]
Str
ain
[%]
(e) 1223 K (950 ℃) - 400 MPa
0 200 400 600 8000
10
20
30
40
Time [h]
Str
ain
[%]
(f) 1223 K (950 ℃) - 330 MPa
0 50 100 1500
10
20
30
Time [h]
Str
ain
[%]
(g) 1373 K (1100 ℃) - 180 MPa
0 100 200 300 4000
10
20
30
Time [h]
Str
ain
[%]
(h) 1373 K (1100 ℃) - 145 MPa
0 500 1000 15000
10
20
30
Time [h]
Str
ain
[%]
(i) 1100 ℃110 MPa
Figure 13: Creep test results. In each plot the curve relative to the fast quench (solid line) and slow quench(dashed line) are reported.
Discussion
The work reported in this paper shows how CFD sim-ulations can be used to analyse the heat treatmentprocess. Using information of heating element tem-perature and pressure drop across the furnace, themodel predicts the temperature distribution insidethe parts and the temperature history of the com-ponents including a prediction of local quench rate.Regions of high temperature, that can possibly leadto local melting, can be identified. The visualisationof the flow field shows the influence of the furnacegeometry on the homogeneity of quenching, so that amore even cooling rate can be achieved across the fur-
nace. This is fundamental to ensure that a uniformmicrostructure with uniform properties can be ob-tained. The microstructure is sensitive to the quenchrate in terms of the precipitate size, as well as the or-der of the array of cuboids. It is shown how the ageingcoarsens the structure and improves the alignment ofthe precipitates, reducing the γ channel width. Fastquench used in this work generated very fine precipi-tate sizes. Even after ageing it was possible to retaina γ′ size smaller than the one obtained in industrialprocesses. From the creep tests the effect of differentstructures on mechanical behaviour is evident. Atlow temperatures, primary creep deformation is dueto the cutting of γ′ particles, and therefore bigger
681

precipitates are more resistent to cutting [8]. Onceprimary creep is over, the creep resistance of the twomicrostructures is similar. At intermediate and hightemperature the deformation is controlled by disloca-tion activity and by the rafting phenomenon. At 1223K (950 ℃) microstructure S is stronger because thelonger ageing time gives it a more ordered structure[9]. The F material despite having a smaller precip-itate size, which should imply a smaller γ channelwidth, is much more irregular so that regions of thickγ are more common. Finally at 1373 K (1100 ℃) therafting regime is dominating the creep deformationand in this case one has to understand the effect ofthe initial γ′ size on the raft formation. Nathal [10]found that an initially irregular structure forms wavyrafts with more terminations per unit area than aninitially ordered array of precipitates. On the otherhand in this work the difference in the initial structureis much less pronounced than in Nathal’s work andtherefore there is little difference.
Conclusions
The following conclusions can be drawn from thiswork:
1. Numerical modelling has been used to simulatethe vacuum heat treatment and gas fan quenchingused for the heat treatment of turbine bladesusing computational fluid dynamics.
2. The model captures correctly the physics involvedand gives reliable predictions as shown by exper-iments. It is therefore suitable for the analysis ofthe heat treatment process and for future opti-misation in simulation-driven process design.
3. Heating and quenching stages are simulated sep-arately, to improve the numerical efficiency. Dur-ing heating the component temperature is pre-dicted, which allows homogeneity to be assessedand to identify possible locations of incipientmelting. During quenching the cooling rate isestimated as a function of the furnace parame-ters. This allows the design of the furnace to beassessed.
4. The influence of the cooling rate on the struc-ture and properties of the RR3010 superalloyhas been investigated via SEM microscopy. Theevolution of the microstructure with the ageingtime has been characterised and its impact oncreep performances has been studied.
5. The quenching technology used, allowed a widerange of precipitate sizes to be developed. Ourdata indicate that whilst the influence of particlesize on creep deformation is fairly minor at tem-peratures above 1273 K, at lower temperaturesand especially when the γ′ precipitates are sub-jected to shearing at high enough stresses, thenlarger γ′ sizes confer better properties.
Acknowledgements
The authors are grateful to the Engineering and Physi-cal Sciences Research Council (EPSRC) of the UnitedKingdom for funding under the SAMULET project.Rolls-Royce plc is acknowledged for the provision ofthe materials used for this study. The authors wouldlike also to thank Dr. Atsushi Sato and Mr. ZailingZhu for the useful discussions.
References
[1] G. E. Fuchs. Improvement of creep strength of a thirdgeneration, single-crystal Ni-base superalloy by solutionheat treatment. Journal of materials engineering andperformance, 11(1):19–25, 2002.
[2] N. Warnken, D. Ma, A. Drevermann, Roger C Reed, S.G.Fries, and I. Steinbach. Phase-field modelling of as-castmicrostructure evolution in nickel-based superalloys. ActaMaterialia, 57(19):5862–5875, November 2009.
[3] J. Svoboda, F. D. Fischer, P Fratzl, and Ernst Kozeschnik.Modelling of kinetics in multi-component multi-phase sys-tems with spherical precipitates I : Theory. MaterialsScience and Engineering A, 385(1-2):166–174, 2004.
[4] Ernst Kozeschnik, J. Svoboda, P Fratzl, and F. D. Fischer.Modelling of kinetics in multi-component multi-phase sys-tems with spherical precipitates:: II: Numerical solutionand application. Materials Science and Engineering A,385(1-2):157–165, 2004.
[5] Inc Ansys. ANSYS FLUENT Theory Guide. Knowl-edge Creation Diffusion Utilization, 15317(April):724–746,2009.
[6] J.H. Ferziger and M Peric. Computational methods forfluid dynamics, volume 3. Springer Berlin etc, 1999.
[7] James Coakley, Hector Basoalto, and David Dye. Coars-ening of a multimodal nickel-base superalloy. Acta Mate-rialia, 58(11):4019–4028, 2010.
[8] M Maldini, H Harada, Y Koizumi, T Kobayashi, andV Lupinc. Tertiary creep behaviour of a new single crys-tal superalloy at 900 deg C. Scripta Materialia(USA),43(7):637–644, 2000.
[9] Pierre Caron and T Khan. Improvement of creep strengthin a nickel-base single-crystal superalloy by heat treatment.Materials Science and Engineering, 61(2):173–184, 1983.
[10] M V Nathal. Effect of initial gamma prime size on theelevated temperature creep properties of single crystalnickel base superalloys. Metallurgical Transactions A,18(11):1961–1970, 1987.
682
![28119167 Corrosion of Superalloys[1]](https://static.fdocuments.in/doc/165x107/577d2ae91a28ab4e1eaa6cd2/28119167-corrosion-of-superalloys1.jpg)