Computational Fluid Dynamics Modeling and … · Computational Fluid Dynamics Modeling and...
7
IOSR Journal of Mechanical and Civil Engineering (IOSR-JMCE) e-ISSN: 2278-1684,p-ISSN: 2320-334X, Volume 11, Issue 2 Ver. VIII (Mar- Apr. 2014), PP 40-46 www.iosrjournals.org www.iosrjournals.org 40 | Page Computational Fluid Dynamics Modeling and Investigation of Horizontal Airflow Ventilation System in Surgical Site in Hospital S B Thool 1 , S L Sinha 2 Department of Mechanical Engineering 1 Rungta College of Engineering and Technology, Bhilai, India 2 National Institute of Technology, Raipur, India Abstract: The present paper deals with the numerical study of horizontal laminar flow ventilation system for surgical site in hospital. When the orientation of supplies openings and exhausts are altered, the performance of ventilation system in terms of effectiveness of removal of contaminated particles is also affected. In this investigation, the performance of new horizontal Single Sided Supply and Exhaust (SSSE) ventilation system have been evaluated and compared withconventional Vertical Unidirectional (Laminar) ventilation system using Computational Fluid Dynamics (CFD) technique. It has beenobserved that contaminant control is found more effective in the case of SSSE horizontal ventilating system over the Vertical Unidirectional ventilation system. It is so happened because the airflow pattern over the critical area of surgery is not affected by the overhead obstacle i.e., surgical lamp. Investigation also reveals that the thermal plume induced by the surgical wound and the surgical lamp, is not counteracted by the supply airflow pattern, which plays an important roll in positive way. Keywords: Ventilation system, Airflow pattern, Infection control, surgical site infection, CFD, Single Sided Supply and Exhaust (SSSE) ventilation system. I. Introduction In order to control the Surgical Site Infection (SSI) caused by airborne particles, application of ventilation systems is well known. Infectious particles can be effectively isolated, diluted and get escaped from surgical site through the proper distribution of ultraclean air [1]. Now a days, downwardunidirectional (laminar) flow [2] is widely adopted air distribution for creating an aseptic environment around patient [3,4]. Even though the downward unidirectional airflow pattern is recommended as a regular design, current research demonstrates some disadvantages. Overhead accessories such as medical lamps can easily affect the unidirectional airflow pattern of downward airflow and thermal plume around the wound. [5,6]. Though some methods to reduce these negative effects have been recommended adequately, some disadvantages cannot be eliminated due to the vertical unidirectional flow pattern [7]. The main influencing factor for airflow pattern is to consider the indoor obstacles, thus counteracting the function of clean air in isolating infectious particles. Facilities placed upstream of patient such as a medical lamp may cause serious whirlpool and particulate accumulation [8]. Further, the temperature of human body surface is usually higher than the one of his surrounding air, whichcauses thebuoyancy driven upward airflow plumes. This can easily disturb the downward airflow pattern formed by the ventilating system and carry infectious particles to the wound, leading to serious surgical site infection. To overcome the disadvantages of the conventional airflow pattern applied to operating room, an alternative of horizontal airflow pattern should be studied to find out its feasibility, characteristics and contamination control effect in operating room. The main sources of infectious particles and bacteria in an operating room are the surgeons relatedto their activities. Isolating patient from surgeon can effectively prevent SSI by formation of proper airflow pattern. A horizontal airflow with single sided supply and exhaust ventilation system supplying ultraclean air will avoid the obstacles, such as medical lamps. Again the horizontal airflow with a direction perpendicular to the airflow direction of thermal plume around surgeon and patient can avoid direct counteractive effect between the two airflows. The existing design of horizontal airflow system i.e. opposite sided supply and exhaust ventilation system causes a relatively long air path length. It makes it difficult to maintain a washing effect around the patient with unidirectional flow. At most time the surgical staff and necessary furniture are serious obstacles to damage the unidirectional airflow [9]. Investigating and comparing above stated ventilation system experimentally, is very costly and time consuming. Due to technological and economical difficulties found when performing and comparing experiments, numerical studies of the problem appears to be a promising method for quantifying the effect of the various parameters that influence the design of best ventilation system.
Transcript of Computational Fluid Dynamics Modeling and … · Computational Fluid Dynamics Modeling and...

IOSR Journal of Mechanical and Civil Engineering (IOSR-JMCE)
e-ISSN: 2278-1684,p-ISSN: 2320-334X, Volume 11, Issue 2 Ver. VIII (Mar- Apr. 2014), PP 40-46
www.iosrjournals.org
www.iosrjournals.org 40 | Page
Computational Fluid Dynamics Modeling and Investigation of
Horizontal Airflow Ventilation System in Surgical Site in Hospital
S B Thool1, S L Sinha
2
Department of Mechanical Engineering 1Rungta College of Engineering and Technology, Bhilai, India
2 National Institute of Technology, Raipur, India
Abstract: The present paper deals with the numerical study of horizontal laminar flow ventilation system for
surgical site in hospital. When the orientation of supplies openings and exhausts are altered, the performance of
ventilation system in terms of effectiveness of removal of contaminated particles is also affected. In this
investigation, the performance of new horizontal Single Sided Supply and Exhaust (SSSE) ventilation system
have been evaluated and compared withconventional Vertical Unidirectional (Laminar) ventilation system
using Computational Fluid Dynamics (CFD) technique.
It has beenobserved that contaminant control is found more effective in the case of SSSE horizontal
ventilating system over the Vertical Unidirectional ventilation system. It is so happened because the airflow
pattern over the critical area of surgery is not affected by the overhead obstacle i.e., surgical lamp.
Investigation also reveals that the thermal plume induced by the surgical wound and the surgical lamp, is not
counteracted by the supply airflow pattern, which plays an important roll in positive way. Keywords: Ventilation system, Airflow pattern, Infection control, surgical site infection, CFD, Single Sided
Supply and Exhaust (SSSE) ventilation system.
I. Introduction
In order to control the Surgical Site Infection (SSI) caused by airborne particles, application of
ventilation systems is well known. Infectious particles can be effectively isolated, diluted and get escaped from
surgical site through the proper distribution of ultraclean air [1]. Now a days, downwardunidirectional (laminar)
flow [2] is widely adopted air distribution for creating an aseptic environment around patient [3,4].
Even though the downward unidirectional airflow pattern is recommended as a regular design, current
research demonstrates some disadvantages. Overhead accessories such as medical lamps can easily affect the
unidirectional airflow pattern of downward airflow and thermal plume around the wound. [5,6]. Though some
methods to reduce these negative effects have been recommended adequately, some disadvantages cannot be
eliminated due to the vertical unidirectional flow pattern [7]. The main influencing factor for airflow pattern is
to consider the indoor obstacles, thus counteracting the function of clean air in isolating infectious particles.
Facilities placed upstream of patient such as a medical lamp may cause serious whirlpool and particulate
accumulation [8]. Further, the temperature of human body surface is usually higher than the one of his
surrounding air, whichcauses thebuoyancy driven upward airflow plumes. This can easily disturb the downward
airflow pattern formed by the ventilating system and carry infectious particles to the wound, leading to serious
surgical site infection.
To overcome the disadvantages of the conventional airflow pattern applied to operating room, an
alternative of horizontal airflow pattern should be studied to find out its feasibility, characteristics and
contamination control effect in operating room. The main sources of infectious particles and bacteria in an
operating room are the surgeons relatedto their activities. Isolating patient from surgeon can effectively prevent
SSI by formation of proper airflow pattern. A horizontal airflow with single sided supply and exhaust ventilation
system supplying ultraclean air will avoid the obstacles, such as medical lamps. Again the horizontal airflow
with a direction perpendicular to the airflow direction of thermal plume around surgeon and patient can avoid
direct counteractive effect between the two airflows.
The existing design of horizontal airflow system i.e. opposite sided supply and exhaust ventilation
system causes a relatively long air path length. It makes it difficult to maintain a washing effect around the
patient with unidirectional flow. At most time the surgical staff and necessary furniture are serious obstacles to
damage the unidirectional airflow [9].
Investigating and comparing above stated ventilation system experimentally, is very costly and time
consuming. Due to technological and economical difficulties found when performing and comparing
experiments, numerical studies of the problem appears to be a promising method for quantifying the effect of
the various parameters that influence the design of best ventilation system.
Computational Fluid Dynamics Modeling and Investigation of Horizontal Airflow Ventilation System
www.iosrjournals.org 41 | Page
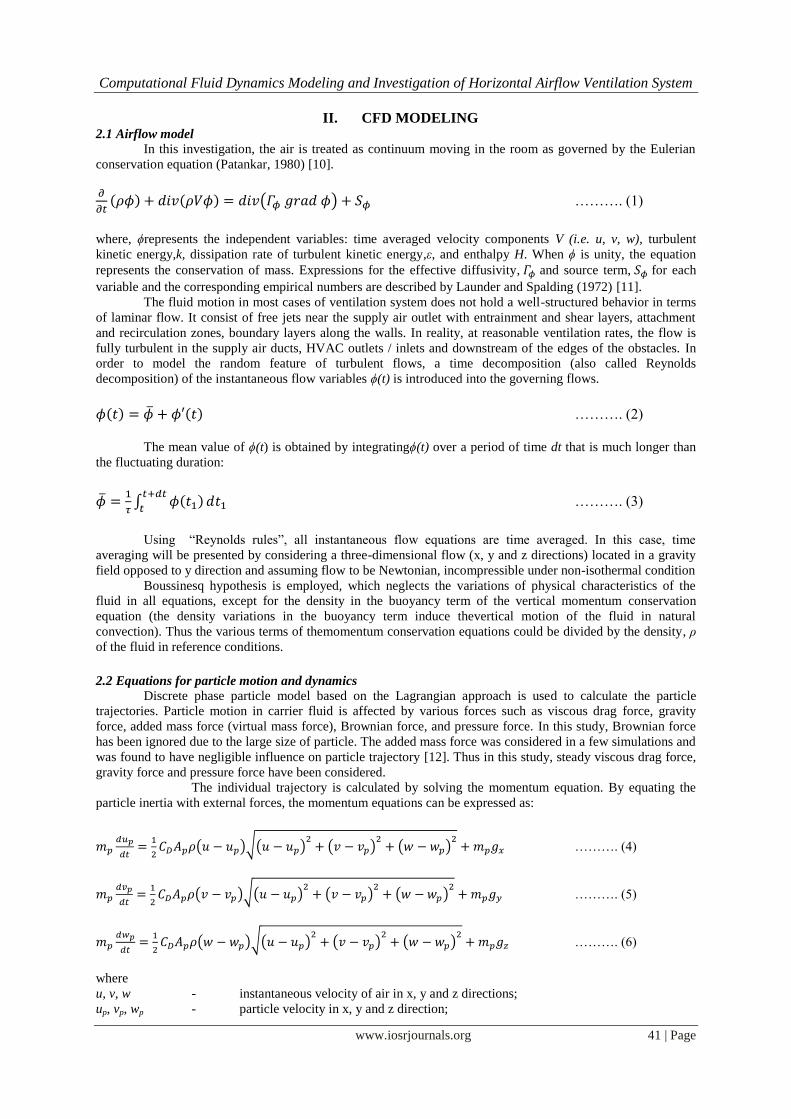
II. CFD MODELING 2.1 Airflow model
In this investigation, the air is treated as continuum moving in the room as governed by the Eulerian
conservation equation (Patankar, 1980) [10].
( ) ( ) ( ) ………. (1)
where, ϕrepresents the independent variables: time averaged velocity components V (i.e. u, v, w), turbulent
kinetic energy,k, dissipation rate of turbulent kinetic energy,ε, and enthalpy H. When ϕ is unity, the equation
represents the conservation of mass. Expressions for the effective diffusivity, and source term, for each
variable and the corresponding empirical numbers are described by Launder and Spalding (1972) [11].
The fluid motion in most cases of ventilation system does not hold a well-structured behavior in terms
of laminar flow. It consist of free jets near the supply air outlet with entrainment and shear layers, attachment
and recirculation zones, boundary layers along the walls. In reality, at reasonable ventilation rates, the flow is
fully turbulent in the supply air ducts, HVAC outlets / inlets and downstream of the edges of the obstacles. In
order to model the random feature of turbulent flows, a time decomposition (also called Reynolds
decomposition) of the instantaneous flow variables ϕ(t) is introduced into the governing flows.
( ) ( ) ………. (2)
The mean value of ϕ(t) is obtained by integratingϕ(t) over a period of time dt that is much longer than
the fluctuating duration:
∫ ( )
………. (3)
Using “Reynolds rules”, all instantaneous flow equations are time averaged. In this case, time
averaging will be presented by considering a three-dimensional flow (x, y and z directions) located in a gravity
field opposed to y direction and assuming flow to be Newtonian, incompressible under non-isothermal condition
Boussinesq hypothesis is employed, which neglects the variations of physical characteristics of the
fluid in all equations, except for the density in the buoyancy term of the vertical momentum conservation
equation (the density variations in the buoyancy term induce thevertical motion of the fluid in natural
convection). Thus the various terms of themomentum conservation equations could be divided by the density, ρ
of the fluid in reference conditions.
2.2 Equations for particle motion and dynamics
Discrete phase particle model based on the Lagrangian approach is used to calculate the particle
trajectories. Particle motion in carrier fluid is affected by various forces such as viscous drag force, gravity
force, added mass force (virtual mass force), Brownian force, and pressure force. In this study, Brownian force
has been ignored due to the large size of particle. The added mass force was considered in a few simulations and
was found to have negligible influence on particle trajectory [12]. Thus in this study, steady viscous drag force,
gravity force and pressure force have been considered.
The individual trajectory is calculated by solving the momentum equation. By equating the
particle inertia with external forces, the momentum equations can be expressed as:
( )√( )
( )
( )
………. (4)
( )√( )
( )
( )
………. (5)
( )√( )
( )
( )
………. (6)
where
u, v, w - instantaneous velocity of air in x, y and z directions;
up, vp, wp - particle velocity in x, y and z direction;

Computational Fluid Dynamics Modeling and Investigation of Horizontal Airflow Ventilation System
www.iosrjournals.org 42 | Page
xp, yp, zp - movement of particle in x, y and z direction;
gx, gy, gz - acceleration due to gravity in x, y and z directions;
Ap - cross-sectional area of the particle;
mp - mass of particle;
- density of the particle;
CD - drag coefficient;
dt - time interval.
where
(
)
for Re 560; ………. (7)
and
…. for Re 560
The Reynolds number of the particle is based on the relative velocity between particle and air.
In laminar flow, particles released from a point source with the same weight would initially follow the airstream
in the same path and then fall under the effect of gravity. Unlike laminar flow, the random nature of turbulence
indicates that the particles released from the same point source will be randomly affected by turbulent eddies.
As a result, it will be diffused away from the streamline at different fluctuating levels. In order to model the
turbulent diffusion, the instantaneous fluid velocities in the three Cartesian directions u, v and w are
decomposed into the mean velocity component and the turbulent fluctuating component as:
; ;
where, and u’ are the mean and fluctuating components of velocity in x – direction. The same applies for y and
z directions. The stochastic approach prescribes the use of a random number generator algorithm, which, in this
case, is taken from Press et al. [13] to model the fluctuating velocity. It is achieved by using a random sampling
of a Gaussian distribution with a mean of zero and a standard deviation of unity. Assuming isotropic turbulence,
the instantaneous velocity of air are then calculated from kinetic energy of turbulence:
;
WhereN is the pseudo-random number, ranging from 0 to 1, with
(
)
………. (8)
The mean velocity, which are the direct output of CFD, determine the convection of the
particles along the streamline, while the turbulent fluctuating velocity, N, contributes to the turbulent diffusion
of the particle.
III. Validation & Flow Visualization The validation of the pattern of airflow by CFD softwareis done by the flow visualization. The
geometrical structure of the model room is constructed with width, depth and height of the room as 100 cm, 50
cm and 38 cm respectively. Within the model room, a partition with a height of 19 cm is located in the middle of
the room. Air is allowed to enter the model room through one ceiling inlet vent through duct and to leave
through the other ceiling outlet vent.
Air along with the smoke produced from burning incense stick enters the test model room through the
diffuser of airflow facility. Smoke follows the path of mainstream since its density is approximately same as that
of air and it does disturb the airflow pattern appreciably. The photographs of the streamline pattern were taken
for each test run. Reynolds number and Grashof number were calculated and results of the numerical simulation
for three-dimensional, steady and laminar flow have been obtained. Streamlines contours (Fig. 1) obtained from
numerical simulation and photograph of smoke flow (Fig. 2) have been found similar. The recirculating cells on
either sides of the main stream have been seen by the naked eyes but could not be captured by the camera due to
lack of sufficient amount of smoke in these regions.

Computational Fluid Dynamics Modeling and Investigation of Horizontal Airflow Ventilation System
www.iosrjournals.org 43 | Page
Fig. 1 Streamlines of air distribution in model room
Fig. 2 Flow Visualization Using Smoke
IV. Brief Of Operating Room
In a typical operating room layout,five surgical staff members, lights, machinery, tables and patient are
considered for the baseline model for the CFD simulations. The brief description of operating room is given in
the Fig. 3 and Table 1.The size of each inlet and exhaust grille is 0.61m x 0.36m. Surgical site (wound area) and
back table is considered to be the critical area. The most suitable operating value of ACH for this system is
ranging from 60 h-1
to 65 h-1
. The present CFD simulation is done taking ACH as 63 h-1
and air velocity as 0.14
m/s with temperature as 27 C°.
Fig. 3 Baseline model of the operating room

Computational Fluid Dynamics Modeling and Investigation of Horizontal Airflow Ventilation System
www.iosrjournals.org 44 | Page
Table 1
Dimension of operating room and other available items Item Dimensions
Operating table 0.64 m x 2.0 m x 0.9 m
Surgical lamp 0.55 m x 0.55 m x 0.1 m
Anesthesia machine 0.6 m x 0.6 m x 1.1 m
Back table 0.64 m x 1.6 m x 0.9 m
Monitor stand 0.6 m x 0.5 m x 1.20 m
Monitor 0.5 m x 0.4 m x 0.6 m
Surgical staff (Two surgeon and
three nurses)
0.46 m x 0.28 m x 1.8 m each
Patient 0.46 m x 0.28 m x 1.8 m
V. Boundary Conditions
The velocity, temperature and turbulent transport quantities over the inlet boundary are prescribed from
the experimental data found by Memarzadeh and Manning [14]. Outlet boundary conditions are set as the
Neumann boundary condition. No slip boundary condition has been used at the wall. Wall functions are applied
to describe the turbulent flow properties in the near wall reason.
The initial conditions for particle tracking include the starting position and initial velocities of particles.
For this study, the particles are assumed as skin flakes generated from the foreheads of the surgical staff
members having the densityofP = 850 kg/m3. Size of particle is selected as15microns diameter [14]. The
representative number of particles generated is 512 for 1 hour of surgery [14]. Other boundary conditions
regarding the rate of generation of contaminant particles, heat generations from equipment and human bodies
havebeen illustrated in Fig. 4. When particles reach air supply inlets or exhaust outlets, they will escape and the trajectories terminate.
When reaching a rigid object, particles may either attach to or rebound from the object’s surface. Particles in a
ventilated room are most likely to attach to the surface since they usually cannot accumulate enough rebound
energy to overcome adhesion [15]. It is therefore natural to terminate, or “trap”, a particle trajectory after hitting
a rigid surface. This treatment was adopted and used in many CFD studies of the indoor environment.
The trap treatment, however, is not suitable for the current situation, which uses a high Reynolds
number k-ε model. Instead of using trap treatment, this study set the restitution coefficient to a very small value.
By doing so, particles were immediately stopped without being trapped after reaching a surface. When particles
acquired sufficient normal velocity, they escaped from the boundary layer and became re-suspended. This
implies that deposition is neglected. Such manipulation may only be suitable when particle deposition rate is
very low.
Fig. 4 Boundary Conditions
VI. Modeling procedures The CFD solver FLUENT 6.0 [16] has been used to numerically solve the Navier-Stokes equations.
This solver has a finite volume solution scheme for the mean momentum, energy, and turbulent transport
equations.As part of the same package, a pre-processor GAMBITis used to generate the required grid for the
solver. An unstructured grid with rectangular elements is used. The whole surgical side domain has been divided
into 629762 equally spaced elements as shown in figure 5. The turbulence model used in this work is based on a
two-equation model (i.e., a standard k-ε model from Launder and Spanlding [11]). Incompressible flow is
assumed; thus the use of a segregated solver is adequate. The schemes selected to perform computations
is“second-order upwind implicit”. The SIMPLE method is selected to solve the pressure-velocity coupling.

Computational Fluid Dynamics Modeling and Investigation of Horizontal Airflow Ventilation System
www.iosrjournals.org 45 | Page
Particle tracking for turbulent dispersion of particles in a turbulent flow is calculated by using
stochastic model of FLUENT 6.0. Number of tries of particle tracking was set to 8 to get the representative
number of 512 released particles from each source since surface element size was having 64 elements
generating each particle.
Fig. 5Mesh used for the operating room
VII. Numerical Results Figure 6 shows the numerical result of CFD simulation. It shows that SSSE ventilation system provides
the shorter path length across the occupied area. This will effectively isolate patient from the operating staff and
dilute the contaminated particles to escape from the operating room.
In particles trajectory perspective, 87.8% particles generated from surgeons and 95.1% particles
generated from nurses have been escaped from the operating room out of 512 representative numbers of
particles. This system exhibits very good performance in terms of number of particles strike on wound area (i.e.
no particles strikes on wound area).
(a) Streamlines of airflow (b) Velocity distribution
(c) Velocity contours (d) Particle trajectory
Fig. 6 Numerical Simulation of SSSE system (Top view)
Path Lines Colored by Velocity Magnitude (m/s)FLUENT 6.0 (3d, dp, segregated, ske)
Dec 10, 2013
5.50e-01
4.95e-01
4.40e-01
3.85e-01
3.30e-01
2.75e-01
2.20e-01
1.65e-01
1.10e-01
5.50e-02
0.00e+00
Z
Y X
Velocity Vectors Colored By Velocity Magnitude (m/s)FLUENT 6.0 (3d, dp, segregated, ske)
Dec 10, 2013
5.56e-01
5.00e-01
4.45e-01
3.89e-01
3.34e-01
2.78e-01
2.23e-01
1.67e-01
1.11e-01
5.58e-02
2.44e-04
Z
Y X
Contours of Velocity Magnitude (m/s)FLUENT 6.0 (3d, dp, segregated, ske)
Dec 10, 2013
5.50e-015.32e-015.13e-014.95e-014.77e-014.58e-014.40e-014.22e-014.03e-013.85e-013.67e-013.48e-013.30e-013.12e-012.93e-012.75e-012.57e-012.38e-012.20e-012.02e-011.83e-011.65e-011.47e-011.28e-011.10e-019.17e-027.33e-025.50e-023.67e-021.83e-020.00e+00
Z
Y X
Particle Traces Colored by Particle Diameter (m)FLUENT 6.0 (3d, dp, segregated, ske)
Mar 27, 2014
1.50e-05
1.50e-05
1.50e-05
1.50e-05
1.50e-05
1.50e-05
1.50e-05
1.50e-05
1.50e-05
1.50e-05
1.50e-05
Z
Y X
Computational Fluid Dynamics Modeling and Investigation of Horizontal Airflow Ventilation System
www.iosrjournals.org 46 | Page
VIII. Conclusion Horizontal airflow pattern can provide an important alternative to operating room ventilation airflow
design. When the air supply and exhaust facilities are installed on the same lateral wall to generate a horizontal
unidirectional flow ventilation in the operating room, the medical lamp and thermal plume induced by
temperature difference between people and environment have no obvious influence on the airflow pattern of the
occupant area, and the airflow pattern is easy to keep unidirectional. This system performs well in avoiding the
influence of the surgeons to the patient. Particles released by surgeons can be wiped off effectively, without
leading to the increase of the particle concentration surroundingthe patient. The risk of the post-operative
infection can thus be decreased significantly. The relative position of source and layout of the operating room
highly influence the particle concentration surrounding the patient. Low particle concentration surrounding the
patient, especially around the wound area can be maintained by prescribing the direction of the patient correctly,
according to the character of the surgical. The main principle to set the layout is to make sure that the main
source of particle is in a downstream location of the wound area.
REFERENCES [1] Health care facilities. In: ASHRAE handbook. American Society of Heating, Refrigerating and Air-conditioning Engineers; 1999
[chapter 7].
[2] Humphreys H. Infection control and the design of a new operating theatre suite. The Journal of Hospital Infection 1993;23(1):61–70.
[3] Sehulster L, Chinn R, Guidelines for environmental infection control in health- care facilities : Recommendations of CDC and the
Healthcare Infection Control Practices Advisory Committee (HICPAC). Morbidity and Mortality Weekly Report 2003; 52(10):1–42. Available at http://www.cdc.gov/mmwr/preview/mmwrhtml/rr5210a1.htm.
[4] Monika W, Joseph V, te phane M. Diagonal air-distribution system for operating rooms: experiment and modeling. Building and
Environment2004;39(10):1171–8. [5] Ling J, Study on ventilation system of operating room, School of EnvironmentScience and Technology, Tianjin University; 2005 [in
Chinese].
[6] Chow TT&Yang XY, Ventilation performance in the operating theatre against airborne infection: Numerical study on an ultra-clean system. Journal of Hospital Infection 2005;59:138–147.
[7] e nde , Jose J , illafruela J M, Castro F, Optimization of a hospital room by means of CFD for more efficient ventilation,
Energy and Buildings, 2007;40(5):849–854. [8] Chow TT, Yang XY, Performance of ventilation system in a non-standard operating room, Building and Environment,
2003;38(12):1401–1411.
[9] Junjie Liu*, Haidong Wang &Wenyong Wen, Numerical simulation on a horizontal airflow for airborne particles control in hospital operating room, Building and Environment, 44, (2009), 2284–2289.
[10] Patankar, S V, Numerical Heat Transfer and Fluid Flow, McGraw Hill, Washington, (1980).
[11] Launder, B E, Spalding, D B, 1972, Lectures in Mathematical Models of Turbulence. Academic Press, London, England. [12] Sinha, S L, Arora, R C and Subhransu Roy, Numerical Simulation of Two Dimensional Room Air Flow with and Without
Buoyancy, Energy And Buildings, 32(1), pp. 121–129 (2000).
[13] Press, W H, Teukolsky, S A, Vetterling W T and Flannary B P, Numerical recipes in FORTRAN, Second edition, Cambridge, Cambridge University Press, (1992).
[14] FarhadMemarzadeh, Andrew P. Manning, Comparison of Operating Room Ventilation Systems in the Protection of the Surgical
Site. [15] Hinds W C, Aerosol Technology, Properties, Behavior, and Measurement of Airborne Particles. Wiley, New York, (1982).
[16] FLUENT, Fluent 6.0 User’s guide. luent Inc., Lebanon, NH.