Computational Design of Synthetic Antibodies for Consumer ...
36
Santa Clara University Scholar Commons Bioengineering Senior eses Engineering Senior eses 6-6-2016 Computational Design of Synthetic Antibodies for Consumer Diagnostic Tests Jon Henry erriault Santa Clara Univeristy omas Evans Santa Clara Univeristy Follow this and additional works at: hps://scholarcommons.scu.edu/bioe_senior is esis is brought to you for free and open access by the Engineering Senior eses at Scholar Commons. It has been accepted for inclusion in Bioengineering Senior eses by an authorized administrator of Scholar Commons. For more information, please contact [email protected]. Recommended Citation erriault, Jon Henry and Evans, omas, "Computational Design of Synthetic Antibodies for Consumer Diagnostic Tests" (2016). Bioengineering Senior eses. 41. hps://scholarcommons.scu.edu/bioe_senior/41
Transcript of Computational Design of Synthetic Antibodies for Consumer ...

Santa Clara UniversityScholar Commons
Bioengineering Senior Theses Engineering Senior Theses
6-6-2016
Computational Design of Synthetic Antibodies forConsumer Diagnostic TestsJon Henry TherriaultSanta Clara Univeristy
Thomas EvansSanta Clara Univeristy
Follow this and additional works at: https://scholarcommons.scu.edu/bioe_senior
This Thesis is brought to you for free and open access by the Engineering Senior Theses at Scholar Commons. It has been accepted for inclusion inBioengineering Senior Theses by an authorized administrator of Scholar Commons. For more information, please contact [email protected].
Recommended CitationTherriault, Jon Henry and Evans, Thomas, "Computational Design of Synthetic Antibodies for Consumer Diagnostic Tests" (2016).Bioengineering Senior Theses. 41.https://scholarcommons.scu.edu/bioe_senior/41


1
Computational Design of Synthetic Antibodies for Consumer Diagnostic Tests
By:
Jon Henry Therriault & Thomas Evans
Senior Design Project Report
Submitted to The Department of Bioengineering
Of
SANTA CLARA UNIVERSITY
Be Accepted in Partial Fulfillment of the Requirements for the
degree of Bachelor of Science in Bioengineering
Santa Clara, California June 9th, 2016

2
Computational Design of Synthetic Antibodies for Consumer Diagnostic Tests
Jon Henry Therriault & Thomas Evans
Department of Bioengineering
Santa Clara University 2016
Abstract
Described herein is a novel workflow for the synthesis of engineered peptide
biomolecules that mimic the function and activity of monoclonal antibodies. The technique uses
computational design and unnatural amino acid chemistry to deliver a comparable alternative to
monoclonal antibodies. The software package Chimera8, developed at UCSF for molecular
visualization and open-source for academic licenses, was used to select hits from a library of
peptides that had strong predicted binding to disease biomarkers. Each candidate peptide was
scored based on electrostatic interactions with the target and ranked in order of predicted binding
affinity.
The top hits were then engineered to include an l-DOPA unnatural amino acid as
described previously10, which will form a covalent link to the target biomarker upon oxidation.
The engineered peptide was then recombinantly expressed and purified from E. coli cell culture.
The resulting synthetic antibody achieves target specificity from the peptide backbone and
affinity from the covalent cross-linker, which rivals the specificity and affinity of traditional
monoclonal antibodies. This technology presents an alternative to monoclonal antibody
production, avoiding outsourced and intensive production and quality control.

3
Acknowledgements
Zhiwen (Jonathan) Zhang, Ph.D
Aiko Umeda, Ph.D
Allia Griffin, Ph.D
Griffin Cook, BS
Santa Clara School of Engineering
Santa Clara School of Bioengineering Department
Santa Clara University Undergraduate Programs Senior Design Project Fund
4
Table of Contents Abstract....................................................................................................................................................2
Acknowledgements.................................................................................................................................3
List of Figures..........................................................................................................................................6
Abbreviations..........................................................................................................................................7
Introduction.............................................................................................................................................8Motivation..........................................................................................................................................................8Previous Technological Advancements........................................................................................................9Commercial Production of mAb.................................................................................................................10Ethical Considerations...................................................................................................................................11
Proposed System..................................................................................................................................13Proposal............................................................................................................................................................13Project Flow.....................................................................................................................................................13Target Biomarker...........................................................................................................................................13
Materials & Methods..........................................................................................................................15Molecular Docking.........................................................................................................................................15DNA Cloning....................................................................................................................................................17Co-Transformation.........................................................................................................................................19Protein Over-Expression...............................................................................................................................20Purification Protocol......................................................................................................................................20SDS-PAGE.......................................................................................................................................................21
Results....................................................................................................................................................22Sequential Co-Transformation....................................................................................................................24
Discussion..............................................................................................................................................28Established Future Workflow......................................................................................................................28
Conclusion.............................................................................................................................................30
References.............................................................................................................................................32

5
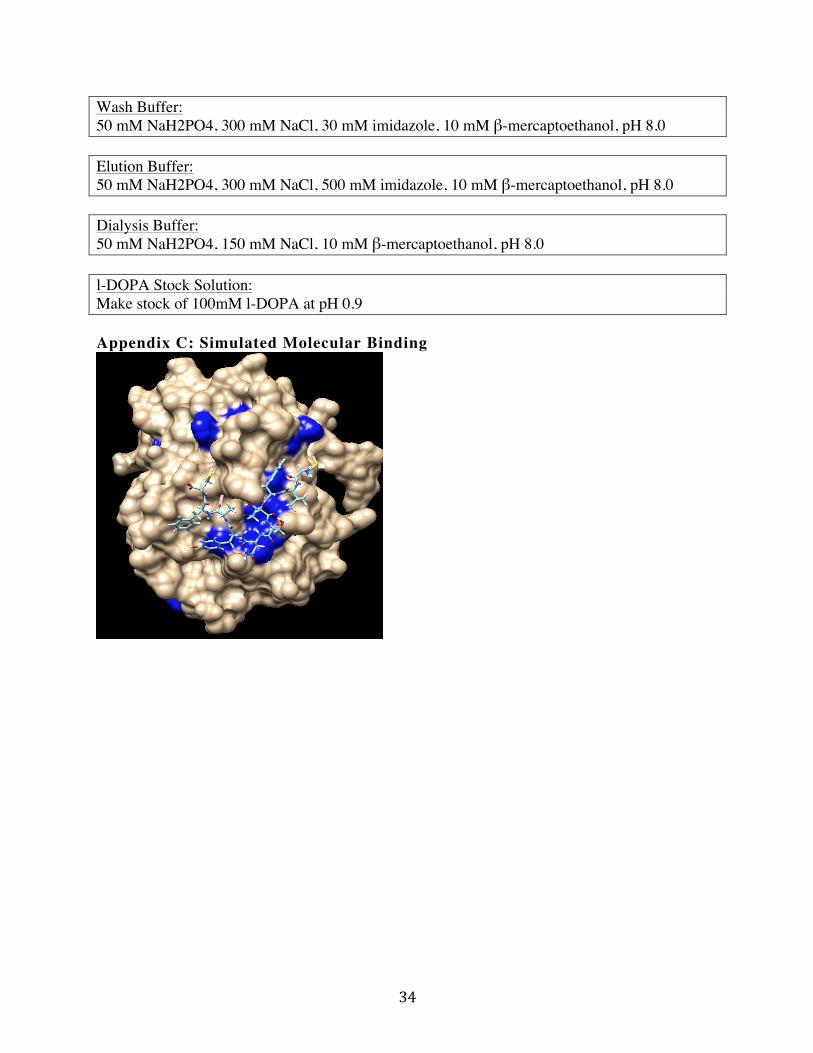
Appendices............................................................................................................................................33Appendix A: Budget.......................................................................................................................................33Appendix B: Buffers.......................................................................................................................................33AppendixC:SimulatedMolecularBinding...........................................................................................34

6
List of Figures
Figure 1 ........................................................................................................................................... 8
Figure 2 ........................................................................................................................................... 9
Figure 3.. ....................................................................................................................................... 10 Figure 4 ......................................................................................................................................... 13
Figure 5 ......................................................................................................................................... 15
Figure 6 ......................................................................................................................................... 15 Figure 7 ......................................................................................................................................... 16
Figure 8 ......................................................................................................................................... 16 Figure 9 ......................................................................................................................................... 17
Figure 10 ....................................................................................................................................... 18
Figure 11 ....................................................................................................................................... 19 Figure 12 ....................................................................................................................................... 23
Figure 13 ....................................................................................................................................... 23 Figure 14 ....................................................................................................................................... 24
Figure 15 ....................................................................................................................................... 25
Figure 16 ....................................................................................................................................... 25 Figure 17 ....................................................................................................................................... 26

7
Abbreviations
Ca: Calcium
CIP: Calf Intestinal Phosphatase
E. coli: Escherichia coli
GFP: Green Fluorescent Protein
GMP: Good Manufacturing Practice
His-Tag: poly-histidine amino acid motif
i.p. injection: Intraperitoneal injection
IPTG: Isopropyl β-D-1-thiogalactopyranoside
kDA: kilo Dalton
Kan: Kanamycin
Kd: Dissociation equilibrium constant
l-DOPA: l-3, 4-dihydroxyphenylalanine
mAb: Monoclonal antibodies
MW: Molecular weight
NEB: New England Biolabs
OD: Optical Density
PDB file: Program database proprietary file
PSA: Prostate Specific Antigen
P1: Peptide one
P2: Peptide two
Rpm: Revolutions per minute
SDS-PAGE: Sodium Dodecyl Sulfate Polyacrylamide Gel Electrophoresis
Tet: Tetracycline
TAG: Amber Stop codon
UV: Ultraviolet

8
IntroductionMotivation Recently, applications for mAb in both the bio-device and therapeutic industries have
multiplied because mAb represent the commercial gold standard of high specificity and affinity
for selected targets. Currently there is no other technology that can achieve comparable
specificity and affinity for broad biological targets9. Examples of diagnostic applications that use
mAb include ELISA assays, western blots, and transducer-based assays9. Of greatest relevance to
our technology are transducer-based assays, which are used for basic health and drug panels,
diabetes assessments, and cancer screenings. These diagnostic devices are heavily reliant on the
plurality and specificity that mAb technology offers.
A schematic for the transducer-based assay is shown in Figure 1. In this particular
application, the mAb is used as a capture system that will selectively bind its antigen from the
liquid phase. Importantly, a collection of different mAb can be immobilized on the transducer
surface to collect a broader panel of liquid phase substrates. mAb-antigen binding in
heterogeneous phase produces a measurable response in the conductive transducer that can be
amplified and measured as an electrical signal.
The general design has been further developed and applied to the quantification of
disease biomarkers in the blood as well as the quantification of in vitro binding affinities. The
crucial mAb that form the capture system can easily be interchanged with synthetic antibodies,
which will provide the same specificity and affinity while avoiding the serious pitfalls of
Figure 1. Transducer-based assay demonstrating heterogeneous mAb-antigen interaction.

9
producing and using mAb technology. This general schema will be the blueprint for diagnostic
tests using synthetic antibodies.
Previous Technological Advancements The basis for this novel diagnostic innovation builds upon previous research by the
Umeda, et. al group who developed a method for incorporating unnatural amino acid cross-
linkers into protein probes10. Incorporation of a redox-active amino acid like l-DOPA allows for
binding to the target protein through a covalent link11. The potential for such a technological
platform hinges on the effectiveness of l-DOPA incorporation and the simplicity of co-
translational expression of this mutated peptide. Umeda, et. al were successful in showing the
increased binding affinity of the protein antigens TOP1 and BOT1 to the Ab1 SH3 binding
domain10.
The key development that makes this technology so powerful was the engineering of a
mutant tRNA synthetase that carries the unnatural amino acid l-DOPA. The mutant tRNA
synthetase recognizes the TAG amber stop codon. The engineered tRNA synthetase thus
introduces a bio-orthogonal pathway in which the expressed synthetase selectively incorporates
l-DOPA at the site of the amber TAG codon in vivo12. Because the unnatural amino acid
technology is expressed in an easily-managed Escherichia coli host, the costs of operation and
production are maintained at very low levels. Additionally, because unnatural amino acid
incorporation is contingent only on the presence of the TAG stop codon, it can be applied to any
protein of peptide. The proven success of this technology is essential, as it allows synthetic
antibodies to be a possible and viable alternative to mAb for applications within the diagnostics
field.
Figure 2. l-DOPA structure and incorporation into peptide for specific covalent linkage to target protein with high specificity.

10
Commercial Production of mAb mAb are the current commercial standard and preferred technology for engineering
capture systems, and as a result, a robust infrastructure for producing mAb has been established
in the industry. The two major methods for production that are currently used are an in vivo
method known as Ascites Induction3, and an in vitro method known as High Density Culture
Systems4. Ultimately, the goal of production in this field is to achieve high yield, ensure stability
during storage, and prevent contamination of the isolated antibodies.
Figure 3. Four phase process for production and preparation of mAb for commercial availability within a six-month timetable.
Ascites Induction, as observed in Figure 3, involves a four-phase workflow that requires
roughly 6 months for a commercial mAb to come to fruition. Production begins with the
preparation of the antigen, an initial and vital step to subsequently generate antibody production.
Antigen preparation requires that extensive studies be conducted in order to ensure that the
desired immune response will be stimulated in the host without consequential toxicity issues3.
Then there must be proper purification of the antigen prior to immunization, a potentially costly
process. Following antigen preparation, the animal specimens are primed with an i.p. injection3
that suppresses the immune system and prevents clearance of hybridoma cells from the local site.
At this stage in the induction process, constant screening and monitoring of the specimens are
required in order to evaluate ascites development and identify possible illnesses that occur in
host3.
The in vitro method for mAb production, termed High Density Culture Systems, begins
with cell line generation and selection4. With subsequent design and engineering of the

11
appropriate clone and product synthesis, the development of a commercial cell culture process
will be developed to scale-up production. During this period, many studies are fulfilled to
establish and validate a manufacturing process with optimal fermentation and reactor design4.
High Density Culture Systems production procedure is neither as efficient nor as widely
used as the in vivo method, but it is becoming a more viable and increasingly developed
procedure. Still, this technology experiences many difficulties in the form of scale-up due to the
instability of the cell lines on such a large scale and inconsistencies in the raw materials used in
culture. But, due to ethical concerns, more energy has been focused on developing the in vitro
production methods. The increased research being done on in vitro production methods will help
to develop a process that is more efficient and has an overall yield that can compete with in vivo
ascites induction.
Ethical Considerations
As mentioned previously, mAb are widely used due to their unrivaled specificity and
affinity. However, as with any technology, there are still serious pitfalls that prevent mAb from
delivering on the expectations that researchers originally presented. Many of the flaws of mAb
technology result from the methods of production that are currently used. The use of live species
like mice and rabbit as hosts for production of mAb requires the manipulation of specimen
immune systems and responses, and comes with unfortunate consequences. Potential harm and
mistreatment of the animals is a constant concern for such a procedure, largely due to ascite
formation3 within the animals, which is life threatening.
There are technical concerns that have important ethical ramifications as well, primarily
due to inconsistencies in quality control9. A commercial product synthesized on a large scale
from the in vivo method has the potential to have large variations in effect and specificity. As a
result, bio-devices like transducer-based assays will yield varying results. This batch-to-batch
inconsistency is unacceptable for a bio-device, which promises to deliver trustworthy diagnoses
to patients. Medical practitioners, and even companies who design the bio-devices, have no
means of ensuring that false-negatives and false-positives are minimized due to the fact that
production and quality control has been outsourced to external mAb producers. The inability to
have some sort of quality control at the user level to determine the performance or specificity of
the product makes for a wildly incomprehensive system. Companies making diagnostic bio-

12
devices with mAb cannot therefore claim to have honorable ethical codes while supplying these
inaccurate devices to their trusting patients.
Based on this assessment of the current commercial technology for producing mAb for
diagnostic tools, the production of synthetic antibodies is a promising alternative for this field.
The ability to easily engineer these peptide probes across a wide spectrum of biomarkers with
high specificity makes this a viable technology, especially with its low cost and less demanding
process platform. Additionally, the ability to produce synthetic antibodies in-house means this
comparable functional biomolecule can avoid most of current production issues and ethical
consequences of mAb. This report takes into account the current production practices of mAb as
well as the performance of mAb, and proposes a novel system to address the serious ethical
concerns about mAb without compromising their unparalleled effectiveness in diagnostic bio-
devices.

13
Proposed System Proposal Having identified numerous pitfalls to the use of monoclonal antibodies in bio-devices,
herein is proposed a system for generating synthetic antibodies that mimic the function and
activity of monoclonal antibodies. This novel platform utilizes a computationally designed and
chemically engineered peptide that can achieve the specificity and affinity of monoclonal
antibodies10. This system will offer in-house quality control and a lower production cost,
therefore producing a more affordable product that will ultimately contribute to a personalized
healthcare system accessible to all patients.
Project Flow The proposed project has been broken down into three distinct phases, which are outlined
in Figure 4 below. The deliverables for each phase are as follows: select a cancer biomarker with
known peptide antigens, produce a synthetic peptide antibody with an unnatural amino acid, and
perform validation studies.
Target Biomarker In order to establish a viable proof of concept for synthetic antibody technology, a well-
known biomarker was chosen for evaluation. Prostate Specific Antigen (PSA/KLK3)2 is a
canonical biomarker of prostate cancer. One of the first clinical cancer biomarkers used for
diagnostics, KLK3 levels are now regularly screened on men over the age of 40. A blood KLK3
concentration over 4 ng/mL indicates a likelihood of prostate cancer, and is the threshold for
recommending prostate biopsies. Traditionally, capture systems for KLK3 have been designed
using anti-KLK3 monoclonal antibodies. KLK3 antibodies are produced and extracted from
PhaseI:BiomarkerSelection
ProstateSpeci7icAntigen(KLK3)
Designofexpressionvector
PhaseII:ComputationalDesignofPeptideLigand(synthetic
antibody)
ChimeraComputationalSoftware
Introduceunnaturalaminoacidcrosslinker
PhaseIII:AfNinityTestsforPSAandDesignedSyntheticAntibody
Invitroquanti7icationofPSA-syntheticantibodyaf7inity
Figure 4. A detailed diagram of the three-phase project flow.

14
rabbit or mouse serum. The affinity of such antibodies is described by the Kd, which in most
cases reaches the pico molar magnitude, indicating very high affinity between the antibody and
the KLK3 antigen.
The clinical relevance of KLK3 and its status as one of the first known biomarkers makes
it an excellent model to use in evaluating synthetic antibody technology. As a well-studied
biomarker, the structure of KLK36 is known, and there are many literature-cited peptides that
bind to KLK3 with known affinities. By comparing the Kd of the engineered synthetic antibody
to that of known literature values, a determination can be made on the fold improvement for the
engineered synthetic antibody. This will give a measure on the effectiveness of synthetic
antibodies.

15
Materials & Methods Molecular Docking The molecular visualization tool Chimera is compatible with several open source APIs
that run on the same platform. Binding analysis was performed using an API developed at UC
Berkley called Dock 6.71. Dock, through a series of algorithms, generates allowed binding
conformations for molecular pairs5. Originally developed to screen the binding of small
molecules to protein surfaces, the software has been adapted to screen a library of peptides
against KLK3.
First, the crystal structure of KLK3 was identified6. It was prepared for binding by
assigning atom types and charges to each atom in the KLK3 protein as depicted in Figure 5.
From this file, a further DMS file is generated that contains information on all of the atoms and
their respective chemistries (Figure 6). Each dot in the image corresponds to an atom that has a
specific electrostatic and chemical property assigned to it. The DMS file is the primary input for
generating a scoring grid that is used to evaluate the binding conformation based on its
electrostatic and chemical interactions. The grid takes into account electrostatic, Van der Waals,
and predicted hydrogen bonding interactions in scoring binding conformations. Scoring the
binding allows for the qualitative comparison of binding pairs and conformations, and was used
to select the highest binding pairs.
Figure 5. Atom type and charge of KLK3.
Figure 6. DMS File of KLK3.

16
Further steps are then taken to identify the binding site of the antigens on the receptor. In
order to do so, an algorithm identifies possible sites by rolling a ball along the surface of the
receptor, visually seen in Figure 7. The size of the balls, or spheres as they are termed,
corresponds to the potential for binding to occur in that locality. By selecting the cluster of
spheres that is both highest in density and in size, the binding site can be isolated with high
accuracy1. Unfortunately, the built-in algorithm for sphere generation could not handle the size
of the PSA biomarker, so an open source plug-in called sph_gen was adopted to perform the
sphere generation algorithm.
As a secondary check, the binding site was restricted to within 8Å of the site where the
anti-KLK3 antibody binds (Figure 8). The anti-KLK3 antibody has been shown, through
competitive binding assays, to bind in the same location as the peptides in the library, thus
ensuring that we have correctly identified the binding site. The cluster of spheres seen in purple
Figure 7. Sphere Generation Selection.
Figure 8. Grid generation around KLK3 active site.

17
in Figure 8 is the largest cluster within 8Å of anti-KLK3 antibody binding, so it was selected as
the active site of the KLK3 protein.
Having prepared the receptor, each peptide antigen is then prepared in the same way.
They are assigned atoms types and charges, written to a DMS file and then compiled into a
single library that contains each molecule to be screened. A library of 3 total peptides was
compiled for this particular study.
The docking simulation was run on a 2011 MacBook Pro with a 2.4GHz Intel Core i5
processor. The peptides had flexible conformations and were free to rotate about their psi and phi
bonds. Bump filters were applied such that the peptides could not adopt any conformation that
would have a threshold level of steric hindrance. A similar bump filter was used to eliminate
binding conformations in which the peptide would clash with the surface of the KLK3 target.
The final conformations that passed the bump filters were scored and compiled based on their
predicted binding (Figure 9). The top 2 hits were selected to move forward to the next phase of
synthetic antibody engineering.
DNA Cloning DNA sequences encoding the peptide antigen sequences were cloned into a previously
synthesized expression vector, pET-28b-GFP10, engineered by Umeda et al. The vector provides
antibiotic resistance to Kan for selective growth, the linker construct for a GFP fusion protein
tag, and a poly-his tag at the C-terminus of GFP for purification through affinity
Figure 9. Computer simulated dimerization.

18
chromatography. With these elements, the synthetic antibodies will be specifically transformed
into bacterial cells and expressed for experimentation.
Oligonucleotides with coding sequences for each peptide were ordered from Bio Basic.
Each peptide included an experimental and control variant in addition to the complimentary
strands resulted in a total of 8 oligonucleotide sequences, which are detailed below:
P1 + TAG CCCAAGCTTATGTGCGTGGCGTATTGCATTGAACATCATTGCTGGACCTGCTAGTCTAGAGC P1 + TAG Complimentary GCTCTAGACTAGCAGGTCCAGCAATGATGTTCAATGCAATACGCCACGCACATAAGCTTGGG P1 CCCAAGCTTATGTGCGTGGCGTATTGCATTGAACATCATTGCTGGACCTGCTCTAGAGC P1 Complimentary GCTCTAGAGCAGGTCCAGCAATGATGTTCAATGCAATACGCCACGCACATAAGCTTGGG P2 + TAG CCCAAGCTTATGTGCGTGTTTGCGCATAACTATGATTATCTGGTGTGCTAGTCTAGAGC P2 + Tag Complimentary GCTCTAGACTAGCACACGACATAATCATAGTTATGCGCAAACACGCACATAAGCTTGGG P2 CCCAAGCTTATGTGCGTGTTTGCGCATAACTATGATTATCTGGTGTGCTCTAGAGC P2 Complementary GCTCTAGAGCACACGACATAATCATAGTTATGCGCAAACACGCACATAAGCTTGGG
Figure 10. Detailed elements of the oligonucleotide sequence ordered from Bio Basic
The eight oligonucleotides sequences were annealed according to company protocol (Bio
Baisc), resulting in double stranded DNA fragments. The oligonucleotides were then prepared
for cloning by double digestion using restriction enzymes XbaI and HindIII-HF and New
5’-CCC A|AG CTT ATG TGC GTG GCG TAT TGC ATT GAA CAT CAT TGC TGG ACC TGC TAG T|CT AGA GC-3’ TTC GA|A AGA TC|T
HindIII Start Codon Peptide Amber
Codon XbaI

19
England BioLabs protocol. Following digestion, the peptide inserts were PCR purified using a
Qiagen Gel Extraction Protocol for proper amplification.
The pET-28b-GFP plasmid was isolated from E. coli stock using a Mini Plus Plasmid
DNA Extraction protocol from Viogene. Following purification, the plasmid was similarly
double digested with HindIII-HF and XbaI endonucleases (NEB). Proper digestion was verified
by gel electrophoresis then extracted from the gel with a Zymo gel extraction kit. Double-
digested plasmid was incubated with CIP (NEB) for 1 hour at 37°C to dephosphorylate the 5’
ends in order to prevent self-ligation. The resulting double-digested plasmid backbone was then
PCR purified with a Qiagen PCR purification kit.
Ligation of the peptide inserts into the pET-28b-GFP backbone was performed at 1:5 and
1:10 backbone to insert ratios (NEB), respectively. The ligation included the two segments of
DNA as well as T4 DNA ligase (Promega) and 1X ligase buffer, following the protocol supplied
by Promega. Ligated plasmids were transformed into competent cells (NEB) by heat shock at
42°C for 45 seconds. These clones were then mini-prepped for sequencing and validation prior to
transformation.
Co-Transformation Doubly transformed E. coli cells were prepared with sequential transformations. The
sequential co-transformation of competent bacterial cells allows for the adaptability and
incorporation of any recombinant peptide. Top10 competent cells were initially transformed with
pAC-DHPheRS-6TRN, which was designed by Umeda et al. The pAC-DHPheRS-6TRN
encodes for a mutant tRNA synthetase that provides the bio-orthogonal aspect of this experiment
Figure 11. Modular format for unnatural amino acid incorporation into peptide antigen

20
allowing for specific incorporation of l-DOPA into the TAG amber stop codon. Transformations
were performed into Top10 competent cells (New England Biolabs) with heat shock at 42°C for
45 seconds. Colonies were grown on agar plates containing the antibiotic Tet for proper
selection, and then harvested for cultures and glycerol stocks.
These newly cultured cells containing the mutant tRNA synthetase vector were then
prepared for calcium competency according to the protocol supplied by NEB. The singly
transformed competent cells were then transformed a second time with pET-28b-P2-GFP
vectors. Following transformations, the colonies were plated on agar plates with 50 μg/mL Kan
and Tet. The double selection criteria ensured that both plasmids had successfully been
transformed.
Protein Over-Expression Doubly transformed E. coli cells were grown to OD ~ 0.6 at 37°C from overnight
cultures with 12.5 μg/mL Tet and 50 μg/mL Kan (Umeda et al.). The cultures were grown in M9
minimal media +2% glucose + protease-digested casein (amino acid source). All flasks were
covered with aluminum foil to reduce breakdown of the light-sensitive tetracycline. Once an OD
~ 0.6 was reached, Tet was added to a final concentration of 18.75 μg/mL Tet and l-DOPA was
spiked into the media to a final concentration of 1mM. Following the addition of Tet and l-
DOPA, the cultures were incubated for 40 minutes at 30°C. After the 40-minute incubation,
protein expression was induced by introducing 1 mM of IPTG. Following addition of IPTG, the
cultures were incubated for 6 hours at 30°C. Induction by IPTG causes translation of both the
synthetic antibody and the mutant tRNA synthetase, which will then incorporate l-DOPA from
the media into the peptide.
Purification Protocol The pET28b vector contains a polyhistidine-tag for the purpose of purifying the target
fusion protein. The hexa histidine-tag at the C-terminus of GFP was isolated via affinity
chromatography using Ni-NTA resin (Qiagen).
The fermentation broth was pelleted and stored overnight at -80°C. The following day the
pellet was resuspended in equilibration buffer and incubated on ice for 1 hour with 1 mg/ml of
lysozyme then sonicated for 3 minutes at 15% in 15-second intervals (Thermo Fisher). Following
sonication, the lysed cells were centrifuged for 40 minutes at 16,000 rpm to pellet the cell debris.

21
The supernatant was then decanted and applied to 150 μL of Ni-NTA resin that was pre-
equilibrated with equilibration buffer (Appendix B). The protein was incubated with the Ni-NTA
resin for 1 hour at 4°C with gentle rocking.
Following protein immobilization, the solid phase was isolated by gentle centrifugation
and the resin was washed with equilibrium buffer. Four washes were performed with
equilibration buffer and increasing concentrations of imidazole to remove non-specific binding.
During the four washes, the imidazole concentration was increased from 10 mM to 60 mM on a
linear gradient. The resin was incubated with each wash for 30 minutes at 4°C with gentle
rocking. Following incubation, the solid phase was isolated by centrifugation at 2,000 rpm for 3
minutes. The elution was performed three times with equilibration buffer plus 500 mM
imidazole. The elutions were pooled and collected for dialysis. The elutions were dialyzed
overnight against 1 L of dialysis buffer (Appendix B). Following dialysis, the samples were
collected for analysis by SDS-PAGE.
SDS-PAGE 4-12% NuPAGE Bis-Tris gels were used to analyze the contents of the dialyzed elution
sample as well as samples collected during each step of the wash and elution phases. The
purification samples were separated into two gels, one for the control samples and the other for
the TAG-containing proteins. The SDS-PAGE gels were run for 50 minutes at 200 V (Thermo
Fisher) then imaged for visual analysis and characterization of the contents of each lane on a GE
ImageQuant LAS 4000.

22
Results Computational Design Files were assembled for the target KLK3 structure as well as three literature cited7
peptides in Chimera-compatible formats as described above. The generated peptide files were
then compiled into a single file, or library. This library was then sequentially screened against
the target biomarker as described above. The results are listed below in order of highest to lowest
predicted binding. The peptide with the tightest predicted binding was P2 (CVFAHNYDYLVC).
The conformation of P2 within the binding site of KLK3 is shown in both ball-and-stick and
globular form in Figure 9.
Code Peptide Sequence Elapsed Run Time (sec) Grid
Score
Cited Kd
(μM)
P2 CVFAHNYDYLVC 10,221 -121.38 3.5
P1 CVAYCIEHHCWTC 10,203 -120.33 2.9
P3 CVFTSDYAFC 4,242 -96.60 7.8
Bolded residues were conserved in each of the peptides that were screened. The elapsed
time to run each peptide evaluates to 2.84, 2.83, and 1.17 hours, respectively. P3 contained only
10 amino acids versus 13 for P1 and 12 for P2, resulting in a significantly shorter run time. The
cited Kd values were determined previously by SPR. The values determined by SPR show that
P1 and P2 have comparable binding quantified at approximately 3 μM Kd, followed by P3 with
significantly weaker binding. The grid score quantifies computer simulated binding with
arbitrary units. By comparison to SPR, the grid score predicts that P1 and P2 have the highest
binding, with P2 showing negligible advantages in affinity. Similar to the SPR values, computer
simulation predicts P3 to have much weaker binding to KLK3.
Molecular Cloning The top two peptides were selected as synthetic antibody candidates. Four expression
vectors were generated via endonuclease mediated molecular cloning. P1 and P2 were both
cloned into GFP fusion protein expression vectors. Each peptide had an experimental variant that
included the TAG stop codon and a control variant with no TAG stop codon. Following ligation,

23
the vectors were transformed into Top10 E. coli cells. Ligation and transformation were visually
confirmed via gel electrophoresis (Figure 12). The doubly digested linear fragments from each of
the four transformants (lanes 1-4) match the expected size of ~6600 bp. The doubly digested
samples also have a second band that corresponds to the expected size of the insert,
demonstrating successful ligation and transformation of all four expression vectors.
As a secondary check, each sample was sequenced by Sequetech. The sequencing (Figure
13) confirmed that the oligonucleotides had been successfully ligated into the expression vector
and transformed into Top10 E. coli. However, they revealed a single point mutation in the P2
experimental vector. A thymine was mutated to an adenine. The mutation occurred in the crucial
TAG stop codon that is recognized by the unnatural amino acid synthetase. Without the TAG
codon, l-DOPA incorporation cannot occur. The point mutation was repeatedly observed across
multiple ligation and transformation experiments, indicating that the purity of the
oligonucleotides was compromised. Further experimentation was continued with P1.
Figure 13. Validated sequencing of P1 and P2 vectors from Sequetech
Figure 12. Gel electrophoresis of transformed plasmid.

24
Sequential Co-Transformation In order for the synthetic antibody to be produced in vivo for purification and validation,
two proteins must be expressed in the E. coli host. The first is the peptide-GFP fusion protein,
and the second is the mutant tRNA synthetase that recognizes the TAG amber stop codon as the
location for l-DOPA incorporation. Each protein is encoded in a unique vector under the control
of IPTG. Thus, expressing both proteins simultaneously requires a doubly transformed E. coli
cell.
The double transformation was performed sequentially, first with the mutant tRNA
synthetase vector (pAC-DHPheRS-6TRN) followed by pET28b-peptide-GFP. pAC-DHPheRS-
6TRN was under tetracycline selection, and pET28b-peptide-GFP was under kanamycin
selection. The final doubly transformed cells (transformed as described in Materials & Methods)
were plated on LB agar along with Tet and Kan to select only for doubly transformed cells. The
colony growth in Figure 13 in the presence of both Tet and Kan demonstrates that colonies have
resistance to both antibiotics. This indicates that the E. coli cells have been successfully
transformed with both vectors.
Figure 14. Colony growth on LB agar + Kan + Tet following sequential co-transformation.
Overexpression & Purification The P2-GFP expression vector was overexpressed in E. coli Top10 cells as described
above (see Materials & Methods). Prior to purification by affinity chromatography, the
proteasome was visualized by fluorescence (Figure 15) imaging and SDS-PAGE (Figure16).
Because the peptide sequence was designed with a TAG stop codon at the C-terminus, if the
unnatural amino acid synthetase does not recognize the amber stop codon, it will simply be read
as a stop codon and the following GFP sequence will not be transcribed. Therefore, the presence

25
of GFP in these initial assessments provided a qualitative determination on the efficiency of l-
DOPA incorporation.
The fluorescence scan shows 3 samples with varied fluorescent intensities. In the middle
is the negative control containing only media. This sample is the negative background
fluorescence. At right is the control peptide (no TAG codon), which shows high levels of
fluorescence. At left is the experimental peptide (including TAG codon), which shows low-level
fluorescence. By visual assessment, the fluorescence level for the experimental peptide is
approximated at 10% that of the control peptide. The efficiency of the unnatural amino acid
synthetase can thus be estimated at approximately 10%. In the remaining 90% of translations, the
TAG codon is read as a stop and GFP is not translated.
Ladde
r CTL L
ysate
CTL L
iquid
Phas
e Lad
der
TAG Lys
ate
TAG Liqu
id Ph
ase
25 kDa
10 kDa
30 kDa
Expected Size: 27
kDa
Figure 15. Supernatant solutions of P1-TAG (left), negative control (middle), and P1-control (right) under UV light.
Figure 16. SDS-PAGE of lysate and supernatant following centrifugation to remove cell debris

26
An SDS-PAGE confirmed that the fluorescence was due to GFP excitation and not
artifact fluorescence. The size of the induced protein is roughly the size of GFP because the
additional peptide sequence is of negligible size. A strong expression band can clearly be seen on
the gel around the expected 27 kDa marks for both the experimental peptide and the control
peptide, indicating that the peptide-GFP fusion protein was successfully induced in both samples.
The band appears equally strong in both the lysate and the supernatant fractions, that the peptide-
GFP fusion protein has adequate solubility to be purified in its native conformation.
Having confirmed that the peptide-GFP fusion protein was successfully induced, further
purification was undergone by affinity chromatography. The protein can be isolated by binding
the poly-His tag to Ni-NTA resin. Following affinity chromatography purification, a second
SDS-PAGE was used to confirm that the peptide-GFP fusion protein was successfully isolated.
At left in lane 1 is a MW marker followed by the lysate in lane 2, the unbound fraction in lane 3,
and the first wash in lane 4. The strong protein band around 27 kDa that corresponds to the
peptide-GFP fusion protein is visible in each lane. The presence of the band in the unbound
fraction and first wash (lanes 3 and 4) indicate that the protein is not binding to the resin. A
number of explanations exist to explain why binding has not occurred. It is possible that the
poly-His tag has become buried inside GFP and is therefore not exposed to the Ni-NTA capture
resin. Additionally, binding could be limited due to the conditions of the equilibration buffer
Figure 17. SDS-PAGE of cell lysate and unbound fractions following purification (TAG variant)

27
(Appendix B) that was used. Further optimizations are required to determine the cause as well as
optimize conditions to ensure proper immobilization of the peptide-GFP fusion protein onto the
solid phase Ni-NTA resin.

28
Discussion Established Future Workflow This project should be evaluated as a proof of concept for a technology that could
revolutionize how biomolecules are produced for molecular diagnostic bio-devices. By
engineering a peptide biomolecule that imitates the function and activity of antibodies,
researchers can retain the ability to design and produce specifically targeted capture systems in-
house.
The synthetic antibodies can be produced en masse with zero batch-to-batch variability
using bacterial hosts, a significant advantage over current technology that requires outsourcing
production to a specialized vivarium. As mentioned previously, the entire process of monoclonal
antibody formulation and isolation using the current techniques routinely takes 6 months and
upwards of a $30,000 investment. This resource strain limits the availability of tailored capture
systems to many researchers and bio-device companies. A synthetic antibody designed
computationally and produced in E. coli circumvents any extraneous expenses that would
otherwise limit innovation. By contrast to the high costs of monoclonal antibody production, the
costs associated with synthetic antibody production are minimal. Total project expenses were
$600, and are outlined in Appendix A. This significant reduction in cost will correlate with
increased accessibility for researchers with limited funding.
An additional advantage of in-house production is quality control. As noted previously,
monoclonal antibody isolation from mammalian hosts has batch-to-batch variability that
compromises any attempts at robust quality control. This introduces the risk of giving patients
that use the diagnostic technology false-negatives or positives, an unacceptable outcome for a
bio-device company. By contrast, because synthetic antibodies are produced in E. coli, there is
no batch-to-batch variability. Thus, quality control experiments following GMP standards can be
established and performed in-house. As a result, devices that use this technology are more robust
and the prognoses obtained from them have more integrity.
The advantages of synthetic antibodies versus monoclonal antibodies also include a
modular production format that can be easily adapted for additional biomarkers. Should a
collection of capture biomolecules be required, for example if a researcher wanted to design a
comprehensive cancer screen that identifies risks for many different types of cancer, they would

29
need to simply apply the same rational workflow to a new biomarker. Once a new biomarker is
chosen, the same script can be used to select candidate peptides from a library in Chimera.
Following selection of candidate peptides, they can be cloned into the pET28b-GFP expression
vector from oligonucleotides and subsequently transformed into the prepared stock of singly
transformed competent cells. Each additional biomarker pair can be added following the same
protocol with only $600 in additional expenses.

30
Conclusion
Synthetic antibody technology presents a promising alternative to using mAb in
diagnostic bio-devices. However, in order for the system to be implemented in a viable
commercial application, further improvements must first be made. Notably, there is a limit to the
computing capacity when screening peptide libraries and further validation studies must be
performed to determine the fold improvement in affinity of peptides engineered with the l-DOPA
cross-linker.
During the peptide screening process, a library of 3 peptides was docked against KLK3.
The process scanned through roughly 10,000 conformations and took 6.84 hours to complete this
small library. This can be attributed to the fact that the program specializes in recognizing and
analyzing small molecule-protein interactions, while the focus of this project peptide-protein
interactions. By comparison to a small molecule, a peptide of even 10 amino acids can adopt
many more conformations due to the degrees of rotational freedom in the peptide backbone.
Considering that a practical peptide screen would include roughly 1020 peptides, the current time
per peptide in the library is limiting. A second reason for the length of time elapsed is the
processing speed of the computer on which the program was run. A personal computer with a 2.4
GHz processor and 4 GB of RAM does not provide enough power to facilitate such a
computation. In order to make this software program efficient enough to perform such a
screening, significant improvements must be made in the algorithms and the computation should
be performed on a supercomputer cluster.
The second crucial aspect of producing synthetic antibodies is the incorporation of the
unnatural amino acid cross-linker. Bio-orthogonality of the mutant tRNA synthetase and the
TAG amber stop codon was successfully demonstrated. The fluorescent scan of the proteasome,
which showed GFP fluorescence and the strong GFP expression band in the SDS-PAGE
confirmed that incorporation had occurred at the TAG codon, thus allowing translation of the
GFP indicator.
Having confirmed that l-DOPA incorporation was successful, future tests can now be
performed to quantify the binding between the engineered synthetic antibody and KLK3. By
titrating the synthetic antibody into solution with KLK3, the Kd can be assessed. The Kd will be
found by identifying the concentration of synthetic antibody at which half of the biomolecules

31
are in dimer form. This concentration is the equilibrium binding constant or Kd. With a
quantitative measure of the binding affinity, a full assessment can be made about the commercial
viability of synthetic antibodies.

32
References 1. Allen, WJ, Balius, TE et all. (2015). DOCK 6: Impact of new features and current docking
performance. J Comput Chem, 5;36(15),1132-56. 2. Jeong, S., & Lee, S.-W. (2007). Expression and purification of recombinant active prostate-
specific antigen from Escherichia coli. Journal of Microbiology and Biotechnology, 17(5), 840–6. Retrieved from http://www.ncbi.nlm.nih.gov/pubmed/18051307
3. Leenaars, M., & Hendriksen, C. F. M. (2005). Critical Steps in the Production of Polyclonal and Monoclonal Antibodies: Evaluation and Recommendations. ILAR Journal, 46(3), 269–279. http://doi.org/10.1093/ilar.46.3.269
4. Li, F., Vijayasankaran, N., Shen, A. (Yijuan), Kiss, R., & Amanullah, A. (2010). Cell culture processes for monoclonal antibody production. mAbs, 2(5), 466–477. http://doi.org/10.4161/mabs.2.5.12720
5. Meng, E. C., Pettersen, E. F., Couch, G. S., Huang, C. C., & Ferrin, T. E. (2006). Tools for integrated sequence-structure analysis with UCSF Chimera. BMC Bioinformatics, 7, 339. http://doi.org/10.1186/1471-2105-7-339
6. Ménez, R., Michel, S., Muller, B. H., Bossus, M., Ducancel, F., Jolivet-Reynaud, C., & Stura, E. A. (2008). Crystal Structure of a Ternary Complex between Human Prostate-specific Antigen, Its Substrate Acyl Intermediate and an Activating Antibody. Journal of Molecular Biology, 376(4), 1021–1033. http://doi.org/10.1016/j.jmb.2007.11.052
7. Pakkala, M., Jylhäsalmi, A., Wu, P., Leinonen, J., Stenman, U. H., Santa, H., … Närvänen, A. (2004). Conformational and biochemical analysis of the cyclic peptides which modulate serine protease activity. Journal of Peptide Science, 10(7), 439–447. http://doi.org/10.1002/psc.557
8. Pettersen, E. F., Goddard, T. D., Huang, C. C., Couch, G. S., Greenblatt, D. M., Meng, E. C., & Ferrin, T. E. (2004). UCSF Chimera—A visualization system for exploratory research and analysis. Journal of Computational Chemistry, 25(13), 1605–1612. http://doi.org/10.1002/jcc.20084
9. Siddiqui, M. Z. (2010). Monoclonal antibodies as diagnostics; an appraisal. Indian Journal of Pharmaceutical Sciences, 72(1), 12–17. http://doi.org/10.4103/0250-474X.62229
10. Umeda, A., Thibodeaux, G. N., Moncivais, K., Jiang, F., & Zhang, Z. J. (2010). A versatile approach to transform low-affinity peptides into protein probes with cotranslationally expressed chemical cross-linker. Analytical Biochemistry, 405(1), 82–8. http://doi.org/10.1016/j.ab.2010.05.026
11. Wals, K., & Ovaa, H. (2014). Unnatural amino acid incorporation in E. coli: current and future applications in the design of therapeutic proteins. Frontiers in Chemistry, 2, 15.http://doi.org/10.3389/fchem.2014.00015
12. Wang, L., & Schultz, P. G. (2001). A general approach for the generation of orthogonal tRNAs. Chemistry and Biology, 8(9), 883–890. http://doi.org/10.1016/S1074-5521(01)00063-1
13. Wu, P., Leinonen, J., Koivunen, E., Lankinen, H., & Stenman, U. H. (2000). Identification of novel prostate-specific antigen-binding peptides modulating its enzyme activity. European Journal of Biochemistry, 267(20), 6212–6220. http://doi.org/10.1046/j.1432-1327.2000.01696.x

33
Appendices Appendix A: Budget Product Cost Amount Type
KLK3 Protein $178 10 ug Biologic
Oligonucleotides $167 8 x 60 bp Biologic
l-DOPA $50 5 g Chemical
Top- 10 Competent Cells
$171 10 reactions Biologic
DNA Sequencing $36 6 x Analysis
Total $602
__________________ ________________ __________________ __________________
Future Costs
Total ~$180 Appendix B: Buffers M9 Salts: To make M9 Salts aliquot 800ml H2O and add 64g Na2HPO4-7H2O 15g KH2PO4 2.5g NaCl 5.0g NH4Cl Adjust to 1000ml with distilled H2O Sterilize by autoclaving M9 Minimal Media: 1000ml Measure ~700ml of distilled H2O (sterile) Add 200ml of M9 salts Add 2ml of 1M MgSO4 (sterile) Add 20 ml of 20% glucose* Add 100ul of 1M CaCl2 (sterile) Adjust to 1000ml with distilled H2O *Glycerol substitute was used to allow for the media to be autoclaved Lysis Buffer: 50 mM NaH2PO4, 300 mM NaCl, 10 mM imidazole, 10 mM β-mercaptoethanol, pH 8.0
34
Wash Buffer: 50 mM NaH2PO4, 300 mM NaCl, 30 mM imidazole, 10 mM β-mercaptoethanol, pH 8.0 Elution Buffer: 50 mM NaH2PO4, 300 mM NaCl, 500 mM imidazole, 10 mM β-mercaptoethanol, pH 8.0 Dialysis Buffer: 50 mM NaH2PO4, 150 mM NaCl, 10 mM β-mercaptoethanol, pH 8.0 l-DOPA Stock Solution: Make stock of 100mM l-DOPA at pH 0.9 Appendix C: Simulated Molecular Binding


![Computational Approaches to Design and Test Plant ...Update on Plant Synthetic Metabolic Pathways Computational Approaches to Design and Test Plant Synthetic Metabolic Pathways1[OPEN]](https://static.fdocuments.in/doc/165x107/6118a3dece051064bf699784/computational-approaches-to-design-and-test-plant-update-on-plant-synthetic.jpg)