Computational Chemistry Group Identifying Colour Fastness under Different Conditions Dr. Julian...
32
Computational Chemistry Group Identifying Colour Fastness under Different Conditions Dr. Julian Cherryman Spotfire users meeting, April 2002
-
Upload
bernadette-charles -
Category
Documents
-
view
216 -
download
0
Transcript of Computational Chemistry Group Identifying Colour Fastness under Different Conditions Dr. Julian...

ComputationalChemistry Group
Identifying Colour Fastness under Different Conditions
Dr. Julian Cherryman
Spotfire users meeting, April 2002

ComputationalChemistry Group
Overview
• Background of Avecia and Inkjet Research
• Where did Spotfire come from?
• The Challenge
• Going Forward
• Summary – Improving Decision Making
ComputationalChemistry Group
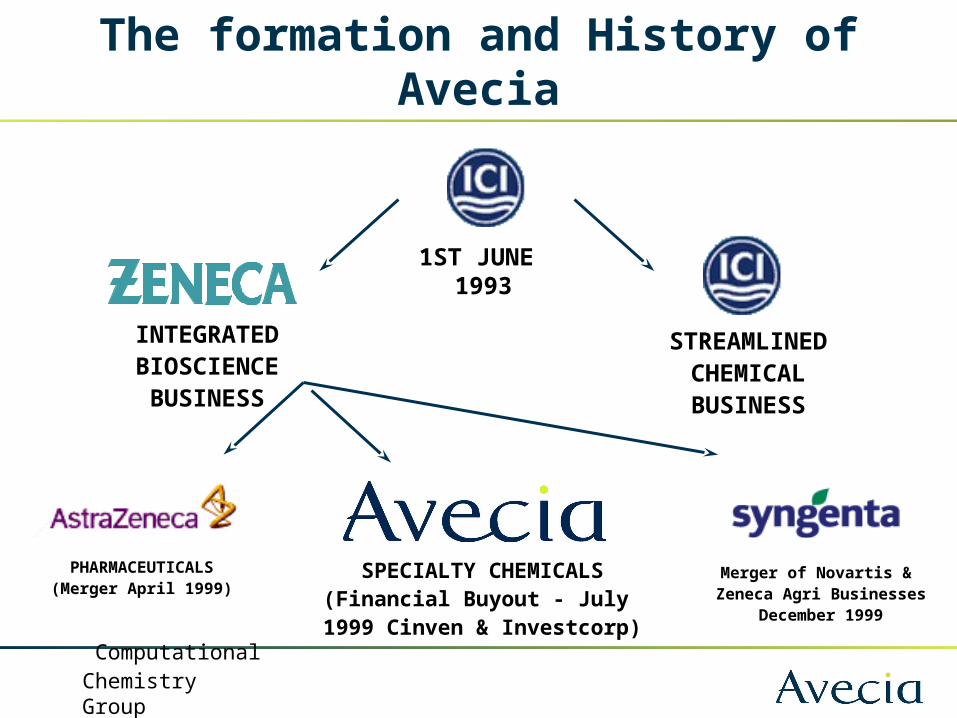
INTEGRATEDBIOSCIENCE
BUSINESS
1ST JUNE 1993
STREAMLINEDCHEMICALBUSINESS
PHARMACEUTICALS(Merger April 1999)
SPECIALTY CHEMICALS(Financial Buyout - July
1999 Cinven & Investcorp)
Merger of Novartis & Zeneca Agri Businesses
December 1999
The formation and History of Avecia
ComputationalChemistry Group
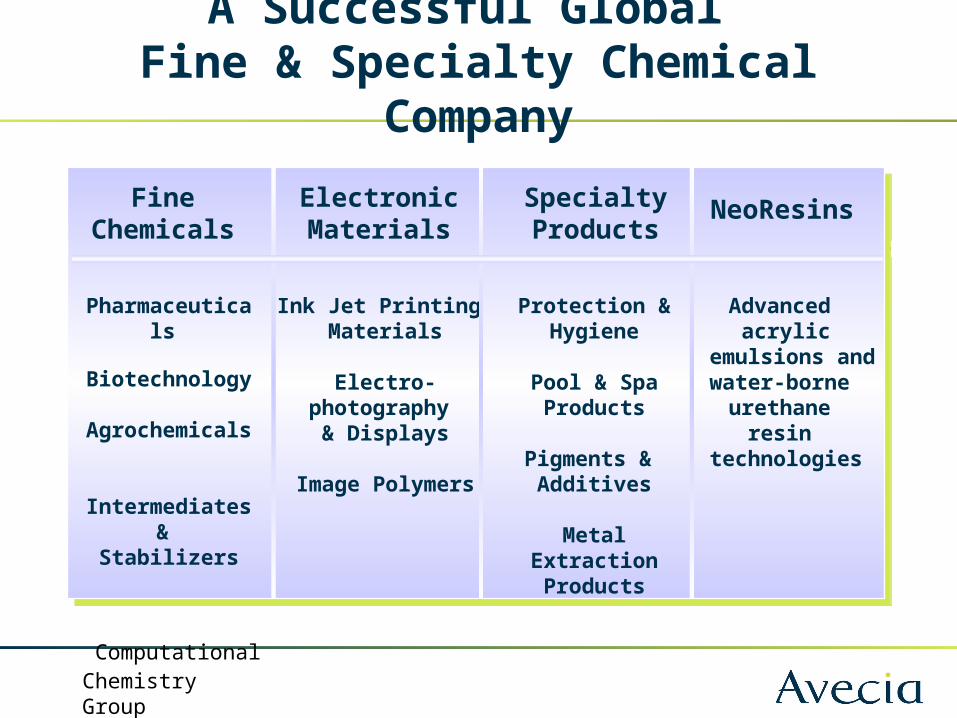
FineChemicals
ElectronicMaterials
SpecialtyProducts
NeoResins
Pharmaceuticals
Biotechnology
Agrochemicals
Intermediates & Stabilizers
Ink Jet Printing Materials
Electro-photography
& Displays
Image Polymers
Protection &Hygiene
Pool & SpaProducts
Pigments & Additives
Metal Extraction Products
Advanced acrylic
emulsions and water-borne
urethane resin
technologies
A Successful Global Fine & Specialty Chemical Company
ComputationalChemistry Group
• Team of qualified Computational Chemists.• Range of High-End Unix Workstations and Servers.• Range of Commercial and In-house Software. • Strong Links with External Academic Groups Through
CASE Studentships and Post-Doctoral Fellowships.• Advanced Computing Experience (Unix / Scripting / Web tools..).
Computational Chemistry Group

ComputationalChemistry Group
Inkjet Research
• Design novel dyes with good physical properties for inkjet printing
• Targets– CMYK– Aqueous Soluble– Colour fastness
• Conditions– Media– Formulations– In solution or solid
ComputationalChemistry Group
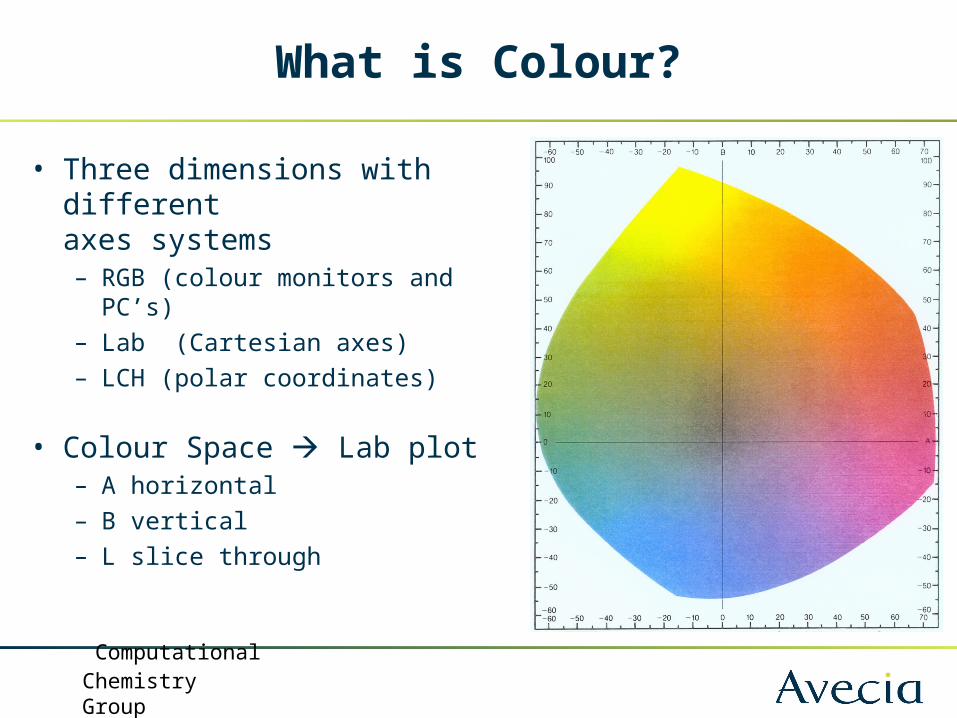
What is Colour?
• Three dimensions with differentaxes systems– RGB (colour monitors and PC’s)– Lab (Cartesian axes)– LCH (polar coordinates)
• Colour Space Lab plot– A horizontal– B vertical– L slice through

ComputationalChemistry Group
Fastness
• Why are we worried?
• What factors affect fading– Light– Air– Humidity– Temperature

ComputationalChemistry Group
Where did Spotfire come from?
• As a modelling group, we are used to dealing with 3D molecules.
• Copper phthalocyanine
• No fundamental difference between a molecule and xyz (or Lab) coordinate system

ComputationalChemistry Group
Colour space coverage with 3 inks
– Print 2688 colour patches with a range of amounts of the three inks
– Automatically measure Lab for each patch– Produces 6 excel files per run
• Challenge:– Visualise the data in an understandable way– Have we got an even coverage of colour space, any gaps?
• Test print pattern• Or ink combination
– Quantify the amount of colour space covered– Compare this with other 3 ink systems and different media
ComputationalChemistry Group
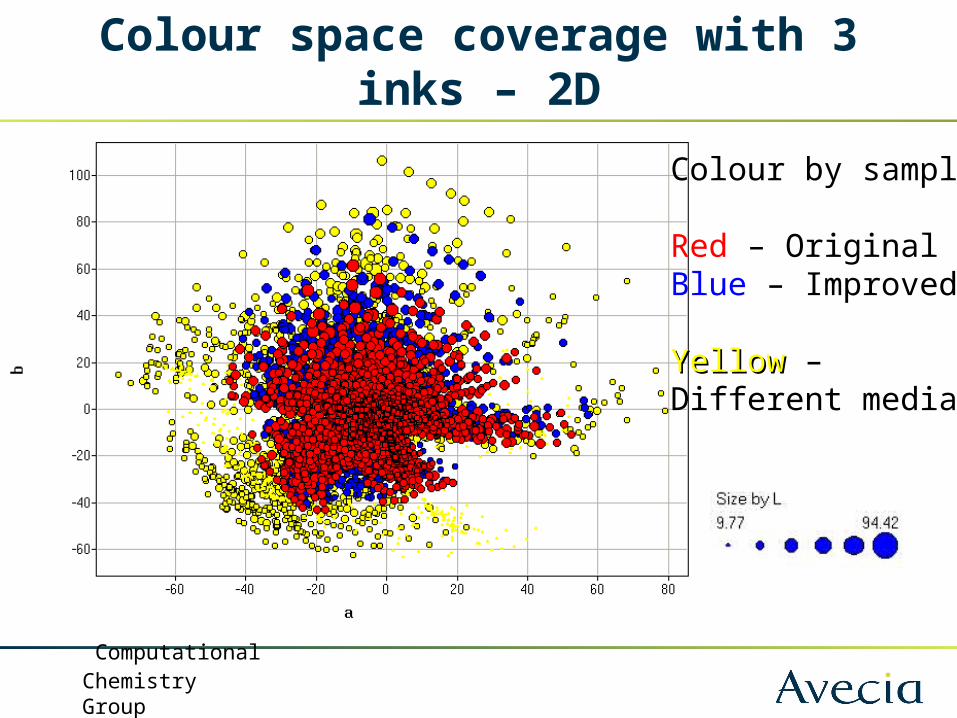
Colour space coverage with 3 inks – 2D
Colour by sample
Red – OriginalBlue – Improved
YellowYellow –Different media

ComputationalChemistry Group
Colour space coverage with 3 inks – 3D

ComputationalChemistry Group
The Challenge
Getting more information
out of print test data

ComputationalChemistry Group
What information is recorded?
• Currently a shared sub-directory with 4469 Excel files, each with one block of data.
• Information includes:– Batch information– Original colour information– Testing Protocol– Media– Fastness data by different tests
ComputationalChemistry Group
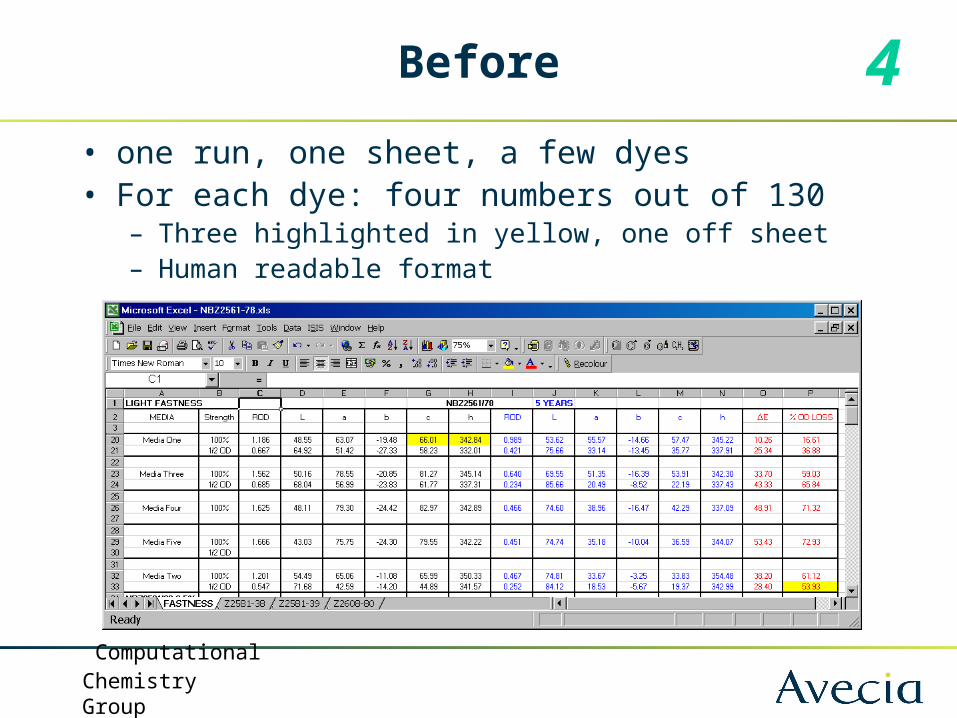
Before
• one run, one sheet, a few dyes• For each dye: four numbers out of 130
– Three highlighted in yellow, one off sheet– Human readable format
4
ComputationalChemistry Group
First iteration…
• Data sets combined– Initially manually– Then with an Excel macro
• This allows the data points to be visualised in ab colour space.
• As the usage increased, the data format was modified to simplify the importing of data into Spotfire

ComputationalChemistry Group
Data for five dyes 20+
Colour by dye
ComputationalChemistry Group
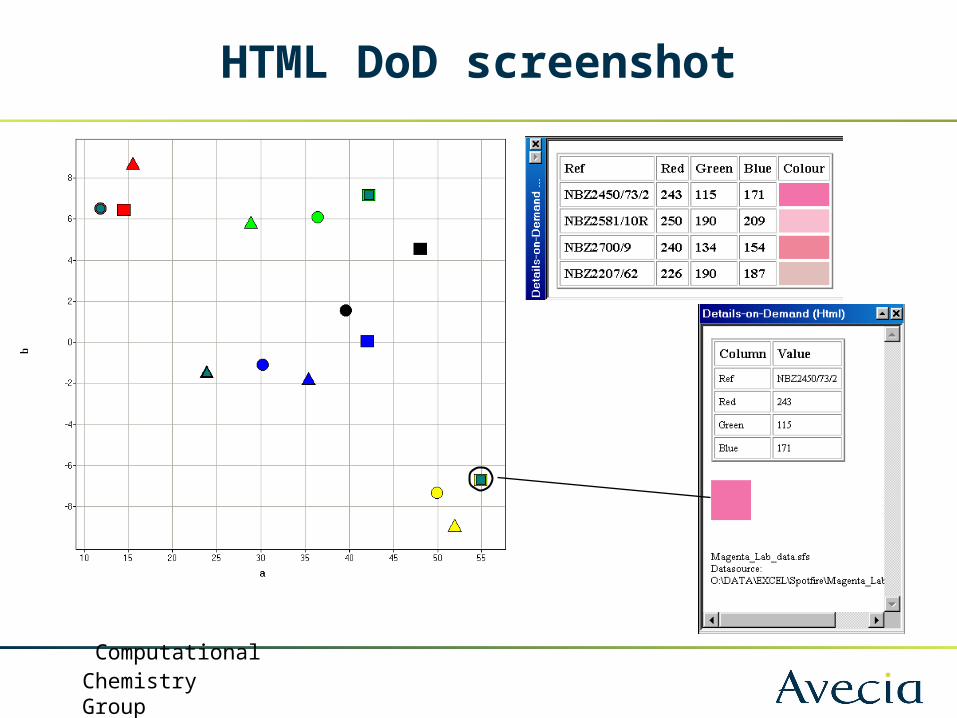
Getting real colour out
• The Lab coordinates correspond to a real colour• The inkjet chemists are well practised in picturing
this. However, the layman is not!
• Initially an Excel script was written to display a colour patch in an adjacent cell.
• This was transferred to an intranet page format• Then it was linked in to the Spotfire HTML details-on-
demand box.
ComputationalChemistry Group
HTML DoD screenshot
ComputationalChemistry Group
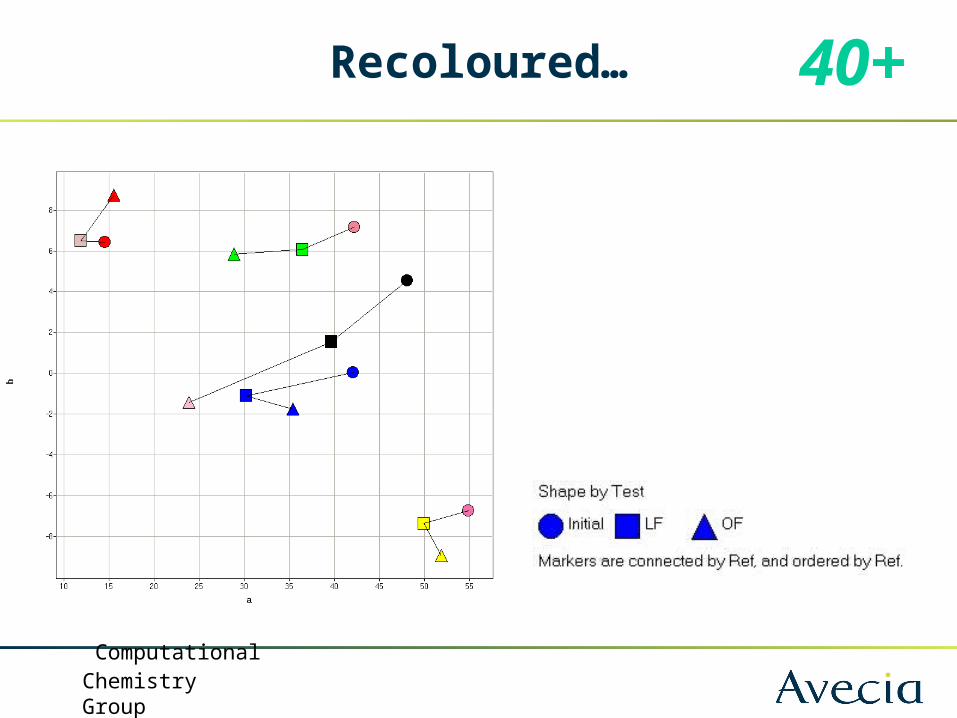
Recoloured… 40+

ComputationalChemistry Group
Second iteration…
• Currently, the data is great for understanding the colour.
• Colour changes on fading can be seen by the movement of the points but couldn’t be used to set the properties of the points.
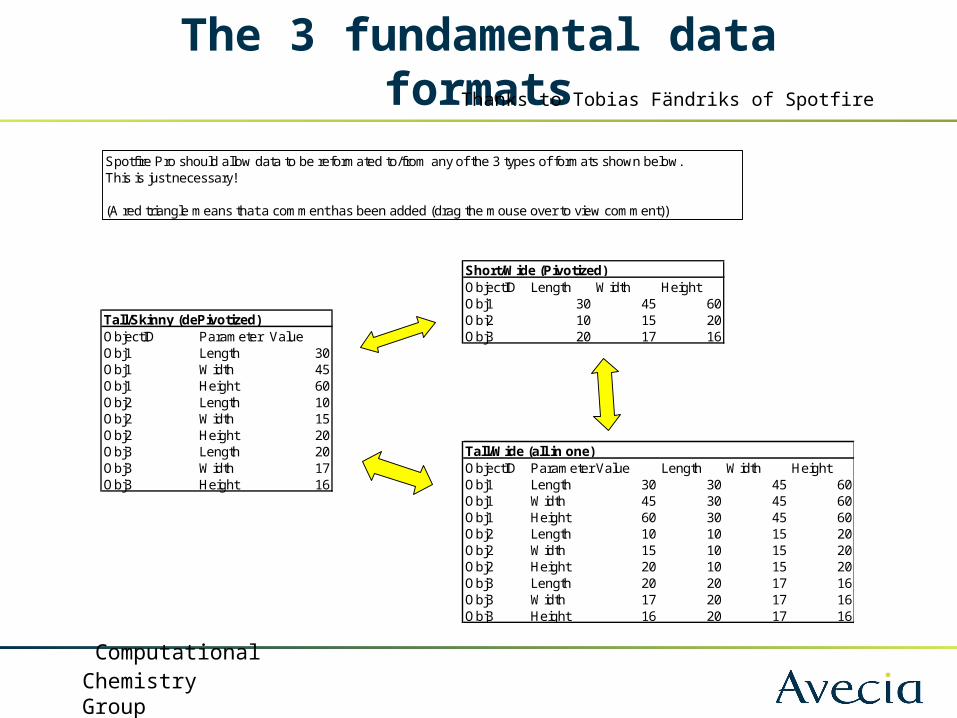
• Need to start pivoting the data from ‘Short/Wide’ to ‘Tall/Wide’ format.
ComputationalChemistry Group
The 3 fundamental data formats
Short/Wide (Pivotized)ObjectID Length Width HeightObj1 30 45 60
Tall/Skinny (dePivotized) Obj2 10 15 20ObjectID Parameter Value Obj3 20 17 16Obj1 Length 30Obj1 Width 45Obj1 Height 60Obj2 Length 10Obj2 Width 15Obj2 Height 20Obj3 Length 20 Tall/Wide (all in one)Obj3 Width 17 ObjectID Parameter Value Length Width HeightObj3 Height 16 Obj1 Length 30 30 45 60
Obj1 Width 45 30 45 60Obj1 Height 60 30 45 60Obj2 Length 10 10 15 20Obj2 Width 15 10 15 20Obj2 Height 20 10 15 20Obj3 Length 20 20 17 16Obj3 Width 17 20 17 16Obj3 Height 16 20 17 16
Spotfire Pro should allow data to be reformated to/from any of the 3 types of formats shown below.This is just necessary!
(A red triangle means that a comment has been added (drag the mouse over to view comment))
Thanks to Tobias Fändriks of Spotfire

ComputationalChemistry Group
Pivoting data
• Initially the data was pivoted manually
• Subsequent pivoting wasdone in Access (SQL)

ComputationalChemistry Group
The final plot
• Sized by fastness #1• Coloured by fastness #2• Plotting a vs b
Selected: Initial,Media One, strength 1.0

ComputationalChemistry Group
Third iteration…
• Automated web page input form to database.
• Now looking at large amounts of data (>500 dyes)
• Introduce robustness by– Control per batch– Ratios to control

ComputationalChemistry Group
Molecular Spotfire
• Trying to link colour and performance to molecular structure.
• Connection made to internal ISIS/Base database
• Group results by:– Molecular clustering– Selecting specific structural features and then marking
records– Would ideally like to include information about number of
occurrences of a particular group or structural feature.
ComputationalChemistry Group
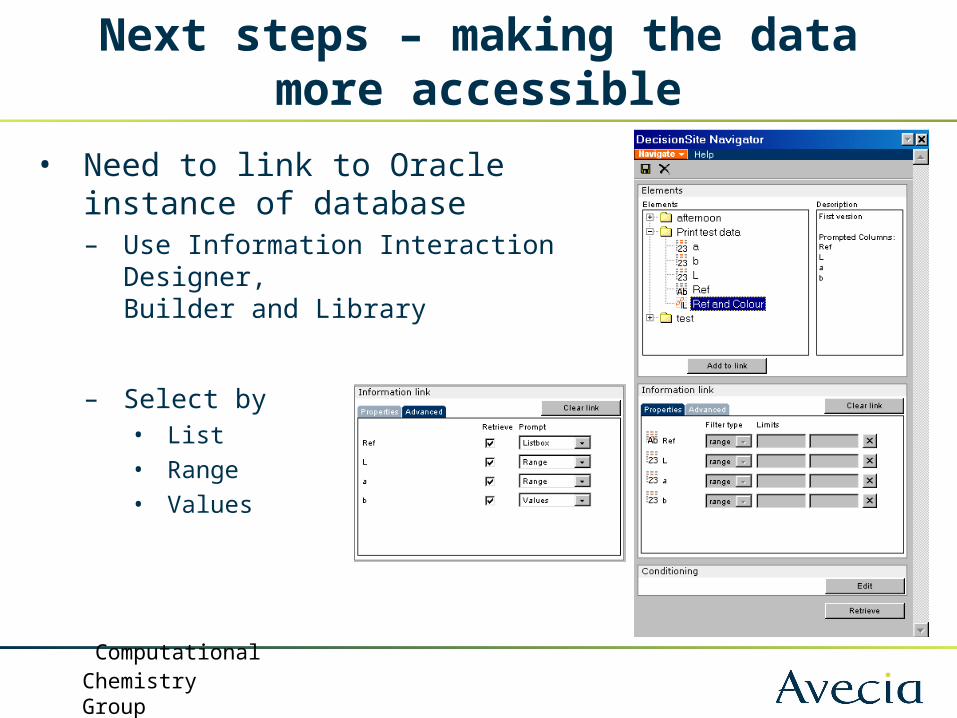
Next steps – making the data more accessible
• Need to link to Oracle instance of database– Use Information Interaction Designer,
Builder and Library
– Select by• List
• Range
• Values
ComputationalChemistry Group
Next steps – Automating the process
• Guides
1. Import data
2. Produce standard plots– Axes
– Properties
– Query devices
3. Output to report.

ComputationalChemistry Group
Challenges outstanding
• Need to upload historical data, which is in different formats
• Need to cope with varying protocols and other changes in:– Equipment– People– Requirements
ComputationalChemistry Group
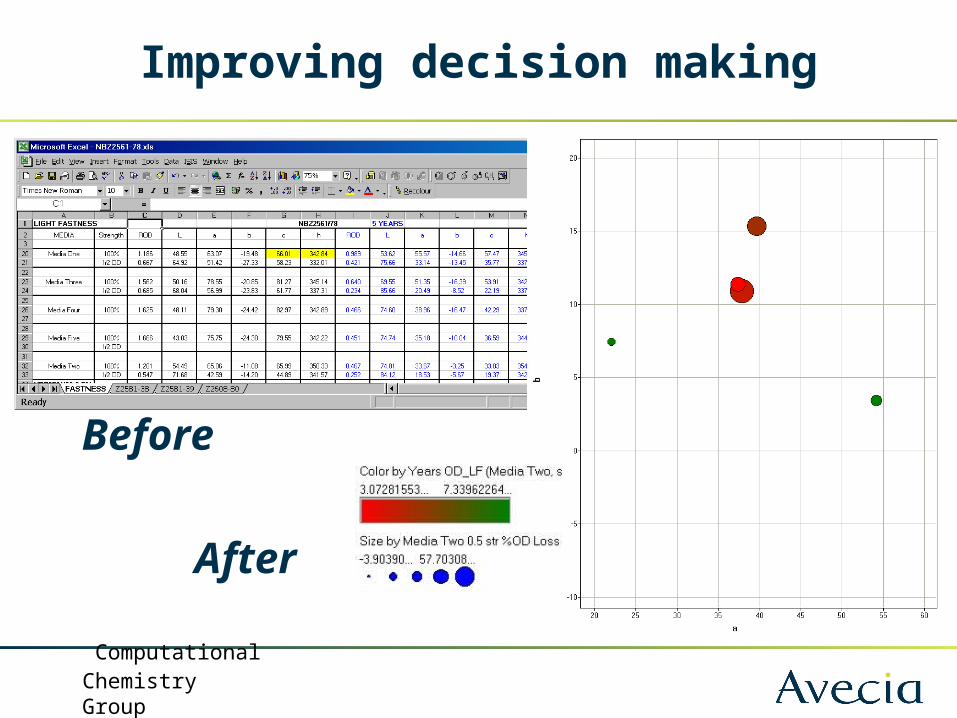
Improving decision making
Before
After
ComputationalChemistry Group
Final Thoughts
• Having Spotfire is only half the battle• You also need to have the right data in the right format
• This requires knowledge (by a specialised user) of– Excel macros– VB and scripting– Databases – at least access, possibly SQL and Oracle– XML– …

ComputationalChemistry Group
Thanks