Protein structure prediction Haixu Tang School of Informatics.
Upload
aldous-hunterCategory
view
217download
0
Computational approaches to the analysis of RNA-seq data
C. Notredame
Adapted from Haixu Tang,I519 Introduction to Bioinformatics, Fall, 2012

Next-generation gap
http://www.nature.com/nmeth/journal/v6/n11s/full/nmeth.f.268.html

The evolution of transcriptomics
1995 P. Brown, et. al. Gene expression profilingusing spotted cDNA microarray: expression levels of known genes
2002 Affymetrix, whole genome expression profiling using tiling array: identifying and profiling novel genes and splicing variants
2008 many groups, mRNA-seq: direct sequencing of mRNAs using next generation sequencing techniques (NGS)
RNA-seq is still a technology under active development
Hybridization-based
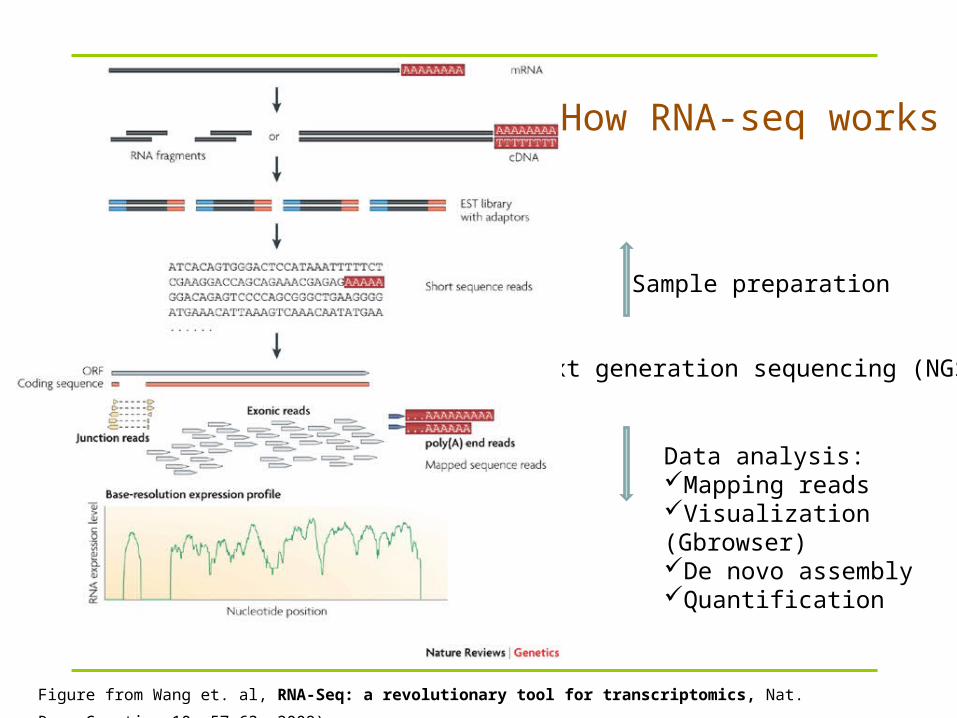
How RNA-seq works
Figure from Wang et. al, RNA-Seq: a revolutionary tool for transcriptomics, Nat. Rev. Genetics 10, 57-63, 2009).
Next generation sequencing (NGS)
Sample preparation
Data analysis:Mapping readsVisualization (Gbrowser)De novo assemblyQuantification

Next generation sequencing (NGS) techniques
454 Sequencing Illumina/Solexa ABI SOLiD
Sequencing Chemistry
PyrosequencingPolymerase-based sequence-by-synthesis
Ligation-based sequencing
Amplification approach
Emulsion PCR Bridge amplification Emulsion PCR
Paired end (PED) separation
3 kb 200-500 bp 3 kb
Mb per run 100 Mb 1300 Mb 3000 Mb
Time per PED run <0.5 day 4 days 5 days
Read length (update)
250-400 bp 35, 75 and 100 bp 35 and 50 bp
Cost per run $ 8,438 USD $ 8,950 USD $ 17,447 USD
Cost per Mb $ 84.39 USD $ 5.97 USD $ 5.81 USD

RNA-seq vs. microarray
• RNA-seq can be used to characterize novel transcripts and splicing variants as well as to profile the expression levels of known transcripts (but hybridization-based techniques are limited to detect transcripts corresponding to known genomic sequences)
• RNA-seq has higher resolution than whole genome tiling array analysis– In principle, mRNA can achieve single-base resolution, where the
resolution of tiling array depends on the density of probes
• RNA-seq can apply the same experimental protocol to various purposes, whereas specialized arrays need to be designed in these cases– Detecting single nucleotide polymorphisms (needs SNP array otherwise)– Mapping exon junctions (needs junction array otherwise)– Detecting gene fusions (needs gene fusion array otherwise)
– Next-generation sequencing (NGS) technologies are now challenging microarrays as the tool of choice for genome analysis.

Advantages of RNA-Seq compared with other transcriptomics methods

RNA-seq and microarray agree fairly well only for genes with medium levels of expression
Saccharomyces cerevisiae cells grown in nutrient-rich media. Correlation is very low for genes with either low or high expression levels.
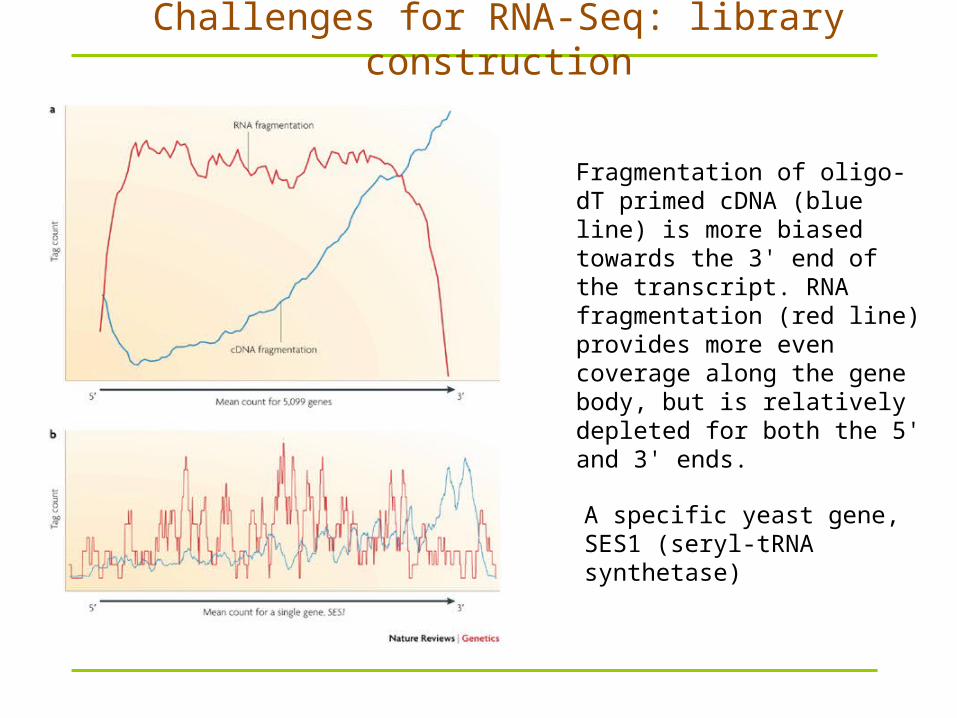
Fragmentation of oligo-dT primed cDNA (blue line) is more biased towards the 3' end of the transcript. RNA fragmentation (red line) provides more even coverage along the gene body, but is relatively depleted for both the 5' and 3' ends.
A specific yeast gene, SES1 (seryl-tRNA synthetase)
Challenges for RNA-Seq: library construction

Library construction Unlike small RNAs (microRNAs (miRNAs), Piwi-
interacting RNAs (piRNAs), short interfering RNAs (siRNAs) and many others), which can be directly sequenced after adaptor ligation, larger RNA molecules must be fragmented into smaller pieces (200–500 bp) to be compatible with most deep-sequencing technologies.
Common fragmentation methods include RNA fragmentation (RNA hydrolysis or nebulization) and cDNA fragmentation (DNase I treatment or sonication).
Each of these methods creates a different bias in the outcome.

Library construction PCR artefacts
– Many shorts reads that are identical to each other can be obtained from cDNA libraries that have been amplified. These could be a genuine reflection of abundant RNA species, or they could be PCR artefacts.
– Use replicates
Whether or not to prepare strand-specific libraries– Strand-specific libraries are valuable for transcriptome
annotation, especially for regions with overlapping transcription from opposite direction
– strand-specific libraries are currently laborious to produce because they require many steps or direct RNA–RNA ligation, which is inefficient

Data analysis for mRNA-seq: key steps
• Mapping reads to the reference genome– Read mapping of 454 sequencers can be done by
conventional sequence aligners (BLAST, BLAT, etc)– Short read aligner needed for Illumina or SOLiD reads
• Quantifying the known genes
• Prediction of novel transcripts– Assembly of short reads: comparative vs. de novo
• Quantifying splicing variants

Short read alignersAligner Version Developer License
BFAST 0.3.1 UCLA Academic
Bowtie 0.9.8 Salzberg/UMD GNUPL
cross_match (CM) 1.080721 U. Wash. Academic
CELL 2.0 CLC bio Commercial
Maq 0.7.1 WTSI GNUPL
Novoalign 2.00.12 Novocraft Academic
RMAP 0.41 CSHL Public
SeqMap 1.0.12 Stanford Academic
Shrimp 1.1.0 U. Toronto Public
SOAP 2.01 BGI Academic
GEM 1.1 CRG Academic
Acknowledgement: Mass Genomics http://www.massgenomics.org/short-read-aligners

Speed
There were essentially two speed groups. The fastest were BWT-indexing aligners (Bowtie & SOAP) and BFAST, all of which finished in less than 20 minutes. The other aligners (CLCbio, CM, SeqMap, Maq, Novoalign) were comparable in speed to one another and completed in 8-9 hours.
Some data is not shown: SHRiMP is very slow and RMAP is not accurate. SE: single-end; PE: paired-end
Acknowledgement: Mass Genomics http://www.massgenomics.org/short-read-aligners
Trial 1 Trial 2

Accuracy
Most aligners placed similar numbers of reads uniquely, yet the numbers of ambiguously-placed or unmapped reads varied widely.
Novoalign in paired-end mode (Novoalign-PE) was the clear winner, though in fairness, it did take at least twice as long to complete as the other aligners.
Acknowledgement: Mass Genomics http://www.massgenomics.org/short-read-aligners
Trial 1 Trial 2


Recommendations Proven functionality: Maq
– Maq is clearly the most widely used and probably the most publication-proven algorithm
Speed: Bowtie, SOAP and GEM– The Burrows-Wheeler Transformation indexing aligners have a
clear speed advantage. Both have the added benefit of paired-end mode
• Sensitivity: Novoalign & cross_match• Both aligners have algorithmic advantages over programs like
Maq. Novoalign allows gaps in single-end mode, and seems better suited to handling mismatches as well. The cross_match program had the best overall sensitivity
• Variation detection: SOAP & Novoalign• Novoalign makes the list because of added sensitivity to
substitutions and gaps, which makes it ideal for mining Maq-unplaced reads for variation. SOAP developers have already released a SNP caller (SOAPsnp) and promise an indel caller too
Acknowledgement: Mass Genomics http://www.massgenomics.org/short-read-aligners

Quantification of known transcripts
• The expression levels of known transcripts (exon model) are measured by the number of reads per kilobase of transcript per million mapped reads (RPKM)
Mortazavi, A., Williams, B. A., McCue, K., Schaeffer, L. & Wold, B. Mapping and quantifying mammalian transcriptomes by RNA-Seq. Nature Methods 5, 621–628 (2008).

Lander-Waterman model: foundation of gene expression profiling using mRNA-seq
Consider a shotgun sequencing process in which N reads (of length T) are sampled from a pool of transcripts of total length G. The number of reads mapped to a transcript (with length g and n copies) follows a Poisson distribution with mean α ~ n(g-T)/G NT/G.
The variation of the number of reads can also be computed based on this model.
For details see: Sharon et. al, RECOMB 2009.

Prediction of novel transcripts:assembling the short reads
• Comparative assembly: using an annotated reference genome– Searching for junctions of annotated exons– Assembling splice variants– Finding paired-end (PED) links between exons
• De novo assembly: without using a reference genome– Splicing graph approach: Heber, et. al. ISMB 2002 for EST
assembly– K-mer based approach, working efficiently for short reads
(e.g. Velvet, ALLPATH and EULER-ESR)– Compact representation for alternative splicing variants– Can also be adapted for comparative assembly & assembly
with PED reads
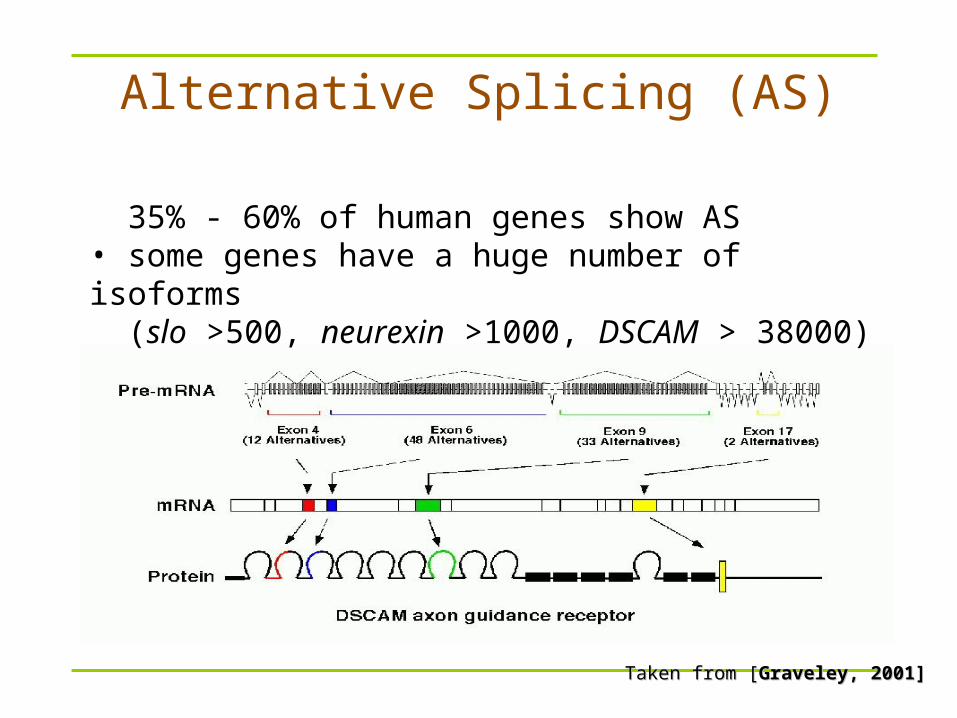
Alternative Splicing (AS)
Taken from [Taken from [Graveley, 2001]Graveley, 2001]
• 35% - 60% of human genes show AS• some genes have a huge number of isoforms (slo >500, neurexin >1000, DSCAM > 38000)

How to assemble multiple alternative spliced transcripts?
11 22 33
In the presence of AS, conventional assembly may be In the presence of AS, conventional assembly may be erroneous, ambiguous, or truncated.erroneous, ambiguous, or truncated.
Overlapping
truncated truncated
correct truncated

Splice graph approach
Replace the problem of finding a list of consensus sequences
with Graph Reconstruction Problem:
Given an set of expressed sequence, find a minimal graph (splicing graph) representing all transcripts as paths.
Heber, et. al. ISMB 2002

Splicing graphs

Splicing graph construction
If a reference genome is used: Map reads to the reference genome (short read aligner) Check alignment (splice sites, quality) Connect consecutive positions Build splicing graph
splicing graphsplicing graph
genomic seq.genomic seq.
transcript 1 transcript 1
transcript 2 transcript 2

CGG CGG GGAGGACTC CTC TCG TCG CGA CGA GAT GAT ATG ATG TGA TGA GACGAC
Splicing graph construction
If a reference genome sequence is not used: Break sequences into k-mers (20-mers). Build graph using k-mers as vertices, connect them iff they occur
consecutively in a sequence [Pevzner et al., 2001].
Example (3-mers):Sequences: CTCGATGAC, CTCGGACVertices: CTC, TCG, CGA, GAT, ATG, TGA, GAC, CGG, GGA
splicing graphsplicing graph
CTCG AT GACcollapsed splicing graph

Splicing graph and splicing variants
A B C D
A B C D
s
s
f
f
An edge in the splicing graph, called a block, represents a maximal sequence of adjacent exons or exon fragments that always appear together in a given set of splicing variants. Therefore, variants can be represented by sequence of blocks, e.g. {ABCD, C, AD}.
Vertices s and f are included into graph, and are linked to the 5’ and 3’ of each variant, respectively. Each splicing variant corresponds to a directed path that goes from s to t. But note that some paths in the splicing graph do not correspond to real variants, e.g. {ABC, CD}.
Larcroix, et. al. WABI, 2009

Quantifying splicing variants
(Transcriptome reconstruction problem) Given a set of candidate splicing variants S={x1, …, xk}, and a set of constraints {C1, …, Ck}, each indicating the total abundance of a subset of variants in S, assign the most possible abundance to each variant such at all constraints are satisfied?
In practice, a constraint Cj, will reflect the abundance of a block junction j, measured by mRNA-seq reads mapped to the two linked blocks.
Larcroix, et. al. WABI, 2009

Quantifying all splicing variants
For example, in the case of previous slide, constraints can be generated for junctions of blocks {sA=A, AB, BC, CD, sC=Cf=C, Df=D, AD}.
Specifically, for all potential variants in the graph {ABCD, ABC, AD, C, CD}, we have independent constraints of,
ABC+C=CCf; ABCD+ABC=CAB;
C+CD=CsC; AD=CAD
Larcroix, et. al. WABI, 2009

Quantifying known splicing variants
In we known the variants in advance, the same approach can be applied. For example, assuming three known variants in the graph are {ABCD, AD, C}, we have (much simpler) independent constraints of,
C=CCf; ABCD=CAB;
AD=CAD
Larcroix, et. al. WABI, 2009

Integrating mapped PED reads
• Given a splicing graph and a set of observed PED reads mapped to block junctions, we first identify all paths (corresponding to potential splicing variants) containing only observed pairs of blocks.
• The resulting variants can be used for quantification as indicated in the previous slides.
Larcroix, et. al. WABI, 2009

A probabilistic approach to transcriptome reconstruction
The previous model assumes all observed abundance values in the constraints are accurate. In practice, however, it may not be true due to the noise in the mRNA-seq data. To handle this, a maximum likelihood (ML) model was introduced.
For a gene g, suppose it has m exons with lengths L=[l1, l2,..., lm] and n variants with abundances =[1, 2,...,n]. Consider a set of constraints in which each constraint k has an observed abundance xk reflecting the approximate total abundance of a subset of variants (denoted by cki, cki=1 if variant i is included; cki=0 otherwise).
Jiang and Wong, Bioinformatics, 2009

ML model Based on the previous notation, the expected
abundance in constraint k is k= ickii.
The likelihood of observing an abundance k for constraint k can be computed by Lander-Waterman’s Poisson model:
The MLE of the abundances of known variants can be computed by maximizing the likelihood function.
The uncertainty of the MLE can be estimated using an important sampling (IP) on the joint distribution.
k k
xk
x
eXL
kk
!|
Jiang and Wong, Bioinformatics, 2009

Other applications of mRNA-seq:gene fusion
Following the alignment of the short m-RNA reads to a reference genome, most reads will fall within a single exon, and a smaller but still large set would be expected to map to known exon-exon junctions. The remaining unmapped short reads can then be further analyzed to determine whether they match an exon-exon junction where the exons come from different genes. An alternative approach is using pair-end reads, when potentially a large number of paired reads would map each end to a different exon, giving better coverage of these events. Nonetheless, the end result consists of multiple and potentially novel combinations genes providing an ideal starting point for further validation.
Acknowledgement: Wiki – mRNA-seq

Challenges: mapping reads to reference genome
Sequencing errors and polymorphisms It is more difficult to map reads that span splice
junctions (for complex transcriptomes), due to the presence of extensive alternative splicing and trans-splicing.
Repetitive sequences: a significant portion of sequence reads match multiple locations in the genome– Obtaining longer sequence reads, or paired-end
sequencing strategy, should help alleviate the multi-matching problem.

Challenges: novel splicing variant & quantification
Discovery of novel splicing variants– Reconstruction of complete splice forms– Reliability: assignment of a P-value
Quantifying the expression levels of recently duplicated genes– Equivalent to the problem of quantifying splicing
variants, but harder because many isoforms need to be consider simultaneously

New discoveries from mRNA-Seq Novel features of eukaryotic gene organization
– Many yeast genes were found to overlap at their 3' ends; 808 pairs of ORFs overlap at their 3' ends (Science 320, 1344–1349, 2008)
– Antisense expression (may be involved in gene regulation) is enriched in the 3' exons of mouse transcripts (Nature Methods 5, 613–619, 2008)
Novel splicing forms– 31,618 known splicing events were confirmed (11%
of all known splicing events) and 379 novel splicing events were discovered in human (Biotechniques 45, 81–94, 2008)
Novel transcripts

A proposed model for the metabolism of genic transcripts into a diversity of long and short RNAs.
Deeper insights into the complex transcriptomes
Nature 457, 1028-1032, 2009
Deep sequencing of small RNAs (<200 nucleotides) from human HeLa and HepG2 cellsIndividual non-coding RNAs dwarf the number of protein-coding genes, and include classes that are well understood as well as classes for which the nature, extent and functional roles are obscure

Another paper of deep sequencing of human transcriptome
50% of the reads mapped to unique genomic locations, of which 80% corresponded to known exons.
66% of the polyadenylated transcriptome mapped to known genes and 34% to nonannotated genomic regions.
On the basis of known transcripts, RNA-Seq can detect 25% more genes than can microarrays.
A global survey of messenger RNA splicing events identified 94,241 splice junctions (4096 of which were previously unidentified) and showed that exon skipping is the most prevalent form of alternative splicing.
Ref: Science, 321(5891):956-60, 2008

Readings RNA-Seq: a revolutionary tool for transcriptomics,
Nature Reviews Genetics 10, 57-63, 2009 Go with microarray or RNA-seq?
– Advantages of next-generation sequencing versus the microarray in epigenetic research,
– Briefings in Functional Genomics and Proteomics 2009 8(3):174-183)
Full-length transcriptome assembly from RNA-Seq data without a reference genome– Nature Biotechnology Volume: 29, Pages: 644–652 Year published: (2011)
Next-generation transcriptome assembly– Nature Reviews Genetics 12, 671-682– This Review summarizes the recent developments in transcriptome assembly
approaches — reference-based, de novo and combined strategies