
Computational Analysis of Enhanced Circulating Tumour … · System with an Integrated...
26
chemosensors Article Computational Analysis of Enhanced Circulating Tumour Cell (CTC) Separation in a Microfluidic System with an Integrated Dielectrophoretic-Magnetophorectic (DEP-MAP) Technique Wan Shi Low * and Nahrizul Adib Kadri Department of Biomedical Engineering, Faculty of Engineering, University of Malaya, 50604 Kuala Lumpur, Malaysia; [email protected] * Correspondence: [email protected]; Tel.: +60-379-676579 Academic Editor: Igor Medintz Received: 4 March 2016; Accepted: 22 July 2016; Published: 18 August 2016 Abstract: Cell based cancer analysis is an important analytic method to monitor cancer progress on stages by detecting the density of circulating tumour cells (CTCs) in the blood. Among the existing microfluidic techniques, dielectrophoresis (DEP), which is a label-free detection method, is favoured by researchers. However, because of the high conductivity of blood as well as the rare presence of CTCs, high separation efficiency is difficult to achieve in most DEP microdevices. Through this study, we have proposed a strategy to improve the isolation performance, as such by integrating a magnetophoretic (MAP) platform into a DEP device. Several important aspects to be taken into MAP design consideration, such as permanent magnet orientation, magnetic track configuration, fluid flow parameter and separation efficiency, are discussed. The design was examined and validated by numerical simulation using COMSOL Multiphysics v4.4 software (COMSOL Inc., Burlington, MA, USA), mainly presented in three forms: surface plot, line plot, and arrow plot. From these results, we showed that the use of a single permanent magnet coupled with an inbuilt magnetic track of 250 μm significantly strengthens the magnetic field distribution within the proposed MAP stage. Besides, in order to improve dynamic pressure without compromising the uniformity of fluid flow, a wide channel inlet and a tree-like network were employed. When the cell trajectory within a finalized MAP stage is computed with a particle tracing module, a high separation efficiency of red blood cell (RBC) is obtained for blood samples corresponding up to a dilution ratio of 1:7. Moreover, a substantial enhancement of the CTCs’ recovery rate was also observed in the simulation when the purposed platform was integrated with a planar DEP microdevice. Keywords: dielectrophoresis; magnetophoresis; circulating tumour cells; COMSOL; numerical analysis 1. Introduction In clinical practice, cancer diagnostics are commonly performed through radiological imaging modalities such as traditional radiography (X-ray), magnetic resonance imaging (MRI), computed tomography (CT), positron emission tomography (PET) or ultrasound [1]. These techniques allow visualization of the internal body structure, thus enabling physicians to delineate the group of tumour cell colonization. However, there are some drawbacks to these techniques. For instance, the deficiencies of resolution in imaging modalities have precluded them from imaging small numbers of cancer cells before angiogenic switch, which in turn limits the detection sensitivity [2,3]. Furthermore, most of the cases are normally diagnosed at advanced stages where patients often relapsed within 24 months of therapeutic intervention [4,5]. Chemosensors 2016, 4, 14; doi:10.3390/chemosensors4030014 www.mdpi.com/journal/chemosensors
-
Upload
doankhuong -
Category
Documents
-
view
216 -
download
0
Transcript of Computational Analysis of Enhanced Circulating Tumour … · System with an Integrated...

chemosensors
Article
Computational Analysis of Enhanced CirculatingTumour Cell (CTC) Separation in a MicrofluidicSystem with an IntegratedDielectrophoretic-Magnetophorectic(DEP-MAP) Technique
Wan Shi Low * and Nahrizul Adib KadriDepartment of Biomedical Engineering, Faculty of Engineering, University of Malaya, 50604 Kuala Lumpur,Malaysia; [email protected]* Correspondence: [email protected]; Tel.: +60-379-676579
Academic Editor: Igor MedintzReceived: 4 March 2016; Accepted: 22 July 2016; Published: 18 August 2016
Abstract: Cell based cancer analysis is an important analytic method to monitor cancer progress onstages by detecting the density of circulating tumour cells (CTCs) in the blood. Among the existingmicrofluidic techniques, dielectrophoresis (DEP), which is a label-free detection method, is favouredby researchers. However, because of the high conductivity of blood as well as the rare presenceof CTCs, high separation efficiency is difficult to achieve in most DEP microdevices. Through thisstudy, we have proposed a strategy to improve the isolation performance, as such by integratinga magnetophoretic (MAP) platform into a DEP device. Several important aspects to be taken intoMAP design consideration, such as permanent magnet orientation, magnetic track configuration,fluid flow parameter and separation efficiency, are discussed. The design was examined and validatedby numerical simulation using COMSOL Multiphysics v4.4 software (COMSOL Inc., Burlington, MA,USA), mainly presented in three forms: surface plot, line plot, and arrow plot. From these results, weshowed that the use of a single permanent magnet coupled with an inbuilt magnetic track of 250 µmsignificantly strengthens the magnetic field distribution within the proposed MAP stage. Besides,in order to improve dynamic pressure without compromising the uniformity of fluid flow, a widechannel inlet and a tree-like network were employed. When the cell trajectory within a finalized MAPstage is computed with a particle tracing module, a high separation efficiency of red blood cell (RBC)is obtained for blood samples corresponding up to a dilution ratio of 1:7. Moreover, a substantialenhancement of the CTCs’ recovery rate was also observed in the simulation when the purposedplatform was integrated with a planar DEP microdevice.
Keywords: dielectrophoresis; magnetophoresis; circulating tumour cells; COMSOL; numerical analysis
1. Introduction
In clinical practice, cancer diagnostics are commonly performed through radiological imagingmodalities such as traditional radiography (X-ray), magnetic resonance imaging (MRI), computedtomography (CT), positron emission tomography (PET) or ultrasound [1]. These techniques allowvisualization of the internal body structure, thus enabling physicians to delineate the group of tumourcell colonization. However, there are some drawbacks to these techniques. For instance, the deficienciesof resolution in imaging modalities have precluded them from imaging small numbers of cancer cellsbefore angiogenic switch, which in turn limits the detection sensitivity [2,3]. Furthermore, most of thecases are normally diagnosed at advanced stages where patients often relapsed within 24 months oftherapeutic intervention [4,5].
Chemosensors 2016, 4, 14; doi:10.3390/chemosensors4030014 www.mdpi.com/journal/chemosensors

Chemosensors 2016, 4, 14 2 of 26
The discovery of circulating tumour cells (CTCs) as a precursor to the formation of secondarytumours has shed some new light in clinical prognosis. These cells are believed to have undergonecellular transformation that caused them to lose their cell polarity and cell-cell adhesion via increasedmobility and invasiveness, to enter into the bloodstream [6]. Its clinical significance was augmentedwhen a study conducted by Husemann et al. highlighted that CTCs can be found in patients evenbefore a primary tumour is detected with conventional clinical screening methods [4]. Furthermore,prospective multicentre studies reported that patients with the presence of 5 CTCs per 7.5 mL of bloodwould have poor survival rates [7,8]. Accordingly, this finding has highlighted the prognostic valueof CTC enumeration in correlating progression-free survival and overall survival of patients withmetastatic carcinoma. As a result, the enumeration of CTC from blood of a cancer patient can serve asan important biomarker for real-time prognosis thus precluding recurrences and metastatic relapses.Despite this clinical relevance, the detection and analysis of CTCs are extremely difficult due to theirrare appearance in blood. For comparison, there are approximately 1 to 10 CTCs within 1 mL of bloodwhich contains a few million white blood cells and a few billion red blood cells. Furthermore, CTCs’highly heterogeneous morphologies which are distinct from the profiles of single cells from cancer celllines have made the isolation process technically challenging [9–12]. Thus, a highly sensitive detectiondevice is needed to accurately characterize and enumerate CTCs.
The selection of a microfluidic sorting system can be divided into two broad categories: thebiochemical-enhanced method and the label-free method. The biochemical-enhanced methoddifferentiates CTCs from other blood cells based on their immune-affinity properties [9]. However,as the knowledge of specific and unique antigens that can distinguish CTCs from hematopoieticstem cells is limited, this technology may potentially miss CTCs that have undergone a transition tobe less-expressive or if they completely lose certain antigens [5]. Meanwhile, the label-free methodisolates cells mainly based on their intrinsic bio-physical properties, such as size, deformability, andelectric conductivity [13]. Examples of these techniques include microfiltration [14,15], hydrodynamicsorting [16,17] and dielectrophoresis [18,19]. Since CTCs are unmodified by physical separation, cellsisolated using these techniques are compatible with a wider range of downstream phenotypic andgenotypic analyses, including those requiring viable cells. Despite their popularity in CTC research,there are some issues which arise in the size-based microfluidic separation method, particularlyof microfiltration and hydrodynamic cell sorters. A study conducted by Park et al. showed thata significant overlap in size of certain CTCs with leukocytes resulted in leukocyte contamination [20].In addition, as the effectiveness of these size-based microfluidic devices are controlled by tailored gapdimensions, their separation mechanisms are not universal and will require variation in design whenthe target sample changes. In contrast to size-based microfluidic separation, dielectrophoresis (DEP)utilizes an external electric field source to manipulate the CTC separation within the microchannel.This technique allows the reconfiguration of the electric field externally to obtain accurate isolationresults in accordance with cell phenotypes, thereby promoting flexible control of the microenvironmentfor a wide range of cells. Furthermore, several studies discovered that most CTCs exhibit similarresponses when they are subjected to an electrical field in spite of their heterogeneity [19]. Consequently,it has been surmised that DEP can be used to detect CTCs of different cancer types. This technique isthus employed to develop a microfluidic platform for CTC isolation in thiss tudy.
Generally, DEP refers to a net force on the dielectric particles in response to a spatially non-uniformelectric field. The expression for the DEP force can be represented by:
→F DEP = 2πε0εmR3Re [K (ω)]∇E2 (1)
where ∇E is the magnitude gradient of electric field, expressed in RMS value and K (ω) denotesthe complex Clausius-Mossotti factor. Leveraging the dissimilarities of electrical properties betweenCTCs and blood cells, few bench-top DEP devices have been successfully used to detect variablesof cancer cells, including oral [21,22], colon [23], breast [19], lung and prostate cancer cells [24].
Chemosensors 2016, 4, 14 3 of 26
Although the discussed DEP technique shows a successful CTCs’ isolation outcome, there are somelimitations reported across multiple studies. First and foremost, for an on-chip DEP microfluidicdevice, the reported separation efficiency is relatively low, such that the achievable recovery rate forcancer cells is less than 80%. Such a scenario is mainly caused by the high conductivity of blood [25].This distinctive blood feature has resulted in cells experiencing negative DEP most of the time, andtherefore influencing the separation performance of a DEP device (e.g., difficult to obtain a high purityoutput) [26]. Additionally, the high conductivity of a blood suspension is reported to cause significantheating within a DEP device. This may lead to undesirable lysing of cells [26,27].
As first noted by Gascoyne et al. [28], the integration of multiple separation forces enablesa microfluidic device to precisely control the cell separation dynamics, and thus give rise to newmodalities of separation. In order to improve CTC capture efficiency as well as to achieve the isolationof cell types having small differences in their DEP crossover frequencies, integration of DEP withother cell separation techniques has been attempted. Up-to-date, there is only one method, knownas hydrodynamic separation technique, which has been reported to be integrated with a DEP-basedmicrofluidic chip for CTCs’ isolation. This technique is pioneered by a group of scientists from theUniversity of Texas MD Anderson Cancer Centre’s Laboratory Diagnostic Microsystems (Houston,TX, USA), whereby they combined the DEP force with field-flow fractionation to create DEP-FFF [29].In this approach, a diluted mixed cell population which continuously flows into the chamber, issubjected to a combination of upward-pushing DEP force, downward-pulling sedimentation force,and hydrodynamic force. When the preliminary performance of DEP-FFF is tested using humanblood sample spiked with breast cancer cell line (MDA-MB-231), Gupta et al. demonstrated a recoveryefficiency of 86.6% [30]. Therefore, it can be deduced that the development of DEP-FFF has enhancedcell discriminating ability and throughput in contrast to a-standalone-DEP stage.
Despite enhanced separation, there are numerous problems to be solved in this integrationplatform. The latest study conducted at BEACON indicated an existence of excessive cell loadingin the DEP-FFF device [31]. Such a condition can result in dipole-dipole interaction between cells,thus causing the clustering of cells and the entrapment of both similar and dissimilar cell types.Consequently, it will reduce the separation efficiency of a device. For example, on a DEP-FFF devicewhich consists of arrays of 50 µm wide interdigitated electrodes, the isolation efficiency is 85%at a loading density of 500 peripheral blood cells per mm2 but only 20% at a loading density of10,000 peripheral blood cells per mm2 [32]. However, it should to be noted that the number of targetCTCs in clinical specimens is very small. The overloading of cells within the DEP chamber whichmight cause interactions between CTCs does not have any impact on device performance. From a CTCapplication standpoint, such a condition is undesirable as it shows the isolation efficiency of CTCs isindependent of their concentration. Though few studies suggested that the overloading cell problemcan be solved by increasing a blood dilution ratio, Pommer et al. [33] and Liao et al. [34] reported thatthe actual separation efficiency dropped approximately 20% if a dilution ratio of 1:10 of the wholeblood sample was carried out. Furthermore, another study conducted by Takaori in 1966 indicatedthat an excessive dilution will causes a progressive decrease in the blood sample pH [35]. Since bloodcells respond quickly to the changes in their environment, their biological characteristics might changein regard to the reduction of pH.
To circumvent these issues, integration of DEP with another cell separation force will be attempted.The design will focus on decreasing an excessive cell loading within a DEP separation chamber, as wellas enhancing recovery rate and throughput. Notably, in a whole blood sample, 98% of humanblood cells are red blood cells (RBCs), whose cell density is around 5 × 10⁶ cells/µL [36]. Besides,a study conducted by a group from LifeScan Scotland showed that electrical conductivity of theblood medium is highly dependent on the haematocrit level within the blood [37]. As such, theblood medium conductivity will be reduced with the decreased of haematocrit level. Therefore,a removal of RBCs from a whole blood sample in the early stage would greatly help downstreamsub-classification of target cells as well as to eliminate cell overloading issues. In the literature,centrifugation has been employed as a pre-enrichment step prior to sorting by DEP. However, previous
Chemosensors 2016, 4, 14 4 of 26
studies have shown that the blood sample tends to mix with the gradient media if the centrifugationis not performed immediately after applying it to a sample. Besides, excessive cell loss might occuras a consequence of density-medium-related cytoxicity [38]. Importantly, this technique is found tostress cells for an extended period, which might activate the white blood cells [39]. Such activation willalter the protein and gene expression pattern of white blood cell (WBC), thus limiting the downstreamapplication for DEP.
Interestingly, various studies have reported RBCs to exhibit a distinctive magnetic response undera magnetic field in contrast to both WBC and CTC. The presence of iron-containing molecules, such ashaemoglobin within RBC has resulted in it behaving as a paramagnetic microparticle when subjectedto an inhomogeneous magnetic field. CTC and WBC, on the other hand, are found to be lacking iniron-manganese-containing molecules which behave as diamagnetic microparticles, such that the cellsare repelled from the high magnetic field gradient [40]. Owning to this feature, a technique whichemploys non-uniform magnetic field in cell separation, namely magnetophoresis (MAP) is proposed inthis study as a pre-enrichment stage of the DEP separation system. Despite relatively few MAP systemshaving been developed for RBC separation, studies have shown promising results with approximately90% RBC recovery with this method [41–43]. Its equation can be written as:
−−−→FMAP =
∫V
(→M ·→∇) −→
Bext d→v (2)
where, V is the volume of a cell, M denotes the resulting magnetization of the material, ∇ is the
gradient operator, and→
Bext is the magnitude of the external magnetic flux density.Notably, a precise control of the cell’s microenvironment in a microfluidic system still remains
a vexing challenge within the technological realm. In this case, computational modelling could serveas a decision-making tool for researchers by providing an order of magnitude estimate of the potentialchip performance, thus enabling a fruitful path to be taken from the beginning of the experiment.Henceforth, in the course of this study, a computational model, which primarily focuses on design anddevelopment of the MAP stage, will be generated with COMSOL Multiphysics to assist the designchoices and to confirm the analytical results by gaining further insight into the produced magneticfield phenomena within our proposed microfluidic platform. As our design features continuous flow,the parameters such as sample size, surface-to-volume, and hydrodynamic force are also addressedto help develop a uniform velocity flow within the microfluidic channel that encourages better celldistribution for integrated MAP and DEP application. A detailed description of the requirementsis given in Supplementary Section 1. In order to validate the feasibility of separating blood cells ina continuous flow environment, a computational experiment is conducted using a particle-tracingmodule. Its cell trajectory analysis is implemented based on the Lagrangian-Eulerian numericalapproach that takes into account magnetic, electric, and hydrodynamic forces. Based on the result ofthe simulation, our study outlines the best geometrical design of the MAP stages in order to facilitateCTC separation for downstream DEP analysis. At the end of this research, an integrated MAP-DEPdevice is examined, whereby the DEP platform design is adapted from a study conducted by Moon etal. [19]. To the best of our knowledge, there are no benchmark datasets for the integration of DEP andMAP for CTCs’ isolation.
2. Computational Modelling Method
Our computational analysis focused on the MAP stage, whereby the evaluated properties includepermanent magnet orientation, measurement of magnetic field gradient across the ferromagnetic track,hydrodynamic mechanism, separation efficiency, and dilution ratio (see Supplementary Section 2for details). By assembling these parameters in algorithms, a separation can be computationallytested and calibrated to achieve optimal recovery rate and throughput. Generally, the computationalfluid dynamics method was conducted using the finite analysis package COMSOL Multiphysic 4.4®
(COMSOL Inc., Burlington, CA, USA). It is a modelling software which consists of advanced physicalsimulation platform as well as visualization tools to treat fluid structure interaction within our
Chemosensors 2016, 4, 14 5 of 26
microfluidic architecture. It was used to perform numerical methods with a primary focus on MAPand DEP equation for both 2D and 3D design in our study. The aim of 2D modelling was to validate theforces within the proposed microchannel, while the 3D modelling was employed to compute particletrajectory. To perform the numerical analysis, several assumptions as written below were made:
• The fluid injected at the inlet channel is non-Newtonian, whereby the viscous stress that arisesfrom the flow is linear at every point.
• Cells are spherical.• The flow within the microfluidic is incompressible such that it has constant density, viscosity,
and concentration.• As the cross sectional of the microchannel is less than 1 mm3, the Reynolds number generated
within the fluid flow is less than 200. Therefore, the flow is considered laminar.• Blood clotting did not occur within the microchannel.• Both the surrounding medium and the system are considered to have uniform bulk conductivities,
dielectric constants, and magnetic permeability. Hence no space charge with the system.• The fluid has constant electric conductivity and magnetic permeability.• A constant magnetic field gradient is generated across the fluid volume in the MAP stage.
The electric conductivity is negligible in this stage.• The magnetization of cells is collinear with the magnetic field.• The presence of a non-magnetic cell does not distort the magnetic field lines in the MAP stage.• Joule heating and electrochemical effects are assumed negligible in the DEP stage. This is because
the electric field is low and the frequency is high.• Cells flow according to the fluid stream. They do not stick to the boundaries.
The proposed microfluidic geometry is available in Supplementary Section 3. Prior to generatingthe 2-D COMSOL simulation model, the CAD model of the microfluidic architecture was created.It was performed by using AutoCAD® 2013 (Autodesk Inc., San Francisco, CA, USA) due to itsability to generate complicated designs and its compatibility with COMSOL Multiphysic. The designgeometry was then imported into the COMSOL model library. Notably, in order to generate the3D model, the desired work plane had first to be indicated before the imported 2-D geometry waslocated on it. Subsequently, the 2-D cross section layout was extruded in the Z direction to form a 3-Dstructure. After completing the geometry for our proposed model, the materials of the domains weredefined accordingly. In this case, the property function of each material was complemented by theCOMSOL Material Library. To attain a more realistic device design, the physical parameters of bloodcells associated with both the MAP and DEP device were obtained from the literature as described inTable 1 [33,44–46]. These parameters were directly accounted in our resulting computation. Notably,both breast and prostate CTC are of interest in this study in which breast CTCs have the largest size inCTC taxonomy [19,46,47] and vice versa for prostate CTCs [48–50].
Table 1. The dielectric and magnetic parameters of cells used for device modelling.
Cell Type Mean Radius, r Magnetic Susceptibility, χcellElectrical Properties
σcytoplasm (S/m) εcytoplasm
Red blood cell (RBC) 4 −3.69 × 10⁻⁶ 0.52 57White blood cell (WBC) 7 −9.9 × 10⁻⁶ 0.76 150.9
Human breast cancer MDA-231 20 −9.5143 × 10⁻⁶ 0.62 52Human prostate cancer HeLa 7.36 −9.4966 × 10⁻⁶ 0.21 52
Platelet 2 −9.2 × 10⁻⁶ 0.25 1 × 10⁻⁷
In the COMSOL model builder, a complex system of points was presented to highlight the stresslevels of a particular area. Generally, regions which normally have higher node density received largeamounts of stress compared to those with lesser node density. Generation of mesh happened whenthese points were connected according to nodal point number. It was also programmed to define the

Chemosensors 2016, 4, 14 6 of 26
flow simulation properties within the microfluidic channel. To avoid inverted mesh elements, thesize of mesh had to be very fine around the region where remeshing occurred (such as the curvedregion of the channel). This was accomplished by using “Free Mesh Parameters”, whereby the sizeof mesh was set to “predefined”. To obtain an accurate solution with a mesh that was sufficientlydense and not overly demanding of computing resources, a “Convergence Study” was performedusing “Physic Induced Sequence Setting”. The results were found to converge satisfactorily whena maximum element size of 5 × 10⁻⁵ was stipulated for the fluidic channel subdomain.
Subsequently, the finite element method analysis was implemented using three main modules,including: magnetic field, electric field, and Navier-Stokes module. The result obtained from themagnetic field (H, M, ∂H
∂X , ∂H∂Y , ∂H
∂Z ) and electric field simulation (E, ∂E∂X , ∂E
∂Y , ∂E∂Z ) was taken as input
for the particle tracing module to generate the cell trajectory within the proposed microchannel.A detailed flow chart of the modelling approach for the proposed micro-device is depicted in Figure 1.Additional details of how the computational mode was built and validated are included in theSupplementary Section 4.
Chemosensors 2016, 4, 14 6 of 26
inverted mesh elements, the size of mesh had to be very fine around the region where remeshing occurred (such as the curved region of the channel). This was accomplished by using “Free Mesh Parameters”, whereby the size of mesh was set to “predefined”. To obtain an accurate solution with a mesh that was sufficiently dense and not overly demanding of computing resources, a “Convergence Study” was performed using “Physic Induced Sequence Setting”. The results were found to converge satisfactorily when a maximum element size of 5 × 10⁻⁵ was stipulated for the fluidic channel subdomain.
Subsequently, the finite element method analysis was implemented using three main modules, including: magnetic field, electric field, and Navier-Stokes module. The result obtained from the magnetic field (H, M, , , ) and electric field simulation (E, , , ) was taken as input for the particle tracing module to generate the cell trajectory within the proposed microchannel. A detailed flow chart of the modelling approach for the proposed micro-device is depicted in Figure 1. Additional details of how the computational mode was built and validated are included in the Supplementary Section 4.
Figure 1. Detailed flow chart of our simulation approach.
3. Results and Discussions
3.1. Magnetophoresis Stage
In this section, we study the effect of magnetic field caused by various placements of the permanent magnet as well as the use of a ferromagnetic track. The geometrical design of the MAP chamber which accommodates uniform flow as well as optimized magnetic field distribution is
Figure 1. Detailed flow chart of our simulation approach.
3. Results and Discussions
3.1. Magnetophoresis Stage
In this section, we study the effect of magnetic field caused by various placements of thepermanent magnet as well as the use of a ferromagnetic track. The geometrical design of the MAPchamber which accommodates uniform flow as well as optimized magnetic field distribution isinvestigated. For the purpose of this analysis, the design concept focuses solely on the MAP stage.
Chemosensors 2016, 4, 14 7 of 26
A permanent magnet with dimension of 15 mm× 10 mm× 10 mm was employed in our computationalstudy. Notably, its length is determined accordingly to the length of the MAP microchamber.
3.1.1. Permanent Magnet Configuration: Conventional vs. Face-to-Face Permanent Magnet
Three references of permanent magnet configurations as mentioned in Supplementary Section 3.1.1were studied. For the conventional method, a magnet was located 5 mm from the microfluidicchannel and was simulated as having a positive magnetization. Meanwhile, the face-to-face magnetconfiguration was surrounded by two permanent magnets, 5 mm from the microchannel wall ateach side. As mentioned in Supplementary Section 1, the ratio of magnet length to magnet inter-gapdistance for the face-to-face magnet configuration has to be more than 1. In this design, the calculatedratio is 15
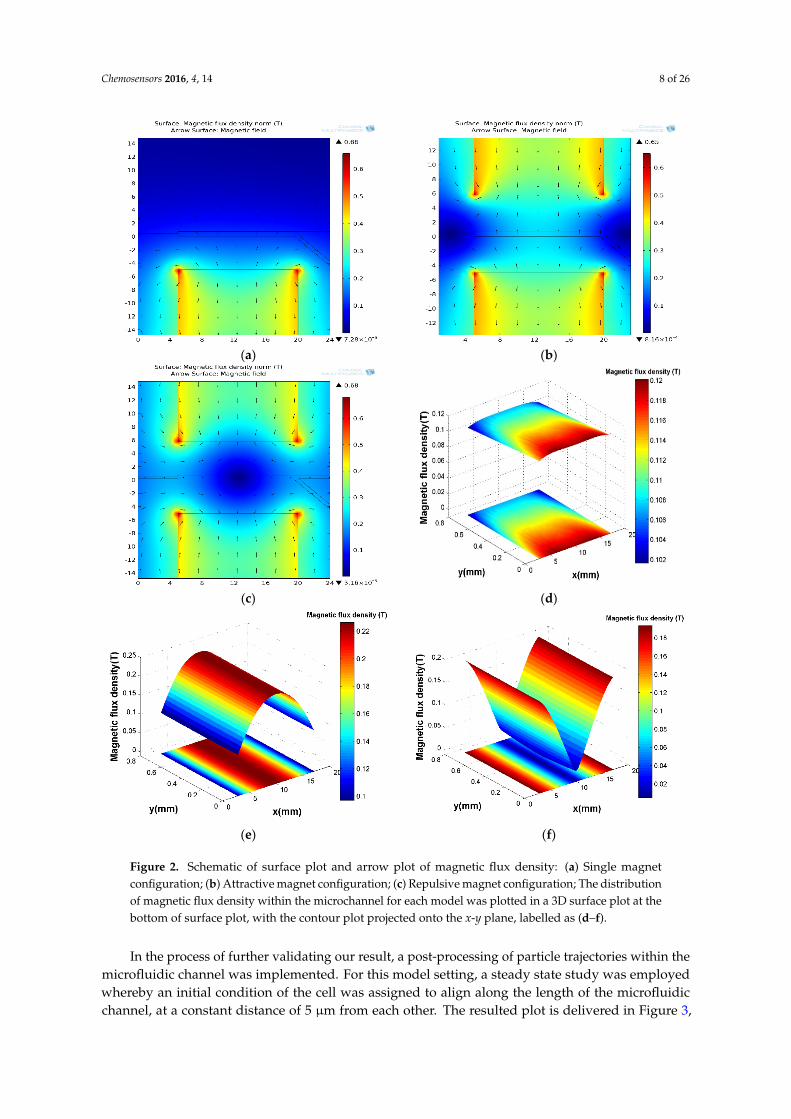
10+0.75 = 1.395, thus fulfilling one of our design requirements. To generate an attractivemagnet orientation as notified in Figure S2b (refers to Supplementary materials), the magnetizationof both permanent magnets were configured as positive. Conversely, for the repulsive magnetconfiguration (see Figure S2c), the magnetization of both magnets were computed to have oppositesigns. A distribution of magnetic flux density generated from these magnet configurations is presentedin surface plots, as depicted in Figure 2.
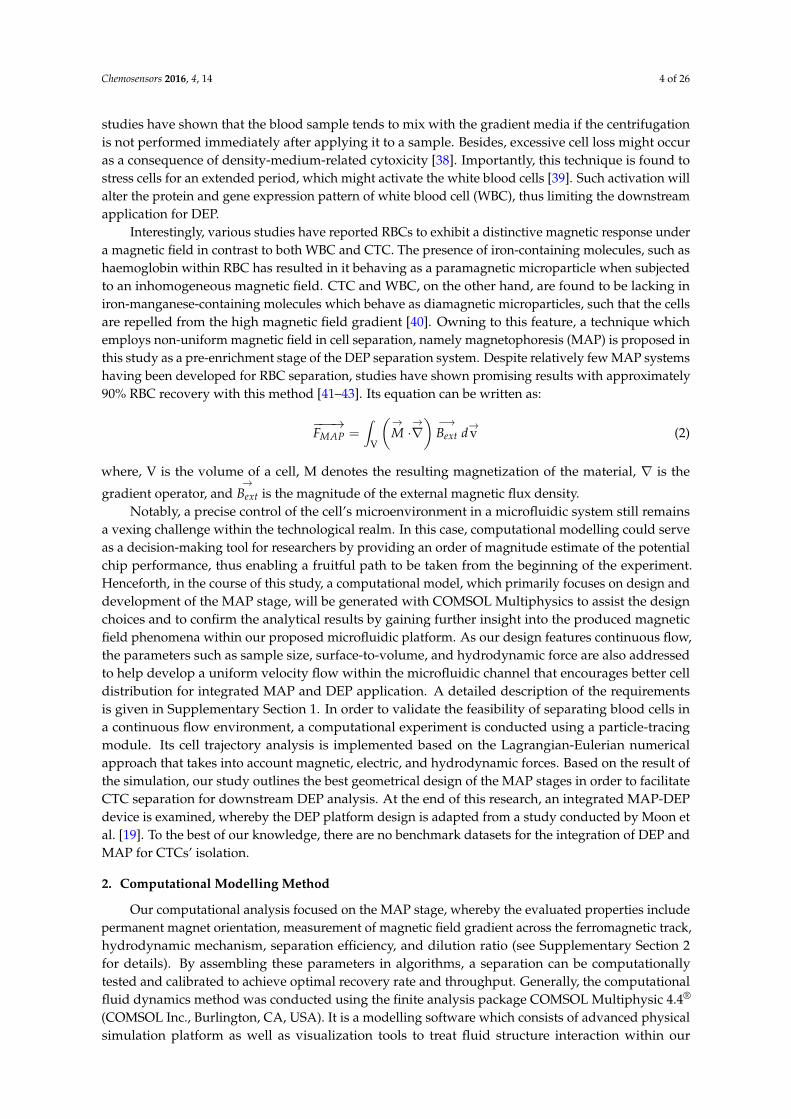
Figure 2a–c shows the 2D surface plot of magnetic flux density (B) of the discussed permanentmagnet configuration. To illustrate the direction of the magnetic field in each model, an arrow plotof the magnetic field lines was coupled on each surface plot. In Figure 2a, a uniform magnetic fluxdensity, which was represented by an evenly blue spectrum, was found within the microchannel whenthe single permanent magnet configuration was applied. Meanwhile, in both attraction (Figure 2b)and repulsion (Figure 2c), the fluctuation of magnetic flux density is observed to be higher at themicrochannel region which is aligned at the midpoint (x = 10) between both permanent magnets.Note that the cell separation takes place in the MAP microchamber. It refers to the region whichis located parallel to the permanent magnet that ranges from x = 2.5 to x = 17.5. To quantitativelyevaluated magnetic flux density within this region, 3D surface charts with contour plots projected ontox-y plane, were plotted across the length (x-axis) and the width (y-axis) of the microchannel.
As shown in Figure 2d, the magnetic flux gradient of the single magnetic configuration is foundto be orientated toward y-axis, whereby it gradually decreases from 0.12 T to 0.104 T. This situationcan be defined through the inverse square law, which states that B is inversely proportional to thedistance from the permanent magnet squared [51]. On the contrary, the magnetic flux density for boththe attractive (see Figure 2e) and repulsive configurations (Figure 2f) was found to be orientated alongthe length of the magnet (x-axis). A symmetry axis was presented at x = 10 mm for both configurations.For instance, in Figure 2e, the attractive configuration generates a high spectrum value of 0.22 T in themiddle region (x = 10 mm) along the microchannel length and gradually decreases toward the regionnext to the edge of the permanent magnet. Meanwhile, the repulsive configuration, as depicted inFigure 2f, displays a mirror 3D surface image of attractive configuration. These observed phenomenawithin the microchannel for both the attractive and repulsive configuration can be explained byreferring to the direction of the arrows. As shown in the arrow plot, the magnetic lines travel fromnorth (N) pole directly to the south(S) pole. Therefore, in an attractive magnet configuration, themagnetic lines from N pole go directly to the S pole confronting it. Consequently, a high magnetic scalarfield (represented by red spectra) was found in the middle zones of the microchannel. It graduallydecreased toward inlet and outlet, forming a loop around the magnets. Unlike attraction, the repulsivemagnet configuration has two positive forces, facing each side of the microchannel wall. Henceforth,this configuration compels the magnetic field lines to turn horizontally before the horizontal symmetryaxis of the microchannel. As a result, a low (shorter arrow) field region and two focusing zones withhigh magnetic field were detected respectively in the middle of the microchannel and the corners ofboth magnets.
Chemosensors 2016, 4, 14 8 of 26
Chemosensors 2016, 4, 14 8 of 26
(a) (b)
(c) (d)
(e) (f)
Figure 2. Schematic of surface plot and arrow plot of magnetic flux density: (a) Single magnet configuration; (b) Attractive magnet configuration; (c) Repulsive magnet configuration; The distribution of magnetic flux density within the microchannel for each model was plotted in a 3D surface plot at the bottom of surface plot, with the contour plot projected onto the x-y plane, labelled as (d–f).
In the process of further validating our result, a post-processing of particle trajectories within the microfluidic channel was implemented. For this model setting, a steady state study was employed whereby an initial condition of the cell was assigned to align along the length of the microfluidic channel, at a constant distance of 5 μm from each other. The resulted plot is delivered in Figure 3, whose equalities of forces were simulated according to Equation (2). To ease the analysis process, a grey-scaled magnetic field surface is set as the plot background, as such the high magnetic
Figure 2. Schematic of surface plot and arrow plot of magnetic flux density: (a) Single magnetconfiguration; (b) Attractive magnet configuration; (c) Repulsive magnet configuration; The distributionof magnetic flux density within the microchannel for each model was plotted in a 3D surface plot at thebottom of surface plot, with the contour plot projected onto the x-y plane, labelled as (d–f).
In the process of further validating our result, a post-processing of particle trajectories within themicrofluidic channel was implemented. For this model setting, a steady state study was employedwhereby an initial condition of the cell was assigned to align along the length of the microfluidicchannel, at a constant distance of 5 µm from each other. The resulted plot is delivered in Figure 3,

Chemosensors 2016, 4, 14 9 of 26
whose equalities of forces were simulated according to Equation (2). To ease the analysis process,a grey-scaled magnetic field surface is set as the plot background, as such the high magnetic fluxdensity (B) region is represented by light grey and the colour saturation increases with decreasing of B.
Chemosensors 2016, 4, 14 9 of 26
flux density (B) region is represented by light grey and the colour saturation increases with decreasing of B.
(a)
(b)
(c)
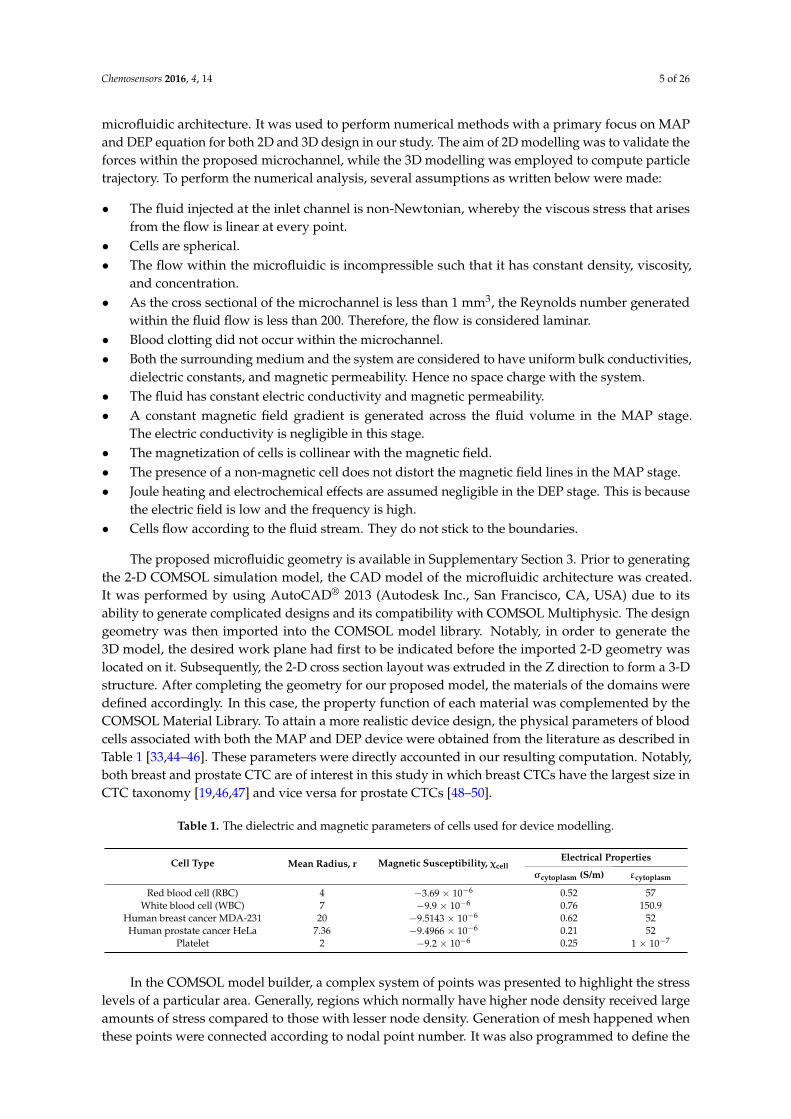
Figure 3. Cell trajectories within the microchannel: (a) Single magnet; (b) Magnet in attraction; (c) Magnet in repulsion. The grey scale and colour spectrum bar showed the magnetic flux density and magnetic susceptibility of cells, respectively.
Figure 3. Cell trajectories within the microchannel: (a) Single magnet; (b) Magnet in attraction;(c) Magnet in repulsion. The grey scale and colour spectrum bar showed the magnetic flux density andmagnetic susceptibility of cells, respectively.

Chemosensors 2016, 4, 14 10 of 26
In Figure 3, the red particles represents the RBCs meanwhile other nucleated blood cells such asCTCs and WBCs (whose magnetic susceptibility is lower than −8 × 10⁻⁶) are represented by blueparticles. For a single permanent magnet configuration, the cells were found to move toward bothsides of the channel walls. As shown in Figure 3a, RBCs are attracted towards the channel wall locatednext to the permanent magnet (high B region), thus exhibiting p-MAP. Meanwhile, n-MAP driven cellssuch as CTCs, WBCs and platelets were found to be repelled toward the opposite channel wall withlow B value. On the contrary, the presence of an axially-symmetric magnetic flux density within theattractive and repulsive configuration resulted in various cells accumulating in the middle region ofour proposed MAP microchamber. For instance, in Figure 3b, accumulation of RBC was found aroundthis region due to the presence of high magnetic field. Likewise, Figure 3c showed n-MAP-drivencells to be concentrated around the middle of the microchannel due to the presence of low B zone.Considering the influence of the magnet orientation, both attractive and repulsive configurationwill cause cell blockage within the microchannel thus compromising the purpose of our MAP stage.Since a single permanent magnet generates two opposing B along the left-right microchannel wallrespectively, coupled with the hydrodynamic force, the cells can be separated and directed toward thedesired outlets at the end of the MAP stage. Henceforth, this configuration is selected to generate themagnetic force in our proposed MAP stage.
3.1.2. Ferromagnetic Track’s Configuration
It has been shown that the magnetic field and force is restricted to a specific location defined bythe magnet pole orientation. In order to overcome the low magnetic forces on biological cells (seeSupplementary materials), a rectangular ferromagnetic track which was made of NiFe (Permalloy)element, was embedded inside the microchannel of our simulated MAP stage. This element allowedthe bias magnetic field to be locally amplified into the microchannel, thus giving rise to a magneticforce on the cells flowing through it. The length and height of this track was designated as 14.5 mmand 0.5 mm, respectively. Meanwhile, its width was fixed at 0.25 mm due to the limitation in ourlaboratory. As illustrated in Figure 1a, the enlarging field lines at the magnet extremities has resultedin a decrease in the magnetic flux magnitude at the region parallel with the permanent magnet edges.To allow a uniform distribution of the magnetic field line to permeate through the ferromagnetic track,the permanent magnet has to cover the length of the track. A new length of 20 mm was thereforedesignated for the magnet in our study. The schematic of the microchannel with ferromagnetic trackfor the MAP stage is illustrated in Figure 4a. All dimensions used are in millimetres.
1
(a) (b)
(c)
Figure 4. Cont.

Chemosensors 2016, 4, 14 11 of 26Chemosensors 2016, 4, 14 11 of 26
(c)
(d)
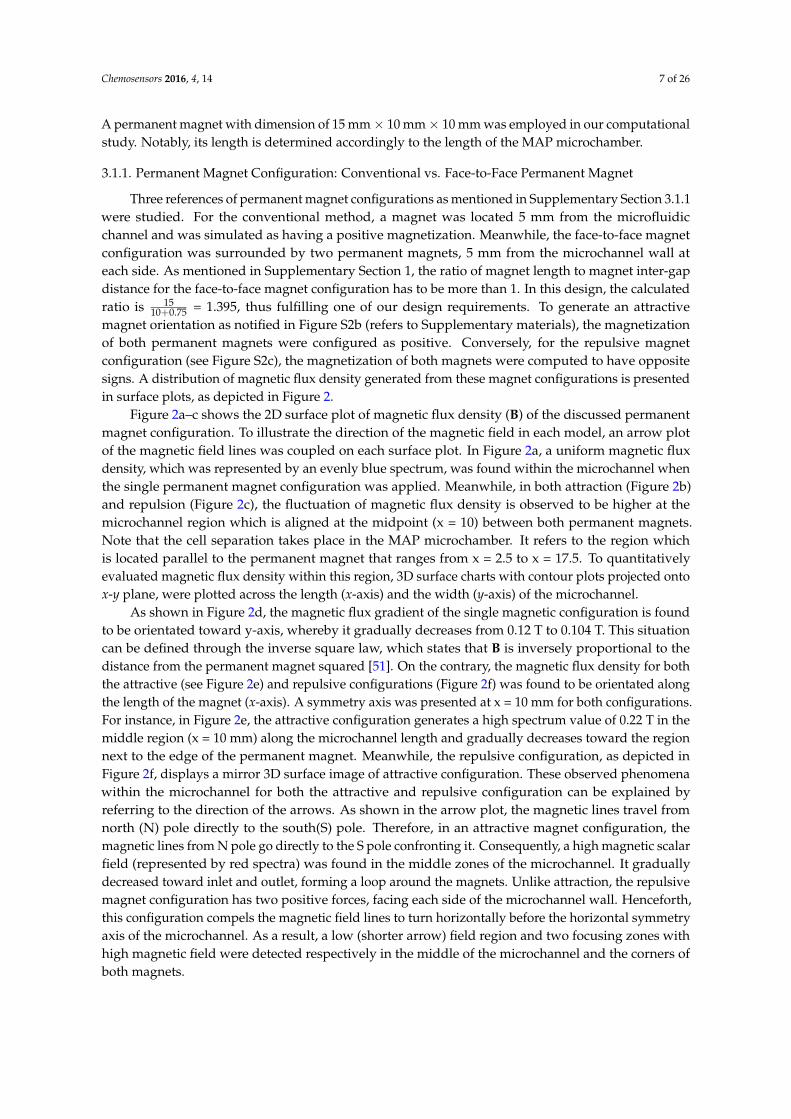
Figure 4. (a) Schematic of microchannel with ferromagnetic track (yellow region) in the MAP stage. Its magnetic flux density analysis is presented by the (b) surface plot. Graph of magnetic flux generated within the ferromagnetic track vs. the length of the track is plotted for: (c) y-component; (d) x-component.
Figure 4. (a) Schematic of microchannel with ferromagnetic track (yellow region) in the MAP stage.Its magnetic flux density analysis is presented by the (b) surface plot. Graph of magnetic fluxgenerated within the ferromagnetic track vs. the length of the track is plotted for: (c) y-component;(d) x-component.

Chemosensors 2016, 4, 14 12 of 26
The distribution of the magnetic field for the updated geometry is depicted in Figure 4b–d. In thepresence of the magnetic track, the external flux provided by the permanent magnet magnetised theferromagnetic track. It was reported in a previous study that the magnetic domain of a ferromagneticelement operated linearly with the magnetic flux which permeated through it [41]. Consequently,the magnetic moments will be aligned with one another, thus causing the magnetic field lines to befocused through the track. This phenomenon is illustrated via the arrow plot in Figure 4b. Due to thepresence of concentrated field lines, a high field pattern (represented by the red region) was foundwithin the ferromagnetic track. Note that there is a low field pattern presented in the middle regionof the proposed track. The reason for such a condition is caused by the flowing loop of magneticfield lines within the ferromagnetic track. This low field phenomenon can be explained by plottingthe x-component (Bx) and y-component (By) of the magnetic flux density across the length of theembedded track. The plotted line graphs are shown in Figure 4c,d, respectively.
In Figure 4c, the By is found to be uniform along the middle region of the ferromagnetic track, withan average of 0.35 T. The value was increased to 0.8 T towards the edge of the track. It is caused by thefield line concentration effect as a result of the high surface-area-to-volume ratio at this coordination.Likewise, Figure 4d also displayed a high Bx at the edge of the ferromagnetic track. However, centringat the middle point of this track, the magnitudes obtained at both edges were opposite to each other.This phenomenon results from the magnetic ordering of the atomic moment within the ferromagnetictrack, whereby the dipoles spontaneously align parallel in response to the closed-looped flow directionof magnetic flux from a single permanent magnet [52]. Subsequently, the magnetic dipoles whichwere present at the centre region of the ferromagnetic track were nullified by other dipoles whichaligned antiparallel to it and therefore zero Bx. Notably, on a cross section with constant z direction,the magnetic flux density, B is equal to the square root of the flux density in both x and y direction,such that:
B =√
B2x + B2
y (3)
By relating this equation to both Figure 4c,d, the surface plot obtained in Figure 4b can thusbe justified.
In order to ensure the acquired MAP force will be sufficient to deviate the cells toward the highand low magnetic flux density region within a continuous flow, the By which was generated across thechannel width was examined. As illustrated in Figure 4c, the distribution of By along the length ofthe ferromagnetic track is symmetrical to the y axis. To ease the analysis process, the comparison wasimplemented on By at three surface cross sections, which were labelled as I, II and III (see Figure 5a).In this case, I refers to the cutline across the microfluidic channel at the edge of a ferromagnetic track.Meanwhile, II and II represent the cutline at the quarter points and midpoints of the track, respectively.A graph of By across channel width at these surface cross-sections is delivered in Figure 5b.
Chemosensors 2016, 4, 14 12 of 26
The distribution of the magnetic field for the updated geometry is depicted in Figure 4b–d. In the presence of the magnetic track, the external flux provided by the permanent magnet magnetised the ferromagnetic track. It was reported in a previous study that the magnetic domain of a ferromagnetic element operated linearly with the magnetic flux which permeated through it [41]. Consequently, the magnetic moments will be aligned with one another, thus causing the magnetic field lines to be focused through the track. This phenomenon is illustrated via the arrow plot in Figure 4b. Due to the presence of concentrated field lines, a high field pattern (represented by the red region) was found within the ferromagnetic track. Note that there is a low field pattern presented in the middle region of the proposed track. The reason for such a condition is caused by the flowing loop of magnetic field lines within the ferromagnetic track. This low field phenomenon can be explained by plotting the x-component (Bx) and y-component (By) of the magnetic flux density across the length of the embedded track. The plotted line graphs are shown in Figure 4c,d, respectively.
In Figure 4c, the By is found to be uniform along the middle region of the ferromagnetic track, with an average of 0.35 T. The value was increased to 0.8 T towards the edge of the track. It is caused by the field line concentration effect as a result of the high surface-area-to-volume ratio at this coordination. Likewise, Figure 4d also displayed a high Bx at the edge of the ferromagnetic track. However, centring at the middle point of this track, the magnitudes obtained at both edges were opposite to each other. This phenomenon results from the magnetic ordering of the atomic moment within the ferromagnetic track, whereby the dipoles spontaneously align parallel in response to the closed-looped flow direction of magnetic flux from a single permanent magnet [52]. Subsequently, the magnetic dipoles which were present at the centre region of the ferromagnetic track were nullified by other dipoles which aligned antiparallel to it and therefore zero Bx. Notably, on a cross section with constant z direction, the magnetic flux density, B is equal to the square root of the flux density in both x and y direction, such that: = + (3)
By relating this equation to both Figure 4c,d, the surface plot obtained in Figure 4b can thus be justified.
In order to ensure the acquired MAP force will be sufficient to deviate the cells toward the high and low magnetic flux density region within a continuous flow, the By which was generated across the channel width was examined. As illustrated in Figure 4c, the distribution of By along the length of the ferromagnetic track is symmetrical to the y axis. To ease the analysis process, the comparison was implemented on By at three surface cross sections, which were labelled as I, II and III (see Figure 5a). In this case, I refers to the cutline across the microfluidic channel at the edge of a ferromagnetic track. Meanwhile, II and II represent the cutline at the quarter points and midpoints of the track, respectively. A graph of By across channel width at these surface cross-sections is delivered in Figure 5b.
(a) (b)
Figure 5. (a) Y-component magnetic field analysis at cross section within the microfluidic channel labelled as I, II and III; (b) The distribution of By was plotted across the channel width.
Figure 5. (a) Y-component magnetic field analysis at cross section within the microfluidic channellabelled as I, II and III; (b) The distribution of By was plotted across the channel width.

Chemosensors 2016, 4, 14 13 of 26
From Figure 5b, the three cutlines display similar trends in the plotted line graph such thata maximum of the magnetic field was obtained at the region within the ferromagnetic track anda minimum magnetic field was found at the fluid-flowing channels. When an external magneticfield (Bext) was applied toward the microchannel, the difference of net magnetization (M) betweenthe permanent magnet and the magnetic track caused the sample in the region bounded by x = 0 tox = 0.24 to be rotated by the torque in an equilibrium direction which was along the y axis in our study.Consequently, a uniform distributed magnetic field was obtained in this region. Due to the presence ofa strong localized field within the ferromagnetic track, the magnitude of By was found to increase andreached its maximum value in the region bounded by x = 0.25 to x = 0.5. Interestingly, a plateau regionof magnetic field was presented within the ferromagnetic track. Such a condition has been explainedthrough the concept of magnetic anisotropy by Albrecht et al. [53]. These researchers stated that themagnetization within a ferromagnetic material (MT) is uniform whereby its magnetic moments rotatein unison. The equation for MT is written as:
MT =µ
V(4)
where µ and V are the magnetic moment and volume of the magnetic track respectively. As themagnetic field lines exit through the magnet track, the magnitude of B is reduced due to the enlargingof field lines at the extremities.
As previously mentioned, the cell separation in a MAP stage is related to the magnetic fieldgradient. To achieve desirable cell trajectory within the chamber, the y-component of the magneticfield gradient (
∣∣∣∇·B2y
∣∣∣) within the chamber has to be evaluated. Its mathematical simulation result ispresented in Figure 6a, whereby the gradient of the magnetic field was found to be higher at the regionaround the wall of the ferromagnetic track. In the process of further validating the result, a graph of∣∣∣∇·B2
y
∣∣∣ was plotted across the microchannel. It is illustrated in Figure 6b. The representatives of the
three cutlines are in accordance with those described in Figure 5a. From this graph, ∇By2 is found to
gradually reduce towards the channel walls, which coordinates at x = 0 and x = 0.75. Since the directionof cell movement is related to magnetic field gradient, the cells with high magnetic susceptibilitysuch as RBCs are attracted toward the magnetic track and vice versa for other nucleated blood cells.In contrast to the single permanent magnet configuration (refer to Supplementary Section 5), the use offerromagnetic track in the middle of the chamber generated a higher value of magnetic field gradientin the order of 10 T/m2. Therefore, this configuration fulfils the magnetic force requirement to separatecells in our proposed MAP system.
Chemosensors 2016, 4, 14 13 of 26
From Figure 5b, the three cutlines display similar trends in the plotted line graph such that a maximum of the magnetic field was obtained at the region within the ferromagnetic track and a minimum magnetic field was found at the fluid-flowing channels. When an external magnetic field (Bext) was applied toward the microchannel, the difference of net magnetization (M) between the permanent magnet and the magnetic track caused the sample in the region bounded by x = 0 to x = 0.24 to be rotated by the torque in an equilibrium direction which was along the y axis in our study. Consequently, a uniform distributed magnetic field was obtained in this region. Due to the presence of a strong localized field within the ferromagnetic track, the magnitude of By was found to increase and reached its maximum value in the region bounded by x = 0.25 to x = 0.5. Interestingly, a plateau region of magnetic field was presented within the ferromagnetic track. Such a condition has been explained through the concept of magnetic anisotropy by Albrecht et al. [53]. These researchers stated that the magnetization within a ferromagnetic material (MT) is uniform whereby its magnetic moments rotate in unison. The equation for MT is written as: M = μV (4)
where μ and V are the magnetic moment and volume of the magnetic track respectively. As the magnetic field lines exit through the magnet track, the magnitude of B is reduced due to the enlarging of field lines at the extremities.
As previously mentioned, the cell separation in a MAP stage is related to the magnetic field gradient. To achieve desirable cell trajectory within the chamber, the y-component of the magnetic field gradient ( ∇ ∙ B within the chamber has to be evaluated. Its mathematical simulation result is presented in Figure 6a, whereby the gradient of the magnetic field was found to be higher at the region around the wall of the ferromagnetic track. In the process of further validating the result, a graph of ∇ ∙ B was plotted across the microchannel. It is illustrated in Figure 6b. The representatives of the three cutlines are in accordance with those described in Figure 5a. From this graph, ∇By2 is found to gradually reduce towards the channel walls, which coordinates at x = 0 and x = 0.75. Since the direction of cell movement is related to magnetic field gradient, the cells with high magnetic susceptibility such as RBCs are attracted toward the magnetic track and vice versa for other nucleated blood cells. In contrast to the single permanent magnet configuration (refer to Supplementary Section 5), the use of ferromagnetic track in the middle of the chamber generated a higher value of magnetic field gradient in the order of 10 T/m2. Therefore, this configuration fulfils the magnetic force requirement to separate cells in our proposed MAP system.
(a)
Figure 6. Cont.

Chemosensors 2016, 4, 14 14 of 26
Chemosensors 2016, 4, 14 14 of 26
(b)
Figure 6. Magnetic field gradient analysis: (a) Surface plot; (b) Graph of ∇By2 across the channel width.
3.1.3. Fluid Flow Parameter and Dynamic Pressure of Proposed Microchannel
In a continuous cell sorting microfluidic system, the positioning of the ferromagnetic track in the middle of the microchannel can improve separation efficiency from two perspectives. Firstly, as the individual ferromagnetic piece, it will generate an extra short-ranged magnetic force within the microchannel to retain target cells (RBC) on its surface. Secondly, by acting as the flow divider, it directs cell suspension toward the bifurcation channel at both sides of the magnetic track, thus increasing the volumetric flow of blood sample exposed to MAP force per second.
A devised schematic of the proposed microfluidic channel geometrical design for the MAP stage was illustrated in conjunction with the presence of the ferromagnetic track (see Figure 7a). The central outlet channel which directed RBC toward the collection port was fixed at 0.5 mm. This value was provided based on the effective range of the high magnetic field, which was 0.1 mm from the wall of the ferromagnetic track (see Figure 6b). According to Murray’s Law, both cross section and shape of the drain channel at n-th level must be the same to equalize the hydraulic resistance within the outlet channels [54]. Therefore, the lateral outlet channel would have the same dimension as the central outlet. They were designated at an angle of 45° from the central outlet channel. Notably, both magnetic and hydrodynamic forces dominate cell motion within the MAP microchamber. To adapt the ferromagnetic track toward an effective continuous-flow cell separation, both flow velocity and dynamic pressure generated within our proposed microfluidic channel were examined. This was achieved with Navier-Stokes simulation. For the geometrical design as depicted in Figure 7a, the boundary condition of the inlet velocity is fixed at 0.18 m/s to fulfil the optimum flow velocity as stated in Section 2.1.2. Its calculation can be found in the Supplementary materials.
Figure 7b presents the simulation result of the fluid flow velocity profile within our proposed channel. This surface plot indicates the velocity field in the colour spectrum. When blood sample was simulated to flow into the inlet, an acceleration meniscus was formed at the flow centre [55]. Such a condition caused the flow velocity within an inlet channel to be slightly higher than the specified inlet velocity. This was proved by a red spectral segment in this region which approximated to 0.02 m/s. As the flow was transported through the symmetrically-split-downstream channels, a downward colour sweep which indicated a decrease in the velocity field was observed in the surface plot. Such a condition is caused by the increase of hydraulic resistance within the proposed design and was explained in detail in our previous paper [56]. Interestingly, a study
Figure 6. Magnetic field gradient analysis: (a) Surface plot; (b) Graph of ∇By2 across the channel width.
3.1.3. Fluid Flow Parameter and Dynamic Pressure of Proposed Microchannel
In a continuous cell sorting microfluidic system, the positioning of the ferromagnetic track inthe middle of the microchannel can improve separation efficiency from two perspectives. Firstly,as the individual ferromagnetic piece, it will generate an extra short-ranged magnetic force withinthe microchannel to retain target cells (RBC) on its surface. Secondly, by acting as the flow divider,it directs cell suspension toward the bifurcation channel at both sides of the magnetic track, thusincreasing the volumetric flow of blood sample exposed to MAP force per second.
A devised schematic of the proposed microfluidic channel geometrical design for the MAP stagewas illustrated in conjunction with the presence of the ferromagnetic track (see Figure 7a). The centraloutlet channel which directed RBC toward the collection port was fixed at 0.5 mm. This value wasprovided based on the effective range of the high magnetic field, which was 0.1 mm from the wallof the ferromagnetic track (see Figure 6b). According to Murray’s Law, both cross section and shapeof the drain channel at n-th level must be the same to equalize the hydraulic resistance within theoutlet channels [54]. Therefore, the lateral outlet channel would have the same dimension as thecentral outlet. They were designated at an angle of 45◦ from the central outlet channel. Notably, bothmagnetic and hydrodynamic forces dominate cell motion within the MAP microchamber. To adaptthe ferromagnetic track toward an effective continuous-flow cell separation, both flow velocity anddynamic pressure generated within our proposed microfluidic channel were examined. This wasachieved with Navier-Stokes simulation. For the geometrical design as depicted in Figure 7a, theboundary condition of the inlet velocity is fixed at 0.18 m/s to fulfil the optimum flow velocity asstated in Supplementary Section 1.2. Its calculation can be found in the Supplementary materials.
Figure 7b presents the simulation result of the fluid flow velocity profile within our proposedchannel. This surface plot indicates the velocity field in the colour spectrum. When blood samplewas simulated to flow into the inlet, an acceleration meniscus was formed at the flow centre [55].Such a condition caused the flow velocity within an inlet channel to be slightly higher than thespecified inlet velocity. This was proved by a red spectral segment in this region which approximatedto 0.02 m/s. As the flow was transported through the symmetrically-split-downstream channels,a downward colour sweep which indicated a decrease in the velocity field was observed in thesurface plot. Such a condition is caused by the increase of hydraulic resistance within the proposeddesign and was explained in detail in our previous paper [56]. Interestingly, a study conducted by

Chemosensors 2016, 4, 14 15 of 26
Berthier et al. [57] showed that the hydraulic resistance within a microfluidic channel correspondsto the dynamic fluid pressure. To ensure continuity of the fluid flow, the dynamic fluid pressuregenerated within our proposed microchannel was evaluated. Its surface plot is shown in Figure 8.
1
(a) (b)
Figure 7. (a) The proposed microfluidic channel architecture for MAP and (b) its surface velocity plot.
Figure 7. (a) The proposed microfluidic channel architecture for MAP and (b) its surface velocity plot.
Chemosensors 2016, 4, 14 15 of 26
conducted by Berthier et al. [57] showed that the hydraulic resistance within a microfluidic channel corresponds to the dynamic fluid pressure. To ensure continuity of the fluid flow, the dynamic fluid pressure generated within our proposed microchannel was evaluated. Its surface plot is shown in Figure 8.
(a) (b)
Figure 7. (a) The proposed microfluidic channel architecture for MAP and (b) its surface velocity plot.
Figure 8. Surface plot of fluid dynamic pressure.
From this plot, the flow-driven pressure in the microchannel was found to decrease as the sample flows from the inlet toward the outlet. This phenomenon can be explained by rewriting the Navier-Stokes Equation analogously to Classical Ohm’s law (V = RI) [58]. In this context, a fluid pressure corresponds to an electrical voltage (p~V); the volumetric flow rate corresponds to the electrical current (Q~I) and flow resistance corresponds to an electrical resistor, R. Thus the dynamic pressure drop generated within the microfluidic channel is equal to: ∆ = (5)
In this equation, ∆ is directly proportional to as Q is held constant. Therefore, the increase of due to the presence of multiple sub-channels will develop a great ∆ . Noteworthy, ∆ in Figure 8 can be obtained by subtracting the outlet pressure (Pout) from the inlet pressure (Pin). As the dynamic pressure obtained at the outlet (Pout) of our proposed microfluidic design was approximate to ~0 Pa, ∆ would have a similar value to Pin. However, such a condition is undesirable as it results in cells not having sufficient kinetic momentum to move toward the DEP stage. To circumvent this
Figure 8. Surface plot of fluid dynamic pressure.
From this plot, the flow-driven pressure in the microchannel was found to decrease as thesample flows from the inlet toward the outlet. This phenomenon can be explained by rewriting theNavier-Stokes Equation analogously to Classical Ohm’s law (V = RI) [58]. In this context, a fluidpressure corresponds to an electrical voltage (p~V); the volumetric flow rate corresponds to theelectrical current (Q~I) and flow resistance RH corresponds to an electrical resistor, R. Thus thedynamic pressure drop generated within the microfluidic channel is equal to:
∆P = RHQ (5)
In this equation, ∆P is directly proportional toRH as Q is held constant. Therefore, the increase ofRH due to the presence of multiple sub-channels will develop a great ∆P. Noteworthy, ∆P in Figure 8can be obtained by subtracting the outlet pressure (Pout) from the inlet pressure (Pin). As the dynamicpressure obtained at the outlet (Pout) of our proposed microfluidic design was approximate to ~0 Pa,
Chemosensors 2016, 4, 14 16 of 26
∆P would have a similar value to Pin. However, such a condition is undesirable as it results in cellsnot having sufficient kinetic momentum to move toward the DEP stage. To circumvent this problem,Pout needs to be increased. It can be accomplished by reducing the total hydraulic resistance impact onthe microfluidic system.
According to Hagen-Poiseulle Law, the theoretical fluidic resistance RH within each channelcan be determined using geometric parameters, through the summation of a Fourier series, as inEquation (6) below:
RH =12µ·L
wh3( 1− 0.63 hw (∑
∞n
1n5 tanh
(1.57 w
h)))
(6)
where h represents a channel cross sections height, L is the channel cross section length, while wrefers to the width. Since the aspect ratio (depth/width) of inlet and outlet is approximate to 1 and 2respectively, the hydraulic resistance of the channel for our design can be generalized as:
RH =
{ 12µLwh3 , h
w = 1 (e.g., outlet channels)600µL29wh3 , h
w = 2 (e.g., inlet channel and bifurcated channels along the track)(7)
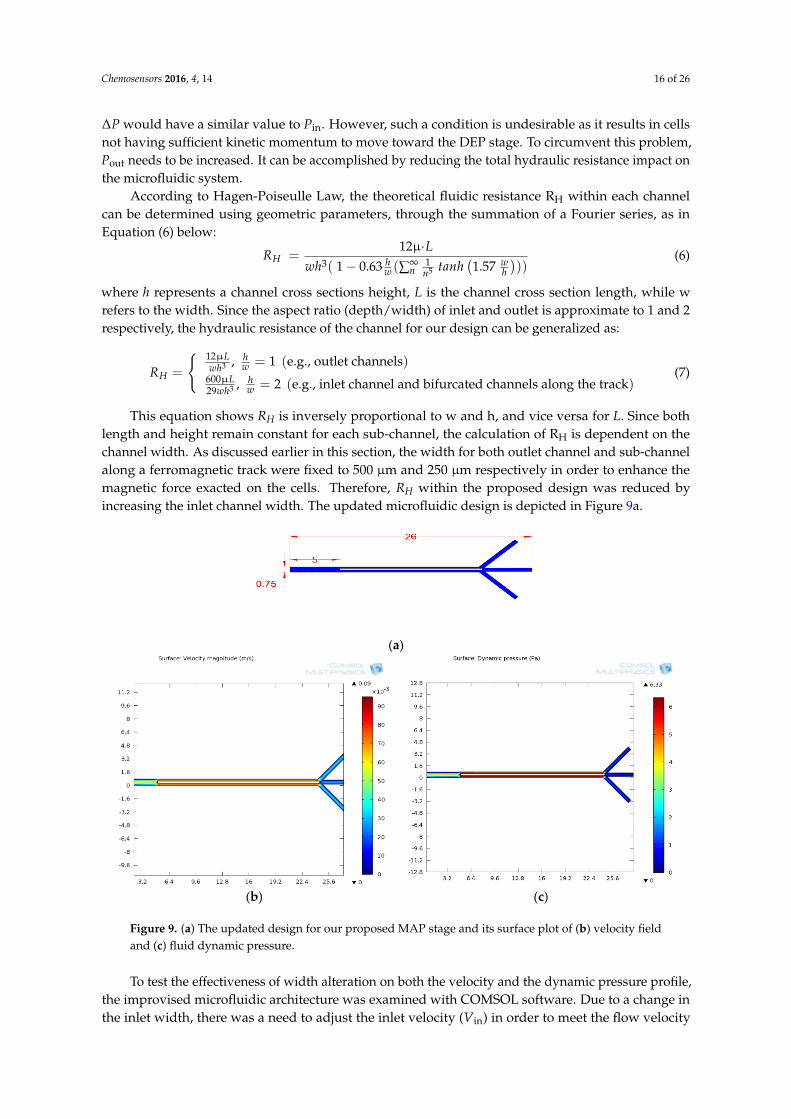
This equation shows RH is inversely proportional to w and h, and vice versa for L. Since bothlength and height remain constant for each sub-channel, the calculation of RH is dependent on thechannel width. As discussed earlier in this section, the width for both outlet channel and sub-channelalong a ferromagnetic track were fixed to 500 µm and 250 µm respectively in order to enhance themagnetic force exacted on the cells. Therefore, RH within the proposed design was reduced byincreasing the inlet channel width. The updated microfluidic design is depicted in Figure 9a.
Chemosensors 2016, 4, 14 16 of 26
problem, Pout needs to be increased. It can be accomplished by reducing the total hydraulic resistance impact on the microfluidic system.
According to Hagen-Poiseulle Law, the theoretical fluidic resistance RH within each channel can be determined using geometric parameters, through the summation of a Fourier series, as in Equation (6) below: = 12μ ∙1 0.63 ∑ 1.57 (6)
where h represents a channel cross sections height, L is the channel cross section length, while w refers to the width. Since the aspect ratio (depth/width) of inlet and outlet is approximate to 1 and 2 respectively, the hydraulic resistance of the channel for our design can be generalized as:
= 12μ , = 1 e. g. , outlet channels600μ29 , = 2 e. g. , inlet channel and bifurcated channels alongthetrack (7)
This equation shows RH is inversely proportional to w and h, and vice versa for L. Since both length and height remain constant for each sub-channel, the calculation of RH is dependent on the channel width. As discussed earlier in this section, the width for both outlet channel and sub-channel along a ferromagnetic track were fixed to 500 μm and 250 μm respectively in order to enhance the magnetic force exacted on the cells. Therefore, RH within the proposed design was reduced by increasing the inlet channel width. The updated microfluidic design is depicted in Figure 9a.
(a)
(b) (c)
Figure 9. (a) The updated design for our proposed MAP stage and its surface plot of (b) velocity field and (c) fluid dynamic pressure.
To test the effectiveness of width alteration on both the velocity and the dynamic pressure profile, the improvised microfluidic architecture was examined with COMSOL software. Due to a change in the inlet width, there was a need to adjust the inlet velocity (Vin) in order to meet the flow
Figure 9. (a) The updated design for our proposed MAP stage and its surface plot of (b) velocity fieldand (c) fluid dynamic pressure.
To test the effectiveness of width alteration on both the velocity and the dynamic pressure profile,the improvised microfluidic architecture was examined with COMSOL software. Due to a change inthe inlet width, there was a need to adjust the inlet velocity (Vin) in order to meet the flow velocity
Chemosensors 2016, 4, 14 17 of 26
requirement within the MAP chamber. Using the classical rule explained in the SupplementaryInformation, the velocity of the inlet boundary condition was fixed at 60 mm/s. The surface plots ofthe velocity field and fluid dynamic pressure are presented in Figure 9b,c, respectively.
From Figure 9c, it can be deduced that increasing width coupled with a decrease of inlet boundaryvelocity resulted in the inlet dynamic pressure being lower than in the previous design. When thefluid flows from a wide to a narrow channel, the dynamic pressure is increased corresponding to theincrease of flow velocity. As the blood sample travels toward the outlet channel, a transition fromthe velocity profile at the entrance to multiple outlets results in a drop in Pout. A Pout of 0.5 Pa wasobtained in the improvised design (see Figure 9c). To enhance the cellular kinetic motion, 0.75 mmwas therefore adopted as the inlet width value.
3.1.4. Design Optimization
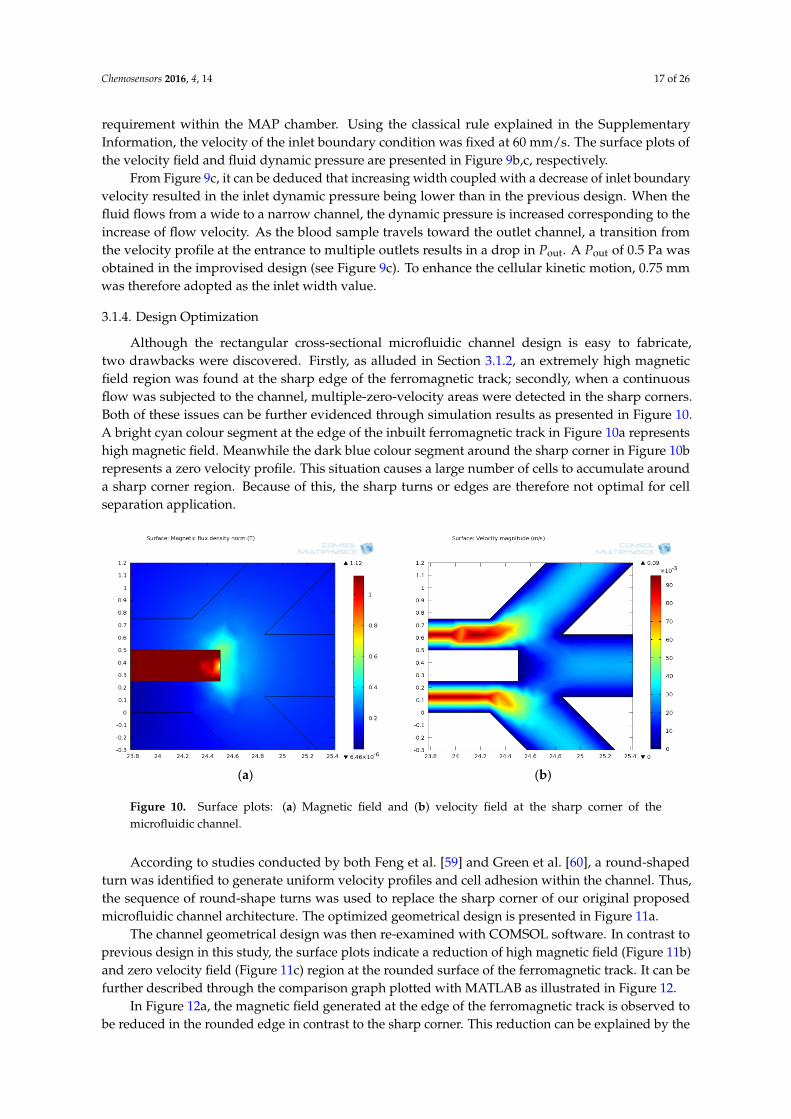
Although the rectangular cross-sectional microfluidic channel design is easy to fabricate,two drawbacks were discovered. Firstly, as alluded in Section 3.1.2, an extremely high magneticfield region was found at the sharp edge of the ferromagnetic track; secondly, when a continuousflow was subjected to the channel, multiple-zero-velocity areas were detected in the sharp corners.Both of these issues can be further evidenced through simulation results as presented in Figure 10.A bright cyan colour segment at the edge of the inbuilt ferromagnetic track in Figure 10a representshigh magnetic field. Meanwhile the dark blue colour segment around the sharp corner in Figure 10brepresents a zero velocity profile. This situation causes a large number of cells to accumulate arounda sharp corner region. Because of this, the sharp turns or edges are therefore not optimal for cellseparation application.
Chemosensors 2016, 4, 14 17 of 26
velocity requirement within the MAP chamber. Using the classical rule explained in the Supplementary Information, the velocity of the inlet boundary condition was fixed at 60 mm/s. The surface plots of the velocity field and fluid dynamic pressure are presented in Figure 9b,c, respectively.
From Figure 9c, it can be deduced that increasing width coupled with a decrease of inlet boundary velocity resulted in the inlet dynamic pressure being lower than in the previous design. When the fluid flows from a wide to a narrow channel, the dynamic pressure is increased corresponding to the increase of flow velocity. As the blood sample travels toward the outlet channel, a transition from the velocity profile at the entrance to multiple outlets results in a drop in Pout. A Pout of 0.5 Pa was obtained in the improvised design (see Figure 9c). To enhance the cellular kinetic motion, 0.75 mm was therefore adopted as the inlet width value.
3.1.4. Design Optimization
Although the rectangular cross-sectional microfluidic channel design is easy to fabricate, two drawbacks were discovered. Firstly, as alluded in Section 3.1.2, an extremely high magnetic field region was found at the sharp edge of the ferromagnetic track; secondly, when a continuous flow was subjected to the channel, multiple-zero-velocity areas were detected in the sharp corners. Both of these issues can be further evidenced through simulation results as presented in Figure 10. A bright cyan colour segment at the edge of the inbuilt ferromagnetic track in Figure 10a represents high magnetic field. Meanwhile the dark blue colour segment around the sharp corner in Figure 10b represents a zero velocity profile. This situation causes a large number of cells to accumulate around a sharp corner region. Because of this, the sharp turns or edges are therefore not optimal for cell separation application.
(a) (b)
Figure 10. Surface plots: (a) Magnetic field and (b) velocity field at the sharp corner of the microfluidic channel.
According to studies conducted by both Feng et al. [59] and Green et al. [60], a round-shaped turn was identified to generate uniform velocity profiles and cell adhesion within the channel. Thus, the sequence of round-shape turns was used to replace the sharp corner of our original proposed microfluidic channel architecture. The optimized geometrical design is presented in Figure 11a.
The channel geometrical design was then re-examined with COMSOL software. In contrast to previous design in this study, the surface plots indicate a reduction of high magnetic field (Figure 11b) and zero velocity field (Figure 11c) region at the rounded surface of the ferromagnetic track. It can be further described through the comparison graph plotted with MATLAB as illustrated in Figure 12.
In Figure 12a, the magnetic field generated at the edge of the ferromagnetic track is observed to be reduced in the rounded edge in contrast to the sharp corner. This reduction can be explained by the fact that the rounding suppresses the pinning fields in the vicinity of the sharp corner [61].
Figure 10. Surface plots: (a) Magnetic field and (b) velocity field at the sharp corner of themicrofluidic channel.
According to studies conducted by both Feng et al. [59] and Green et al. [60], a round-shapedturn was identified to generate uniform velocity profiles and cell adhesion within the channel. Thus,the sequence of round-shape turns was used to replace the sharp corner of our original proposedmicrofluidic channel architecture. The optimized geometrical design is presented in Figure 11a.
The channel geometrical design was then re-examined with COMSOL software. In contrast toprevious design in this study, the surface plots indicate a reduction of high magnetic field (Figure 11b)and zero velocity field (Figure 11c) region at the rounded surface of the ferromagnetic track. It can befurther described through the comparison graph plotted with MATLAB as illustrated in Figure 12.
In Figure 12a, the magnetic field generated at the edge of the ferromagnetic track is observed tobe reduced in the rounded edge in contrast to the sharp corner. This reduction can be explained by the

Chemosensors 2016, 4, 14 18 of 26
fact that the rounding suppresses the pinning fields in the vicinity of the sharp corner [61]. Meanwhile,when the velocity field was measured across the width of our proposed MAP microchamber(see Figure 12b), both models showed a reduction in velocity field at the region next to the bifurcatedchannel wall. Such a condition is caused by the generation of shear stress which acts on the wallsurface in the direction of fluid flow. However, comparing to our original design with the presence ofsharp corners, a uniform velocity profile is presented within the improved architecture (at distancesbetween 0 to 0.25 mm and 0.5 to 0.75 mm). Such a profile is thereby encouraging homogenous celladhesion within it. Due to the improvement in magnetic and velocity fields shown by this design, theimprovised geometry was employed as the design to be used in our MAP platform.
Chemosensors 2016, 4, 14 18 of 26
Meanwhile, when the velocity field was measured across the width of our proposed MAP microchamber (see Figure 12b), both models showed a reduction in velocity field at the region next to the bifurcated channel wall. Such a condition is caused by the generation of shear stress which acts on the wall surface in the direction of fluid flow. However, comparing to our original design with the presence of sharp corners, a uniform velocity profile is presented within the improved architecture (at distances between 0 to 0.25 mm and 0.5 to 0.75 mm). Such a profile is thereby encouraging homogenous cell adhesion within it. Due to the improvement in magnetic and velocity fields shown by this design, the improvised geometry was employed as the design to be used in our MAP platform.
(a)
(b) (c)
Figure 11. (a) Schematic of microfluidic channel layout with rounded corner. The surface plot of the magnetic and velocity field at the optimized ferromagnetic edge region is presented in (b,c), respectively.
(a) (b)
Figure 12. Graph of comparison for rounded and sharp corner: (a) Y-component magnetic field across the middle of the ferromagnetic track; (b) Average velocity field across the width of the MAP microchamber.
Figure 11. (a) Schematic of microfluidic channel layout with rounded corner. The surface plot of themagnetic and velocity field at the optimized ferromagnetic edge region is presented in (b,c), respectively.
Chemosensors 2016, 4, 14 18 of 26
Meanwhile, when the velocity field was measured across the width of our proposed MAP microchamber (see Figure 12b), both models showed a reduction in velocity field at the region next to the bifurcated channel wall. Such a condition is caused by the generation of shear stress which acts on the wall surface in the direction of fluid flow. However, comparing to our original design with the presence of sharp corners, a uniform velocity profile is presented within the improved architecture (at distances between 0 to 0.25 mm and 0.5 to 0.75 mm). Such a profile is thereby encouraging homogenous cell adhesion within it. Due to the improvement in magnetic and velocity fields shown by this design, the improvised geometry was employed as the design to be used in our MAP platform.
(a)
(b) (c)
Figure 11. (a) Schematic of microfluidic channel layout with rounded corner. The surface plot of the magnetic and velocity field at the optimized ferromagnetic edge region is presented in (b,c), respectively.
(a) (b)
Figure 12. Graph of comparison for rounded and sharp corner: (a) Y-component magnetic field across the middle of the ferromagnetic track; (b) Average velocity field across the width of the MAP microchamber.
Figure 12. Graph of comparison for rounded and sharp corner: (a) Y-component magnetic fieldacross the middle of the ferromagnetic track; (b) Average velocity field across the width of theMAP microchamber.
Chemosensors 2016, 4, 14 19 of 26
3.1.5. Separation Efficiency
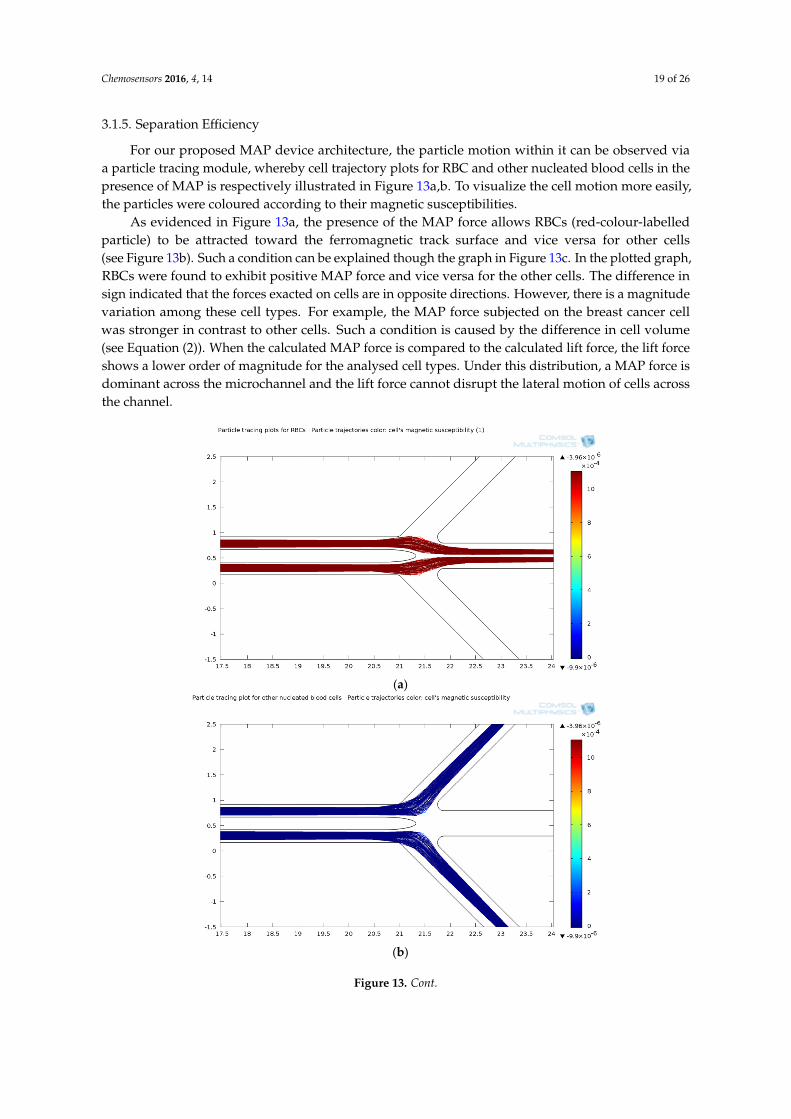
For our proposed MAP device architecture, the particle motion within it can be observed viaa particle tracing module, whereby cell trajectory plots for RBC and other nucleated blood cells in thepresence of MAP is respectively illustrated in Figure 13a,b. To visualize the cell motion more easily,the particles were coloured according to their magnetic susceptibilities.
As evidenced in Figure 13a, the presence of the MAP force allows RBCs (red-colour-labelledparticle) to be attracted toward the ferromagnetic track surface and vice versa for other cells(see Figure 13b). Such a condition can be explained though the graph in Figure 13c. In the plotted graph,RBCs were found to exhibit positive MAP force and vice versa for the other cells. The difference insign indicated that the forces exacted on cells are in opposite directions. However, there is a magnitudevariation among these cell types. For example, the MAP force subjected on the breast cancer cellwas stronger in contrast to other cells. Such a condition is caused by the difference in cell volume(see Equation (2)). When the calculated MAP force is compared to the calculated lift force, the lift forceshows a lower order of magnitude for the analysed cell types. Under this distribution, a MAP force isdominant across the microchannel and the lift force cannot disrupt the lateral motion of cells acrossthe channel.
Chemosensors 2016, 4, 14 19 of 26
3.1.5. Separation Efficiency
For our proposed MAP device architecture, the particle motion within it can be observed via a particle tracing module, whereby cell trajectory plots for RBC and other nucleated blood cells in the presence of MAP is respectively illustrated in Figure 13a,b. To visualize the cell motion more easily, the particles were coloured according to their magnetic susceptibilities.
As evidenced in Figure 13a, the presence of the MAP force allows RBCs (red-colour-labelled particle) to be attracted toward the ferromagnetic track surface and vice versa for other cells (see Figure 13b). Such a condition can be explained though the graph in Figure 13c. In the plotted graph, RBCs were found to exhibit positive MAP force and vice versa for the other cells. The difference in sign indicated that the forces exacted on cells are in opposite directions. However, there is a magnitude variation among these cell types. For example, the MAP force subjected on the breast cancer cell was stronger in contrast to other cells. Such a condition is caused by the difference in cell volume (see Equation (2)). When the calculated MAP force is compared to the calculated lift force, the lift force shows a lower order of magnitude for the analysed cell types. Under this distribution, a MAP force is dominant across the microchannel and the lift force cannot disrupt the lateral motion of cells across the channel.
(a)
(b)
Figure 13. Cont.

Chemosensors 2016, 4, 14 20 of 26Chemosensors 2016, 4, 14 20 of 26
(c)
Figure 13. Plot of cell trajectories in the presence of MAP for (a) RBCs and (b) other nucleated blood cells (WBCs, platelets, and CTCs). The colour spectrum bar indicates the magnetic susceptibilities of cells, as such RBCs are represented by red particles while other nucleated cells are blue. The cell motion was explained through the graph of calculated y-directional magnetic and hydrodynamic forces as illustrated in (c). Zero forces were found in the region bounded by x = 0.25 and x = 0.5 due to the presence of inbuilt ferromagnetic track, which was simulated to have the same height as the microchannel.
Notably, separation efficiency is the ultimate performance evaluation of our proposed MAP microchamber design. However, it was shown that the concentration of cells carried by the fluid flow affect the number of cells to be delivered into a designated outlet under a constant velocity [62]. Such a condition will indirectly affect the recovery rate of the proposed device. To enhance the performance of the MAP stage, the separation efficiencies for various dilution ratios as discussed in Supplementary Section 2.5 were studied. For the purpose of reducing both RAM memory usage and computation time, the simulation was performed with 1mL blood sample. As stated in the introduction, the presences of tumour cells are rare in a blood sample, of the order of 1–10 per 7.5 mL. Furthermore, it has been shown by previous results whereby tumour cells exhibited a similar response to WBC in the MAP stage. Considering the purpose of the MAP stage was to separate RBC from blood sample, the tumour cells were neglected in this simulation. Notably, the central outlet serves as collection port for targeted cells (RBC) in the MAP stage. Therefore, the simulated separation efficiency (η) can be calculated directly based on the ratio of RBC obtained in the central outlet to the total amount of RBC injected at the inlet. A plot of separation efficiency versus dilution factor (ratio of final volume/aliquot volume) is illustrated in Figure 14.
Figure 14. Graph of separation efficiency vs. dilution ration in the MAP stage.
Figure 13. Plot of cell trajectories in the presence of MAP for (a) RBCs and (b) other nucleated bloodcells (WBCs, platelets, and CTCs). The colour spectrum bar indicates the magnetic susceptibilitiesof cells, as such RBCs are represented by red particles while other nucleated cells are blue. The cellmotion was explained through the graph of calculated y-directional magnetic and hydrodynamicforces as illustrated in (c). Zero forces were found in the region bounded by x = 0.25 and x = 0.5due to the presence of inbuilt ferromagnetic track, which was simulated to have the same height asthe microchannel.
Notably, separation efficiency is the ultimate performance evaluation of our proposed MAPmicrochamber design. However, it was shown that the concentration of cells carried by the fluidflow affect the number of cells to be delivered into a designated outlet under a constant velocity [62].Such a condition will indirectly affect the recovery rate of the proposed device. To enhance theperformance of the MAP stage, the separation efficiencies for various dilution ratios as discussed inSupplementary Section 2.5 were studied. For the purpose of reducing both RAM memory usage andcomputation time, the simulation was performed with 1mL blood sample. As stated in the introduction,the presences of tumour cells are rare in a blood sample, of the order of 1–10 per 7.5 mL. Furthermore,it has been shown by previous results whereby tumour cells exhibited a similar response to WBC inthe MAP stage. Considering the purpose of the MAP stage was to separate RBC from blood sample,the tumour cells were neglected in this simulation. Notably, the central outlet serves as collection portfor targeted cells (RBC) in the MAP stage. Therefore, the simulated separation efficiency (η) can becalculated directly based on the ratio of RBC obtained in the central outlet to the total amount of RBCinjected at the inlet. A plot of separation efficiency versus dilution factor (ratio of final volume/aliquotvolume) is illustrated in Figure 14.
Chemosensors 2016, 4, 14 20 of 26
(c)
Figure 13. Plot of cell trajectories in the presence of MAP for (a) RBCs and (b) other nucleated blood cells (WBCs, platelets, and CTCs). The colour spectrum bar indicates the magnetic susceptibilities of cells, as such RBCs are represented by red particles while other nucleated cells are blue. The cell motion was explained through the graph of calculated y-directional magnetic and hydrodynamic forces as illustrated in (c). Zero forces were found in the region bounded by x = 0.25 and x = 0.5 due to the presence of inbuilt ferromagnetic track, which was simulated to have the same height as the microchannel.
Notably, separation efficiency is the ultimate performance evaluation of our proposed MAP microchamber design. However, it was shown that the concentration of cells carried by the fluid flow affect the number of cells to be delivered into a designated outlet under a constant velocity [62]. Such a condition will indirectly affect the recovery rate of the proposed device. To enhance the performance of the MAP stage, the separation efficiencies for various dilution ratios as discussed in Supplementary Section 2.5 were studied. For the purpose of reducing both RAM memory usage and computation time, the simulation was performed with 1mL blood sample. As stated in the introduction, the presences of tumour cells are rare in a blood sample, of the order of 1–10 per 7.5 mL. Furthermore, it has been shown by previous results whereby tumour cells exhibited a similar response to WBC in the MAP stage. Considering the purpose of the MAP stage was to separate RBC from blood sample, the tumour cells were neglected in this simulation. Notably, the central outlet serves as collection port for targeted cells (RBC) in the MAP stage. Therefore, the simulated separation efficiency (η) can be calculated directly based on the ratio of RBC obtained in the central outlet to the total amount of RBC injected at the inlet. A plot of separation efficiency versus dilution factor (ratio of final volume/aliquot volume) is illustrated in Figure 14.
Figure 14. Graph of separation efficiency vs. dilution ration in the MAP stage. Figure 14. Graph of separation efficiency vs. dilution ration in the MAP stage.
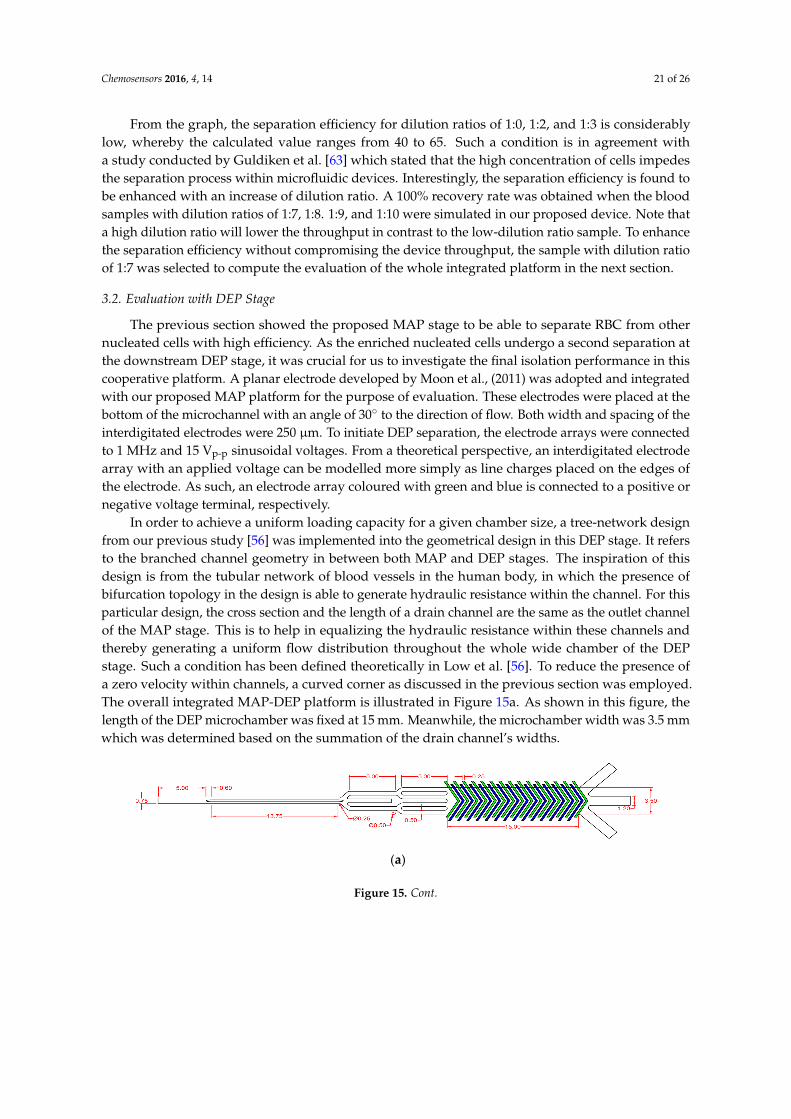
Chemosensors 2016, 4, 14 21 of 26
From the graph, the separation efficiency for dilution ratios of 1:0, 1:2, and 1:3 is considerablylow, whereby the calculated value ranges from 40 to 65. Such a condition is in agreement witha study conducted by Guldiken et al. [63] which stated that the high concentration of cells impedesthe separation process within microfluidic devices. Interestingly, the separation efficiency is found tobe enhanced with an increase of dilution ratio. A 100% recovery rate was obtained when the bloodsamples with dilution ratios of 1:7, 1:8. 1:9, and 1:10 were simulated in our proposed device. Note thata high dilution ratio will lower the throughput in contrast to the low-dilution ratio sample. To enhancethe separation efficiency without compromising the device throughput, the sample with dilution ratioof 1:7 was selected to compute the evaluation of the whole integrated platform in the next section.
3.2. Evaluation with DEP Stage
The previous section showed the proposed MAP stage to be able to separate RBC from othernucleated cells with high efficiency. As the enriched nucleated cells undergo a second separation atthe downstream DEP stage, it was crucial for us to investigate the final isolation performance in thiscooperative platform. A planar electrode developed by Moon et al., (2011) was adopted and integratedwith our proposed MAP platform for the purpose of evaluation. These electrodes were placed at thebottom of the microchannel with an angle of 30◦ to the direction of flow. Both width and spacing of theinterdigitated electrodes were 250 µm. To initiate DEP separation, the electrode arrays were connectedto 1 MHz and 15 Vp-p sinusoidal voltages. From a theoretical perspective, an interdigitated electrodearray with an applied voltage can be modelled more simply as line charges placed on the edges ofthe electrode. As such, an electrode array coloured with green and blue is connected to a positive ornegative voltage terminal, respectively.
In order to achieve a uniform loading capacity for a given chamber size, a tree-network designfrom our previous study [56] was implemented into the geometrical design in this DEP stage. It refersto the branched channel geometry in between both MAP and DEP stages. The inspiration of thisdesign is from the tubular network of blood vessels in the human body, in which the presence ofbifurcation topology in the design is able to generate hydraulic resistance within the channel. For thisparticular design, the cross section and the length of a drain channel are the same as the outlet channelof the MAP stage. This is to help in equalizing the hydraulic resistance within these channels andthereby generating a uniform flow distribution throughout the whole wide chamber of the DEPstage. Such a condition has been defined theoretically in Low et al. [56]. To reduce the presence ofa zero velocity within channels, a curved corner as discussed in the previous section was employed.The overall integrated MAP-DEP platform is illustrated in Figure 15a. As shown in this figure, thelength of the DEP microchamber was fixed at 15 mm. Meanwhile, the microchamber width was 3.5 mmwhich was determined based on the summation of the drain channel’s widths.
Chemosensors 2016, 4, 14 21 of 26
From the graph, the separation efficiency for dilution ratios of 1:0, 1:2, and 1:3 is considerably low, whereby the calculated value ranges from 40 to 65. Such a condition is in agreement with a study conducted by Guldiken et al. [63] which stated that the high concentration of cells impedes the separation process within microfluidic devices. Interestingly, the separation efficiency is found to be enhanced with an increase of dilution ratio. A 100% recovery rate was obtained when the blood samples with dilution ratios of 1:7, 1:8. 1:9, and 1:10 were simulated in our proposed device. Note that a high dilution ratio will lower the throughput in contrast to the low-dilution ratio sample. To enhance the separation efficiency without compromising the device throughput, the sample with dilution ratio of 1:7 was selected to compute the evaluation of the whole integrated platform in the next section.
3.2. Evaluation with DEP Stage
The previous section showed the proposed MAP stage to be able to separate RBC from other nucleated cells with high efficiency. As the enriched nucleated cells undergo a second separation at the downstream DEP stage, it was crucial for us to investigate the final isolation performance in this cooperative platform. A planar electrode developed by Moon et al., (2011) was adopted and integrated with our proposed MAP platform for the purpose of evaluation. These electrodes were placed at the bottom of the microchannel with an angle of 30° to the direction of flow. Both width and spacing of the interdigitated electrodes were 250 μm. To initiate DEP separation, the electrode arrays were connected to 1 MHz and 15 Vp-p sinusoidal voltages. From a theoretical perspective, an interdigitated electrode array with an applied voltage can be modelled more simply as line charges placed on the edges of the electrode. As such, an electrode array coloured with green and blue is connected to a positive or negative voltage terminal, respectively.
In order to achieve a uniform loading capacity for a given chamber size, a tree-network design from our previous study [56] was implemented into the geometrical design in this DEP stage. It refers to the branched channel geometry in between both MAP and DEP stages. The inspiration of this design is from the tubular network of blood vessels in the human body, in which the presence of bifurcation topology in the design is able to generate hydraulic resistance within the channel. For this particular design, the cross section and the length of a drain channel are the same as the outlet channel of the MAP stage. This is to help in equalizing the hydraulic resistance within these channels and thereby generating a uniform flow distribution throughout the whole wide chamber of the DEP stage. Such a condition has been defined theoretically in Low et al. [56]. To reduce the presence of a zero velocity within channels, a curved corner as discussed in the previous section was employed. The overall integrated MAP-DEP platform is illustrated in Figure 15a. As shown in this figure, the length of the DEP microchamber was fixed at 15 mm. Meanwhile, the microchamber width was 3.5 mm which was determined based on the summation of the drain channel’s widths.
(a)
Figure 15. Cont.

Chemosensors 2016, 4, 14 22 of 26Chemosensors 2016, 4, 14 22 of 26
(b)
(c)
Figure 15. (a) Schematic of the microchannel architecture of integrated MAP-DEP microsystem. When cells isolated from the MAP stage are directed toward the DEP stage, the trajectories of nucleated cells such as WBC (and platelet) and CTCs are displayed in (b,c), respectively. The spectrum bar indicates the Clausius-Mossotti factor of the cells.
When a concentrated nucleated cell from our proposed MAP stage is directed into the DEP stage, the movement of the cell passing onto these interdigitated electrode arrays is illustrated in Figure 15b,c. In this case, a CTC was found to manifest an opposite response in contrast to other nucleated cells. Notably, the middle part of this DEP stage consists of a high electric field region. As the CTCs exhibit pDEP (CM factor >0), it deviates toward this region and flows into the central outlet. On the contrary, nDEP force (CM factor <0) pushes the normal nucleated cell toward the low electric field region along the channel wall. Under hydrodynamic force, these cells flow into the lateral outlet. Comparing to a previous study as discussed in literature [19,28], there is an improvement in throughput and separation efficiency shown by this device. Therefore, a MAP stage should be adopted as a new integrated technique to be cooperated in a DEP system.
Figure 15. (a) Schematic of the microchannel architecture of integrated MAP-DEP microsystem.When cells isolated from the MAP stage are directed toward the DEP stage, the trajectories of nucleatedcells such as WBC (and platelet) and CTCs are displayed in (b,c), respectively. The spectrum barindicates the Clausius-Mossotti factor of the cells.
When a concentrated nucleated cell from our proposed MAP stage is directed into the DEPstage, the movement of the cell passing onto these interdigitated electrode arrays is illustrated inFigure 15b,c. In this case, a CTC was found to manifest an opposite response in contrast to othernucleated cells. Notably, the middle part of this DEP stage consists of a high electric field region.As the CTCs exhibit pDEP (CM factor >0), it deviates toward this region and flows into the centraloutlet. On the contrary, nDEP force (CM factor <0) pushes the normal nucleated cell toward the lowelectric field region along the channel wall. Under hydrodynamic force, these cells flow into the lateraloutlet. Comparing to a previous study as discussed in literature [19,28], there is an improvement in
Chemosensors 2016, 4, 14 23 of 26
throughput and separation efficiency shown by this device. Therefore, a MAP stage should be adoptedas a new integrated technique to be cooperated in a DEP system.
4. Conclusions and Future Works
Overall, the present work set out with the objective to solve the limitation of dielectrophoresis(DEP) technique in CTC isolation. The general strategy of achieving this aim was by developinga magnetophoresis (MAP) system as a pre-enrichment stage. Using this strategy, red blood cells arefirst removed from the blood sample in the MAP stage, thus allowing the DEP stage to focus onisolation of targeted rare cells. Several computational models were employed to demonstrate theproof-of-concept of our proposed method for enhancing the device separation efficiency. These modelscombined an Eulerian-Lagrangian CFD analysis with a closed-form magnetic field analysis to predictcell separation, taking into account dominant magnetic and hydrodynamic forces. There were a fewunique features of these elements that contributed to the proposed device’s capture performance.First, a single permanent magnet was employed to produce a region of both attractive and repulsivemagnetic forces within the MAP stage. In order to amplify low magnetic forces on blood cells,a ferromagnetic track was embedded in the middle of the MAP microchamber. This strategy generateda higher value of magnetic field gradient in the order of 10 T/m2. Besides, from the perspective ofNavier-Stokes principle, the positioning of the ferromagnetic track in the middle of the microchannelcreated a hydraulic resistance within the bifurcated channel, thus resulting in a uniform flow velocity.Last but not least, a tree-network division was implemented onto the platform design to generateuniform cell distribution across the microchamber.
In short, this cooperative platform utilising integrated separation modalities reduced theoverloading cell issues within the DEP stage, thus the enhanced capture. Furthermore, thecomputational model which was portrayed in this paper has offered a rational design of systems inadvance of fabrication and should be of considerable interest to researchers in the future developmentof lab-on-chip systems. At the moment, the proposed microfluidic design was solely based onnumerical analysis. However, this simulation might not reflect the real condition during theexperimental platform analysis. For instance, errors which occur during the fabrication processof the microfluidic channel will influence cell motion, thus affecting their distribution within themicrofluidic chamber. Furthermore, storage-related activity deterioration of blood components mightoccur during the actual experiment and affect the device’s efficiency. These conditions have not beenconsidered in our simulation due to the limited precision of data for cells which have high conductivityor closer bonding. Therefore, there is a need for experimental characterization to verify the designstrategy and simulation. A brief discussion for future experimental setup and device fabrication isincluded in the Supplementary Information.
Supplementary Materials: The following are available online at www.mdpi.com/2227-9040/4/3/14/s1.
Acknowledgments: This study was financially supported by the University of Malaya Research Grant(RG156-12AET).
Author Contributions: In this paper, Wan Shi Low conducted simulation and prepared the draft manuscript.Nahrizul Adib Kadri conducted the analysis and proofed the manuscript
Conflicts of Interest: The authors declare no conflict of interest.
References
1. Maryam, F.; Hassali, M.A.; Knight, A.; Shafie, A.A.; Farooqui, M.A.; Saleem, F. A qualitative exploration ofmalaysian cancer patients’ perceptions of cancer screening. BMC Public Health 2013, 13, 1–7.
2. Thiery, J.P. Epithelial-mesenchymal transitions in tumour progression. Nat. Rev. Cancer 2002, 2, 442–454.[CrossRef] [PubMed]
3. Frangioni, J.V. New technologies for human cancer imaging. J. Clin. Oncol. 2008, 26, 4012–4021. [CrossRef][PubMed]

Chemosensors 2016, 4, 14 24 of 26
4. Husemann, Y.; Geigl, J.B.; Schubert, F.; Musiani, P.; Meyer, M.; Burghart, E.; Forni, G.; Eils, R.; Fehm, T.;Riethmuller, G.; et al. Systemic spread is an early step in breast cancer. Cancer Cell 2008, 13, 58–68. [CrossRef][PubMed]
5. Gerges, N.; Rak, J.; Jabado, N. New technologies for the detection of circulating tumour cells. Br. Med. Bull.2010, 94, 49–64. [CrossRef] [PubMed]
6. Allen, J.E.; El-Deiry, W.S. Circulating tumor cells and colorectal cancer. Curr. Colorectal Cancer Rep. 2010, 6,212–220. [CrossRef] [PubMed]
7. Dalum, G.V.; Holland, L.; Terstappen, L.W. Metastasis and circulating tumor cells. J. Int. Fed. Clin. Chem.Lab. Med. 2012, 23, 1–11.
8. Michaelson, J.S.; Cheongsiatmoy, J.A.; Dewey, F.; Silverstein, M.J.; Sgroi, D.; Smith, B.; Tanabe, K.K. Spread ofhuman cancer cells occurs with probabilities indicative of a nongenetic mechanism. Br. J. Cancer 2005, 93,1244–1249. [CrossRef] [PubMed]
9. Antolovic, D.; Galindo, L.; Carstens, A.; Rahbari, N.; Buchler, M.W.; Weitz, J.; Koch, M. Heterogeneousdetection of circulating tumor cells in patients with colorectal cancer by immunomagnetic enrichment usingdifferent epcam-specific antibodies. BMC Biotechnol. 2010, 10, 35. [CrossRef] [PubMed]
10. Khoo, B.L.; Chaudhuri, P.K.; Ramalingam, N.; Tan, D.S.; Lim, C.T.; Warkiani, M.E. Single-cell profilingapproaches to probing tumor heterogeneity. Int. J. Cancer 2016, 139, 243–255. [CrossRef] [PubMed]
11. Kallergi, G.; Papadaki, M.A.; Politaki, E.; Mavroudis, D.; Georgoulias, V.; Agelaki, S. Epithelial tomesenchymal transition markers expressed in circulating tumour cells of early and metastatic breast cancerpatients. Breast Cancer Res. 2011, 13, 1–11. [CrossRef] [PubMed]
12. Marrinucci, D.; Bethel, K.; Lazar, D.; Fisher, J.; Huynh, E.; Clark, P.; Bruce, R.; Nieva, J.; Kuhn, P.Cytomorphology of circulating colorectal tumor cells: A small case series. J. Oncol. 2010, 2010. [CrossRef][PubMed]
13. Cima, I.; Wen Yee, C.; Iliescu, F.S.; Min Phyo, W.; Hon Lim, K.; Iliescu, C.; Han Tan, M. Label-free isolation ofcirculating tumor cells in microfluidic devices: Current research and perspectives. Biomicrofluidics 2013, 7.[CrossRef] [PubMed]
14. Zheng, S.; Lin, H.K.; Lu, B.; Williams, A.; Datar, R.; Cote, R.J.; Tai, Y.C. 3D microfilter device for viablecirculating tumor cell (CTC) enrichment from blood. Biomed. Microdevices 2011, 13, 203–213. [CrossRef][PubMed]
15. Coumans, F.A.; van Dalum, G.; Beck, M.; Terstappen, L.W. Filter characteristics influencing circulating tumorcell enrichment from whole blood. PLoS ONE 2013, 8, e61770. [CrossRef] [PubMed]
16. Sun, J.; Liu, C.; Li, M.; Wang, J.; Xianyu, Y.; Hu, G.; Jiang, X. Size-based hydrodynamic rare tumor cellseparation in curved microfluidic channels. Biomicrofluidics 2013, 7. [CrossRef] [PubMed]
17. Warkiani, M.E.; Guan, G.; Luan, K.B.; Lee, W.C.; Bhagat, A.A.S.; Kant Chaudhuri, P.; Tan, D.S.-W.; Lim, W.T.;Lee, S.C.; Chen, P.C.Y.; et al. Slanted spiral microfluidics for the ultra-fast, label-free isolation of circulatingtumor cells. Lab Chip 2014, 14, 128–137. [CrossRef] [PubMed]
18. Huang, C.-T.; Amstislavskaya, T.G.; Chen, G.-H.; Chang, H.-H.; Chen, Y.-H.; Jen, C.-P. Selectivelyconcentrating cervical carconoma cells from rare blood cells utilizing dielectrophoresis with circular itoelectrodes in stepping electric fields. J. Med. Biol. Eng. 2012, 33, 51–59. [CrossRef]
19. Moon, H.S.; Kwon, K.; Kim, S.I.; Han, H.; Sohn, J.; Lee, S.; Jung, H.I. Continuous separation of breast cancercells from blood samples using multi-orifice flow fractionation (moff) and dielectrophoresis (dep). Lab Chip2011, 11, 1118–1125. [CrossRef] [PubMed]
20. Park, S.; Ang, R.R.; Duffy, S.P.; Bazov, J.; Chi, K.N.; Black, P.C.; Ma, H. Morphological differences betweencirculating tumor cells from prostate cancer patients and cultured prostate cancer cells. PLoS ONE 2014, 9,e85264. [CrossRef] [PubMed]
21. Mulhall, H.J.; Labeed, F.H.; Kazmi, B.; Costea, D.E.; Hughes, M.P.; Lewis, M.P. Cancer, pre-cancer and normaloral cells distinguished by dielectrophoresis. Anal. Bioanal. Chem. 2011, 401, 2455–2463. [CrossRef] [PubMed]
22. Broche, L.M.; Bhadal, N.; Lewis, M.P.; Porter, S.; Hughes, M.P.; Labeed, F.H. Early detection of oral cancer—Isdielectrophoresis the answer? Oral Oncol. 2007, 43, 199–203. [CrossRef] [PubMed]
23. Fabbri, F.; Carloni, S.; Zoli, W.; Ulivi, P.; Gallerani, G.; Fici, P.; Chiadini, E.; Passardi, A.; Frassineti, G.L.;Ragazzini, A.; et al. Detection and recovery of circulating colon cancer cells using a dielectrophoresis-baseddevice: Kras mutation status in pure CTCs. Cancer Lett. 2013, 335, 225–231. [CrossRef] [PubMed]

Chemosensors 2016, 4, 14 25 of 26
24. Huang, C.; Liu, H.; Bander, N.H.; Kirby, B.J. Enrichment of prostate cancer cells from blood cells witha hybrid dielectrophoresis and immunocapture microfluidic system. Biomed. Microdevices 2013, 15, 941–948.[CrossRef] [PubMed]
25. Vykoukal, D.M.; Gascoyne, P.R.; Vykoukal, J. Dielectric characterization of complete mononuclear andpolymorphonuclear blood cell subpopulations for label-free discrimination. Integr. Biol. 2009, 1, 477–484.[CrossRef] [PubMed]
26. Leu, T.-S.; Liao, Z.-F. Separating plasma and blood cells by dielectrophoresis in microfluidic chips. Int. J.Mod. Phys. Conf. Ser. 2012, 19, 185–189. [CrossRef]
27. Toner, M.; Irimia, D. Blood-on-a-chip. Annu. Rev. Biomed. Eng. 2008, 7, 77–103. [CrossRef] [PubMed]28. Gascoyne, P.R.C.; Noshari, J.; Anderson, T.J.; Becker, F.F. Isolation of rare cells from cell mixtures by
dielectrophoresis. Electrophoresis 2009, 30, 1388–1398. [CrossRef] [PubMed]29. Shim, S.; Gascoyne, P.; Noshari, J.; Hale, K.S. Dynamic physical properties of dissociated tumor cells revealed
by dielectrophoretic field-flow fractionation. Integr. Biol. 2011, 3, 850–862. [CrossRef] [PubMed]30. Gupta, V.; Jafferji, I.; Garza, M.; Melnikova, V.O.; Hasegawa, D.K.; Pethig, R.; Davis, D.W. Apostream(™),
a new dielectrophoretic device for antibody independent isolation and recovery of viable cancer cells fromblood. Biomicrofluidics 2012, 6. [CrossRef] [PubMed]
31. Wang, L.H.; Lawrence, S.M.; Navas, T.; Kinderss, R.J. Characterization of CTCs from peripheral bloodspecimens of patients (using aposteam instruments). In American Society of Clinical Oncolgy Annual Meeting2014; American Society of Clinical Oncology: Chicago, IL, USA, 2014.
32. Gascoyne, P.R.C.; Shim, S. Isolation of circulating tumor cells by dielectrophoresis. Cancers 2014, 6, 545–579.[CrossRef] [PubMed]
33. Pommer, M.S.; Zhang, Y.; Keerthi, N.; Chen, D.; Thomson, J.A.; Meinhart, C.D.; Soh, H.T. Dielectrophoreticseparation of platelets from diluted whole blood in microfluidic channels. Electrophoresis 2008, 29, 1213–1218.[CrossRef] [PubMed]
34. Liao, S.H.; Chang, C.Y.; Chang, H.C. A capillary dielectrophoretic chip for real-time blood cell separationfrom a drop of whole blood. Biomicrofluidics 2013, 7. [CrossRef] [PubMed]
35. Takaori, M. Changes of ph of blood diluted with plasma and plasma substitutes in vitro. Transfusion 1966, 6,597–599. [CrossRef] [PubMed]
36. Lynch, E.C. Peripheral blood smear. In Clinical Methods: The History, Physical, and Laboratory Examinations;Walker, H.K., Hall, W.D., Hurst, J.W., Eds.; Butterworths: Boston, MA, USA, 1990.
37. Gassner, A.L.; Abonnenc, M.; Chen, H.X.; Morandini, J.; Josserand, J.; Rossier, J.S.; Busnel, J.M.; Girault, H.H.Magnetic forces produced by rectangular permanent magnets in static microsystems. Lab Chip 2009, 9,2356–2363. [CrossRef] [PubMed]
38. Tomlinson, M.J.; Tomlinson, S.; Yang, X.B.; Kirkham, J. Cell separation: Terminology and practicalconsiderations. J. Tissue Eng. 2013, 4. [CrossRef] [PubMed]
39. Essakali, S.; Carney, D.; Westerman, D.; Gambell, P.; Seymour, J.F.; Dobrovic, A. Negative selection of chroniclymphocytic leukaemia cells using a bifunctional rosette-based antibody cocktail. BMC Biotechnol. 2008, 8,1–5. [CrossRef] [PubMed]
40. Esmaeilsabzali, H.; Beischlag, T.V.; Cox, M.E.; Parameswaran, A.M.; Park, E.J. Detection and isolation ofcirculating tumor cells: Principles and methods. Biotechnol. Adv. 2013, 31, 1063–1084. [CrossRef] [PubMed]
41. Iliescu, C.; Xu, G.; Barbarini, E.; Avram, M.; Avram, A. Microfluidic device for continuous magnetophoreticseparation of white blood cells. Microsyst. Technol. 2008, 15, 1157–1162. [CrossRef]
42. Shen, F.; Hwang, H.; Hahn, Y.K.; Park, J.-K. Label-free cell separation using a tunable magnetophoreticrepulsion force. Anal. Chem. 2012, 84, 3075–3081. [CrossRef] [PubMed]
43. Jung, J.; Han, K.-H. Lateral-driven continuous magnetophoretic separation of blood cells. Appl. Phys. Lett.2008, 93. [CrossRef]
44. Chen, J.; Abdelgawad, M.; Yu, L.; Shakiba, N.; Chien, W.-Y.; Lu, Z.; Geddie, W.R.; Jewett, M.A.S.; Sun, Y.Electrodeformation for single cell mechanical characterization. J. Micromech. Microeng. 2011, 21. [CrossRef]
45. Furiani, E.P. Magnetophoretic separation of blood cells at microscale. J. Appl. Phys. 2007, 40, 1313.46. Baccelli, I.; Schneeweiss, A.; Riethdorf, S.; Stenzinger, A.; Schillert, A.; Vogel, V.; Klein, C.; Saini, M.;
Bauerle, T.; Wallwiener, M.; et al. Identification of a population of blood circulating tumor cells from breastcancer patients that initiates metastasis in a xenograft assay. Nat. Biotechnol. 2013, 31, 539–544. [CrossRef][PubMed]

Chemosensors 2016, 4, 14 26 of 26
47. Krawczyk, N.; Banys, M.; Hartkopf, A.; Hagenbeck, C.; Melcher, C.; Fehm, T. Circulating tumour cells inbreast cancer. Ecancermedicalscience 2013, 7, 352. [PubMed]
48. Furtado, P.; Lima, M.V.A.; Nogueira, C.; Franco, M.; Tavora, F. Review of small cell carcinomas of the prostate.Prostate Cancer 2011, 2011. [CrossRef] [PubMed]
49. Newton, M.R.; Phillips, S.; Chang, S.S.; Clark, P.E.; Cookson, M.S.; Davis, R.; Fowke, J.H.; Herrell, S.D.;Baumgartner, R.; Chan, R.; et al. Smaller prostate size predicts high grade prostate cancer at final pathology.J. Urol. 2010, 184, 930–937. [CrossRef] [PubMed]
50. Zagoria, R.J. Genitourinary Radiology: The Requisites; Mosby: Philadelphia, PA, USA, 2004.51. Elblbesy, M.A. Effect of static magnetic field on erythrocytes characterizations. J. Biomed. Sci. Eng. 2010, 3,
300–303. [CrossRef]52. Chen, P.; Huang, Y.Y.; Hoshino, K.; Zhang, J.X. Microscale magnetic field modulation for enhanced capture
and distribution of rare circulating tumor cells. Sci. Rep. 2015, 5, 8745. [CrossRef] [PubMed]53. Albrecht, M.; Furubayashi, T.; Przybylski, M.; Korecki, J.; Gradman, U. Magnetic step anisotropies. J. Magn.
Magn. Mater. 1992, 113, 207–220. [CrossRef]54. Emerson, D.R.; Cieslicki, K.; Gu, X.; Barber, R.W. Biomimetic design of microfluidic manifolds based on
a generalised Murray’s law. Lab Chip 2006, 6, 447–454. [CrossRef] [PubMed]55. Lee, A.M.; Tormoen, G.W.; Kanso, E.; McCarty, O.J.; Newton, P.K. Modeling and simulation of procoagulant
circulating tumor cells in flow. Front. Oncol. 2012, 2, 108. [CrossRef] [PubMed]56. Low, W.S.; Kadri, N.A.; Wan Abas, W.A.B.B. Computational fluid dynamics modelling of microfluidic
channel for dielectrophoretic biomems application. Sci. World J. 2014, 2014, 11. [CrossRef] [PubMed]57. Berthier, E.; Young, E.W.K.; Beebe, D. Engineers are from pdms-land, biologists are from polystyrenia.
Lab Chip 2012, 12, 1224–1237. [CrossRef] [PubMed]58. Mortensen, N.A.; Okkels, F.; Bruus, H. Reexamination of hagen-poiseuille flow: Shape dependence of the
hydraulic resistance in microchannels. Phys. Rev. E 2005, 71. [CrossRef] [PubMed]59. Feng, J.; Chuncheng, Z.; Peng, Z.; Deyi, Z. Optimization of turn geometries in microfluidic channels.
In Proceedings of the 2005 International Conference on MEMS, NANO and Smart Systems, Banff, AB,Canada, 24–27 July 2005; pp. 32–35.
60. Green, J.V.; Kniazeva, T.; Abedi, M.; Sokhey, D.S.; Taslim, M.E.; Murthy, S.K. Effect of channel geometry oncell adhesion in microfluidic devices. Lab Chip 2009, 9, 677–685. [CrossRef] [PubMed]
61. Peeters, F.M.; Jo, D.B. Hybrid magnetic-semiconductor nanostructures. In Nanostructured Materials andNanotechnology; Nalwa, H.S., Ed.; AcademicPress: San Diego, CA, USA, 2002; pp. 247–328.
62. Issa, D.; Albeldawi, M.; Lopez, R.; Alkhouri, N. Hematocrit levels and red blood cell indices in patients withnonalcoholic fatty liver disease. Eur. J. Gastroenterol. Hepatol. 2014, 26, 363–364. [CrossRef] [PubMed]
63. Guldiken, R.; Jo, M.C.; Gallant, N.D.; Demirci, U.; Zhe, J. Sheathless size-based acoustic particle separation.Sensors 2012, 12, 905–922. [CrossRef] [PubMed]
© 2016 by the authors; licensee MDPI, Basel, Switzerland. This article is an open accessarticle distributed under the terms and conditions of the Creative Commons Attribution(CC-BY) license (http://creativecommons.org/licenses/by/4.0/).


![High efficiency dielectrophoretic ratchet - PureHigh efficiency dielectrophoretic ratchet. Physical Review E, 86(4), 1-9. [041106]. ... theoretical upper limit corresponding to the](https://static.fdocuments.in/doc/165x107/5e48381b49401c3bfa26d20c/high-efficiency-dielectrophoretic-ratchet-pure-high-efficiency-dielectrophoretic.jpg)


