
COMPUTAIONAL AND EXPERIMENTAL … Mahmoud.pdfCOMPUTAIONAL AND EXPERIMENTAL INVESTIGATION FOR WELD...
8
COMPUTAIONAL AND EXPERIMENTAL INVESTIGATION FOR WELD BEAD DIMENSIONS IN PULSED LASER SPOT WELDING OF STAINLESS STEEL AISI 302, TO LOW CARBON STEEL AISI 1008 Ph.D .Adel K. Mahmoud 1 , PhD .Khalil I. Hajim 2 , PhD . Ziad A. Taha 2 , PhD .Thaier A. Tawfiq 2 and M.Sc. Abeer A. Shehab 2 Faculty of Engineering , Diyala University , Diyala- Baqouba – Iraq 1 Institute of laser for postgraduate studies ,Baghdad University, Baghdad, Iraq 2 Abstract: A pulsed Nd:YAG laser spot welding of dissimilar metals, stainless steel AISI 302, 0.2mm thickness to low carbon steel AISI 1008 ,0.5 mm thickness . The effect of laser parameters (i.e. peak power, pulse duration) on joint strength and weld bead dimensions, has been investigated experimentally and computationally. Four levels of peak power 5, 5.5, 6.5, and 7 kW respectively, were varied (keeping constant beam energy 48J). For the effect of pulse duration ,four levels of pulse duration 5 , 6 , 6.5 and 7 ms respectively, were employed for laser spot welding , at constant peak power of 5.5 kW(i.e. variable energy).The experimental investigation included, tensile shear test and weld pool geometry determination. It was found that the best welding condition, for maximum joint strength (300N) , is 5.5 kW peak power (at constant pulse energy 48J).Also it was found for the effect of pulse duration, that the best welding condition , for maximum joint strength (244N) is 6.5 ms pulse duration , at constant peak power 5.5 kW ( i.e. 37.4J energy) The computational investigation included, development of a two dimensional axisymmetric model to solve heat transfer equations for pulsed laser spot welding, using ANSYS FLUENT 6.3 software. In spite of some simplifying assumptions, the present computational model agreed very well with experimental in some situations were the transient temperature distribution and weld bead dimensions for the welding process can be predicted. Keywords: LASER SPOT WELDING, WELD BEAD DIMENSIONS, COMPUTATIONAL AND EXPERIMENTAL INVESTIGATION, DISSIMILAR METALS 1. Introduction Laser welding has been studied well for various metals and alloys in different configurations. Understanding the physical processes that take place during welding which affect the weld material properties and the around regions is essential. The analysis of dissimilar metal joint offers a number of challenges, arising out of complexities such as dissimilar metal properties, asymmetric weld pool shape, mixing of the molten metals, segregation and formation of intermetallic compound [1]. In order to achieve a satisfactory study of the laser welding process, it is first of all necessary to know the temperature distribution resulting from the irradiation of the laser beam [2], to stand with some of these challenges, to know the temperature field in and around the melt pool, where the mechanical properties of the weld metal and around the Heat Affected Zone (HAZ) region, are highly dependent on the cooling rate of work piece. It is also essential for the understanding and modeling of the welding process [3]. Joining between dissimilar metals are used in many industries, mainly automotive, electronics, power generation, etc. A large number of studies have been done in this field. Wei Han [2], analytically, computationally and experimentally investigated the pulsed Nd:YAG laser spot welding of stainless steel with copper . The analytical investigation includes solving of the governing equations of heat transfer problem. The computational investigation includes development of a computer interface to solve nonlinear heat transfer equations. The experimental investigation included tensile test, SEM test and temperature measurements for the weldment during welding process. She concluded that: i. laser welding is a thermal process that strongly depends on the thermal properties of the work piece ii. Gaussian power distribution resulted in a much higher value of the maximum temperature inside the work piece than that for uniform power distribution, therefore leading to a much higher level of thermal stress. Jose Roberto, et al. [4] , studied the effect of the pulsed Nd :YAG laser beam position with respect to the butt weld joint of AISI 304 stainless steel to AISI420 stainless steel . They concluded that the shifting of the laser beam towards AISI 304 steel favors the joint. Ezzeddin M.H.[5] , studied the feasibility of laser welding economically low carbon steel to stainless steel ,with different thicknesses and different joint designs. The goals of his study were to predict and optimize welding processes, by controlling laser power, welding speed and defocusing position, he found that: i. Welding speed has the strongest effect on the tensile strength and on the fusion area size among the selected parameters ii. Laser power has a strong effect on fusion area iii. The focusing position parameter has an insignificant effect on the total weld pool dimensions. Daunt Irodachescu, et al.[6],experimentally investigated black and white joints of low carbon steel and stainless steel thin sheets, that achieved by laser–GMA hybrid welding. The purpose of this investigation was to get the optimum experimental conditions for the welding process, where they found that using laser–GMA hybrid welding is an important industrial option. The present work is concerned with joining of dissimilar metals, stainless steel AISI 302, to low carbon steel AISI 1008 , by using the pulsed Nd:YAG laser spot welding ,where the effect of laser parameters (i.e. peak power, pulse durations) on the joint strength and weld bead dimensions ,is investigated experimentally and computationally. 2. Experimental Procedure The metals selected to be jointed by pulsed Nd:YAG laser for this study , where austenitic stainless steel AISI 302, it is mostly used in heat exchanger, pressure vessel and chemical equipments [7] and low carbon steel AISI 1008 cold drawing, with wide rang of applications in industry, such as power generation, chemical, petrochemical, nuclear industries[5,8].The metals chemical compositions, are given in Tab.1, the physical properties of the metals, are listed in Tab.2 [1]. Welding was carried out with a pulsed Nd:YAG laser system(1.064 μm) model PB 80, manufactured by Han's Laser Technology Co. Ltd, with maximum(Peak) power of 8kW, maximum average power of 80 W , pulse width can be varied between 0.1 to 50 ms , and the repetition rate is 1–100 Hz. For the welding purpose , the distance between the minimum spot and the tip of the laser head nozzle was 3.8 mm , the stand off distance for welding was 8 mm , the diameter of the laser spot at the surface of the metal sheet to be welded was found 0.65 mm . Lap joint design was made in the present work with two over lap member as shown in Fig.1 , where stainless steel sheet AISI 302, of ( 100 mm × 10 mm × 0.2 mm ) is placed above low carbon steel sheet AISI 1008 , of (100 mm × 10 mm × 0.5 mm ), with 20mm overlapping. Twelve welding experiments were carried out by choosing the following laser parameters, four levels of pulse duration ( 1.5, 2.5, 5, 8 ) ms were varied versus three levels of peak power (2,4,6) kW at one second exposure time (on time). After 7
Transcript of COMPUTAIONAL AND EXPERIMENTAL … Mahmoud.pdfCOMPUTAIONAL AND EXPERIMENTAL INVESTIGATION FOR WELD...
COMPUTAIONAL AND EXPERIMENTAL INVESTIGATION FOR WELD BEAD DIMENSIONS IN PULSED LASER SPOT WELDING OF STAINLESS STEEL AISI 302,
TO LOW CARBON STEEL AISI 1008
Ph.D .Adel K. Mahmoud1, PhD .Khalil I. Hajim2, PhD. Ziad A. Taha2 , PhD .Thaier A. Tawfiq2 and M.Sc. Abeer A. Shehab2
Faculty of Engineering , Diyala University , Diyala- Baqouba – Iraq1
Institute of laser for postgraduate studies ,Baghdad University, Baghdad, Iraq2
Abstract: A pulsed Nd:YAG laser spot welding of dissimilar metals, stainless steel AISI 302, 0.2mm thickness to low carbon steel AISI 1008 ,0.5 mm thickness . The effect of laser parameters (i.e. peak power, pulse duration) on joint strength and weld bead dimensions, has been investigated experimentally and computationally. Four levels of peak power 5, 5.5, 6.5, and 7 kW respectively, were varied (keeping constant beam energy 48J). For the effect of pulse duration ,four levels of pulse duration 5 , 6 , 6.5 and 7 ms respectively, were employed for laser spot welding , at constant peak power of 5.5 kW(i.e. variable energy).The experimental investigation included, tensile shear test and weld pool geometry determination. It was found that the best welding condition, for maximum joint strength (300N) , is 5.5 kW peak power (at constant pulse energy 48J).Also it was found for the effect of pulse duration, that the best welding condition , for maximum joint strength (244N) is 6.5 ms pulse duration , at constant peak power 5.5 kW ( i.e. 37.4J energy)
The computational investigation included, development of a two dimensional axisymmetric model to solve heat transfer equations for pulsed laser spot welding, using ANSYS FLUENT 6.3 software. In spite of some simplifying assumptions, the present computational model agreed very well with experimental in some situations were the transient temperature distribution and weld bead dimensions for the welding process can be predicted.
Keywords: LASER SPOT WELDING, WELD BEAD DIMENSIONS, COMPUTATIONAL AND EXPERIMENTAL INVESTIGATION, DISSIMILAR METALS
1. Introduction Laser welding has been studied well for various metals and
alloys in different configurations. Understanding the physical processes that take place during welding which affect the weld material properties and the around regions is essential. The analysis of dissimilar metal joint offers a number of challenges, arising out of complexities such as dissimilar metal properties, asymmetric weld pool shape, mixing of the molten metals, segregation and formation of intermetallic compound [1]. In order to achieve a satisfactory study of the laser welding process, it is first of all necessary to know the temperature distribution resulting from the irradiation of the laser beam [2], to stand with some of these challenges, to know the temperature field in and around the melt pool, where the mechanical properties of the weld metal and around the Heat Affected Zone (HAZ) region, are highly dependent on the cooling rate of work piece. It is also essential for the understanding and modeling of the welding process [3]. Joining between dissimilar metals are used in many industries, mainly automotive, electronics, power generation, etc. A large number of studies have been done in this field. Wei Han [2], analytically, computationally and experimentally investigated the pulsed Nd:YAG laser spot welding of stainless steel with copper . The analytical investigation includes solving of the governing equations of heat transfer problem. The computational investigation includes development of a computer interface to solve nonlinear heat transfer equations. The experimental investigation included tensile test, SEM test and temperature measurements for the weldment during welding process. She concluded that: i. laser welding is a thermal process that strongly depends on the thermal properties of the work piece ii. Gaussian power distribution resulted in a much higher value of the maximum temperature inside the work piece than that for uniform power distribution, therefore leading to a much higher level of thermal stress. Jose Roberto, et al. [4] , studied the effect of the pulsed Nd :YAG laser beam position with respect to the butt weld joint of AISI 304 stainless steel to AISI420 stainless steel . They concluded that the shifting of the laser beam towards AISI 304 steel favors the joint. Ezzeddin M.H.[5] , studied the feasibility of laser welding economically low carbon steel to stainless steel ,with different thicknesses and different joint designs. The goals of his study were to predict and optimize welding processes, by controlling laser power, welding speed and defocusing position, he found that: i. Welding speed has the strongest effect on the tensile strength and on the fusion area size among the selected parameters ii. Laser power has a strong effect on
fusion area iii. The focusing position parameter has an insignificant effect on the total weld pool dimensions. Daunt Irodachescu, et al.[6],experimentally investigated black and white joints of low carbon steel and stainless steel thin sheets, that achieved by laser–GMA hybrid welding. The purpose of this investigation was to get the optimum experimental conditions for the welding process, where they found that using laser–GMA hybrid welding is an important industrial option.
The present work is concerned with joining of dissimilar metals, stainless steel AISI 302, to low carbon steel AISI 1008 , by using the pulsed Nd:YAG laser spot welding ,where the effect of laser parameters (i.e. peak power, pulse durations) on the joint strength and weld bead dimensions ,is investigated experimentally and computationally.
2. Experimental Procedure The metals selected to be jointed by pulsed Nd:YAG laser for
this study , where austenitic stainless steel AISI 302, it is mostly used in heat exchanger, pressure vessel and chemical equipments [7] and low carbon steel AISI 1008 cold drawing, with wide rang of applications in industry, such as power generation, chemical, petrochemical, nuclear industries[5,8].The metals chemical compositions, are given in Tab.1, the physical properties of the metals, are listed in Tab.2 [1]. Welding was carried out with a pulsed Nd:YAG laser system(1.064 µm) model PB 80, manufactured by Han's Laser Technology Co. Ltd, with maximum(Peak) power of 8kW, maximum average power of 80 W , pulse width can be varied between 0.1 to 50 ms , and the repetition rate is 1–100 Hz. For the welding purpose , the distance between the minimum spot and the tip of the laser head nozzle was 3.8 mm , the stand off distance for welding was 8 mm , the diameter of the laser spot at the surface of the metal sheet to be welded was found 0.65 mm . Lap joint design was made in the present work with two over lap member as shown in Fig.1 , where stainless steel sheet AISI 302, of ( 100 mm × 10 mm × 0.2 mm ) is placed above low carbon steel sheet AISI 1008 , of (100 mm × 10 mm × 0.5 mm ), with 20mm overlapping. Twelve welding experiments were carried out by choosing the following laser parameters, four levels of pulse duration ( 1.5, 2.5, 5, 8 ) ms were varied versus three levels of peak power (2,4,6) kW at one second exposure time (on time). After
7
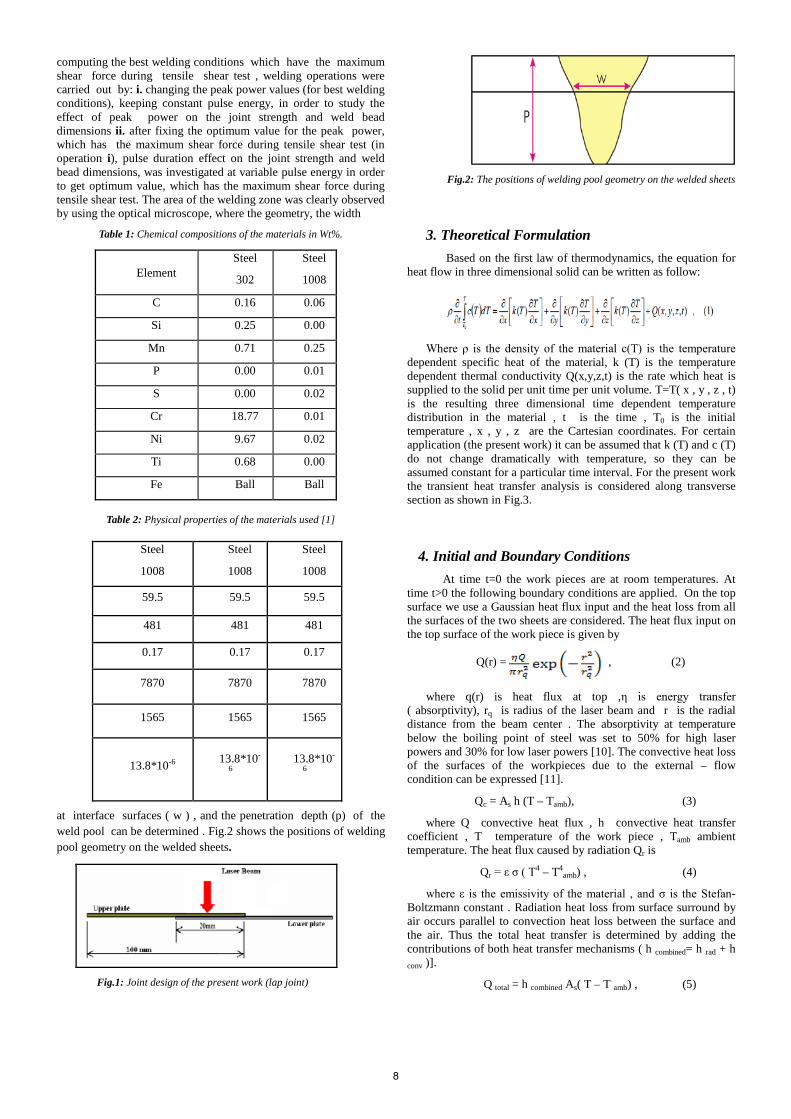
computing the best welding conditions which have the maximum shear force during tensile shear test , welding operations were carried out by: i. changing the peak power values (for best welding conditions), keeping constant pulse energy, in order to study the effect of peak power on the joint strength and weld bead dimensions ii. after fixing the optimum value for the peak power, which has the maximum shear force during tensile shear test (in operation i), pulse duration effect on the joint strength and weld bead dimensions, was investigated at variable pulse energy in order to get optimum value, which has the maximum shear force during tensile shear test. The area of the welding zone was clearly observed by using the optical microscope, where the geometry, the width
Table 1: Chemical compositions of the materials in Wt%.
Table 2: Physical properties of the materials used [1]
at interface surfaces ( w ) , and the penetration depth (p) of the weld pool can be determined . Fig.2 shows the positions of welding pool geometry on the welded sheets.
Fig.1: Joint design of the present work (lap joint)
Fig.2: The positions of welding pool geometry on the welded sheets
3. Theoretical Formulation
Based on the first law of thermodynamics, the equation for heat flow in three dimensional solid can be written as follow:
Where ρ is the density of the material c(T) is the temperature
dependent specific heat of the material, k (T) is the temperature dependent thermal conductivity Q(x,y,z,t) is the rate which heat is supplied to the solid per unit time per unit volume. T=T( x , y , z , t) is the resulting three dimensional time dependent temperature distribution in the material , t is the time , T0 is the initial temperature , x , y , z are the Cartesian coordinates. For certain application (the present work) it can be assumed that k (T) and c (T) do not change dramatically with temperature, so they can be assumed constant for a particular time interval. For the present work the transient heat transfer analysis is considered along transverse section as shown in Fig.3.
4. Initial and Boundary Conditions At time t=0 the work pieces are at room temperatures. At
time t>0 the following boundary conditions are applied. On the top surface we use a Gaussian heat flux input and the heat loss from all the surfaces of the two sheets are considered. The heat flux input on the top surface of the work piece is given by
Q(r) = , (2)
where q(r) is heat flux at top ,η is energy transfer ( absorptivity), rq is radius of the laser beam and r is the radial distance from the beam center . The absorptivity at temperature below the boiling point of steel was set to 50% for high laser powers and 30% for low laser powers [10]. The convective heat loss of the surfaces of the workpieces due to the external – flow condition can be expressed [11].
Qc = As h (T – Tamb), (3)
where Q convective heat flux , h convective heat transfer coefficient , T temperature of the work piece , Tamb ambient temperature. The heat flux caused by radiation Qr is
Qr = ε σ ( T4 – T4amb) , (4)
where ε is the emissivity of the material , and σ is the Stefan- Boltzmann constant . Radiation heat loss from surface surround by air occurs parallel to convection heat loss between the surface and the air. Thus the total heat transfer is determined by adding the contributions of both heat transfer mechanisms ( h combined= h rad + h conv )].
Q total = h combined As( T – T amb) , (5)
Element Steel
302
Steel
1008
C 0.16 0.06
Si 0.25 0.00
Mn 0.71 0.25
P 0.00 0.01
S 0.00 0.02
Cr 18.77 0.01
Ni 9.67 0.02
Ti 0.68 0.00
Fe Ball Ball
Steel
1008
Steel
1008
Steel
1008
59.5 59.5 59.5
481 481 481
0.17 0.17 0.17
7870 7870 7870
1565 1565 1565
13.8*10-6 13.8*10-
6 13.8*10-
6
8

5. Computational Investigation for Temperature Distribution in Pulsed Laser Spot Welding
The computational modeling in the present work, based on a two-dimensional axisymmetric analysis of heat flow during pulsed laser spot welding of stainless steel to low carbon steel, in order to predict the transient temperature distribution and melt pool dimensions. Figure.3 shows the geometrical considerations for the present simulation. The model is built using ANSYS FLUENT 6.3
Fig.3: Geometry of the present simulation
Software, where almost all the environments simulated to be similar to the experimental environments. To model the results, the analyzed section as shown in Fig.3 is finely meshed into a division of 0.03mm along the thickness and the width directions. A triangular pave type element is used. The time of the transient analysis includes the time of heating during single pulse and the subsequent cooling stage. The implicit formulation analysis is carried out through a number of small time steps, each time step being 0.0005 s , were increase in time step will lead to increase in truncation /computational error .Within each time step a number of iterations (20 iteration) is preformed to converge the analysis. The material physical properties used in the calculations are independent of temperature. Figure 4 shows the considered positions for the analyzed section where the zero position in the radial direction (r) indicates the centerline of the weld, and the zero position in the normalized axial direction (y) represents the bottom surface of the workpiece.
Fig. 4: Considered positions of the analyzed section
6. RESULTS AND DISCUSSION The major investigation for the present work is to obtain the
weld pool dimensions as well as geometry as they all might affect the strength, function and lifetime of the welded parts. After evaluating the joint strength by tensile shear test, the welding conditions experiments and tensile shear test results were presented in Tab.3. It can be seen from this table that the conditions of experiment No.12 have the maximum value for the shear force 167N than the other experiments conditions and this due to the high energy level 48J and low pulse repetition rate of 1.5 Hz which is sufficient for full penetration (keyhole welding) of thin sheets dissimilar material [9]. In other welding experiments no complete penetration depth were achieved because no enough energy were provided to melt the two sheets of material in a lap joint , and at these low energy levels
the melted zone were insufficient (small) in order to bond the welded partners [2].
PEAK POWER EFFECT: After fixing the best welding
conditions( experiment No.12) , which has the max shear force in tensile shear test ,the effect of peak power on joint strength and weld bead dimensions was investigated ,where four levels of peak power Pp namely 5 , 5.5 , 6.5 , and 7 kW respectively at constant pulse energy [ Ep= Pp × tp =48J ] i.e. pulse durations tp of 9.6 ,8.7 ,7.3 and 6.8 ms respectively, were investigated, while other process parameters such as pulse repetition rate ƒ of 1.5 Hz and average power of 74 W, were fixed. The experiments conditions and results of tensile shear test are tabulated in Tab.4. As shown in this table the conditions of experiment B , Pp = 5.5 kW ,tp =8.7 ms have the maximum shear force of 300N, than the other experiments conditions, and this is due to a good matching between the laser parameters (peak power and pulse duration), for the same energy and a good coupling (suitable value of intensity) of laser beam ,which is necessary to get efficient welding process.Fig.5shows the relation between experimentally measured peak load(shear force) versus peak power, in this experimental process beam peak power of 5.5 kW was found out to be the best welding condition. A polynomial fitting was got to find the relation ship between peak load and laser beam peak power as follows:
F= - 85 * P2 + 1e+3 * P – 2.8e+3
Where F is the peak shear force in (N) and P is the peak power in (kW). Fig. 6 shows the optical images of the cross section of the laser welded parts for the experiments A, B, C, and D respectively. As can be seen from this figure that the welding experiment B has a uniform weld pool, also there is a small dip at the top surface of the stainless steel sheet, due to evaporation process that occurred, which results in dispassion of amount of laser beam intensity, creates the uniform weld pool.
Higher peak intensity and increasing coupling is accompanied by an increase in porosity and reduction in weld quality as in cases of experiments C and E where the peak powers 6.5,7 kW respectively
Tab.3: The welding conditions experiments and tensile shear testing results
Experim
ent N
o.
Average
Power(W
)
Frequency (H
z)
Pulse Energy(J)
Pulse Duration
(ms)
Peak Power
(kW)
Shear Force (N
)
Tim
e On (s)
1 92 20 3.3 1.5 2 0 1
2 92 14 6.6 1.5 4 98 1
3 89 9 9.9 1.5 6 57 1
4 91 17 5 2.5 2 50 1
5 84 8 10.6 2.5 4 95 1
6 80 5 15 2.5 6 100 1
7 93 9 10.3 5 2 70 1
8 82 4 20.6 5 4 98 1
9 92 3 30 5 6 120 1
10 82 5 16.3 8 2 67 1
11 82 2.5 32.6 8 4 91 1
12 74 1.5 48 8 6 167 1
9
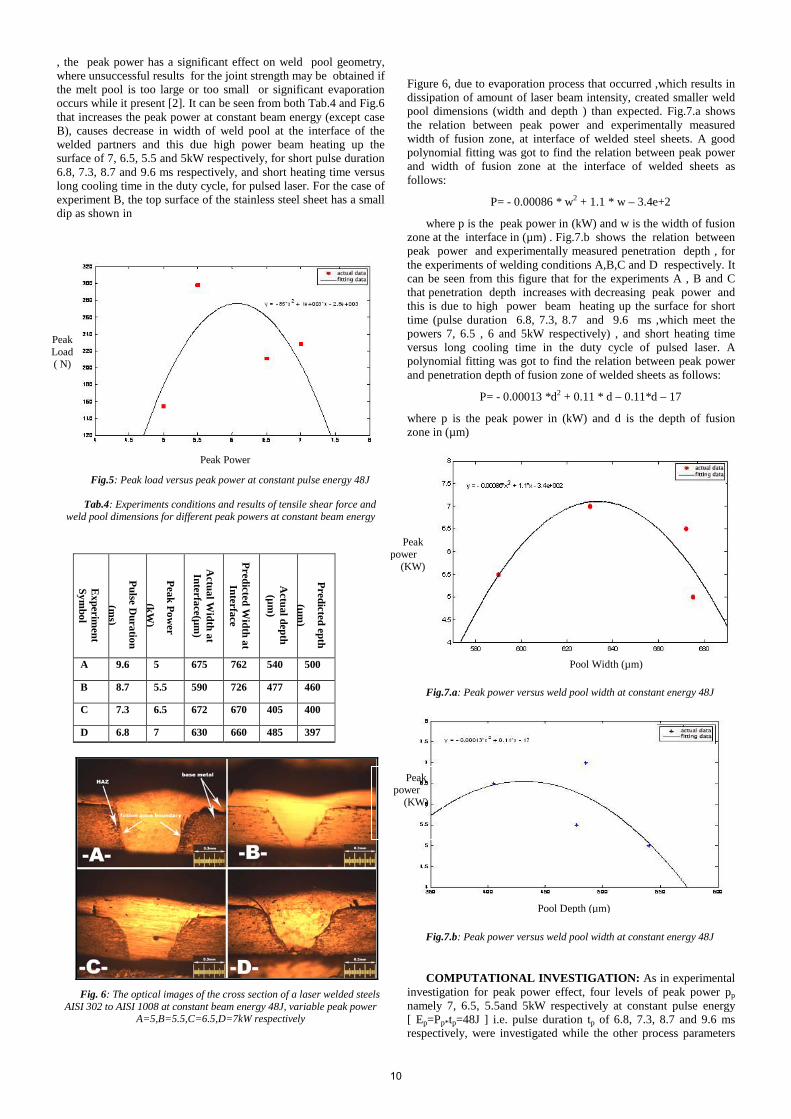
, the peak power has a significant effect on weld pool geometry, where unsuccessful results for the joint strength may be obtained if the melt pool is too large or too small or significant evaporation occurs while it present [2]. It can be seen from both Tab.4 and Fig.6 that increases the peak power at constant beam energy (except case B), causes decrease in width of weld pool at the interface of the welded partners and this due high power beam heating up the surface of 7, 6.5, 5.5 and 5kW respectively, for short pulse duration 6.8, 7.3, 8.7 and 9.6 ms respectively, and short heating time versus long cooling time in the duty cycle, for pulsed laser. For the case of experiment B, the top surface of the stainless steel sheet has a small dip as shown in
Fig.5: Peak load versus peak power at constant pulse energy 48J
Tab.4: Experiments conditions and results of tensile shear force and weld pool dimensions for different peak powers at constant beam energy
Fig. 6: The optical images of the cross section of a laser welded steels AISI 302 to AISI 1008 at constant beam energy 48J, variable peak power
A=5,B=5.5,C=6.5,D=7kW respectively
Figure 6, due to evaporation process that occurred ,which results in dissipation of amount of laser beam intensity, created smaller weld pool dimensions (width and depth ) than expected. Fig.7.a shows the relation between peak power and experimentally measured width of fusion zone, at interface of welded steel sheets. A good polynomial fitting was got to find the relation between peak power and width of fusion zone at the interface of welded sheets as follows:
P= - 0.00086 * w2 + 1.1 * w – 3.4e+2
where p is the peak power in (kW) and w is the width of fusion zone at the interface in (µm) . Fig.7.b shows the relation between peak power and experimentally measured penetration depth , for the experiments of welding conditions A,B,C and D respectively. It can be seen from this figure that for the experiments A , B and C that penetration depth increases with decreasing peak power and this is due to high power beam heating up the surface for short time (pulse duration 6.8, 7.3, 8.7 and 9.6 ms ,which meet the powers 7, 6.5 , 6 and 5kW respectively) , and short heating time versus long cooling time in the duty cycle of pulsed laser. A polynomial fitting was got to find the relation between peak power and penetration depth of fusion zone of welded sheets as follows:
P= - 0.00013 *d2 + 0.11 * d – 0.11*d – 17
where p is the peak power in (kW) and d is the depth of fusion zone in (µm)
Fig.7.a: Peak power versus weld pool width at constant energy 48J
Fig.7.b: Peak power versus weld pool width at constant energy 48J
COMPUTATIONAL INVESTIGATION: As in experimental investigation for peak power effect, four levels of peak power pp namely 7, 6.5, 5.5and 5kW respectively at constant pulse energy [ Ep=Pp*tp=48J ] i.e. pulse duration tp of 6.8, 7.3, 8.7 and 9.6 ms respectively, were investigated while the other process parameters
Experim
ent Sym
bol
Pulse Duration
(ms)
Peak Power
(kW)
Actual W
idth at Interface(µm
)
Predicted Width at
Interface
Actual depth (µm
)
Predicted epth
(µm)
A 9.6 5 675 762 540 500
B 8.7 5.5 590 726 477 460
C 7.3 6.5 672 670 405 400
D 6.8 7 630 660 485 397
Peak Power
Peak Load ( N)
Pool Width (µm)
Peak power
(KW)
Pool Depth (µm)
Peak power
(KW)
10
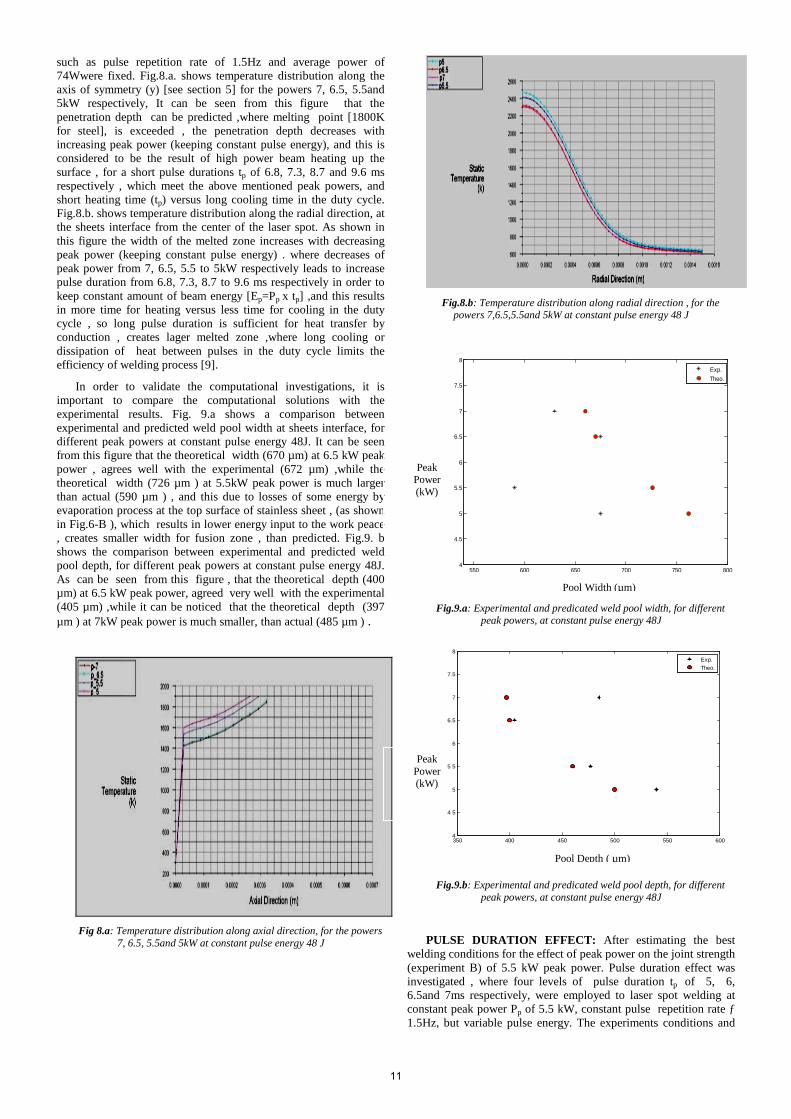
such as pulse repetition rate of 1.5Hz and average power of 74Wwere fixed. Fig.8.a. shows temperature distribution along the axis of symmetry (y) [see section 5] for the powers 7, 6.5, 5.5and 5kW respectively, It can be seen from this figure that the penetration depth can be predicted ,where melting point [1800K for steel], is exceeded , the penetration depth decreases with increasing peak power (keeping constant pulse energy), and this is considered to be the result of high power beam heating up the surface , for a short pulse durations tp of 6.8, 7.3, 8.7 and 9.6 ms respectively , which meet the above mentioned peak powers, and short heating time (tp) versus long cooling time in the duty cycle. Fig.8.b. shows temperature distribution along the radial direction, at the sheets interface from the center of the laser spot. As shown in this figure the width of the melted zone increases with decreasing peak power (keeping constant pulse energy) . where decreases of peak power from 7, 6.5, 5.5 to 5kW respectively leads to increase pulse duration from 6.8, 7.3, 8.7 to 9.6 ms respectively in order to keep constant amount of beam energy [Ep=Pp x tp] ,and this results in more time for heating versus less time for cooling in the duty cycle , so long pulse duration is sufficient for heat transfer by conduction , creates lager melted zone ,where long cooling or dissipation of heat between pulses in the duty cycle limits the efficiency of welding process [9].
In order to validate the computational investigations, it is important to compare the computational solutions with the experimental results. Fig. 9.a shows a comparison between experimental and predicted weld pool width at sheets interface, for different peak powers at constant pulse energy 48J. It can be seen from this figure that the theoretical width (670 µm) at 6.5 kW peak power , agrees well with the experimental (672 µm) ,while the theoretical width (726 µm ) at 5.5kW peak power is much larger than actual (590 µm ) , and this due to losses of some energy by evaporation process at the top surface of stainless sheet , (as shown in Fig.6-B ), which results in lower energy input to the work peace , creates smaller width for fusion zone , than predicted. Fig.9. b shows the comparison between experimental and predicted weld pool depth, for different peak powers at constant pulse energy 48J. As can be seen from this figure , that the theoretical depth (400 µm) at 6.5 kW peak power, agreed very well with the experimental (405 µm) ,while it can be noticed that the theoretical depth (397 µm ) at 7kW peak power is much smaller, than actual (485 µm ) .
Fig 8.a: Temperature distribution along axial direction, for the powers
7, 6.5, 5.5and 5kW at constant pulse energy 48 J
Fig.8.b: Temperature distribution along radial direction , for the
powers 7,6.5,5.5and 5kW at constant pulse energy 48 J
550 600 650 700 750 8004
4.5
5
5.5
6
6.5
7
7.5
8
Exp.Theo.
Fig.9.a: Experimental and predicated weld pool width, for different peak powers, at constant pulse energy 48J
350 400 450 500 550 6004
4.5
5
5.5
6
6.5
7
7.5
8
Exp.Theo.
Fig.9.b: Experimental and predicated weld pool depth, for different peak powers, at constant pulse energy 48J
PULSE DURATION EFFECT: After estimating the best welding conditions for the effect of peak power on the joint strength (experiment B) of 5.5 kW peak power. Pulse duration effect was investigated , where four levels of pulse duration tp of 5, 6, 6.5and 7ms respectively, were employed to laser spot welding at constant peak power Pp of 5.5 kW, constant pulse repetition rate ƒ 1.5Hz, but variable pulse energy. The experiments conditions and
Pool Width (µm)
Peak Power (kW)
Pool Depth ( µm)
Peak Power (kW)
11

results of tensile shear test are tabulated in Tab.5.Fig.8 shows the optical images of the cross section of a laser welded parts for the experiments E, F, G, and H respectively. It can be observed from Tab.5 that the experiment G has the optimum value for pulse duration at constant peak power 5.5kW, which was found equal to 6.5 ms and 37.4J energy, were the stronger joint strength can be obtained of 0.244 kN and this due to formation of a uniform weld region as shown in Fig.10. Any level of pulse duration, less than 6.5ms would not have enough energy to cause a uniform penetration of the weld pool, thus resulting in a weaker joint, while at higher levels of pulse [i.e. higher energy] duration, than best value level 6.5 ms ,were resulting in excessive heating causes burn through of the weld region , causing in a weaker joint strength. As shown in Fig.11 a polynomial fitting was got to find the relation between shear load and laser beam pulse duration, as follows:
F= -21 * t2 + 2.6e+2 * t – 6.1e+2
where F is the peak shear force in (N) and t is the pulse duration in (ms). As can be seen from both Tab.5 and Fig.10
Tab.5: The experiments conditions and results of tensile shear force and weld pool dimensions for different pulse at constant peak power 5.5kW
Fig. 10: The optical images of the cross section of a laser welded steels AISI 302to AISI1008 at constant peak power5.5kW, variable pulse duration
E=5,F=6,G=6.5, H=7ms respectively
Fig.11: Peak load versus pulse duration at constant peak power 5.5kW
that the width of weld pool at sheets interface increases with increasing pulse duration ,were increasing pulse duration at constant peak power results in increasing of energy per pulse of the laser beam, there for effectively causes longer interaction time between the laser beam and the workpeace , leads to larger dimensions (width and depth) for the weld pool. Fig.12.a shows the relation between pulse duration and the experimentally measured width of fusion zone at sheets interface. A good polynomial fitting was fond out to be as follows:
where t is the pulse width in (ms) and w is the width of fusion zone at the interface in (µm)
Fig.12.a: Pulse duration versus weld pool width dimensions at constant peak power5.5kW
Fig.12.b: Pulse duration versus weld pool depth at constant peak power 5.5 kW
t= - 9.1e-5 * w2 + 0.12 * w – 31
Experim
ent Sym
bol
Pulse D
uration
Peak Pow
er
Actual W
idth at Interface(µm
)
Predicted Width at
Interface
Actual depth
(µm)
Predicted depth (µm
)
E 5 5.5 495 422 400 285
F 6 5.5 540 544 490 340
G 6.5 5.5 567 548 480 348
H 7 5.5 660 620 520 365
Shear Force (N)
Pulse Duration (ms)
Pool Width (µm)
Pulse Duration
(ms)
Pool Depth ( µm)
Pulse Duration
(ms)
12
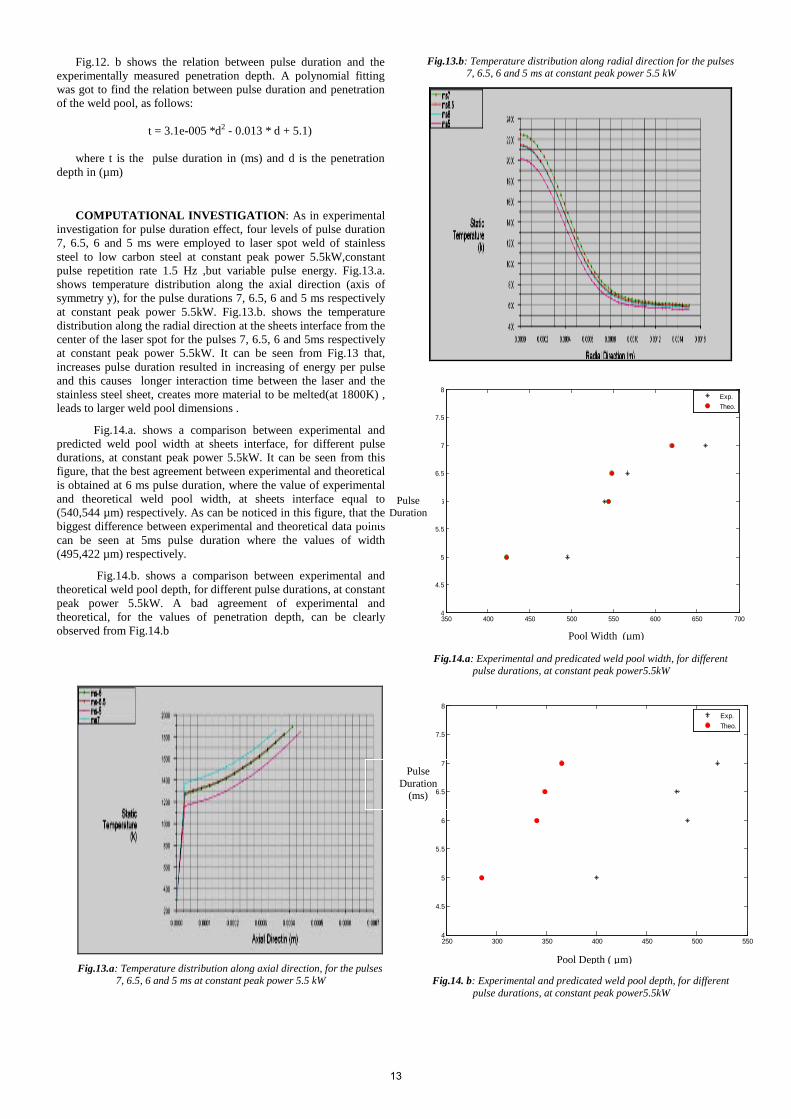
Fig.12. b shows the relation between pulse duration and the experimentally measured penetration depth. A polynomial fitting was got to find the relation between pulse duration and penetration of the weld pool, as follows:
t = 3.1e-005 *d2 - 0.013 * d + 5.1)
where t is the pulse duration in (ms) and d is the penetration
depth in (µm)
COMPUTATIONAL INVESTIGATION: As in experimental investigation for pulse duration effect, four levels of pulse duration 7, 6.5, 6 and 5 ms were employed to laser spot weld of stainless steel to low carbon steel at constant peak power 5.5kW,constant pulse repetition rate 1.5 Hz ,but variable pulse energy. Fig.13.a. shows temperature distribution along the axial direction (axis of symmetry y), for the pulse durations 7, 6.5, 6 and 5 ms respectively at constant peak power 5.5kW. Fig.13.b. shows the temperature distribution along the radial direction at the sheets interface from the center of the laser spot for the pulses 7, 6.5, 6 and 5ms respectively at constant peak power 5.5kW. It can be seen from Fig.13 that, increases pulse duration resulted in increasing of energy per pulse and this causes longer interaction time between the laser and the stainless steel sheet, creates more material to be melted(at 1800K) , leads to larger weld pool dimensions .
Fig.14.a. shows a comparison between experimental and predicted weld pool width at sheets interface, for different pulse durations, at constant peak power 5.5kW. It can be seen from this figure, that the best agreement between experimental and theoretical is obtained at 6 ms pulse duration, where the value of experimental and theoretical weld pool width, at sheets interface equal to (540,544 µm) respectively. As can be noticed in this figure, that the biggest difference between experimental and theoretical data points can be seen at 5ms pulse duration where the values of width (495,422 µm) respectively.
Fig.14.b. shows a comparison between experimental and theoretical weld pool depth, for different pulse durations, at constant peak power 5.5kW. A bad agreement of experimental and theoretical, for the values of penetration depth, can be clearly observed from Fig.14.b
Fig.13.a: Temperature distribution along axial direction, for the pulses
7, 6.5, 6 and 5 ms at constant peak power 5.5 kW
Fig.13.b: Temperature distribution along radial direction for the pulses 7, 6.5, 6 and 5 ms at constant peak power 5.5 kW
350 400 450 500 550 600 650 7004
4.5
5
5.5
6
6.5
7
7.5
8
Exp.Theo.
Fig.14.a: Experimental and predicated weld pool width, for different pulse durations, at constant peak power5.5kW
250 300 350 400 450 500 5504
4.5
5
5.5
6
6.5
7
7.5
8
Exp.Theo.
Fig.14. b: Experimental and predicated weld pool depth, for different
pulse durations, at constant peak power5.5kW
Pulse Duration
Pool Width (µm)
Pulse Duration
(ms)
Pool Depth ( µm)
13

7. Summaries Based on the experimental results , computational results and
discussion the following points can be concluded: 1. Laser welding is a very successful process for joining
dissimilar metals such as stainless steel AISI 302, to low carbon steel AISI 1008
2. The joint strength of the welded partners is highly depending on the weld pool geometry. Formation of a uniform weld pool geometry leads to better joint strength.
3. The strength of the welded joints was larger, than the strength of the base metals. For the effect of peak power, at constant pulse energy (48J) , the best welding condition for maximum shear load 300N,was found to be 5.5 kW peak power. For the effect of pulse duration, at constant peak power 5.5 kW, the best welding condition for maximum shear load 244 N, was found to be 6.5 ms pulse duration (37.4J energy).
4. In spite of some simplifying assumptions, the present model agreed well with experimental, in most situations where the transient temperature distribution and weld bead dimensions, for the welding process can be predicted.
References [1] D.L. Olson; T.A. Siewert; S. Liu; G.R. Edwards ASM. Welding Brazing and Soldering.Vol.6, (1993). [2] WEI Han. Computational and Experimental Investigations of Laser Drilling and Welding for Microelectronic Packaging. Ph. D. Thesis, Worcester Polytechnic Institute, (2004). [3] W. W. Duley. Laser Welding. John Wiley & Sons Inc, (1999), pp. 116-135. [4] JOSE Roberto Berretta; WANGER de Rossi; MAURICIO David; MARTINS das Nevens; IVAN Alves de Almeida ; NILSON Dias Vieira Junior. Pulsed Nd:YAG Laser Welding of AISI 304 to AISI 420 Stainless Steels. Optics and Lasers in Engineering [J] 45 (2007) 960–966.
[5] EZZEDDIN Mohamed Hassan. Feasibility and Optimization of Dissimilar Laser Welding Components. Ph.D. Thesis, Dublin City University, (2008).
[6] DAUNT Irodachescu; MIHAELA Irodachescu ; ELENA Scutelnicn; MANUEL Blasco; JOSE Luis Ocana. Peculiarities of Black and White Welded Joint of Thin Sheets. Proceedings of the 1st International Conference on Manufacturing Engineering, Quality and Production Systems (volume 1) ISSN: 1790-2769, ISBN: 978-960-474-121-
[7] JOHN C. Ion. Laser Processing of Engineering Materials. First Published, Elsevier Butterworth Heinemann, 2005, pp.155-156. [8] M.J. Torkamany; S. Tahamtan; J. Sabbaghzadeh. Dissimilar Welding of Carbon Steel to 574 Aluminum Alloy by Nd:YAG Pulsed Laser. Materials and Design [J] 31, (2010) 458- 465. [9] JOHN F. Ready; DAVE F. Farson. LIA Handbook of Laser Materials Processing. Laser Institute Of America, United States of America, 2001, pp.354 – 357, 387 - 393. [10] A. De; S. K. Marti; C. A. Walsh; H. K. D. H. Bhadeshia. Finite element Simulation of Laser Spot Welding. Science and Technology of Welding and Joining J, 2003 Vol. 8 No.5. [11] YUNUS A. Cengel. Heat transfer: a practical approach. 2nd edition, Mc Grow hell Inc, 2002, pp. 129 – 131.
14


![CD/CDX - EBARA7 CD_CDX 50Hz MATERIALS TABLE Ref. Name Material 1 Casing AISI 304 / AISI 316 [5] 24 Priming plug AISI 303 / AISI 316 [5] 3 Motor bracket Aluminium 25 Drain plug AISI](https://static.fdocuments.in/doc/165x107/6103836052038a666e315b88/cdcdx-7-cdcdx-50hz-materials-table-ref-name-material-1-casing-aisi-304-aisi.jpg)

