Computació i Sistemes Intelligents Part III: Machine Learningcsi/slides/1intro.pdf ·...
38
Computació i Sistemes Intel·ligents Part III: Machine Learning Marta Arias Dept. CS, UPC Fall 2018
Transcript of Computació i Sistemes Intelligents Part III: Machine Learningcsi/slides/1intro.pdf ·...

Computació i Sistemes Intel·ligentsPart III: Machine Learning
Marta Arias
Dept. CS, UPC
Fall 2018

Website
Please go to http://www.cs.upc.edu/~csi for all course’smaterial, schedule, lab work, etc.
Announcements through https://raco.fib.upc.edu

Class logistics
I 4 theory classes on Mondays:I 12, 19, 26 of Nov., 3 Dec.
I 4 laboratory classes on Fridays:I 16, 30 of Nov., 14, 21 of Dec.
I 1 exam (tipo test): Monday Dec. 17th, in classI 1 project (due after Christmas break, date TBD)

LabEnvironment for practical work
We will use python3 and jupyter and the following libraries:I pandas, numpy, scipy, scikit-learn, seaborn, matplotlib
During the first session we will cover how to install these incase you use your laptop. Libraries are already installed in theschools’ computers.

... so, let’s get started!

What is Machine Learning?An example: digit recognition
Input: image e.g.
Output: corresponding class label [0..9]
I Very hard to program yourselfI Easy to assing labels

What is Machine Learning?An example: flower classification (the famous “iris” dataset)
Sepal.Length Sepal.Width Petal.Length Petal.Width Species5.1 3.5 1.4 0.2 setosa4.7 3.2 1.3 0.2 setosa7.0 3.2 4.7 1.4 versicolor6.1 2.8 4.0 1.3 versicolor6.3 3.3 6.0 2.5 virginica7.2 3.0 5.8 1.6 virginica5.7 2.8 4.1 1.3 ?

What is Machine Learning?An example: predicting housing prices (regression)

Is Machine Learning useful?
Applications of ML
I Web searchI Computational biologyI FinanceI E-commerce (recommender
systems)I RoboticsI Autonomous drivingI Fraud detection
I Information extractionI Social networksI DebuggingI Face recognitionI Credit risk assessmentI Medical diagnosisI ... etc
About this courseA gentle introduction to the world of ML
This course will teach you:I Basic into concepts and intuitions on MLI To apply off-the-shelf ML methods to solve different kinds
of prediction problemsI How to use various python tools and libraries
This course will *not*:I Cover the underlying theory of the methods usedI Cover many existing algorithms, in particular will not
cover neural networks or deep learning

Types of Machine Learning
I Supervised learning:I regression, classification
I Unsupervised learning:I clustering, dimensionality reduction, association rule
mining, outlier detectionI Reinforcement learning:
I learning to act in an environment

Supervised learning in a nutshellTypical “batch” supervised machine learning problem..
Prediction rule = model

Try it!Examples are animals
I positive training examples: bat, leopard, zebra, mouseI negative training examples: ant, dolphin, sea lion, shark,
chicken
Come up with a classification rule, and predict the “class” of:tiger, tuna.

Unsupervised learningClustering, association rule mining, dimensionality reduction, outlier detection

ML in practiceActually, there is much more to it ..
I Understand the domain, prior knowledge, goalsI Data gathering, integration, selection, cleaning,
pre-processingI Create models from data (machine learning)I Interpret resultsI Consolidate and deploy discovered knowledgeI ... start again!

ML in practiceActually, there is much more to it ..
I Understand the domain, prior knowledge, goalsI Data gathering, integration, selection, cleaning,
pre-processingI Create models from data (machine learning)I Interpret resultsI Consolidate and deploy discovered knowledgeI ... start again!

Representing objectsFeatures or attributes, and target values
Typical representation for supervised machine learning:
Sepal.Length Sepal.Width Petal.Length Petal.Width Species1 5.1 3.5 1.4 0.2 setosa2 4.7 3.2 1.3 0.2 setosa3 7.0 3.2 4.7 1.4 versicolor4 6.1 2.8 4.0 1.3 versicolor5 6.3 3.3 6.0 2.5 virginica6 7.2 3.0 5.8 1.6 virginica
I Features or attributes: sepal length, sepal width, petallength, petal width
I Target value (class): species
Main objective in classification: predict class from featuresvalues

Some basic terminology
The following are terms that should be clear:I datasetI featuresI target values (for classification)I example, labelled example (a.k.a. sample, datapoint, etc.)I classI model (hypothesis)I learning, training, fittingI classifierI prediction

Today we will cover decision trees and the nearest neighborsalgorithm

Decision Tree: Hypothesis SpaceA function for classification
Sepal.Length Sepal.Width Petal.Length Petal.Width Species1 5.1 3.5 1.4 0.2 setosa2 4.7 3.2 1.3 0.2 setosa3 7.0 3.2 4.7 1.4 versicolor4 6.1 2.8 4.0 1.3 versicolor5 6.3 3.3 6.0 2.5 virginica6 7.2 3.0 5.8 1.6 virginica7 5.7 2.8 4.1 1.3 ?

Decision Tree: Hypothesis SpaceA function for classification
Sepal.Length Sepal.Width Petal.Length Petal.Width Species1 5.1 3.5 1.4 0.2 setosa2 4.7 3.2 1.3 0.2 setosa3 7.0 3.2 4.7 1.4 versicolor4 6.1 2.8 4.0 1.3 versicolor5 6.3 3.3 6.0 2.5 virginica6 7.2 3.0 5.8 1.6 virginica7 5.7 2.8 4.1 1.3 ?
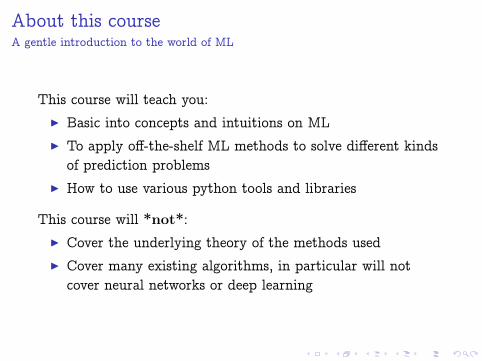
Decision Tree: Hypothesis SpaceA function for classification
x1 x2 x3 x4 class1 high 1 c good 02 high 0 d bad 03 high 0 c good 14 low 1 c bad 15 low 1 e good 16 low 1 d good 0
Exercise: Count many classification errors each tree makes.

Decision Tree Decision Boundary
Decision trees divide the feature space into axis-parallelrectangles and label each rectangle with one of the classes.

The greedy algorithm for boolean features
GrowTree(S)if y = 0 for all (x, y) ∈ S then
return new leaf (0)else if y = 1 for all (x, y) ∈ S then
return new leaf (1)else
choose best attribute xjS0 ← all (x, y) with xj = 0S1 ← all (x, y) with xj = 1return new node(GrowTree(S0),GrowTree(S1))
end if

The greedy algorithm for boolean features
GrowTree(S)if y = 0 for all (x, y) ∈ S then
return new leaf (0)else if y = 1 for all (x, y) ∈ S then
return new leaf (1)else
choose best attribute xjS0 ← all (x, y) with xj = 0S1 ← all (x, y) with xj = 1return new node(GrowTree(S0),GrowTree(S1))
end if

What about attributes that are non-boolean?
Multi-class categorical attributesIn the examples we have seen cases with categorical (a.k.a.discrete) attributes, in this case we can chose to
I Do a multiway split (like in the examples), orI Test single category against othersI Group categories into two disjoint subsets
Numerical attributes
I Consider thresholds using observed values, and splitaccordingly

The problem of overfitting
I Define training error of tree T as the number of mistakeswe make on the training set
I Define test error of tree T as the number of mistakes ourmodel makes on examples it has not seen during training
Overfitting happens when our model has very small trainingerror, but very large test error

Overfitting in decision tree learning

Avoiding overfitting
Main idea: prefer smaller trees over long, complicated ones.Two strategies
I Stop growing tree when split is not statistically significantI Grow full tree, and then post-prune it

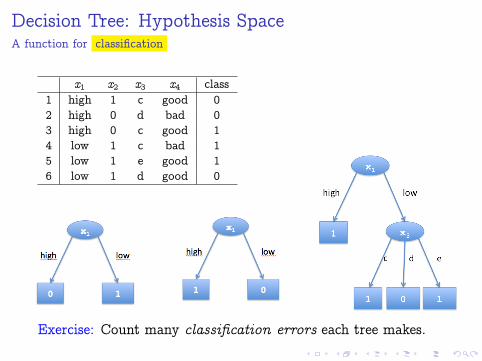
Reduced-error pruning
1. Split data into disjoint training and validation set2. Repeat until no further improvement of validation error
I Evaluate validation error of removing each node in treeI Remove node that minimizes validation error the most
Pruning and effect on train and test error

Nearest Neighbor
I k -NN, parameter k is number of neighbors to considerI prediction is based on majority vote of k closest neighbors

How to find “nearest neighbors”Distance measures
Numeric attributes
I Euclidean, Manhattan, Ln -norm
Ln(x1,x2) = n
√√√√dim∑i=1
∣∣x1i − x2
i
∣∣nI Normalized by range, or standard deviation
Categorical attributes
I Hamming/overlap distanceI Value Difference Measure
δ(vali , valj ) =∑
c∈classes
∣∣P(c|vali ) − P(c|valj )∣∣n

Decision boundary for 1-NNVoronoi diagram
I Let S be a training set of examplesI The Voronoi cell of x ∈ S is the set of points in space
that are closer to x than to any other point in SI The Region of class C is the union of Voronoi cells of
points with class C
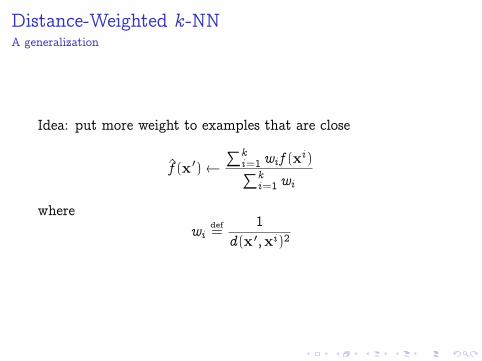
Distance-Weighted k -NNA generalization
Idea: put more weight to examples that are close
f̂ (x ′)← ∑ki=1 wi f (xi )∑k
i=1 wi
wherewi
def=
1d(x ′,xi )2

Avoiding overfitting
I Set k to appropriate valueI Remove noisy examples
I E.g., remove x if all k nearest neighbors are of different class
I Construct and use prototypes as training examples

What k is best?
This is a hard question ... how would you do it?
I Typically, we need to “evaluate” classifiers, namely, howwell they make predictions on unseen data
I One possibility is by splitting available data into training(70%) and test (30%) – of course there are other ways
I Then, check how well different options work on the test set
... more on this this Friday in the lab session!

What k is best?
This is a hard question ... how would you do it?I Typically, we need to “evaluate” classifiers, namely, how
well they make predictions on unseen dataI One possibility is by splitting available data into training
(70%) and test (30%) – of course there are other waysI Then, check how well different options work on the test set
... more on this this Friday in the lab session!


![Untitled-1 [] I Ill Il I I I I I I I I I I I I I I I I I I I I I I I I I I I I I I I I I I I I I I I I Ill I . Title: Untitled-1 Author: admin Created Date: 6/17/2013 5:18:51 PM](https://static.fdocuments.in/doc/165x107/5aae5d277f8b9a59478bf97f/untitled-1-i-ill-il-i-i-i-i-i-i-i-i-i-i-i-i-i-i-i-i-i-i-i-i-i-i-i-i-i-i-i-i.jpg)