Compressive strength of steel columns incased in brick...
20
RP520 COMPRESSIVE STRENGTH OF STEEL COLUMNS INCASED IN BRICK WALLS By Albert L. Harris, A. H. Stang, and J. W. McBurney ABSTRACT Three H-shaped steel columns, 23 feet long, 6 inches in depth., weighing 20 pounds per foot, and having fiat ends, were tested in compression. Six similar columns, incased in brick walls 14 inches thick, 6 feet long, and carried up to about 8 inches from the top of the columns, were also tested in compression. The six incased columns were divided into two groups of three each depending on the orientation of the steel column in the brick wall. Compressometer and deflection measurements were made on all columns. The incased columns were much stronger than the bare specimens. The increase in strength may arise from two different causes. The load may be partially transferred from the steel to the incasement by the bond between them. Added strength from this cause might be expected in columns of any length. Long columns when laterally unrestrained fail by bending at loads much smaller than the yield strength of the steel. Incasement of long columns would act as a continuous lateral restraint which might be sufficient to prevent the lateral bending and cause the columns to fail in the same manner as short columns at much higher loads. The compressometer readings over a 150-inch gage length centered at mid- height showed that the steel in the incased columns was stressed, on the average, less than 20 per cent as much as was the steel in the bare columns for the same load. The lateral deflection of the incased columns was very small and the brick- work was not appreciably affected by the tests. CONTENTS Page I. Introduction 123 1. Purpose. 123 2. Acknowledgments 124 II. The specimens lL 'lJ III. Testing procedure J 2 ? 1. The bare and the incased columns 127 2. Auxiliary tests ]-' s (a) The steel coupons '- s (6) The short lengths of steel columns (c) The bricks } 2 g (d) The mortar IV. Results and discussion of the tests 1. Auxiliary tests r, . 2. The bare and the incased columns Jji V. Conclusions tM I. INTRODUCTION 1. PURPOSE The engineer department, Government of the District of Columbia. Washington, D. C, requested the Bureau of Standards to test 9 steel columns, 3 bare and 6 incased in brick walls, to determine the relata \ e 123
Transcript of Compressive strength of steel columns incased in brick...

RP520
COMPRESSIVE STRENGTH OF STEEL COLUMNSINCASED IN BRICK WALLS
By Albert L. Harris, A. H. Stang, and J. W. McBurney
ABSTRACT
Three H-shaped steel columns, 23 feet long, 6 inches in depth., weighing 20pounds per foot, and having fiat ends, were tested in compression. Six similarcolumns, incased in brick walls 14 inches thick, 6 feet long, and carried up toabout 8 inches from the top of the columns, were also tested in compression. Thesix incased columns were divided into two groups of three each depending on theorientation of the steel column in the brick wall.
Compressometer and deflection measurements were made on all columns.The incased columns were much stronger than the bare specimens. The
increase in strength may arise from two different causes. The load may bepartially transferred from the steel to the incasement by the bond between them.Added strength from this cause might be expected in columns of any length.
Long columns when laterally unrestrained fail by bending at loads much smallerthan the yield strength of the steel. Incasement of long columns would act as
a continuous lateral restraint which might be sufficient to prevent the lateral
bending and cause the columns to fail in the same manner as short columns at
much higher loads.
The compressometer readings over a 150-inch gage length centered at mid-height showed that the steel in the incased columns was stressed, on the average,
less than 20 per cent as much as was the steel in the bare columns for the sameload. The lateral deflection of the incased columns was very small and the brick-
work was not appreciably affected by the tests.
CONTENTSPage
I. Introduction 123
1. Purpose. 123
2. Acknowledgments 124
II. The specimens lL'lJ
III. Testing procedureJ
2?
1. The bare and the incased columns 127
2. Auxiliary tests ]-'s
(a) The steel coupons '- s
(6) The short lengths of steel columns
(c) The bricks}2g
(d) The mortarIV. Results and discussion of the tests
1. Auxiliary tests r,
.
2. The bare and the incased columns Jji
V. Conclusions tM
I. INTRODUCTION
1. PURPOSE
The engineer department, Government of the District of Columbia.
Washington, D. C, requested the Bureau of Standards to test 9 steel
columns, 3 bare and 6 incased in brick walls, to determine the relata \ e
123

124 Bureau of Standards Journal of Research [vol. w
strengths of the bare and the incased columns. The purpose of the
tests was to determine whether for design purposes, the strength of
steel columns incased in brick walls should be calculated by consider-
ing them as long, bare columns which would fail by bending at lowloads or whether the brick walls could be relied upon to restrain the
lateral bending and enable them to carry the higher loads whichshort columns of the same material would carry.
2. ACKNOWLEDGMENTS
The incasement for the steel columns was designed by Albert L.
Harris, municipal architect, and H. H. Marsh, chief of the structural
division, engineer department, Government of the District of Colum-bia. The steel columns were donated by the Bethlehem Steel Co.The cost of incasing the columns in brick walls was borne by theWashington division, Common Brick Manufacturers' Association of
America, Jordan A. Pugh, district manager.The tests of the columns were made in the engineering mechanics
section, of the Bureau of Standards, under the direction of H. L.
Whittemore.II. THE SPECIMENS
The nine steel columns were 6-inch, 20-pound Bethlehem H-sections. The nominal dimensions and section properties of thesteel columns are given in Table 1. The ends of each column weremachined with a face mill to give a nominal column length of 23 feet.
After the columns were tested, a short length of each steel column wasweighed and the length measured. The cross-sectional area of this
short length was computed on the assumption that 1 cubic inch of
steel weighs 0.283 pound. %This value was taken as the cross-sec-
tional area of the steel column.
Table 1.
—
Nominal dimensions and sectional properties of the steel columns
Weight per foot pounds. _ 20Depth inches.- 6. 00Flange width do__ 6. 00Web thickness _' inch__ . 25Area square inches.- 5. 89Least moment of inertia, centroidal axis parallel to web in. 4 __ 13. 5Least radius of gyration, centroidal axis parallel to web inch__ 1. 51Greatest moment of inertia, centroidal axis perpendicular to web in. 4 __ 39. 2Greatest radius of gyration, centroidal axis perpendicular to web_-_inch__ 2. 58Length feet__ 23Slenderness ratio 183
The steel columns which were tested without the brick incasementwere designated as columns 1,2, and 3.
Six of the steel columns were incased in brick walls as shown inFigures 1 and 2. The nominal dimensions of the walls were as fol-
lows: Thickness 14 inches, length 6 feet, and height 22 feet 4 inches.Previous tests on sturdy columns of this length indicated that these
incased columns might be compressed 6 inches before the maximumcompressive strength was obtained. The distance between the topof the wall and the upper end of the steel column was about 8 inchesto allow the maximum load on the steel column to be determinedbefore the upper platen of the testing machine came into contact withthe top of the wall. This unincased length of the steel columns above

Harris, Slang]McBurney J
Strength of Steel Columns Incased in Brick Walls 125
the walls was greater than would be likely to occur in an actual struc-
ture. The actual unincased lengths and the heights of the walls are
given in Table 5. The unincased lengths varied from 7 1. to 1 1 incl
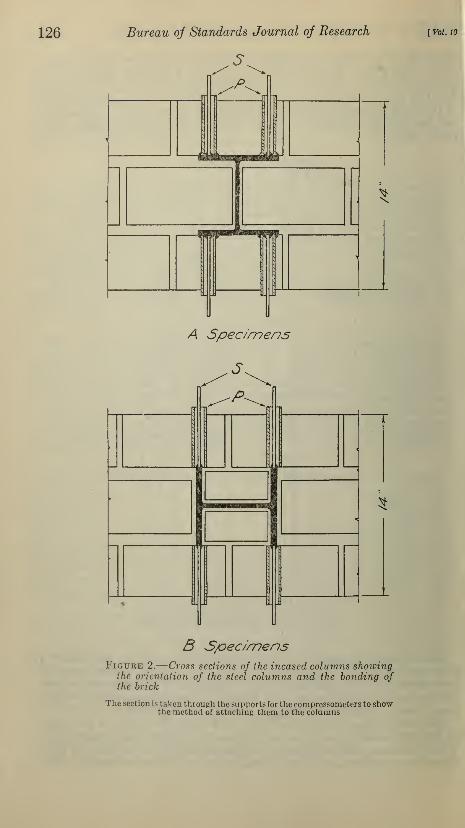
For the three incased columns, designated Al, A2, and A3, the wehof the steel column was perpendicular to the face (length) of the wall;
and for the three designated as Bl, B2, and B3, it was parallel to the
face. (Fig. 2.)
UL n
I
ti
*
.
i
r-H
r
n
n
\r u
Figure 1.
—
Incased columns showing nom-
inal dimensions and the apparatus for
measuring the compression and lateral
deflection
The bricks were made in Virginia from surface claj by thei
semidry
press process. The mortar was composed of 1 part of PortlandIcem
to 3 narts of damp sand, by volume. Hydrated lime w as add* I equal
to 10Ppcr clt o7
Pthe cement, by weight The proportions by weight
were 1 part cement, 0.1 part lime to 2.34 V^Mj^d.th ,,„,„.
The steel columns were secured in a vertical position on tne nooi
of the laboratory and plumbed before the brick w,dls,
were bun
The bricks were laid on smooth horizontal mortar beds and^^
th 1
.
shoved vertical joints. Every fifth course was a header course.
126 Bureau oj Standards Journal oj Research
s
[ Vol. 10
B SpecimensFigure 2.
—
Cross sections of the incased colunms showingthe orientation oj the steel columns and the bonding ofthe brick
The section is taken through the supports for the compressometers to showthe method of attaching them to the columns

B. S. Journal of Research. RP520
Figure 3. Incased specimens during construction
A, The lifting plates: I',, the compressometer supports

R. S. Journal cf Research, RP520
Fiai hi: I. Incased column Hi in the testing machimbefore test

m3&%SV8
\ Strength of Steel Columns Incased in Brick \ \ 'alls \ 27
bricks were carefully fitted between the flanges of the Bteel columns,and the spaces between the bricks and the column were grouted withthe mortar mixed with additional water.The incased columns during construction are shown in Figiu
The steel plates, shown at A, were bolted to (he sled column about10 feet from the top. They projected from the face of the wall asshown in Figure 4 and were used to lift the incased columns from (hefloor and place them in the testing machine. The incased columnswere tested about 30 days after the completion of the walls.
III. TESTING PROCEDURE1. THE BARE AND THE INCASED COLUMNS
All the columns were tested as flat-end columns in a vertical,hydraulic testing machine having a capacity of 10,000,000 pound-.Steel plates, 8 inches square and one-half inch thick, were placedbetween each end of the columns and the platens of the testingmachine. For the incased columns, therefore, there was a ^-incnspace between the bottom of the brick wall and the lower platen.This space was filled with a mixture of plaster of Paris and water, theplaster being allowed to harden before the loads were applied.
The shortening of the columns under load was measured with fourcompressometers having a gage length of 12 feet 6 inches. The rodsof the compressometers actuated dial micrometers graduated to 0.001
inch. Readings were estimated to one-tenth of a division. On the
bare columns the middle of the gage length was at the middle of the
column. The compressometers were attached by studs screwed into
the outside surfaces of the flanges, one near each edge. On the
incased columns (fig. 1) they were attached to rod supports weldedto the flanges, as shown at S, Figure 2, and B, Figure 3. Pieces of
pipe surrounded the rods and were welded to the flanges, as shown at
P, Figure 2, so that the compressometer supports were not in contact
with the brickwork. After the column had been set in place and the
compressometers attached, the lower platen of the testing machinewas adjusted in its spherical seat until, at low loads, the compress-
ometer differences for the bare columns were all within 10 per cent of
the average compression. For the incased column Al, these differ-
ences were 32 per cent. For the other incased columns, they did not
exceed 16 per cent.
The lateral deflections of the columns at midheight were measured
by the taut-wire mirror-scale method. The scales were graduated
to 0.1 inch and readings were estimated to one-tenth division.
On the bare columns three wires were used. They were attached
6 inches from each end of the column by studs screwed into the
middle of each flange and the middle of one side of the web. On the
incased columns (fig. 1), two wires were used, attached 12 inches from
the top and bottom of the wall to steel supports built into the wall.
148938—33 9

128 Bureau of Standards Journal of Research [ vol. w
2. AUXILIARY TESTS
(a) THE STEEL COUPONS
As large differences were to be expected between the strength of the
bare and the incased columns, it was not felt necessary to test as
many coupons as would be required in the case of column tests plannedto determine small differences in column strength caused by differ-
ences in construction. 1 Only two coupons were, therefore, taken fromeach steel column. Since no extra lengths of the columns were fur-
nished, one coupon was cut from the flange and the other from the
web of the column, after test, the portion being used which was con-sidered to have been subjected to the lowest stress during the columntests. The coupons from the bare column were cut from the region
of the contraflexure and those from the incased columns from thelower end. They were A.S.T.M. type specimens having a gage lengthof 8 inches and a reduced width of 1% inches. They were tested in ascrew-power, beam-and-poise testing machine having a capacity of
100,000 pounds. The yield point was obtained from the "drop of
the beam" of the testing machine.
(b) THE SHORT LENGTHS OF STEEL COLUMNS
Lengths equal to the unincased length of the columns were cut fromeach of the incased columns after test. These short lengths were cutfrom the lower end next to the lengths from which the coupons weretaken. The ends were milled perpendicular to the axis of the sections
and the maximum compressive strength determined by loading thembetween hardened steel plates in a screw-power, beam-and-poise test-
ing machine having a capacity of 600,000 pounds. The compressivestrengths were computed by dividing the maximum load by the com-puted cross-sectional area of the steel column from which the lengthwas cut.
(c) THE BRICKS
Twenty-five bricks were selected at random and tested in accord-ance with Federal specification No.504 for brick, clay, common.
(d) THE MORTAR
Each working day a sample of the mortar was taken and the flowvalue determined in accordance with paragraphs F-3g(3) a and b of
Federal specification No. SS-C-181 for cement, masonry. Six cylin-
drical specimens (diameter 2 inches, length 4 inches) were made fromeach sample. Three of these cylinders were stored in water and thecompressive strength determined after 28 days. The other threecylinders were stored in air in the laboratory and the compressivestrength determined on the day the incased column which they repre-sented was tested.
1 L. B. Tnekerman and A. H. Stang, Tests of Large Columns with H-Shaped Sections, B. S. Tech.Paper No. 328, Oct. 20, 1926.

Harris, StanglMcBurney J
Strength of Steel Columns Incased in Brick Walls 129
IV. RESULTS AND DISCUSSION OF THE TESTS1. AUXILIARY TESTS
The results of the tensile tests of the steel coupons are given inTable 2. The average values for each group of columns do not showany important differences in the properties of the steel in the steelcolumns. The tensile strength of some of the steel coupons was lessthan the minimum value specified in A. S. T. M. standard specifica-tion for structural steel for buildings, designation A&-29,
Table 2.
—
Properties of steel coupons
Specimen
Thick-ness
Yieldpoint
Tensilestrength
Elonga-
From column
—
Cut from
—
tion in 8inches
1 FlangeInch0.340.278
Lbs./in.i
38,30047,200
Lbsjin.i54,60056,700
Per cent
31.22ft 1
1 Web .
42,800 55, 600 30.3
Flange. .350.278
2 45,30049,700
54.20058,900
34 52 — - Web 30 9
47,500 56,600 32 7
Flange .350.277
3 . 37,00047,100
53,90054,400
30.53 Web... 34.2
42,000 54,200 32.4
Flange.. . .332.275
Al --- .- 40.20042,000
54,80055,500
33.9
Al Web 30.8
41, 1Q0 55,200 32.4
.348
.280A2 38, 600
39, 40055,20055,100
33.1
A2 Web 3'-'.
39, 000 55, 200 32.6
.345
.283A3 39,100
41, 100
54,90055,000
31.7
A3 Web 32.5
Average 40.100 55,000 - 32.1
Bl .375.285
39,60038,500
55,00054,500
29.2
Bl__ Web... -- — 30.7
Average 39,000 54,800 30.0
B2 .393.286
39,70043,200
54,50057,400
33.0
Web - - 23.0
41,400 56,000 28.0
B3 .351.280
39,40041,600
55,60056, GOOB3_— -- — Web 35.8
Average 40,500 56,100 32.8
Average values:44,10040,10040,300
55. 400
55,600\1 A2 A3 - -- - 82. :*
. —
130 Bureau of Standards Journal of Research [ Vol. w
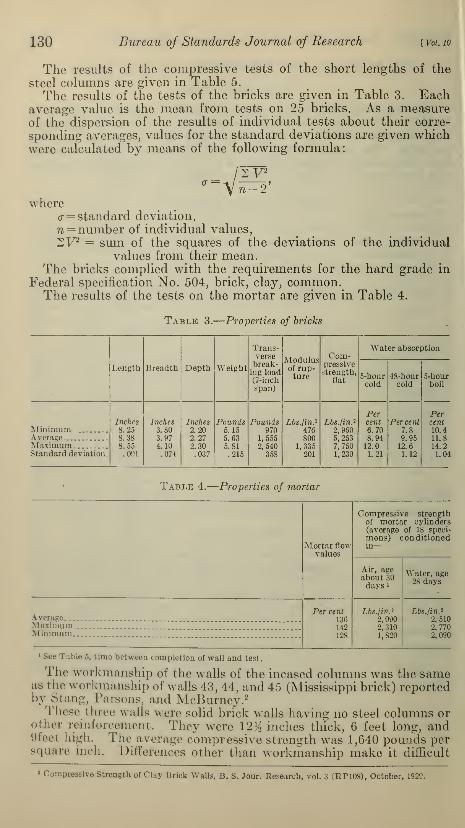
The results of the compressive tests of the short lengths of the
steel columns are given in Table 5.
The results of the tests of the bricks are given in Table 3. Eachaverage value is the mean from tests on 25 bricks. As a measureof the dispersion of the results of individual tests about their corre-
sponding averages, values for the standard deviations are given whichwere calculated by means of the following formula:
/2F
where<r= standard deviation,
n = number of individual values,
2V2 = sum of the squares of the deviations of the individual
values from their mean.The bricks complied with the requirements for the hard grade in
Federal specification No. 504, brick, clay, common.The results of the tests on the mortar are given in Table 4.
Table 3.-—Properties of bricks
Length Breadth Depth Weight
Trans-versebreak-ing load(7-inch
span)
Modulusof rup-ture
Com-pressivestrength,
flat
Water absorption
5-hourcold
48-hourcold
5-hourboil
MinimumInches8.258.388.55
. 091
Inches3.803.974.10.074
Inches2.202.272.30.037
Pounds5.155.635.81.215
Pounds970
1, 5552,540
358
L6s./in. 2
476800
1,335201
Lbs./inl2,9605, 2537,7501,230
Percent6.708.9412.01.21
Per cent
7.89.9512.61.12
Percent
10.4Average 11.8Maximum 14.2Standard deviation. 1.04
Table 4.
—
Properties of mortar
Mortar flow-
values
Compressive strengthof mortar cylinders(average of 18 speci-
mens) conditionedin-
Air, ageabout 30days *
Water, age2Sdays
AveragePer cent
136
142128
Lbs./in.*
2,0902,3101,820
Lbs./in.*
2.5102,770Maximum
Minimum 2,090
1 See Table 5, time between completion of wall and test.
The workmanship of the walls of the incased columns was the sameas the workmanship of walls 43, 44, and 45 (Mississippi brick) reportedbyStang, Parsons, and McBurney. 2
These three \\ .ills were solid brick walls having no steel columns orother reinforcement. They were 12^ inches thick, 6 feet long, and9feef high. The average compressive strength was 1,640 pounds perBquare inch. Differences other than workmanship make it difficult
» Compressive Strength of Clay Brick Walls, B. S. Jour. Research, vol. 3 (RP10S), October, 1029.

Harris, Slang]McBurney \
Strength of Steel Columns Incased in Brick Walls i:;i
to estimate the strength of the brick masonry of the incased columns.These differences are: First, although the modulus of rupture of theVirginia brick used for the incased columns was almost the sam<that of the Mississippi brick, the compressive strength (fl.il
) of theMississippi brick (3,410 pounds per square inch) was much lowerthan that of the Virginia brick (5,253 pounds per square inch ) ; second,the absorption of the Mississippi brick was about twice that of theVirginia brick; and third, the shape and surfaces of the Mississippibrick were much more uniform than those of the Virginia brick.
2. THE BARE AND THE INCASED COLUMNS
The results of the tests of the bare and of the incased columns are
given in Table 5. Stress-strain diagrams were drawn for each columnusing the average strain computed from the compressometer readii
The stress for both the bare and the incased columns was obtainedby dividing the load by the computed cross-sectional area of the
steel columns. Due to the fact that a portion of the load was carried
by the brick walls of the incased columns, the actual stress in the
steel within the compressometer gage length was much lower thanthe values used in plotting the diagrams. The average stress-strain
diagrams for the three bare columns, for the three A incased columns,
and for the three B incased columns were also drawn. The diagramsfor the columns are shown in Figures 5, 6, and 7. The average stress-
strain diagrams are shown in Figure 8.
Table 5.
—
Results of compressive tests of the columns and of auxiliary short lengths
Condition
Com-putedarea of
steel
olumn
Unin-casedlengthof steel
columnand of
theshortlength
Heightof wall
Timebe- !
tween
Compressivestrength
Load carried by
Column
com-ple-
tionof
wallsandtest
Yieldpoint of
couponColumn Short
lengthSteel
columnBrick-
wall
1 Bare...do—do
Squareinches5.905.905.85
Inches Ft. In. Days Lb».IIn*42,80047,50042,000
Lbs./in.i
23,90023,00023,100
Lbs./in.'
Percent
100100100
Percent
zS~.~.~'~'--~~-~-
Average.. 44,100 23,300 100
Al Incased.
.
...do
...do
5.856.025.98
7M7H
11
22 4H22 4H22 1
2S31
30
41,100
40,100
40,00041,50040,700
41,200 1817
19
82
A2A3
8381
Average.. 30 40,100 40,700 40,900 18 82
Bl Incased.....do...do
0.036.146.10
10
8m22 2
22 4
22 Wi
2931
31
39,00041,40040,500
38,80042, 100
41,100
40,60041,60042,200
16
16
84
84B2B3
30 40,300 40,700 41,400 17 83
All the stress-strain curves are nearly straight. The slope of the
straight lines shown on each diagram is the average ratio of stress
to strain for that series of observed values. These average ratios
are given in Table 6.

132 Bureau of Standards Journal of Research [stang°'McBwney]
25 000
-J I— 0.000!
Compressive Strain - in. per in.
Figure 5.
—
Stress-strain diagrams of the bare columns
40000
35000
H- 0.0001
Compressive Strain -in. per in.
Figure 6.
—
Stress-strain diagrams of the incased columns,group A, in which the web of the column was perpendic-ular to the length of the wall

40000
35000
H~ 0.0001
Compressive Strain- in. per in.
Figure 7.
—
Stress-strain diagrams of the incased columns,group B, in which the web of the column was parallelto the length of the wall
40000
35000
30000
cr 25000
20000
.6i
g 15000
?n ioooo
5000
i
<
5g
&191-6- - fljjj/?
/y
—^- — 0. D00I
Compresswe Strain -in.per in.
Figure 8.
—
Average stress-strain diagrams for the columns
133

134 Bureau oj Standards Journal of Research
Table 6.
—
The ratios of stress to strain for the columns
[Vol. 10
Column Average ratio
stress to strain
1
Lbs./m.230, 800, 00030, 700, 00029, 600, 000
2 .
3
30, 400, 000
Al 170, 800, 000179, 200, 000154, 200, 000
A2A3
Average __*. -- 168, 100, 000
Bl 191, 500, 000154, 200, 000182, 400, 000
B2B3 .
176, 000, 000
The stress-deflection diagrams for the bare columns are shown in
Figure 9. There was no measurable deflection up to a stress of
Col. No. 1 2 3
Web Flange Web Flange Web Flange25000
C 20000
1 5000i-0)
_Q I0000 <>
I
*/)
CO
(a
5000
-A 0.1
Lateral deflection -inchesFigure 9.
—
Stress-deflection diagrams of the bare columns
about 10,000 lbs. /in.2
. For higher stresses the deflection in theplane of the web of the H section was negligible, but the deflection atmidlength in a plane perpendicular to the web increased more andmore rapidly until the maximum load was reached. There were nosigns of secondary failure such as buckling of the flanges or webs.Tnese curves are typical of those for columns which fail by deflecting
Laterally.
The stress-deflection curves for the A incased columns are shown in
Figure 10 and those for the B incased columns in Figure 11. Therewas do measurable deflection in the plane of the side (face) of thewalls and very little deflection in the plane of the end of the walls.
These curves are typical of stress-deflection curves for short, sturdy

Harris, Stang~\
McBvrney JStrength of Steel Columns Incased in Brick Walls 135
Sr^SShse? before the mnximum -*»*• Bto-^When discussing the strength of steel columns it is convenienl touse the column -efficiency.- This term is defined by W C MPettingilP as the ratio of the column strength (average mariniumcompressive stress) to the compressive yield point of the materia]When comparing the efficiencies of columns it has been found satis:
lactory to use the tensile yield point of the material which is obtained
Col. No. A1
Side find
40000
A2Side End
A3Side End
Figure 10.
—J 0.1 h-
Lateral deflection -inches
-Stress-deflection diagrams of the incasedcolumns, Group A
in routine tests instead of the compressive yield point. The samemethod of determining the yield point should, of course, be usedwhen comparisons of this sort are made.The efficiencies of the columns and of the short lengths reported in
this paper are given in Table 7. The yield point was taken as theaverage of the yield points of the flange and web coupons withoutconsidering the weighting; that is, the proportion of the total cross
section represented by each coupon.
3 R. V. Southwell, The Strength of Struts, Aircraft Engineering, vol. 1, pp. 13G-138, 1920. Also seefootnote 1, p. 128, and refer to pages 36 and 37 of that reference.

136 Bureau of Standards Journal of Research
Table 7.
—
Efficiencies of the columns and of the short lengths
[ Vol. 10
Column
Columnefficiencyof bareand in-
casedcolumns
Columnefficiencyof shortlengths
1 0.559.484.550
23 -_
Al.A2.A3.
Bl.B2.B3.
Average .531
.9731.0641.015
1.002' 1. 108.955
1.017 1.022
.9951.017L015
1.0411.0021.042
Average 1.009 1.028
For the short lengths, in which lateral buckling did not appreciablyaffect the strength, the efficiencies are very nearly 1.00. As the
Col. No. b\
Side End
40000
B2Side End
S3Side End
-I 0.1 kLateral deflect ion -inches
Figure 11.
—
Stress-deflection diagrams of the incasedcolumns, Group B
slenderness ratio increases, the effect of lateral buckling graduallylowers the efficiency. For low-carbon structural steel columnshaving slenderness ratios greater than about 95 for " round end"

B. S journal of Research. RP520
Figure 12.— The top of column Al after test
Note the buckling of the unincased length of the column at A and the crack between the brickwythes at B.

B. S. Journal of Research. RP520
'"• l '''• L3. .In incased column being removed from thetesting machine after test
No bricks fell from the wall when it was laid horizontally on the Hour.

McBurmT9] Strength of Steel Columns Incased in Brick Walls 137
columns or greater than about 190 for "fixed end" columns, thefailure is almost entirely flexural (Eulcr failure) and the strengthdepends almost entirely upon Young's modulus of elasticity of thematerial, the end conditions, and the slenderness ratio. "
All theefficiencies of the incased columns and of the short lengths cut fromthe steel columns are of the order of magnitude (approximately 1.00)to be expected for "round end" steel columns having slendernessratios less than 30 or for " fixed end" steel columns having slendernessratios less than 60. All the efficiencies of the bare columns arc of theorder of magnitude (approximately 0.50) to be expected for "roundend" steel columns having slenderness ratios of about 110 or for"fixed end" steel columns having slenderness ratios of about 220. 4
The many tests which have been made on columns indicate that a"flat end" column and a "round end" column having about 0.6the length may be expected to support the same maximum load.*This fraction of the length (0.6) may vary somewhat, dependingupon the distribution of the load over the end of the columns andother conditions which affect the degree of end restraint.
The bare columns having a slenderness ratio of 183 and "flat ends"probably would have about the same efficiency as a "round end"column having a slenderness ratio of about 110.
All of the incased columns failed by yielding, followed by local
buckling of the unincased portion of the steel columns. The lateral
deflection of the brick walls under the maximum load did not exceed0.03 inch for any of the incased columns. The brick walls, therefore,
restrained the steel columns and prevented failure by lateral buckling.
The only failure in the brick walls was at the top where small cracks
appeared between the brick wythes, apparently caused by the local
buckling of the unincased portion of the steel column. The buckling
of the unincased portion of the steel columns is shown in Figure 12
at A, and the cracks in the vertical mortar joints at B. One of the
incased columns after test (weight 19,000 pounds) is shown in Figure
13. The fact that all the incased columns could be handled in this
way by the overhead crane without any indication of failure in the
brick walls is evidence that the brick walls were not appreciably
affected by the loads applied during the tests.
For the bare columns the entire load was carried by the steel.
The average ratio of stress to strain for these columns, Table 6, is
therefore, the average compressive modulus of elasticity of the steel
in the bare columns. The values are as close to the usual value
(30,000,000 lbs./in.2) for mild steel as was to be expected from tests
made with these specimens and apparatus.
For the incased columns in the 150-inch gage length a portion of
the load was transferred to the brick walls by the bond between the
walls and the steel. On the assumption that the average compressive
modulus of the steel in the incased columns was 30,000,000 lbs./in.2
,
30,000,000 divided by the computed ratio of stress to strain gives the
portion of the applied load which was carried by the steel column.
The remainder of the load was carried by the brick wall. These
values are given in Table 5. The average load in the steel over the
4 See footnote 1, p. 128, and refer to Fig. 13, p. 43, of that reference.
* Columns, Salmon, pp. 171-174.

138 Bureau of Standards Journal of Research [voi.io
150-inch gage length in no case exceeded 20 per cent of the applied
load.
The values given in Table 5 show, also, that the orientation of the
steel column in the brick wall had no appreciable effect upon the
strength of the incased columns.From the fact that the steel in the incased columns carried only a
small proportion of the load, it is evident that a more comprehensiveinvestigation should be made in an attempt to develop a load-carrying
structure which would also serve to inclose the building. There is
apparently no reason why the load cannot be economically applied
directly to the top of a brick wall of suitable material and workman-ship. The steel in the incased columns undoubtedly served to rein-
force the brick masonry, but the question arises whether a number of
vertical steel bars of small diameter placed near both faces of the wall
would not have provided much greater restraint against lateral buck-ling of the brick wall and at the same time reduced the cost. Theresults of further investigations are needed to give a definite answerto this question. Attention should also be given to developingmethods for tying the structure supported by the brick wall into thetop of the wall so that they will act as a unit under any forces whichare likely to come upon them.These results show that the compressive strength of long steel col-
umns, incased as these were in brick walls, is much greater than if thecolumns are not incased, but they do not indicate the final solution of
the problem of using brick masonry and steel to build more safely andmore economically.
V. CONCLUSIONS
Three H-shaped steel columns, 23 feet long, 6 inches in depth,weighing 20 pounds per foot, and having flat ends, were tested in
compression. Six similar steel columns incased in brick walls, 14inches thick, 6 feet long, and extending up to about 8 inches from thetop of the steel columns were also tested in compression.With steel columns of this size, incased in brick walls of the quality
used:1. The brick walls effectively prevented lateral buckling of the
steel column so that the maximum compressive load for the structurewas, for all practical purposes, the maximum compressive load for theportion of the steel column above the wall, which in turn was, for all
practical purposes, the tensile yield point of the steel multiplied bythe cross-sectional area of the steel column.
2. The maximum compressive load carried by the short unincasedportion of the steel columns was much greater than the maximumcompressive load carried by the long unincased columns (slendernessratio of 1S3) which failed by lateral budding.
3. The lateral deflection of the incased columns was negligiblebecause in no case did it exceed 0.03 inch under the maximum load.The brick masonry showed only small cracks at the top near the steelcolumns.
4. Over the gage length of 150 inches at midheight of the incasedcolumns, the steel curried, on the average, less than 20 per cent of theapplied Load.
5. The orientation of the steel column with respect to the face ofthe brick wall had no effect upon the strength of the incased columns.
Washington, November 23, 1932.