
Compressed Natural Gas Vehicles - Portland, Oregon
23
Compressed Natural Gas Vehicles Chris Kroeker December 6, 2018
Transcript of Compressed Natural Gas Vehicles - Portland, Oregon

Compressed Natural Gas Vehicles
Chris Kroeker
December 6, 2018

My Background
Photo source Thermo KIng
Photo source Thermo KIng
Photo source Turbosquid

Agenda
CNG
• What is it?
• Current market and outlook
• Emissions Testing*
• Fueling Infrastructure
RNG
• Sources
• Supply Potentials
• Carbon Intensities
• Value Sharing*
Other Fuels
*New developments

Natural Gas as a Transportation Fuel
Compression Vehicle Fueling
Photo source
creative commons
license
Photo source Michigan State University
Photo source Bauer Compressors
Photo source CNG United
Photo source NW Natural
8

Current Market
26 million CNG vehicles, 31,000 fueling stations globally
Region NGVs Stations
Asia-Pacific 18,420,306 18,657
Europe 1,863,167 4,824
North America 205,000 1,923
Latin America 5,621,350 5,480
Africa 256,599 208

Fleet Growth
Currently have about 400 CNG vehicles in Oregon – large growth potential
CNG vehicles worldwide has grown annually at 30% for the past five years, anticipated to grow at a CAGR of 11.9% between 2018 and 2026

Some Local CNG Headlines
UPS added 700 new CNG vehicles in 2018
LA Metro awarded contract for 295 CNG buses in 2017
Pennsylvania building/expanding infrastructure at 29 transit locations to support 1,600 CNG buses state-wide
Houston METRO Celebrates 10 Million Miles of CNG

Some Global Headlines
India unveiled CNG infrastructure plans: 10,000 stations over the next 10 years to help obtain 50% CNG vehicles by 2030
Belgium has 100 CNG stations, projected to be 170 by 2020
900 CNG stations in Germany, 150 more coming in the next 3 years

R/CNG Emissions Testing
UC Riverside recently performed real-life CNG emission testing (April 2018)
Tested Cummins/Westport Low-NOx engine (12 liter, 400hp)
Current EPA/CARB NOx standard is 0.2 g/bhp-hr
The engine averaged between 0.0012 and 0.02 g/bhp-hr (90-99% lower)
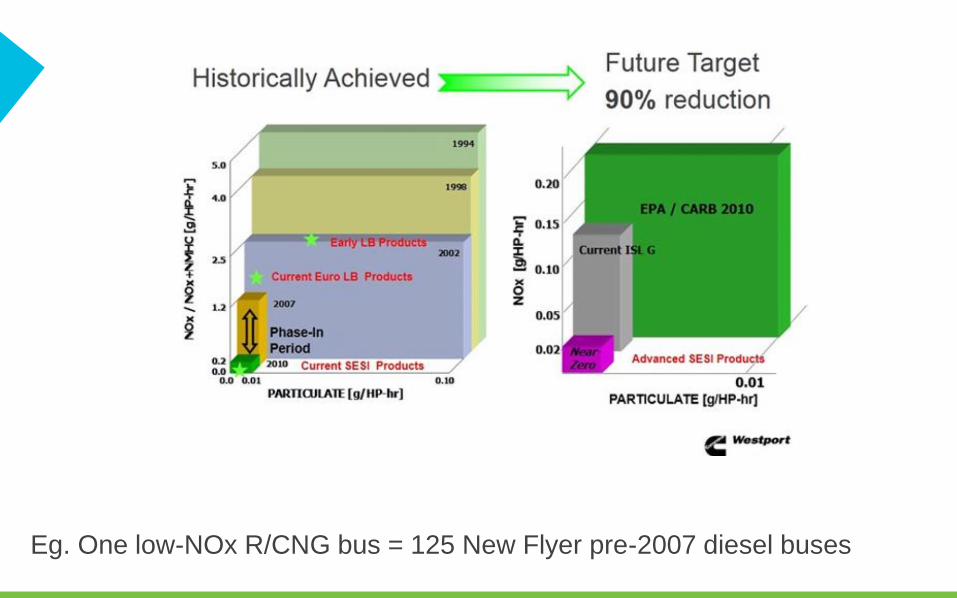
Eg. One low-NOx R/CNG bus = 125 New Flyer pre-2007 diesel buses

CNG Fueling Infrastructure
NW Natural
Private
Public

Swan Island
Approximately 700 trucks in the area
Reached out to all the major fleets
Responses ranged from definitely yes (if a public station were there) to not interested
Partnership with the existing cardlock station could be a possible

Swan Island cont’d
Common themes were cost of trucks, and cost of fueling station (private)
Regions where CNG is successful have significant funding available
NW Natural is exploring funding options that have worked well elsewhere that do not require state funding
Photo source truckinginfo.com
Renewable Natural Gas (RNG)


Annual RNG Technical Potential
Total OR annual natural gas consumption: 236 BCF
Total NWN annual natural gas sales: 69 BCF
(1) “Wood and Agricultural Residues” is defined differently by different studies but generally includes urban waste wood, primary and secondary mill residues, and residues left after logging operations (e.g., trees cut or killed and left on the ground).
It assumes a large amount (35%-50%) is left on the forest floor to “maintain ecological functions.” Sources for data: https://www.nrel.gov/docs/fy14osti/60178.pdf#, NREL Bioenergy Database, U.S. EPA LMOP Database, Oregon DEQ Material
Recovery and Waste Generation Survey, Oregon Department of Agriculture, and Oregon Department of Energy.
3%
10%
10%
3%
74%
Oregon: 48 BCF
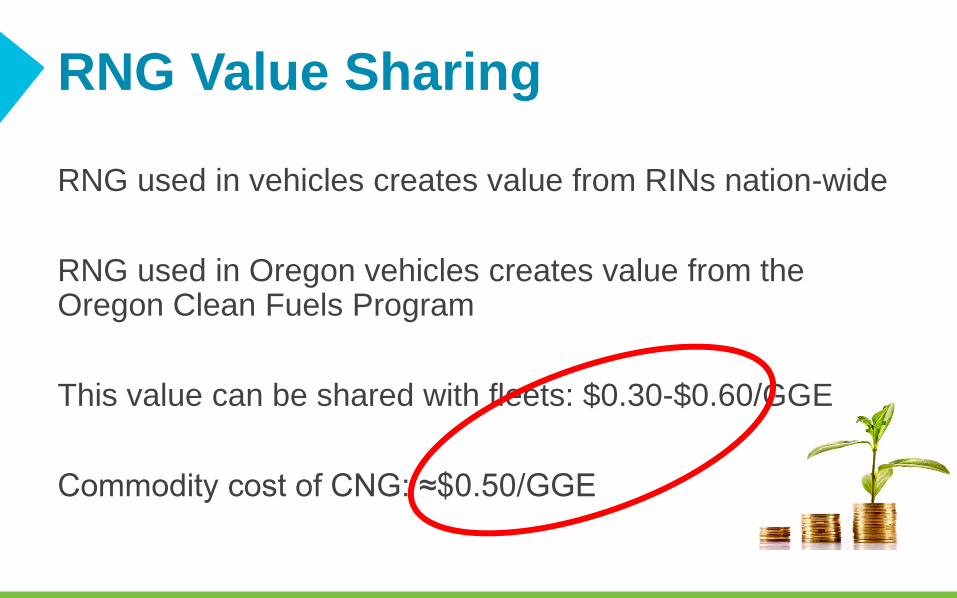
RNG Value Sharing
RNG used in vehicles creates value from RINs nation-wide
RNG used in Oregon vehicles creates value from the Oregon Clean Fuels Program
This value can be shared with fleets: $0.30-$0.60/GGE
Commodity cost of CNG: ≈$0.50/GGE

Other Fuels

Fuel Comparisons
FuelSpecific
Energy
Energy
DensityRange
kWh/kg Wh/L Miles/L
Diesel 13.3 9944 3.9
LNG 14.9 6167 2.4
DME 8.0 5361 2.1
CNG 15.4 2500 1.0
Hydrogen 39 1555 0.6
Battery 0.693 600 0.2Source: Peterbuilt

Carbon Intensities
PathwayCarbon Intensity
[g/MJ]
Energy
Economy Ratio
(EER)
EER Adjusted CI
[g/MJ]Source
Diesel (5% BD) 99.7 1.0 99.7 OR DEQ
CNG - Fossil 79.9 0.9 88.8 OR DEQ
R/CNG - Landfill 50.3 0.9 55.8 OR DEQ
R/CNG - WWTP 43.0 0.9 47.8 CARB
R/CNG - Dairy 13.5 0.9 14.9 OR DEQ
R/CNG - Food Waste -15.3 0.9 -13.8 OR DEQ
Hydrogen - Fossil SMR 120.7 1.9 63.5 OR DEQ
Hydrogen - Landfill SMR 116.8 1.9 61.5 OR DEQ
Hydrogen - Electrolysis (OR
Grid)205.4 1.9 108.1 OR DEQ
Battery Electric (OR Grid) 128.3 5.0 25.7 OR DEQ
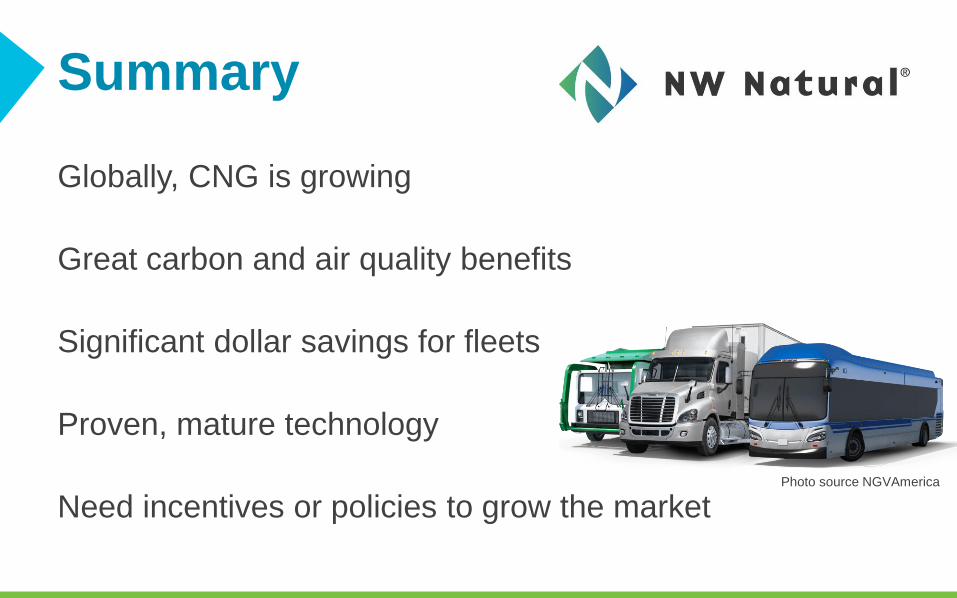
Summary
Globally, CNG is growing
Great carbon and air quality benefits
Significant dollar savings for fleets
Proven, mature technology
Need incentives or policies to grow the marketPhoto source NGVAmerica

Thank you!